Embed Size (px)
Citation preview
PUBLIC SCHOOLS OF NORTH CAROLINA State Board of Education | Department of Public Instruction
F I N A N C I A L A N D B U S I N E S S S E R V I C E S I N T E R N S H I P P R O G R A M
NORTH CAROLINA’S ACADEMICALLY OR INTELLECTUALLY GIFTED CHILDREN:A Look at the Performance & Participation of AIG Students at the LEA-Level
By Christopher A. Cody and J. Eric Moore Project 4.3 / August 2010
POLICY TOPICThe NC Department of Public Instruction’s (DPI) current focus on comprehensive programming for Academically or Intellectually Gifted (AIG) students has highlighted North Carolina’s need to better understand the achievement of students in such programs. In this paper, we will give an overview of AIG guidelines in the state. We will then discuss two research areas that explore methods for comparing AIG programs and examining the performance and participation of the students in the programs.
AIG BACKGROUNDIn the past two decades, the General Assembly and the State Board of Education have increasingly focused their interest in gifted education. In 1993, the General Assembly required a reexamination of state laws, rules and policies for gifted education, which resulted in the 1996 passage of NC General Statute 115C-150.5-8, Article 9B. Article 9B provides a state definition for AIG students, defining them as those who “perform or show the potential to perform at substantially high levels of accomplishment when compared with others of their age, experience, and environment” (N.C. Gen. Stat. §155C-150.5-8, 1996). North Carolina expects AIG students to display “high performance capability in intellectual areas, specific academic fields, or both…” and to “require differentiated educational services outside the areas provided by the typical educational programs” (N.C. Gen. Stat. §155C-150.5-.8, 1996).
Article 9B also requires local education agencies (LEAs) to develop three-year Local Plans for the Education of the Academically/Intellectually Gifted (AIG) Students. In these plans, LEAs are required to address the following components: 1. Identification procedures, 2. Differentiated curriculum, 3. Integrated services, 4. Staff development, 5. Program evaluation methods, and 6. Program accountability.
The NC State Board of Education (SBE) has elaborated these components in its newly adopted guidelines according to nationally-accepted best practices in gifted education. The SBE adopted the NC AIG Program Standards in 2009 to provide guidelines for LEAs to use as they develop their local AIG plan and program. These program standards guide LEAs to develop, coordinate and implement comprehensive AIG programs. However, it is the LEA’s responsibility to delineate the policy for each component. For example, while the state requires each LEA to have a student identification process, the LEA has the freedom to create the selection criteria that defines which student will be identified as AIG. After completion, the LEA’s local board approves the plans and submits them to the SBE for review and comments. The most recent local AIG plans reviewed by the SBE span 2007-2010. However, there are newly developed local AIG plans for 2010-2013, which currently await SBE/DPI review.
2
METHODOLOGYWe based our analysis of AIG student performance on scores from state-mandated tests. This approach allowed us to compare across the state and between AIG and non-AIG students within each LEA. We employed two methods of analysis: 1. Using state test scores to rank AIG populations within
and across LEAs 2. Using a sample of LEAs drawn from the first step to
examine AIG selection inequities
Data • Collected4th-7thGradeMathandReadingEOGScores
and Demographics for the 2008-2009 school year • Cross-referencedcollecteddatawithLEA’sthree-year
(2007-2010) AIG plans
WecollectedMathandReadingEOGscores,gender,ethnicity,and AIG status for all students grades four through seven during the 2008-2009 school year using the First Day of Spring collection code from the ABCTools database.1 This student information was then aggregated with data on disability (from the Comprehensive Exceptional Children Accountability System) and economic disadvantage status (from DPI Accountability database). We aggregated this information 2 into two numbers for each LEA: • ScoringDifferentials–thedifferenceinaveragetest
scores between AIG and non-AIG students • TestScores–theaveragetestscoreforAIGstudents
For simplicity, we chose the four top and four bottom ranking LEAs using each method. We then pulled those LEAs’ three-year plans and examined them for disparities in identification processes and program services. Since the plans’ language appeared to be roughly uniform, we decided to explore components of their identification processes. We compared the local AIG programs’ documented attention to underrepresented populations against the actual 2008-2009 demographics.
Scoring DifferentialS vS teSt ScoreSOurmethodofanalysisusesstatetestscorestodemonstrate two very contrasting ways of evaluating AIG student performance: one focuses on accounting for LEA characteristics (scoring differentials) while the other focuses on statewide comparability (test scores).
Scoring Differentials • ControlsforLEAcharacteristics • OnlyassesseswithinLEA,notacrossLEAs
In order to assess the differential between an LEA’s AIG students and their non-AIG peers, we standardized 3 student test scores according to test and LEA. The standardization indicated where the AIG students’ scores fell in the distribution of the LEA’s population scores. This method allowed for comparison between local AIG and non-AIG populations without needing to account for commonly shared community characteristics. 4
Standardization allowed us to see, across the state, which LEAs had the largest and smallest differentials between their AIG and non-AIG students. 5 The key limitation of
1 These data though more readily accessible are slightly different that the authoritative NC WISE AIG Child Count information2 We averaged the students’ scores according first to grade and then to LEA, resulting in an overall score average for each LEA. This form of unstandardized data
captured the LEA programs that have the highest and lowest average AIG EOG scores. We then examined the average EOG scores in a form of standardization in order to emphasize the differential between AIG students and their non-AIG peers within each LEA.
3 Students’ scores were standardized into z-scores (the score minus the average then divided by the standard deviation). 4 This method also helped to ensure that the scoring differential between gifted and non-gifted students was not due to statistical randomness. 5 This method allowed the differential to be compared between LEAs who did not have the same score distribution. In other words, the differentials in a high-scoring
LEA and a low-scoring LEA could be compared using the same scale even while not being close in the score distributions.

3
standardization was that it did put the high- and low-performing LEAs on the same scale and did not take into account raw performance on state tests.
test Scores • Performancecomparablestatewide • MaynotpinpointlocalAIGprogrameffectiveness
To counter the limitation of standardization, we also ranked LEAs according to the average scores of their gifted students. This method allowed the distinction of the truly “high-performing” gifted students on End-of-Grade tests. However, this model does not pinpoint specific AIG program characteristics; it does not account for the performance of non-AIG students within each LEA. As a result, test score analysis may only have captured the highest- and lowest-performing overall LEAs.
Given the strengths and limitations of the two methods, neither should be used solely to assess AIG student performance; but do add to better understanding AIG student progress and achievement.
FINDINGSOuranalysesledtotwomajorfindings: 1. The number of students identified as AIG as a proportion
of the total population vary greatly between LEAs a. Smaller percentages of identified students are related to: i. Larger average scoring differential ii. Higher average test scores 2. The demographics of AIG cohorts vary greatly from
their populations a. Greater disproportionate demographic representation
(inequity) between the AIG students and their local populations is related to:
i. Larger average scoring differential ii. Higher average test scores
finDing 1 – Percentage of StuDentS iDentifieDSince local districts use different methods for identifying AIG students, the proportions of students identified as gifted out of the total population vary significantly between LEAs. In the LEAs in our evaluation, the percentage of identified students ranged from five percent to 41 percent. 6
Those LEAs that identified fewer of their students as a percentage tended also to have higher AIG scoring differentials and higher test scores. Understandably, the fewer students identified, the less likely the AIG population would resemble theoverallpopulationinperformance.Moreover,thenarrowerthe selection criteria, the more likely the AIG population will include only very high-performing students.
6 The current state average of identified AIG students is approximately 12% of the total student population.
4
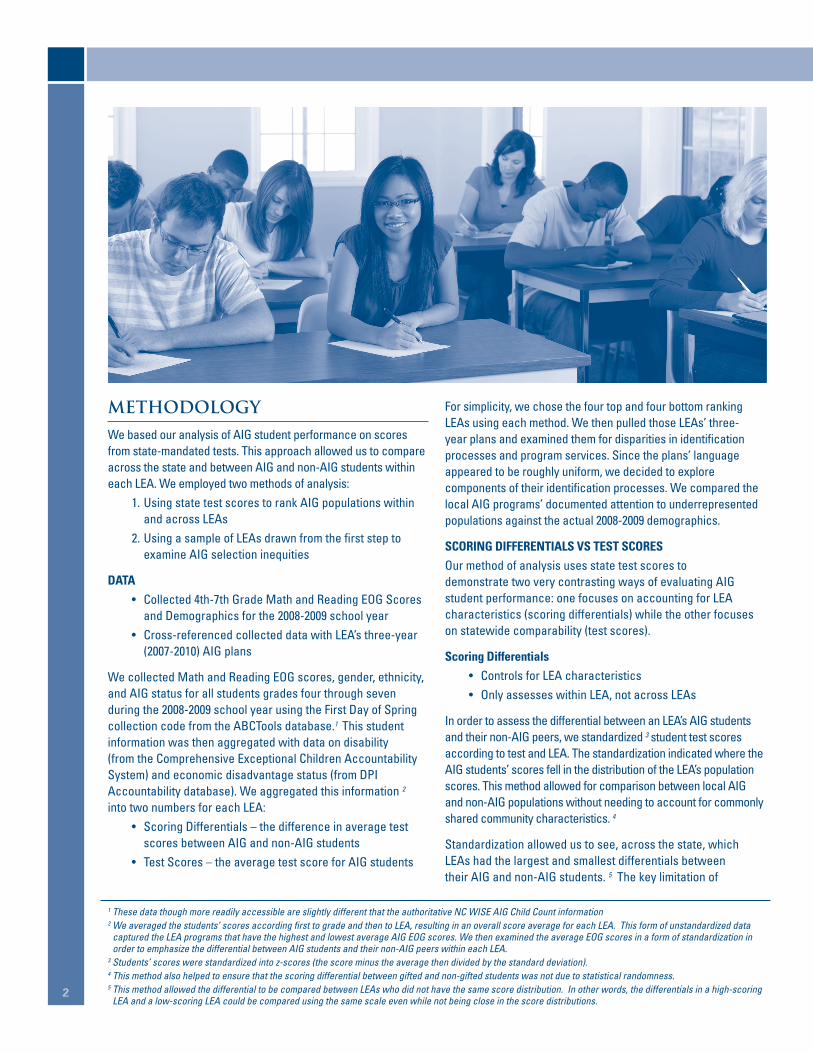
finDing 2 - Selection inequitieSAcross the LEAs in our analysis, students selected for AIG programs do not reflect the demographic diversity of their local populations.
There appeared to be a correlation between higher AIG identification inequities and higher scoring differentials between those students and their non-AIG peers (see trend line in figure 1). This connection suggests that, as an LEA fails to select an AIG cohort representative of its total population, its AIG scores on state tests also decreasingly represent the student body as a whole. Similarly, there appeared to be a link between higher identification inequities and higher average AIG scores (see figure 2 trend line).
Two graphs follow figure 1. figure 1a depicts the LEA with the smallest scoring differential; it compares the demographic breakdown for those students identified as AIG against the total population. Positive values indicate the percentage-points of over-representation, and negative values show the percentage-points of under-representation. A value of zero percentage-points indicates that sub-group to be exactly in
proportion to its representation in the total population. For instance, white students are over-represented by about 15 percentage points while economically disadvantaged students are under-represented by about 20 percentage points. figure 1b shows the same information for the LEA with the largest scoring differential.
-40
-20
0
20
40
Perc
enta
ge P
oint
s o
ff of
Prop
ortio
nal r
epre
sent
atio
n
AmericanIndian
Asian
Hispanic Black
White
Multi-Racial
Female
Male
Non-Disabled
Disabled
Non-EconomicallyDisadvantaged
EconomicallyDisadvantaged
figure 1a: Demographic Breakdowns for lea with Smallest Scoring Differential
figure 1B: Demographic Breakdowns for lea with largest Scoring Differential
-40
-20
0
20
40
Perc
enta
ge P
oint
s o
ff of
Prop
ortio
nal r
epre
sent
atio
n
AmericanIndian
AsianHispanic
Black
White
Multi-Racial
Female
Male
Non-Disabled
Disabled
Non-EconomicallyDisadvantaged
EconomicallyDisadvantaged
Scor
ing
Diff
eren
tial
Selection inequity
Figure 1a
Figure 1b
figure 1: Scoring Differential by Selection inequity
5
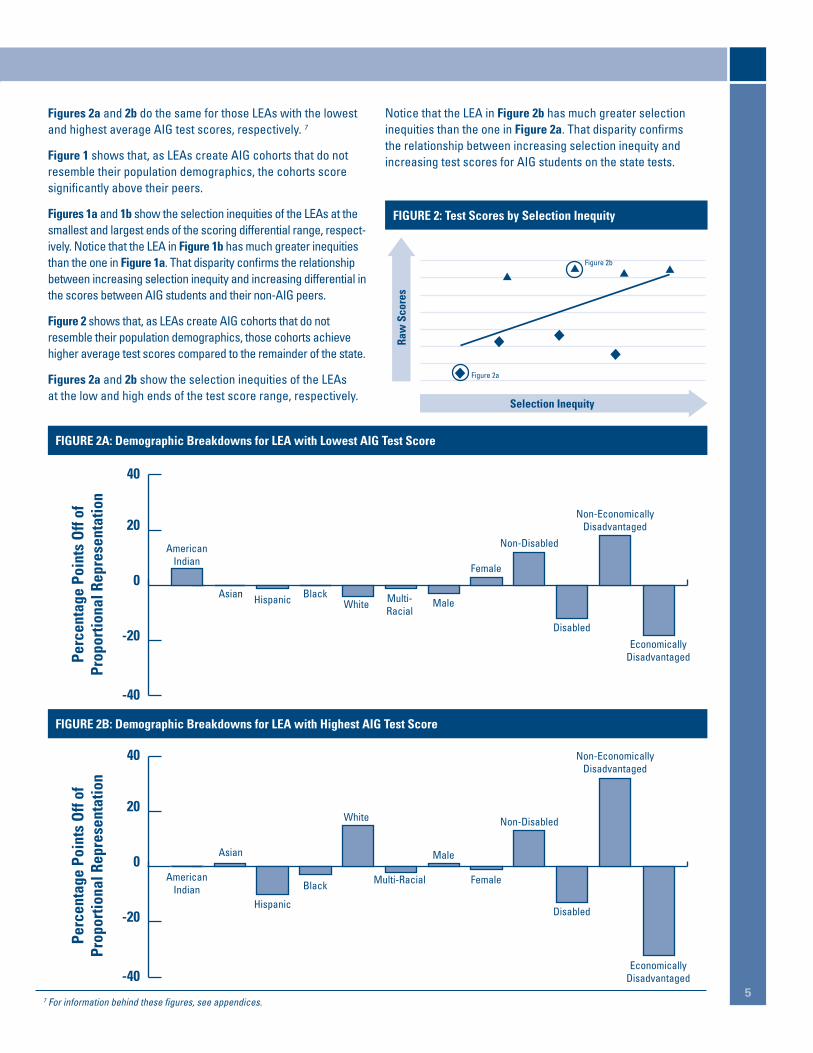
figures 2a and 2b do the same for those LEAs with the lowest and highest average AIG test scores, respectively. 7
figure 1 shows that, as LEAs create AIG cohorts that do not resemble their population demographics, the cohorts score significantly above their peers.
figures 1a and 1b show the selection inequities of the LEAs at the smallest and largest ends of the scoring differential range, respect-ively. Notice that the LEA in figure 1b has much greater inequities than the one in figure 1a. That disparity confirms the relationship between increasing selection inequity and increasing differential in the scores between AIG students and their non-AIG peers.
figure 2 shows that, as LEAs create AIG cohorts that do not resemble their population demographics, those cohorts achieve higher average test scores compared to the remainder of the state.
figures 2a and 2b show the selection inequities of the LEAs at the low and high ends of the test score range, respectively.
Notice that the LEA in figure 2b has much greater selection inequities than the one in figure 2a. That disparity confirms the relationship between increasing selection inequity and increasing test scores for AIG students on the state tests.
7 For information behind these figures, see appendices.
figure 2a: Demographic Breakdowns for lea with lowest aig test Score
-40
-20
0
20
40
Perc
enta
ge P
oint
s o
ff of
Prop
ortio
nal r
epre
sent
atio
n
AmericanIndian
Asian Hispanic BlackWhite Multi-
RacialMale
Female
Non-Disabled
Disabled
Non-EconomicallyDisadvantaged
EconomicallyDisadvantaged
figure 2B: Demographic Breakdowns for lea with Highest aig test Score
-40
-20
0
20
40
Perc
enta
ge P
oint
s o
ff of
Prop
ortio
nal r
epre
sent
atio
n
AmericanIndian
Asian
Hispanic
Black
White
Multi-Racial
Male
Female
Non-Disabled
Disabled
Non-EconomicallyDisadvantaged
EconomicallyDisadvantaged
raw
Sco
res
Selection inequity
Figure 2a
Figure 2b
figure 2: test Scores by Selection inequity

6
CONCLUSIONS The LEAs in these graphs demonstrate there to be significant identification inequities across North Carolina’s AIG programs, despite the language in their three-year plans, and warrants further study and understanding. Furthermore, this research suggests the greater such selection inequity, the more likely the program appears to score higher on state standardized tests and the larger the scoring differential between AIG and non-AIG students within each LEA. A more comprehensive evaluation of AIG program effectiveness would measure the degree to which each local plan is implemented (including the diversity policies) as well as analyze student performance on state tests.
DPI has responded to the need for a new review process for local AIG programs. In this new process, each local AIG program will be reviewed in two phases between 2010-2013. This two-phase review process will allow DPI to provide guidance and critical feedback to LEAs in order to support the progress of local AIG programs related to the NC AIG Program Standards. The two-phase review process will include: • Phase1:GeneralcommentsonlocalAIGplans,
submitted by July 15, 2010 • Phase2:Comprehensiveevidence-basedprogramreviews
based on implemented programs from current plan
FUTURE RESEARCHWe have only begun to tackle the challenge of assessing AIG children in the state of North Carolina. In this paper, we have highlighted the inherent problems with relying upon state test results and local AIG plans as the sole indicators of student performance. To that end, there are a number of avenues for recommended future research: • Longitudinalstudy, • Communitybreakdown,and • Alternativeassessment.
longitudinal StudyPerhaps one of the best ways to assess AIG program effectiveness is to look at the gifted students’ growth over their time in those programs. Since such students are likely to remain well above traditional proficiency cutpoints, it will be necessary to evaluate not only snapshots of their performance, but also their improvement. North Carolina currently employs two methods of assessing student growth: c-scores (designed in-house) and EVAAS (created by the SAS Institute). Either one can pinpoint the growth of all AIG students within an LEA or school; both methods can aggregate figures to assess whether that program is enabling the students to grow from their advanced starting points. In fact, EVAAS likely could be configured to provide a value-added effect
calculation for that very purpose much as it does for teacher, school, and district effectiveness now.
community BreakdownFurther investigation may examine the growth and performance of sub-groups within each LEA. In that manner, the state can determine if districts are identifying and servicing all AIG children effectively, e.g. all ethnicities, genders, socioeconomic levels,etc.Moreover,whencomparingLEAs,itmaybeworthwhile to group them by population size, geographic region, or other demographics. Doing so would control for disparities otherwise not addressed in this paper’s analysis.
alternative assessmentGiventhatEOGtestsfocusthemajorityofitemsaroundtheproficiency cutpoints, they may be insufficient to detail the progress of high-performing gifted students (Jennings and Corcoran, 2009). Thus, the state may choose to develop or adopt a test that is better tailored to testing AIG students. Alternatively, the state may choose to test gifted students using above-grade items. 8 Finally, the state plans to require evidence of student performance other than testing scores. Part of such evidence may be portfolios of student work. Those portfolios, though more intensive to assess than a test score, may provide a more versatile and comprehensive picture of that student’s performance.
WorKS citeD
•AmericanCommunitySurvey.Washington,DC.Accessedathttp://www.census.gov/acs/www/Products/spec_tabs/index.htm on 12 July 2010.
•DepartmentofPublicInstruction.North Carolina Academically or Intellectually Gifted Program Standards. Approved by the State Board of Education on July 9, 2009.
•Jennings,JenniferL.andSeanP.Corcoran.“’BewareofGeeksBearingFormulas:’ReflectionsonGrowthModelsforSchoolAccountability.”Phi Delta Kappan. 90, 9 (May2009):635-639.AccessedthroughJSTORon7June2010.•N.C.Gen.Stat.,Article9B,§155C150.5-8.AcademicallyorIntellectuallyGiftedStudent.
Raleigh,NC.1996.Accessedathttp://www.ncga.state.nc.us/enactedlegislation/statutes/html/bysection/chaptec_115c/gs_115c-150.5.html on 12 July 2010.
8 Currently, the federal government prohibits testing off-grade items for federal accountability purposes. The state may consider such testing for internal assessment of AIG students.
7
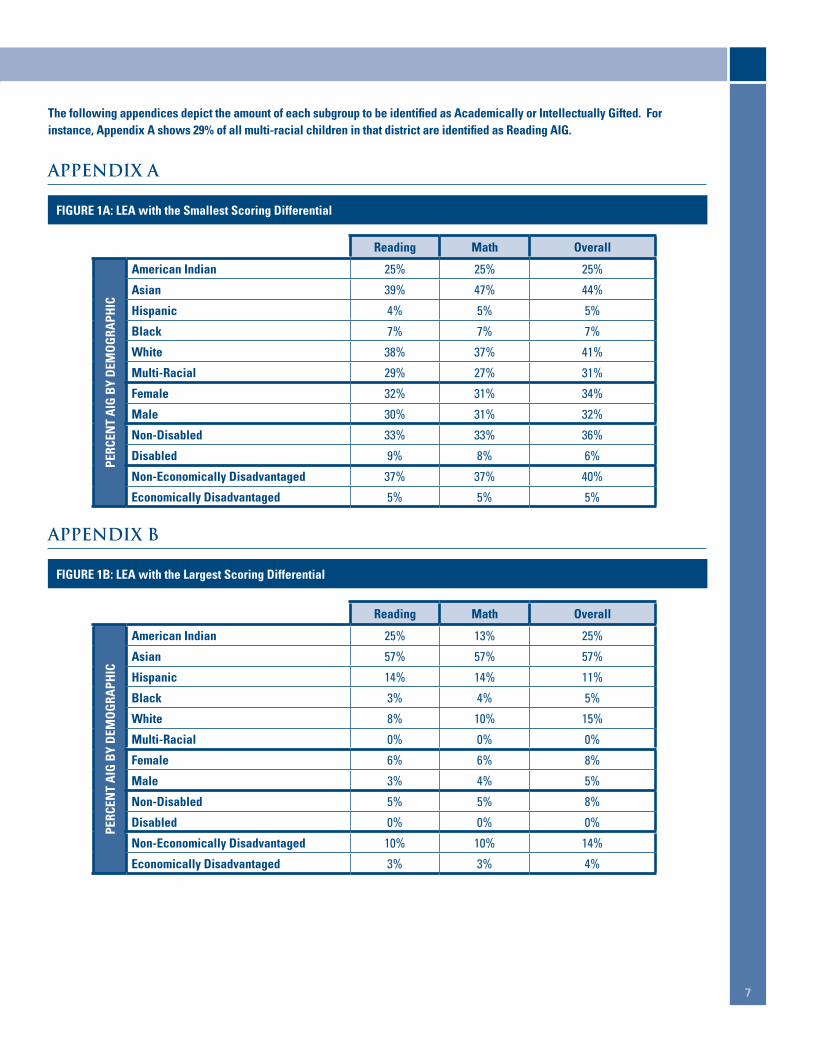
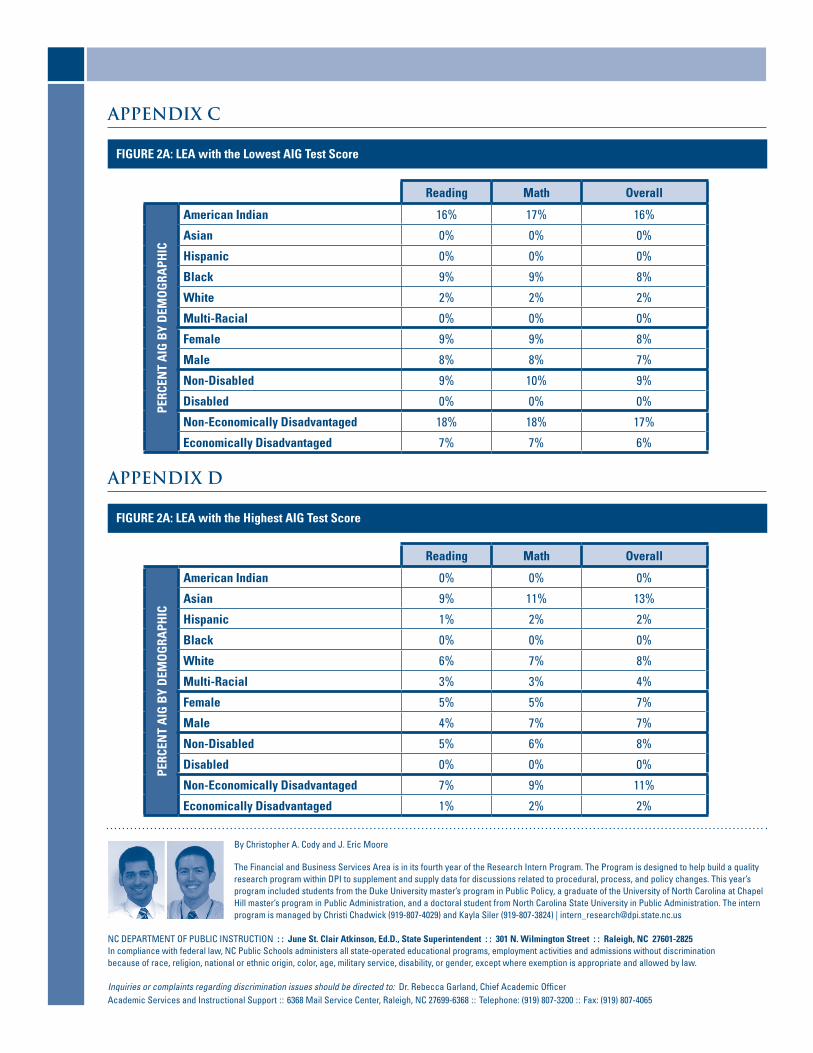
the following appendices depict the amount of each subgroup to be identified as academically or intellectually gifted. for instance, appendix a shows 29% of all multi-racial children in that district are identified as reading aig.
APPENDIx A
figure 1a: lea with the Smallest Scoring Differential
APPENDIx B
figure 1B: lea with the largest Scoring Differential
reading Math overall
Perc
ent
aig
By
DeM
og
raPH
ic
american indian 25% 25% 25%
asian 39% 47% 44%
Hispanic 4% 5% 5%
Black 7% 7% 7%
White 38% 37% 41%
Multi-racial 29% 27% 31%
female 32% 31% 34%
Male 30% 31% 32%
non-Disabled 33% 33% 36%
Disabled 9% 8% 6%
non-economically Disadvantaged 37% 37% 40%
economically Disadvantaged 5% 5% 5%
reading Math overall
Perc
ent
aig
By
DeM
og
raPH
ic
american indian 25% 13% 25%
asian 57% 57% 57%
Hispanic 14% 14% 11%
Black 3% 4% 5%
White 8% 10% 15%
Multi-racial 0% 0% 0%
female 6% 6% 8%
Male 3% 4% 5%
non-Disabled 5% 5% 8%
Disabled 0% 0% 0%
non-economically Disadvantaged 10% 10% 14%
economically Disadvantaged 3% 3% 4%
ByChristopherA.CodyandJ.EricMoore
TheFinancialandBusinessServicesAreaisinitsfourthyearoftheResearchInternProgram.TheProgramisdesignedtohelpbuildaqualityresearch program within DPI to supplement and supply data for discussions related to procedural, process, and policy changes. This year’s program included students from the Duke University master’s program in Public Policy, a graduate of the University of North Carolina at Chapel Hill master’s program in Public Administration, and a doctoral student from North Carolina State University in Public Administration. The intern program is managed by Christi Chadwick (919-807-4029) and Kayla Siler (919-807-3824) | [email protected]
NCDEPARTMENTOFPUBLICINSTRUCTION : : June St. clair atkinson, ed.D., State Superintendent : : 301 n. Wilmington Street : : raleigh, nc 27601-2825 In compliance with federal law, NC Public Schools administers all state-operated educational programs, employment activities and admissions without discrimination because of race, religion, national or ethnic origin, color, age, military service, disability, or gender, except where exemption is appropriate and allowed by law.
Inquiries or complaints regarding discrimination issues should be directed to: Dr.RebeccaGarland,ChiefAcademicOfficer AcademicServicesandInstructionalSupport::6368MailServiceCenter,Raleigh,NC27699-6368::Telephone:(919)807-3200::Fax:(919)807-4065
APPENDIx C
figure 2a: lea with the lowest aig test Score
APPENDIx D
figure 2a: lea with the Highest aig test Score
reading Math overall
Perc
ent
aig
By
DeM
og
raPH
ic
american indian 16% 17% 16%
asian 0% 0% 0%
Hispanic 0% 0% 0%
Black 9% 9% 8%
White 2% 2% 2%
Multi-racial 0% 0% 0%
female 9% 9% 8%
Male 8% 8% 7%
non-Disabled 9% 10% 9%
Disabled 0% 0% 0%
non-economically Disadvantaged 18% 18% 17%
economically Disadvantaged 7% 7% 6%
reading Math overall
Perc
ent
aig
By
DeM
og
raPH
ic
american indian 0% 0% 0%
asian 9% 11% 13%
Hispanic 1% 2% 2%
Black 0% 0% 0%
White 6% 7% 8%
Multi-racial 3% 3% 4%
female 5% 5% 7%
Male 4% 7% 7%
non-Disabled 5% 6% 8%
Disabled 0% 0% 0%
non-economically Disadvantaged 7% 9% 11%
economically Disadvantaged 1% 2% 2%