Embed Size (px)
Citation preview

EFFECTS OF WOODY BIOMASS RETENTION AND DISTRIBUTION PATTERNS ON
SELECT SOIL QUALITY INDICATORS IN LOWER COASTAL PLAIN SOILS OF
NORTH CAROLINA AND GEORGIA
By
CHRISTIAN WELLS HOADLEY
(Under the Direction of Lawrence Morris and Daniel Markewitz)
ABSTRACT
In this study, the effects of retention, distribution and piling of harvest-residues on soil
physical and chemical properties in Lower Coastal Plain soils were investigated. Overall, we
found reductions in total C and N that were consistent with residue retention treatments, but
more often than not, differences were not statistically significant. Equipment trafficking during
harvest and site-preparation contributed to the compaction of the mineral soil surface horizon.
Changes in particle size distribution indicate soil mixing occurred during harvest operations and
site preparation; resulting in finer-textures in the mineral soil surface horizon. Overall, harvest-
residue pile size had few significant effects on measured soil quality indicators. However, results
of soil moisture, soil temperature, soil respiration, total soil organic carbon, and total soil
nitrogen demonstrated high variability among pile size designation (large, medium, and small)
and study location. An evaluation of electromagnetic induction to measure conductivity of
residue pile density suggests that the Dualem-2S is sensitive to increases in the mass of woody
debris.
INDEX WORDS: Biomass Harvest, Residue Pile, Soil Quality, Biomass Retention

EFFECTS OF WOODY BIOMASS RETENTION AND DISTRIBUTION PATTERNS ON
SELECT SOIL QUALITY INDICATORS IN LOWER COASTAL PLAIN SOILS OF
NORTH CAROLINA AND GEORGIA
by
CHRISTIAN WELLS HOADLEY
B.S.F.R., University of Georgia, 2010
A Thesis Submitted to the Graduate Faculty of The University of Georgia in Partial Fulfillment
of the Requirements for the Degree
MASTER OF SCIENCE
ATHENS, GEORGIA
2014
EFFECTS OF WOODY BIOMASS RETENTION AND DISTRIBUTION PATTERNS ON
SELECT SOIL QUALITY INDICATORS IN LOWER COASTAL PLAIN SOILS OF
NORTH CAROLINA AND GEORGIA
by
CHRISTIAN WELLS HOADLEY
Major Professors: Lawrence Morris
Daniel Markewitz
Committee: Jeffrey Hepinstall-Cymerman
Michael Kane
Electronic Version Approved:
Maureen Grasso
Dean of the Graduate School
The University of Georgia
May 2014

© 2014
Christian W. Hoadley
All Right Reserved

iv
ACKNOWLEDGEMENTS
I would like thank my major advisors, Drs. Daniel Markewitz and Larry Morris, for their
guidance, encouragement, and patience throughout this research and my time at the University of
Georgia. I would also like to thank Drs. Michael Kane and Jeffery Hepinstall-Cymermann for
serving on my advisory committee. I am grateful to Dr. Eric Vance and the National Council for
Air and Stream Improvement (NCASI) for funding our research and providing insightful
feedback over the duration of this study. I also need to thank Drs. Zakiya Leggett, Jessica
Homyack, and Eric Sucre of Weyerhaeuser for providing the study location in North Carolina
and for their guidance. Furthermore, I would like to thank Rob Hicks of Plum Creek and
Michelle Liotta of Georgia Pacific. I owe a special thank you to Ms. Lee Ogden for all of her
guidance, advice, and assistance over the last two years; without Lee, field excursions would
have been much more difficult. I greatly appreciate the efforts of the many peers who dedicated
their time to the extensive travel and field work involved with this research. Specifically, I would
like to acknowledge Jeff Reichel, Brandon Lambert, Andrew Kane, Michael Housworth, Diego
Barcellos, Ji (Jill) Qi, Tecá Horokoski, Sabina Mendonca, Clivia Coelho, Holly Campbell, Justin
Whisenant, Greg Walton, and Jonathon Lord. To Anchal Bangar, my research partner and friend,
thank you for all of your input and hard work along the way. Special thanks to Dan Harris, my
close friend and dedicated beekeeper who has always made time to listen. Finally, I would like to
thank my family for their unconditional love and support.

v
TABLE OF CONTENTS
Page
ACKNOWLEDGEMENTS………………………………………………………………………………..iv
LIST OF TABLES……………………………………………………………………………...........……vii
LIST OF FIGURES…………………………………………………………………………………..…..viii
CHAPTER
I INTRODUCTION AND LITERATURE REVIEW………………………………….…..1
References………………………………………………………………...…......15
II EFFECTS OF WOODY BIOMASS RETENTION AND RESIDUE
DISTRIBUTION PATTERNS ON SELECT SOIL QUALITY INDICATORS
IN LOWER COASTAL PLAIN SOILS OF NORTH CAROLINA……………...……..21
Abstract…………………………………………..…………………………...…22
Introduction…………………………………..………………………………….24
Materials and Methods……………………..……………………………………27
Results…………………………………….……………………………….…….33
Discussion……………………………………………………..…………...……37
References…………………………………………………….….………...……40
III MICRO-SITE EVALUATION OF HARVEST RESIDUAL PILE SIZE ON
SELECT SOIL QUALITY INDICATORS IN COASTAL PLAIN SOILS
OF NORTH CAROLINA AND GEORGIA…………………………….………...…….54
Abstract………………………………………………………………………….55
Introduction……………………………………………………………………...57
Materials and Methods…………………………………………………………..59
Results……………………………………………………………………...……65

vi
Discussion………………………………………………………………….……70
References………………………………………………………………….……74
IV USE OF ELECTROMAGNETIC INDUCTION TO
ESTIMATE THE QUANTITY OF HARVEST RESIDUES RETAINED
FOLLOWING TIMBER HARVEST……………………………………………...…….99
Abstract…………………………………………………………………….…………..100
Introduction………………………………………………………..………………..….101
Materials and Methods…………………………………………………………..……..103
Results………………………………………………………………………….……....107
Discussion………………………………………………………………………..…..…108
References………………………………………………………………………………109

vii
LIST OF TABLES
Page
Table 2.1: Statistical summary (probability>F) of biomass retention (BHG) and harvest effects
on total carbon concentration and content of the forest floor and mineral soil, and forest floor
mass for North Carolina replicate blocks (Blocks 1 – 4)…………………………………….…45
Table 2.2: Statistical summary (probability>F) of biomass retention (BHG) and harvest effects
on total nitrogen concentration and content of the forest floor and mineral soil, and forest floor
mass for North Carolina replicate blocks (Blocks 1 – 4)…………………………………….…46
Table 2.3: Post-site preparation mean cubic volume (m3 ha
-1) of coarse-woody debris (CWD) by
BHG treatment designation for North Carolina replicate blocks (Blocks 1-4)…………….……47
Table 2.4: Pre-harvest and post-site preparation average mass and total carbon content of the
forest floor (Oi + (Oe+Oa) + FWD) by BHG treatment designation for North Carolina blocks
(Blocks 1- 4)..................................................................................................................................48
Table 2.5: Pre-harvest and post-site preparation average mass and total carbon concentration and
content of the forest floor Oi, Oe+Oa, and FWD horizons by BHG treatment designation for
North Carolina replicate blocks (Blocks 1 – 4)………………………………………….………49
Table 2.6: Pre-harvest and post-site preparation total carbon concentration and content of the
mineral soil (0 – 15 cm) depth by BHG treatment designation for North Carolina replicate blocks
(Blocks 1- 4)…………………………………………………………………………….…….....50
Table 2.7: Pre-harvest and post-site preparation average mass and total nitrogen content of the
forest floor (Oi + (Oe+Oa) + FWD) by BHG treatment designation for North Carolina replicate
blocks (Blocks 1 – 4)…………………………………………………………………….………51
Table 2.8: Pre-harvest and post-site preparation average mass and total nitrogen concentration
and content of the forest floor Oi, Oe+Oa, and FWD horizons by BHG treatment designation for
North Carolina replicate blocks (Blocks 1 – 4)……………………………………………….....52
Table 2.9: Pre-harvest and post-site preparation total nitrogen concentration and content of the
mineral soil (0 – 15 cm) depth by BHG treatment designation for North Carolina replicate blocks
(Blocks 1 – 4)…………………………………………………………………………………….53

viii
Table 3.1: Statistical summary (probability>F) of pile-size effects on volumetric moisture
content (VMC), soil temperature, soil respiration, total soil organic carbon, and total soil
nitrogen………………………………………………………………………………………..…87
Table 3.2: Average (bed-interbed) volumetric moisture content (%) for North Carolina and
Georgia large, medium, and small pile classes…………………………………………………..88
Table 3.3: Statistical summary of one-way ANOVA results for volumetric moisture content (%)
and distance from residue-pile (0, 0.5, & 1.0-m) for North Carolina and Georgia study
locations……………………………………………………………………………………….…89
Table 3.4: Statistical summary for comparison between bed and interbed mean volumetric
moisture content (%) for North Carolina and Georgia study locations……………………….....90
Table 3.5: Statistical summary of one-way ANOVA results for soil temperature (°C) and
distance from residue-pile (0, 0.5, & 1.0-m) for North Carolina and Georgia study
locations………………………………………………………………………………………….91
Table 3.6: Average (bed-interbed) soil respiration (µmol CO2 m-2
s-) for North Carolina and
Georgia large, medium, and small pile classes………………………………………..…………92
Table 3.7: Statistical summary of one-way ANOVA results for soil respiration (µmol CO2 m-2
s-)
and distance from residue-pile (0, 0.5, & 1.0-m) for North Carolina and Georgia study
locations………………………………………………………………………………….………93
Table 3.8: Statistical summary for comparison between bed and interbed mean soil respiration
(µmol CO2 m-2
s-) for North Carolina and Georgia study locations……………………..………94
Table 3.9: Statistical summary of one-way ANOVA results for total soil organic carbon (%) and
distance from residue-pile (0, 0.5, & 1.0-m) for North Carolina and Georgia study
locations…………………………………………………………………………………….……95
Table 3.10: Statistical summary for comparison of bed and interbed mean total soil organic
carbon (%) for North Carolina and Georgia study locations…………………………...…..……96
Table 3.11: Statistical summary of one-way ANOVA results for total soil nitrogen (%) and
distance from residue-pile (0, 0.5, & 1.0-m) for North Carolina and Georgia study
locations………………………………………………….............................................................97
Table 3.12: Statistical summary for comparison of bed and interbed mean total nitrogen (%) for
North Carolina and Georgia study locations…………………………..…………………............98

ix
LIST OF FIGURES
Page
Figure 2.1: Location map of the Biomass Harvesting Guideline study area showing the location
of the four BHG research blocks located in Beaufort County, North
Carolina………………………………………………..……………………………..………….44
Figure 3.1: Least-squares regression of mean volumetric moisture content for the interbed
sample locations of the North Carolina pile-size study transects (large, medium, and small)…..77
Figure 3.2: Least-squares regression of mean volumetric moisture content for the interbed
sample locations of the Georgia pile-size study transects (large, medium, and small)……….....78
Figure 3.3: Least-squares regression of mean annual soil temperature for the interbed sample
locations of the North Carolina pile-size study transects (large, medium, and small)…………..79
Figure 3.4: Least-squares regression of mean annual soil temperature for the interbed sample
locations of the Georgia pile-size study transects (large, medium, and small)………………..…80
Figure 3.5: Least-squares regression of mean soil respiration for the interbed sample locations of
the North Carolina pile-size study transects (large, medium, and small)……………………..…81
Figure 3.6: Least-squares regression of mean soil respiration for the interbed sample locations of
the Georgia pile-size study transects (large, medium, and small)…………………………….…82
Figure 3.7: Least-squares regression of mean total organic carbon concentration (%) for the
interbed sample locations of the North Carolina pile-size study transects (large, medium, and
small)..............................................................................................................................................83
Figure 3.8: Least-squares regression of mean total organic carbon concentration (%) for the
interbed sample locations of the Georgia pile-size study transects (large, medium, and small)...84
Figure 3.9: Least-squares regression of mean total nitrogen concentration (%) for the interbed
sample locations of the North Carolina pile-size study transects (large, medium, and small)…..85
Figure 3.10: Least-squares regression of mean total nitrogen concentration (%) for the interbed
sample locations of the Georgia pile-size study transects (large, medium, and small)………….86
Figure 4.1: Representation of the 100-m2 survey area used for the field calibration study……111

x
Figure 4.2: Mean conductivity values (mS m-1
) for selected residue-piles of known density from
the electromagnetic induction field calibration study conducted at Whitehall Forest, Athens,
Georgia……………………………………………………………………………………....….112
Figure 4.3: Spatial correlation model of conductivity (mS m-1
) from ordinary prediction Kriging
that corresponds with a pile density of 196.7 kg m-3
…………………………………..…..…...113
Figure 4.4: Spatial correlation model of conductivity (mS m-1
) from ordinary prediction Kriging
that corresponds with a pile density of 130.0 kg m-3
…………………………………………...114
Figure 4.5: Spatial correlation model of conductivity (mS m-1
) from a geo-physical survey
conducted on a large-density residue-pile located in the Coastal Plain of Georgia………….…115

1
CHAPTER I
Introduction and Literature Review
Introduction
Intensively managed loblolly pine (Pinus taeda L.) plantations of the southeastern United
States provide a number of traditional forest products, and because of increased interest in the
production of renewable energy, traditionally non-merchantable harvest residuals (e.g., foliage,
branches, cull trees) remaining after timber harvest are a potential source of biomass for energy
production. However, the removal of this material from a recently harvested site has the potential
to negatively affect site productivity in terms of soil quality (Scott and Dean, 2006; Eisenbies et
al., 2009).
The southern United States comprises over 90 million hectares of forested landscape, of
which 13 to 20 million hectares are intensively managed, and contain an estimated 33% of the
country’s industrial wood plantations (Eisenbies et al., 2009; Roise et al., 2000). A review of the
current literature suggests that at a national level, 57 million-Mgdry of forest feedstock residues
could be available annually. From the national total, the southeast and south-central US are
estimated to contribute a total of 32 million-Mgdry forest residues (Milbrant, 2005). Given the
potential role that the Southeast may play in the supply of forest residues for energy production,
understanding the effects that biomass harvests may have on soil quality and site productivity in
the region is paramount.

2
For a forested site to be productive, it must maintain adequate soil quality, which can be
defined by how well the soil functions in terms of its ability to cycle essential nutrients, provide
adequate soil water and drainage, and provide a medium that promotes root growth and essential
soil habitat for meso- and micro-fauna, and micro-flora (Burger et al., 2010). In the southeastern
US, pine production is commonly limited by low levels of available nitrogen (N) and
phosphorous (P), and low soil moisture availability (Fox et al., 2007). However, other factors
such as degraded soil physical conditions, micro-nutrient deficiencies and soil pathogens also
limit productivity. In order to evaluate changes in soil quality resulting from biomass removal,
soil properties suspected to be the most vulnerable to harvesting disturbance must be measured
and quantified. The ability of forest soils to cycle essential nutrients is closely related to soil
fertility, and is commonly quantified by concentrations of total soil organic carbon (SOC) and
total nitrogen (N) as they are variables closely tied to soil fertility (Johnson and Curtis, 2001).
Similarly, soil bulk density is a measure that is directly related to soil porosity, which in
turn plays a crucial role in a soil’s hydrologic function. Soil structural stability (e.g., horizon
depth, soil strength, aggregate uniformity, soil organic matter) on a forested site is closely tied to
a soil’s ability to promote root growth and is beneficial to creating suitable habitat conditions for
meso- and micro-fauna, and micro-flora (Burger et al., 2010; Fisher et al., 2000).
The purpose of this study was to quantify the effects of biomass retention on soil quality
in Coastal Plain soils of North Carolina and Georgia. To answer the question of how biomass
retention affects soil quality, two independent studies were conducted. First, to evaluate the
short-term effects of biomass retention on soil quality, a field study measuring pre-harvest and
post site preparation levels of coarse-woody debris volume, forest-floor mass, total soil organic
carbon (SOC), total soil N, soil compaction, and particle-size distribution was conducted.

3
A second study was conducted to quantify the effect of post-site-preparation residue piling on
soil moisture, soil temperature, soil respiration, total SOC, and total N at a micro-site scale.
Finally, this study investigates the use of electromagnetic induction (EMI) to estimate the
volume of woody biomass following bioenergy harvests.
Literature Review
Woody Biomass as a Renewable Energy Source
The world’s finite supply of fossil fuels, coupled with societal concern over increased
levels of atmospheric CO2 and a changing climate, are the driving force behind recent state and
federal policies directed toward increasing renewable energy production. In recent years, the
United States federal government has actively pursued and passed new energy legislation,
including the Energy Policy Act of 2005 and the Energy Independence and Security Act (EISA)
of 2007. Interestingly, both pieces of legislation mandate increases in the amount of biofuel that
must be produced and mixed with petroleum; however, the EISA mandate sets a very aggressive
Renewable Fuel Standard (RFS) with a target production-volume of 36 billion US gallons of
biofuel annually by 2022. The EISA legislation also mandates that 21 billion US gallons of the
2022 total be produced from non-cornstarch feedstock.
The United States 113th
Congress (2013-2014) has under consideration a Renewable
Electricity Standard (RES), Senate bill S.1595, which would require electrical utilities to produce
a percentage of their power from renewable energy sources. As of October 2013, the RES bill
had been referred to the Senate Committee on Energy and Natural Resources. Although the
federal government has made progress in strengthening energy security in the United States,
attempts to include renewable energy standards applicable to electrical power producers thus far

4
have been unsuccessful. Fortunately, more than 30 states have set Renewable Portfolio Standards
(RPS), either mandatory or voluntary, that are centered on producing 25% of the electrical
energy demand from renewable energy sources (e.g. wind, solar, geothermal energy,
hydropower, or biomass) by 2025.
In response to these legislative policies, domestic demand for biomass to produce
renewable energy is expected to increase in geographic regions of the country that have limited
opportunities to produce renewable energy from wind, solar, hydropower, or geothermal sources
(Pinchot Institute, 2010). In 2007, the US Department of Energy (DOE) conducted a study to
examine the potential environmental and economic effects of simultaneously implementing a
25% Renewable Electricity Standard (RES) and a 25% Renewable Fuel Standard by the year
2025. The results of this study indicate that the current level of wood harvesting in the US would
need to be doubled to achieve the 25% renewable energy goals of the combined Renewable
Electricity and Fuel Standards (RES and RFS) (EIA 2007b). The DOE’s study also provides a
breakdown of biomass utilization from various sources under a combined 25% RFS and RES,
which determined that 324 million green tons of forest residues from traditional forest harvesting
will be available annually for renewable energy production by 2025.
As of December 2013, there were 442 announced or operating domestic projects that
could potentially consume 80.9 million green tons of wood per year by 2023 (Forisk, 2013).
Additionally, the European Union imports large volumes of pelletized wood-biomass from North
America, which includes large imports of wood pellets from the southeastern United States.

5
In a recent study of southern timber market trends, Harris et al. (2012) found the total operating
capacity of 29 pellet mills in the Southeast to be approximately 3.2 million tons. From the 2012
production levels, the total industrial wood pellet capacity of the southern US is expected to
more than double by 2014 (Shell, 2013).
Consequently, the increase in demand for woody biomass from US forests to produce
renewable energy has the potential to negatively impact local environments and sustainable
forest productivity. Specifically, concerns have been raised regarding the impacts of intensive
harvesting of woody biomass, which include potential impacts to soil productivity, impaired
water quality from surface runoff, and forest biodiversity (Benjamin, 2010; Gugelmann, 2011;
Eisenbies et al., 2009).
Effects of Residue Removal on Soil Productivity
In forest ecosystems, organic materials and woody debris play an important role in the
dynamics of soil systems, and in maintaining relatively stable soil properties (Morris and
Markewitz, 2011). Forest floor litter layers, which include woody debris and foliage, protect the
physical properties of mineral soils by moderating soil surface temperatures, insulating the soil
surface to reduce evaporation and conserve soil moisture, improving infiltration rates and soil
porosity (Fisher et al., 2000). Additionally, surface debris and soil organic matter (SOM) serve as
the primary energy source for heterotrophic soil organisms and provide essential habitat (Weston
and Whittaker, 2004). Mineral soil development is largely influenced by SOM through the
production of aliphatic organic acids, which can dissociate the proton from its carboxylic group
to degrade soil minerals (Sposito, 2008). Finally, the organic acids produced by SOM actively
bind soil particles into aggregates, forming a stable structure, which is essential to a soil’s

6
hydraulic function and its ability to diffuse soil gasses, cycle essential nutrients, and promote
root growth. Therefore, forest management activities that significantly alter the quantity and
distribution of organic materials and woody debris could result in a decline in site productivity
and proper ecosystem function.
In the absence of other forest management activities, conventional harvesting of southern
forests has been shown to have relatively subdued effects on soils. Soil carbon (C) is the
principal component of SOM, which also serves as a significant source of N, and is commonly
used as an index for assessing potential change in site productivity following management
activities (Nave et al., 2010). In a recent literature review that investigates the effects of forest
management on soil C, Johnson and Curtis (2001) concluded from their meta analysis that forest
harvesting had a slightly positive effect on soil C, with conventional sawlog harvesting causing
an 18% increase in soil C (Johnson and Curtis, 2001). Similarly, in a review of multi-site case
studies, Johnson et al. (2001) found that forest harvesting, after 15-16 years, had little lasting
effect on soil C. In another investigation that analyzed 432 studies of soil C response to harvest,
Nave et al. (2010) concluded that forest floor C is much more vulnerable to harvest related loss
than mineral soil C, which showed no significant loss from harvest activities.
A number of studies have investigated the impacts of whole-tree harvesting versus
traditional forest harvest operations on soil quality; however, there is little information available
that documents the sustainability of biomass harvesting in terms of soil quality for bioenergy
production. The amount of organic materials and woody debris potentially removed in bioenergy
harvests will exceed removals associated with conventional stem-only harvests. Traditional
stem-only harvests on pine plantations of the southeastern US typically leave 50 to 85 Mg ha-1
of
dry weight biomass on site (Eisenbies et al., 2009). The recovery rate for woody biomass during

7
whole-tree harvesting operations is typically around 70% of the available harvest residues (Wall
and Nurmi, 2006). Following a field trial conducted in the flatwoods region and Coastal Plain of
Georgia, Westbrook (2008) found that between 8 to 40 Mg ha-1
of harvest residues could be
collected with a conventional harvesting system and additional chippers at the logging deck.
The removal of these forest residues during harvest operations may result in reduced soil C and
essential nutrients that would otherwise be available to replenish soil nutrient pools.
Furthermore, residue removal could alter nutrient-cycling activities of heterotrophic soil
organisms and the rate of recovery from harvest associated compaction (Nave et al., 2010; Fisher
et al., 2000).
Harvest Residues and Soil Disturbance
In some cases soil disturbance caused by equipment during forest harvest operations and
site preparation has been demonstrated to have a negative effect on soil physical properties and
site productivity (Miller et al., 2004). Intensified biomass removal associated with energy
production could potentially lead to long-term negative impacts on soil physical properties
(Munsell and Fox, 2010). Increased equipment trafficking during biomass harvest operations,
coupled with the intensified removal of woody debris, greatly increases a soil’s susceptibility to
compaction. Soil compaction can be defined as the breakdown of soil structural aggregates,
which is typically accompanied by decreased total porosity and greatly diminished gaseous
exchange, nutrient cycling, hydraulic function, and microbial activity (Greacen & Sands, 1980;
Ludovici, 2008; Page-Dumroese et al., 2010; Page-Dumroese et al., 2006). Severe levels of soil
compaction, resulting from increased trafficking, can lead to reduced root growth and an overall
loss in site productivity (Fisher et al., 2000).

8
The most common measure of soil compaction is bulk density; a positive-linear
relationship exists between bulk density and the severity of soil compaction on a harvested site.
In a recent study on the impacts of ground-based logging equipment on forest soils, Akay et al.
(2007) found that soil bulk density increased significantly at the 10-cm and 20-cm depths, from
the 1.50 g cm-3
and 2.07 g cm-3
average. At the 10-cm depth, following subsequent passes by a
conventional rubber-tired skidder, average bulk density increased following the first, fifth, and
tenth trip by 14, 51, and 61%, respectively. At the 20-cm depth, average bulk density increased
following the first, fifth, and tenth trip by 12, 27, and 32%, respectively (Akay et al., 2007).
Additionally, Akay et al. (2007) noted that woody slash materials distributed over highly
trafficked skid-tails reduced the severity of compaction. Similarly, Page-Dumroese et al. (2010)
concludes that the use of harvest traffic lanes and leaving harvest residue in high traffic areas can
reduce soil compaction.
Soil compaction resulting from harvest operations can contribute to decreased air-filled
porosity, infiltration rates, and hydraulic conductivity. An investigation into the effects of traffic
level and soil wetness on bulk density and air-filled porosity by McNabb et al. (2001), resulted in
increased bulk density after three trips of a wide-tired skidder on soils where soil water potential
was greater than field capacity (-15 kPa); additionally, air-filled porosity decreased significantly
in compacted soils. In a related study on skidder traffic effects on water retention, pore-size
distribution and van Genuchten parameters, Startsev and McNabb (2001) concluded that skidder
induced compaction led to one-third and two-third decreases in meso-pore space following three,
and seven to twelve skidding cycles, respectively.

9
Soil structural stability (e.g., horizon depth, soil strength, aggregate uniformity, organic
matter) on a forested site is closely tied to a soil’s ability to promote root growth and is beneficial
to creating suitable habitat conditions for meso- and micro-fauna, and micro-flora (Burger et al.,
2010; Fisher et al., 2000). Soil stability is a broad term that encompasses many critical soil
properties. Topsoil displacement (partial or entire loss of the A horizon), aggregate uniformity
and soil strength are all properties that can be negatively impacted through equipment trafficking
and residue removal (Henninger et al., 1997; Miller et al., 2004). Increased soil strength by
means of compaction, destruction of structural aggregates, and reduction of horizon depth can all
lead to decreases in root growth potential, loss of critical soil habitat, and reduction of available
soil water and nutrients (Miller et al., 2004).
Distribution and Piling of Harvest Residues
In addition to the total amount of residues removed or retained during bioenergy harvests,
the distribution and piling of retained residues may influence measures of site productivity and
ecosystem biodiversity. At a microclimate scale, observed effects of woody debris and organic
material retention include shading and insulation of the soil surface horizon from seasonal
temperature extremes (Devine and Harrington, 2007; Roberts et al., 2005; Proe et al., 2004),
conservation of soil moisture (Roberts et al., 2005; O’Connell et al., 2004), moderation of near-
ground air temperature extremes (Devine and Harrington, 2007), decreases in competing
vegetation (Roberts et al., 2005), and increased rates of soil respiration (Gough and Seiler, 2004).

10
In a recent study that investigated the influence of harvest residues and vegetation on
micro-site soil and air temperatures in the Coast Range of Washington, Devine and Harrington
(2007) concluded that the mean annual soil temperature and the diurnal range in soil
temperatures were greater on sites with exposed mineral soil when compared to sites with an
intact forest floor or coarse woody debris (CWD) and intact forest floor over mineral soil. In the
same study, Devine and Harrington (2007) reported that micro-site, near-ground air temperatures
were not significantly different between surface debris retention treatments. Similarly, a study
that examined the effects of harvest residue retention and competing vegetation on soil moisture
and soil temperature concluded that treatment plots with harvest residue removal experienced
increased soil temperatures and decreased volumetric soil moisture in the 0-20 cm depth
(Roberts et al., 2005).
Decomposition of Woody Debris
Following a typical forest harvest, logging debris is left on site and subject to
heterotrophic decomposition. Logging debris can be broken down into distinct categories
including fine-woody debris (FWD) and coarse-woody debris (CWD). Fine woody debris
includes foliage, twigs, and fine roots, whereas CWD components include log-wood, log-bark,
and branches with diameters greater than 5cm (Mattson et al., 1987; Palviainen et al., 2003). The
eventual fate of nutrients stored in these residues depends on a number of factors that influence
the decomposition process.

11
The decomposition of FWD is a relatively fast process compared to CWD due to high
concentrations of nutrients, low C/N ratio, and low lignin concentrations (Palviainen et al.,
2003). Complete microbial decomposition of green FWD slash has been reported to be as rapid
as two years following harvest (Genjegunte et al., 2004). In a study of decomposition of woody
debris in the southern Appalachians, Mattson et al. (1987) found that the FWD mass-loss rate
was two times higher than that of CWD, releasing annually approximately 860 kg C ha-1
.
The decay of CWD is a much slower process; and is influenced primarily by wood
characteristics, differences in microbial and fungal colonization, and environmental factors. The
wood characteristics involved that mediate the decomposition of CWD are the concentrations of
carbohydrates (hemicelluloses and cellulose), lignin, and tannins contained in structural
components (Genjegunte et al., 2004). The decomposition rate and extent of material breakdown
in CWD is dependent on the type of microbes or fungi involved; under aerobic conditions
brown-rot fungi and white-rot fungi dominate the decomposition process. Brown-rot fungi have
been observed to preferentially decompose carbohydrates in woody debris, whereas white-rot
fungi prefer to utilize lignin, leaving behind carbohydrates (Baldock and Preston, 1995). Under
anaerobic conditions soil bacteria dominate the decomposition of CWD and are generally
associated with the utilization of carbohydrates during mineralization. Environmental factors
that can affect the decomposition rates of microorganisms include temperature, moisture, and
humidity (Zhou et al., 2007).
The components of CWD include log-wood, log-bark, and side branches, each of which
contain very different initial concentrations of carbohydrates, lignin, and tannins. Wood is
primarily comprised of carbohydrates, whereas bark has a greater concentration of lignin and
tannins (Genjegunte et al., 2004). Initial concentrations of lignin and tannins are often associated

12
with slower rates of microbial decomposition. Another important difference in the rate of CWD
decomposition is the type of species involved. In general, coniferous CWD decomposes more
slowly than deciduous CWD due to higher concentrations of lignin and tannins (Zhou et al.,
2007).
The general consensus with regard to environmental factors is that warmer temperatures
with adequate moisture levels promote the growth of fungal and microbial communities (Radtke
et al., 2004). This in turn favors an increase in the degradation of CWD through microbial and
fungal decomposition, which is accompanied by an increase in heterotrophic respiration. Another
factor that greatly contributes to the rate of decomposition is whether or not the logging residue
has been incorporated into the soil during harvest operations. Incorporation of woody debris into
the soil promotes decomposition by anaerobic bacteria. Other biological factors include soil
animals and insects that facilitate the mechanical breakdown of CWD components, which in turn
initiates colonization by fungi and bacteria.
Biomass Harvesting Guidelines
Currently, most states rely on forestry best management practices (BMPs) established to
mitigate potential negative effects of traditional clear-cut forest harvests. However, the potential
intensity of biomass utilization associated with bioenergy harvests has sparked interest for many
states to develop new biomass harvesting guidelines (BHGs) or update existing forestry BMPs
(Evans et al. 2010). Since 2007, at least seven states have developed new biomass harvesting
guidelines, including: Minnesota (2007), Missouri (2009), Pennsylvania (2008), Wisconsin
(2009), Maine (2010), Michigan (2010), and Kentucky (2011) (Gugelmann, 2011).

13
The development of new BHGs is centered on the quantity of coarse-woody debris
(CWD) and fine-woody debris (FWD) retained on a harvested site, as well as the number of
snags that should be left on site following a bioenergy harvest. Additionally, newly developed
BHGs address concerns related to water quality and riparian areas, wildlife and forest
biodiversity, and soil productivity.
States of the southeastern US have well-developed forestry BMPs that are actively
applied and have no new BHG guidelines, particularly in the absence of any pressing science.
However, Wear and Greis (2012), in their summary report for The Southern Forests Futures
Project, conclude that biomass harvests in the US south have the potential to reduce stand
productivity, deteriorate forest biodiversity, and negatively impact soil fertility and water quality.
On the other hand, Wear and Greis (2012) suggest that “although research provides some
guidelines for the design of management to protect various forest ecosystem services, forest
sustainability benchmarks for bioenergy are not well defined and existing certification systems
have few relevant standards”.
In response to the Southern Forest Futures Project findings, the Forest Guild Southeast
Biomass Working Group developed retention and harvesting guidelines for bioenergy harvests in
the Southeast. In general, the working group recognizes that intensive removal of biomass has
the potential to negatively affect the soil nutrient status and future productivity of a harvested
site. The working group has identified that the pre-harvest soil nutrient status, frequency of
biomass harvests, and the amount of existing downed woody material (DWM) should all be
considered when making decisions regarding harvest intensity (Evans et al., 2012).

14
Specific biomass retention recommendations for the Piedmont and Coastal Plain
pinelands consist of maintaining at least 12 snags >10.16 cm diameter per hectare and at least 2.3
Mg ha-1
of DWM (Evans et al., 2012). Although the rationale for these and other biomass
harvesting guidelines are based on sound ecological principles, neither the need or utility of
biomass harvesting guidelines has been demonstrated for operational biomass harvesting
conditions. To be useful, such guidelines must have both a correlation to site productivity and to
measurable impacts on soil and site conditions.

15
References
Akay, A.E., Yuksel, A., Reis, M., and A. Tutus. 2007. The impacts of ground-based logging
equipment of forest soil. Polish J. of Envion. Stud. 16(3): 371-376
Baldock, J.A., and C.M. Preston. 1995. Chemistry of carbon decomposition processes in forests
as revealed by solid-state carbon-13 nuclear magnetic resonance. In: McFee, W.W,,
Kelly, J.M., (Eds.), Proceedings of the Eight North American Forest Soils Confrence on
Carbon Forms and Functions in Forest Soils, May 1993. Soil Science Society of America,
Gainesville, FL
Benjamin, J.G. (Editor) 2010. Considerations and recommendations for retaining woody biomass
on timber harvest sites in Maine. University of Maine, Maine Agricultural and Forest
Experiment Station. Orono, ME. Miscellaneous Publication 761. 68p.
Burger, J.A., Gray, G., and D.A. Scott. 2010. Using soil quality indicators for monitoring
sustainable forest management. USDA Forest Service Proceedings RMRS-P-59.
p. 13-41.
Devine, W.D., and C.A. Harrington. 2007. Influence of harvest residues and vegetation on
microsite soil and temperatures in a young conifer plantation. Agriculture and Forest
Meteorology 145:125-138
Eisenbies, M.H., Vance, E.D., Aust, W.M., and J.R. Seiler. 2009. Intensive utilization of
harvest residues in southern pine plantations: quantities available and implications for
nutrient budgets and sustainable site productivity. Bioenergy Res. 2: 90-98
Evans, A.M., R.T. Perschel, and M. Debonis. 2012. Forest biomass retention and harvesting
guidelines for the Southeast. Forest Guild, Sante Fe, NM.
Evans, A.M., R.T. Perschel, and B.A. Kittler. 2010. Revised assessment of biomass harvesting
and retention guidelines. Forest Guild, Sante Fe, NM.

16
Fisher, R. F., Binkley, D., and W.L. Pritchett. 2000. Ecology and management of forest soils / Richard F.
Fisher, Dan Binkley. (Vol. 3rd ed., pp. xviii, 489 p. :). New York :: John Wiley.
Fox, T.R., Allen, H.L., Albaugh, T.J., Rubilar, R., and C.A. Carlson. 2007. Tree nutrition
and forest fertilization of pine plantations in the southern United States. South.
J. Appl. For. 31(1): 5-10
Ganjegunte, G.K., Condron, L.M., Clinton, P.W., Davis, M.R., and N. Mahieu. 2004.
Decomposition and nutrient release from radiata pine (Pinus radiata) coarse woody
debris. Forest Ecology and Management 187:197-211
Gough, M.G., and J.R. Seiler. 2004. The influence of environmental, soil carbon, root, and stand
characteristics on soil CO2 efflux in loblolly pine (Pinus taeda L.) plantations located on
the South Carolina coastal plain. Forest Ecology and Management 191:353-363
Greacen, E.L., and R. Sands. 1980. Compaction of forest soils: a review. Austrailian Journal of
Soil Research 18:163-189
Gugelmann, B. 2011. An Analysis of Woody Biomass Harvesting Guidelines (BHGs) for North
Carolina Forestry. M.N.R Thesis. North Carolina State University, Raleigh, NC.
Harris, T., Baldwin, S., Smith, J., and R. Simmons. 2012. Southern timber market trends.
Forest Landowners Association. May 2012
Henninger, R.L., Terry, T.A., Dobkowski, A., and W. Scott. 1997. Managing for sustainable site
productivity: Weyerhauser’s forestry perspective. Biomass Bioenergy 13:255-267
Johnson, D.W., and P.S. Curtis. 2001. Effects of forest management on soil C and N storage:
meta analysis. Forest Ecology and Management 140: 227-238
Johnson, D.W., Knoepp, J.D., Swank, W.T., Shan, J., Morris, L.A., Van Lear, D.H., and P.R.
Kapeluck. 2001. Effects of forest management on soil carbon: results of some long-term
resampling studies. Environmental Pollution 116: S201-S208

17
Ludovici, K.H. 2008. Compacting coastal plain soils changes midrotation loblolly pine allometry
by reducing root biomass. Canadian Journal of Forest Resources 38(8): 2169-2176
Ludovici, K.H., and L.A. Morris. 1997. Competition-induced reductions in soil water availability
reduced pine root extension rates. Soil Sci. Soc. Am. J. 61:1196-1202
Mattson, K.G., Swank, W.T., and J.B. Waide. 1987. Decomposition of woody debris in a
regenerating clear-cut foresrt in the southern appalachians. Canadian Journal of Forest
Research 17:712-721
McNabb, D.H., Startsev, A.D., and H. Nguyen. 2001. Soil wetness and traffic level effects on
bulk density and air-filled porosity of compacted boreal forest soils. Soil Sci. Soc. Am. J.
65:1238-1247
Milbrandt, A. 2005. A geographic perspective on the current biomass resource availability
in the United States. Technical Report NREL/TP-560-39181. National Renewable
Energy Laboratory, Golden, CO.
Miller, R.E., Colbert, S.R., and L.A. Morris. 2004. Effects of heavy equipment on physical
properties of soils and on long-term productivity: a review of literature and current
research. National Council for Air and Stream Improvement, Research Triangle Park,
NC. Technical Bulletin No. 887 62p.
Morris, L.A., and D. Markewitz. 2011. Developing harvesting guidelines to ensure sustainability
of woody biomass as a renewable energy source- soil change and soil quality indicators.
research proposal – National Council for Air and Stream Improvement. Warnell School
of Forestry and Natural Resources, University of Georgia, Athens, GA.
Munsell, J.F., and T.R. Fox. 2010. An analysis of the feasibility for increasing woody biomass
production from pine plantations in the southern United States. Biomass and Bioenergy
34: 1631-1642

18
Nave, L.E., Vance, E.D., Swanston, C.W., and P.S. Curtis. 2010. Harvest impacts on soil carbon
storage in temperate forests. Forest Ecology and Management 259: 857-866
O’Connell, A.M., Grove, T.S., Mendham, D.S., and S.J. Rance. 2004. Impact of harvest residue
management on soil nitrogen dynamics in eucalyptus globules plantations in western
Autrailia. Soil Biol. Biochem 36:39-48
Page-Dumroese, D.S., Jurgensen, M., and T. Terry. 2010. Maintaining soil productivity during
forest or biomass-to-energy thinning harvests in the western United States. West. J. Appl.
For. 25(1): 5-11
Page-Dumroese, D. S., Jurgensen, M. F., Tiarks, A. E., Ponder Jr, F., Sanchez, F. G., and R.L. Fleming.
2006. Soil physical property changes at the North American Long-Term Soil Productivity study
sites: 1 and 5 years after compaction. Canadian Journal of Forest Research 36(3): 551-564
Palviainen, M., Finer, L., Kurka, A.M., Mannerkoski, H., Piiraineń, S., and M. Starr. 2003.
Decomposition and nutrient release from logging residues after clear-cut of mixed boreal
forest. Plant and Soil 263:53-67
Perschel, B. and A. Evans. 2012. Forest biomass retention and harvesting guidelines for the
southeast. Forest Guild Biomass Working Group. 18p.
Pinchot Institute. 2010. Forest sustainability in the development of wood bioenergy in the U.S.
Pinchot Institute for Conservation. Washington D.C. 44p.
Proe, M.F., and J. Dutch. 1994. Impact of whole-tree harvesting on second-rotation growth of
sitka spruce: the first 10 years. For. Ecol. Manage. 66:39-54
Radtke, P.J., Prisley, S.P., Amateis, R.L., Copenheaver, C.A., and H.E. Burkhart. 2004. A
proposed model for deadwood C production and decay in loblolly pine plantations.
Environmental Management 33(1):556-564
19
Roberts, S.D., Hurrington, C.A., and T.Terry. 2005. Harvest residue and competing vegetation
affect soil moisture, soil temperature, N availability, and douglas-fir seedling growth.
Forest Ecology and Management 205:333-350
Roise, J.P., Cubbage, F.W., Abt, R.C., and J.P. Siry. 2000. Regulation of timber yield for
sustainable management of industrial forest plantations- theory and practice.
p. 217-255. In K. von Gadow, T. Pakkula, and M. Tomé (ed.) Sustainable
Forest Management. Kluwer Academic Publishers, The Netherlands.
Scott, D.A., and T.J. Dean. 2006. Energy trade-offs between intensive biomass
utilization, site productivity loss, and ameliorative treatments in loblolly
pine plantations. Biomass and Bioenergy. 30: 1001-1010
Shell, D. 2013. Industrial pellets growing capacity. Wood Bioenergy. Februaury 2013. Accessed
2013. Available at
http://issuu.com/hattonbrown/docs/wb_0213_digimag
Sposito, G. 2008. The Chemistry of Soils. Second Edition. Oxford University Press, Inc.,
Oxford, NY
Startsev, A.D. and D.H. McNabb. 2001. Skidder traffic effects on water retention, pore-size
distribution and van Genuchten parameters of boreal forest soils. Soil Sci. Soc. Am. J.
65:224-231
Wall, A. and J. Nurmi. 2006. The effect of logging residue removal for bioenergy on soil fertility
and nutrient leaching from the organic soil layer. Finish Forest Research Institute,
Kannus Research Station, Kannus, Finland
Wear, D.N. and J.G. Greis. Editors. 2011. The Southern Forests Futures Project: summary report.
USDA Forest Service, Research Triangle Park, NC.
Wear, D. 1997. Southern forest research assessment. Gen. Tech. Rep. SRS-53. Southern
Research Station, Asheville, NC: USDA Forest Service; 1997. P.635

20
Westbrook, M.D. 2008. Forest biomass recovery by adding small chippers to tree-length
harvesting systems in planted pine stands of the southern USA. M.S. Thesis. The
University of Georgia. Athens, GA
Weston, C.J. and K.L. Whittaker. 2004. Soils and site: soil biology. In Encyclopedia of Forest
Sciences. Encyclopedia of Forest Sciences. Elsevier Ltd.
Zhou, L., Dai, L., Gu, H.Y., and L.Zhong. 2007. Review on the decomposition and influence
factors of coarse woody debris in forest ecosystem. [forestry]. Journal of Forestry
Research, 18(1):48-54

21
CHAPTER II
Effects of Woody Biomass Retention and Residue-Distribution Patterns on Select Soil Quality
Indicators in Lower Coastal Plain Soils of North Carolina
_____________________
1Christian W. Hoadley, Daniel Markewitz, and Lawrence Morris. To be submitted to Biomass and Bioenergy.

22
Abstract
Removal of traditionally non-merchantable harvest residuals (e.g., foliage, branches, cull
trees) remaining after timber harvest of loblolly pine (Pinus taeda L.) plantations is being
utilized as a source of biomass for energy production. Removal of this material while harvesting
a site, however, has the potential to negatively affect site productivity. Given the potential role
that the Southeast may have in supplying forest residues for energy production, understanding
these potential negative impacts is paramount. The objective of this study was to determine the
effects of biomass retention on soil quality in Coastal Plain soils of North Carolina and Georgia.
To evaluate effects of biomass retention on soil quality, a short-term field study was conducted
to measure post-harvest and regeneration levels of coarse-woody debris volume, forest floor
mass, total soil organic carbon (SOC), total soil N, soil compaction, and particle-size
distribution. Treatments included 100, 30, and 15% retention of residue compared to a no
biomass harvesting guidelines control. Overall, post-site preparation levels of forest floor mass
experienced a significant increase from pre-harvest levels (P<0.0001). Averaged across
treatments, the post-site preparation forest floor contained 36 Mg ha-1
greater mass than pre-
harvest. The carbon concentration of the forest floor decreased significantly from pre-harvest to
post-site preparation. Averaged across treatments, the carbon concentration of the Oi and Oe+Oa
horizons decreased by 30% (135 g kg-1
) and 25% (107 g kg-1
), respectively. There was no
statistically significant difference in total soil organic carbon (SOC) concentration in 0-15cm soil
from pre-harvest to post-site preparation. The results for total nitrogen concentration of the forest
floor and mineral soil followed the same general trends observed for carbon. Increased
equipment trafficking during harvest and site-preparation activities contributed to the compaction
of the mineral soil surface horizon. Averaged across treatments, soil bulk density increased 30%

23
(an absolute increase of 0.23 g cm-3
) from pre-harvest levels to post-site preparation.
Furthermore, 18% of the soils selected for particle size distribution analysis demonstrated a
change in USDA textural class indicating soil mixing. Most soils experienced a textural class
change from loamy sand to sandy loam, with average clay increases of 2 - 16% and average silt
increases of 2 - 14%. Overall, this research demonstrated that the impacts of operational-scale
biomass harvests were relatively small.
INDEX WORDS: Pinus taeda L., Soil Quality, Biomass Harvest, Total Soil Organic Carbon
(SOC), Soil Compaction, Biomass Retention, Coastal Plain

24
Introduction
Intensively managed loblolly pine (Pinus taeda L.) plantations of the southeastern United
States provide a number of traditional forest products such as pulp and sawtimber. Recent
interest in the production of renewable energy has made traditionally non-merchantable harvest
residuals (e.g., foliage, branches, tops, and cull trees) remaining after timber harvest a potentially
new product as a source of biomass for energy production. However, the removal of this material
while harvesting a site has the potential to negatively affect site productivity (Scott and Dean,
2006; Eisenbies et al., 2009).
The southern United States comprises over 90 million hectares of forested landscape, of
which 13 to 20 million hectares are intensively managed, and contain an estimated 33% of the
country’s industrial wood plantations (Eisenbies et al., 2009; Roise et al., 2000). A review of the
current literature suggests that at a national level, 57 million Mgdry of forestry feedstock residues
could be available annually. From the national total, the southeast and south-central United
States are estimated to contribute a total of 32 million Mgdry forest residues (Milbrant, 2005).
Given the potential role that the Southeast may have in supplying forest residues for energy
production, understanding the effects that residue harvests may have on soil quality and site
productivity in the region is paramount.
For a forested site to be productive, it must maintain adequate soil quality, which can be
defined by how well the soil functions in terms of its ability to cycle essential nutrients, provide
adequate soil water and drainage, and provide a medium that promotes root growth and essential
soil habitat for meso- and micro-fauna, and micro-flora (Burger et al., 2010).

25
Industrial pine plantations of the southeastern United States are commonly growth limited by
low levels of available soil nutrients and soil moisture (Fox et al., 2007). To evaluate changes in
soil quality resulting from biomass removal, soil properties suspected to be the most vulnerable
to harvesting disturbance must be measured and quantified.
In the absence of other forest management activities, conventional harvesting of southern
forests has been shown to have relatively small effects on soils. Soil carbon (C) is the principal
component of soil organic matter (SOM), which also serves as a significant source of nitrogen
(N), and is commonly used as an index for assessing potential change in site productivity
following management activities (Nave et al., 2010).
In a recent literature review, the effects of forest management on soil C concluded that
forest harvesting had a slightly positive effect on soil C, with conventional sawlog harvesting
causing an 18% increase in soil C (Johnson and Curtis, 2001). Similarly, in a review of multi-site
case studies, Johnson et al. (2001) found that forest harvesting, after 15-16 years, had little
lasting effect on soil C. Another investigation analyzed 432 studies of soil C response to harvest;
Nave et al. (2010) concluded that forest floor C is much more vulnerable to harvest related loss
than mineral soil C, which showed no significant loss from harvest activities.
In some cases soil disturbance caused by equipment during forest harvest operations and
site preparation have been demonstrated to have a negative effect on soil physical properties and
site productivity (Miller et al., 2004). Increased equipment trafficking during biomass harvest
operations, coupled with the intensified removal of woody debris, greatly increases a soil’s
susceptibility to compaction.

26
Soil compaction can be defined as the breakdown of soil structural aggregates, which is
typically accompanied by decreased total porosity and greatly diminished gas exchange, nutrient
cycling, hydraulic function, and microbial activity (Greacen & Sands, 1980; Ludovici, 2008;
Page-Dumroese et al., 2010; Page-Dumroese et al., 2006). Severe levels of soil compaction,
resulting from increased trafficking, can lead to reduced root growth and an overall loss in site
productivity (Fisher et al., 2000).
The most common measure of soil compaction is bulk density. The linear relationship
between bulk density and compaction reveals that the severity of soil compaction increases with
bulk density. In a recent study on the impacts of ground-based logging equipment on forest soils,
Akay et al. (2007) found that soil bulk density increased significantly at the 10-cm and 20-cm
depths, from the 1.50 g cm-3
and 2.07 g cm-3
average. At a depth of 10-cm, following subsequent
passes by a conventional rubber-tired skidder, average bulk density increased following the first,
fifth, and tenth trip by 14, 51, and 61%, respectively. At a depth of 20-cm, average bulk density
increased following the first, fifth, and tenth trip by 12, 27, and 32%, respectively (Akay et al.,
2007). Additionally, Akay et al. (2007) noted that woody slash materials distributed over highly
trafficked skid-tails reduced the severity of compaction. Similarly, Page-Dumroese et al. (2010)
concluded that the use of harvest traffic lanes and leaving harvest residue in high traffic areas can
reduce soil compaction.
The objective of this study was to determine the effects of biomass retention on soil
quality in the Lower Coastal Plain of North Carolina. To evaluate effects of biomass retention on
soil quality, a short-term field study was conducted to measure post-harvest levels of coarse-
woody debris (CWD) volume, forest floor mass, total soil organic carbon (SOC), total soil N,
soil bulk density, and particle-size distribution. Based on previous research on whole-tree versus

27
stem-only (traditional clear cut) harvest operations, we hypothesized that the quantity of biomass
retention would have minimal to no short-term effect on measured soil properties of CWD
volume, forest-floor mass, SOC, or TN. We also hypothesized that increased trafficking during
harvest operations would increase levels of soil compaction and mixing of the soil surface
horizon.
Materials and Methods
Site Description and Study Design
The study site was located in the flatwoods region of the Atlantic Coastal Plain in
Beaufort County, North Carolina (32° 28’ N 76° 50’ W) (Figure 2.1). The climate of Beaufort is
described as mild with an average growing season (April - October) temperature of 21.8°C and
average growing season rainfall of 829 mm (NOAA, 2013).
The predominant soil series, mapped by the Natural Resource Conservation Service
(NRCS), were Bayboro loam, Leaf silt loam, and Pantego loam, which are derived from
unconsolidated sands and clays of sedimentary origin (NRCS, 2013). These soils range from
poorly drained to very poorly drained, and are typical of Ultisols in the Atlantic Coastal Plain.
The Bayboro loam and Pantego loam (Thermic Umbric Paleaqualt) are characterized by a loam
surface horizon (umbric epipedon) and clay or sandy clay loam subsurface (argillic) horizon. In
contrast, the Leaf silt loam (Thermic Typic Albaquult) has a silt loam surface horizon (ochric
epipedon) and clay to clay loam subsurface (argillic) horizon. Use of engineered drainage and
bedding is common for these soils prior to stand establishment.

28
The site was previously planted in loblolly pine (Pinus taeda L.), which was managed for
sawtimber production. The four stands were 36-years-old at the time of harvest and each stand
received two thinning treatments during the rotation and a mid-rotation mechanical vegetation
control treatment. The experiment was installed as a randomized complete block design with
four separate blocks (one per location) of approximately 60 hectares. Within each 60 ha block,
six treatment plots of approximately 10 ha were delineated and randomly assigned to one of six
main biomass retention treatments. Additionally, a grid method was employed to establish six
permanent sampling sub-plots in the interbed space within each treatment area for a total of 36
sub-plots per block. The six biomass harvesting guideline (BHG) treatments installed in each
block were as follows:
Traditional clear-cut harvest with no additional biomass harvest (NOBIOHAR)
30% woody-biomass retention in a clustered distribution (30RETCLUS)
30% woody-biomass retention in a dispersed distribution (30RETDISP)
15% woody-biomass retained in a clustered distribution (15RETCLUS)
15% woody-biomass retained in a dispersed distribution (15RETDISP)
Full biomass harvest of all harvest residuals removed as was operationally
feasible (NOBHG)
Implementation of the six biomass retention treatments was completed following the
clear cut harvesting in fall 2010 and winter 2011; Fritts (2014) provides details of the residue
retention treatment installation. Briefly, the NOBHG treatments required loggers to follow
normal operating procedures for a typical woody biomass harvest. Levels of biomass retention
(15% or 30%) were ensured by restricting all biomass harvest on an area of each treatment plot

29
equal to the retention level treatment and then distributing the biomass within the restricted area
throughout the remainder of the treatment plot.
For clustered distribution, the slash was left as discrete piles; for dispersed distribution, slash was
spread throughout the treatment plot. Finally, for the NOBIOHARV treatments, logging crews
were required to leave all material not harvested as roundwood on site.
Following the clear cut harvest, including residue removal or retention and dispersion,
site preparation of each research block consisted of shearing with a v-blade, bedding, and hand
planting with loblolly pine seedlings at a density of 1,077 trees ha-1
(1.5 m x 6.1 m spacing) in
the winter of 2010-11. Also, each block received an aerial application of 10 gallons per acre
solution of 48 oz acre of Chopper + 12.8 oz acre of Red River Supreme surfactant for herbaceous
weed control in June of 2012. The active ingredient of Chopper, EPA Registration number 241 –
296, is an Isopropylamine salt of Imazapyr. Additionally, a banded herbicide application was
applied in the summer of 2012 to control competing vegetation.
Field Measurements and Sample Collection
Pre-harvest woody debris, forest floor and surface soil sampling was completed in each
of the six treatment plots within all four blocks between June 2010 and February 2011. Post-site
preparation sampling was completed between November 2011 and March 2012. Within a
treatment plot six sampling sub-plots were randomly established during pre-treatment; the same
sub-plots were sampled post-treatment by relocating plot centers and recording GPS coordinates
for each sub-plot.
30
Estimates of post-site preparation CWD volume were calculated from measurements
collected in the winter of 2011. A modified line-intersect sampling (LIS) technique, which
utilized 7.62 m transect lines oriented on 180°S and 270°W azimuths originating from the sub-
plot center, was used to record the large-end diameter (LED) and length of all CWD with a
diameter ≥5 cm intercepted by the transect lines.
The forest floor was sampled at each sub-plot using a fabricated 39 cm x 39 cm
aluminum sampling frame with an interior area of 0.15 m2. The forest floor was trimmed with
hand clippers or small saws, separated into Oi (fresh litter layer), Oe+Oa (fragmented litter &
humus layer) and FWD (fine-woody debris <5 cm diameter) and placed in labeled brown kraft
paper bags.
Pre-harvest and post-site preparation mineral soil samples, from the surface 0 to 15 cm
depth increment, were obtained from 6 to 8 random locations in the area cleared during forest
floor sampling at each sub-plot using a 2 cm inside diameter Oakfield probe. The 6 to 8 draws
were combined into a composite sample and stored in a standard Cooperative Extension sample
bag.
Pre-harvest and post-site preparation bulk density samples were collected at each sub-plot
on the same dates as forest floor and mineral soil sample collection. All bulk density samples
were collected from the middle of the 0 to 15 cm depth increment using a 7.5 cm diameter by 7.5
cm long core cylinder, which was forced into the soil using a fabricated drop hammer. Soil from
each core was carefully trimmed and placed into labeled plastic zip-top bags.

31
Sample preparation and analysis
All forest floor, mineral soil and bulk density samples were transported from the field to
the Phillips Wood Utilization Lab, Athens, Georgia. Forest floor samples were dried in a walk-in
oven at 70°C until a constant weight was achieved, weighed to the nearest 0.10 g, and then
processed through a Wiley mill and sieved using a 2 mm mesh screen. All composite mineral
soil samples were air-dried, separated from rocks and roots and sieved through a 2 mm mesh
screen. A SPEX 8000 ball mill grinder (Spex SamplePrep, LLC, Metuchen, NJ) was used to
pulverize approximately 2 g of each forest floor and composite mineral soil sample in
preparation for chemical analysis.
All bulk density cores were placed in a 1000 ml beaker and oven-dried at 105°C to
constant mass. Dried cores were then weighed to the nearest 0.10 g and the resulting mass data
was used to calculate bulk density (g cm-3
). Additionally, three soil cores from each treatment
area (pre-harvest and post-site preparation) were randomly selected for particle size distribution
analysis. The percentage of sand, silt and clay in the inorganic fraction of soil was determined for
these 72 soil samples using the hydrometer method (Bouyoucos, 1962).
A subsample of each ground pre-harvest and post-site preparation forest floor (0.0095-
0.0099 g) and mineral soil sample (0.095-0.099 g) was combusted using a CHN elemental
analyzer (CE Instruments – model NC2100, CE Elantech Inc., Lakewood, NJ) for quantitative
determination of total C and N concentrations. Total C and N concentration data for all pre-
harvest and post-site preparation samples were converted to content (Mg ha-1
) using bulk density
for mineral soil and mass for forest floor layers.

32
Statistical Analysis
This study incorporated a split-plot design, where experimental (whole-unit factor)
treatments were the six levels of biomass retention. The subunit factor of the split-plot design
was the two levels of harvest (pre-harvest and post-site preparation). The data collected for this
study were analyzed as a randomized complete block design with four (replicate) complete
blocks. Mean values from the six measurement sub-plots within each treatment within each
block were used to evaluate differences among biomass retention treatments. Differences
between measured response variables among biomass retention treatments, between pre- and
post-site preparation were tested using two-way analysis of variance (ANOVA) procedure for a
split-plot design.
The analysis of variance model (ANOVA) was also used to evaluate the statistical
significance of treatment*harvest (i.e., pre- and post-) and treatment*block interactions. All
effects tested were considered to be significant at the probability level of 0.05. The general linear
model (GLM) procedure within SAS statistical software (Proc GLM, Statistical Analysis
Systems software, version 9.3; SAS Institute Inc. 2010, Cary, NC) was used for all statistical
analyses. Where significant differences in treatments occurred, means were separated using
Tukey's Studentized Range test.

33
Results
Coarse Woody Debris
The mean volume of CWD differed significantly between the six levels of biomass
retention (Table 2.1). However, a means separation test revealed that the volume of coarse
woody debris retained in the 15% and 30% retention treatments was not statistically different.
Though not statistically significant, the trend was for the 30% retention treatments to have
greater volume of coarse woody debris when compared with the 15% retention treatments.
The NOBIOHAR treatments retained the highest volume of coarse woody debris, averaging
254% more volume than the least restrictive (NOBHG) retention treatment. Similarly, the 15%
and 30% retention treatments contained an average of 64% and 130% greater coarse woody
debris volume compared with the NOBHG treatment average.
Forest Floor
Levels of forest floor mass were not statistically different among the six levels of biomass
retention (Table 2.1). In contrast, post-site preparation levels of forest floor mass were
significantly different from pre-harvest levels (Table 2.1). Averaged across treatments, the post-
site preparation forest floor contained 36 Mg ha-1
(166%) greater mass than the pre-harvest forest
floor (Table 2.4). The Oe+Oa component of the pre-harvest forest floor increased 19.3 Mg ha-1
following harvest operations and site-preparation, which contributed the largest increase in mass
to the total post-site preparation forest floor (Table 2.5). Similarly, the FWD component of the
pre-harvest forest floor increased 15.6 Mg ha-1
(Table 2.5).
There was not a statistically significant difference among the six levels of biomass
retention for carbon concentration of each component of the forest floor, yet, carbon

34
concentration decreased significantly in each component of the forest floor from pre-harvest to
post-site preparation (Table 2.1, Table 2.5). Averaged across treatments, the carbon
concentration of the Oi component of the forest floor decreased 30% (an absolute decrease of
135 g kg-1
), which comprised the largest carbon decrease (Table 2.5). Similarly, the Oe+Oa
component of the forest floor experienced a 25% decrease (an absolute decline of 107 g kg-1
) in
carbon concentration (Table 2.5). These results suggest that mixing of the forest floor with
mineral soil may have occurred as a result of harvest operations and site preparation.
The carbon content for each component of the forest floor were not statistically different
among the six levels of biomass retention (Table 2.1). As expected, due to the significant
increase in mass from pre-harvest to post-site preparation, the post-site preparation forest floor
carbon content increased significantly from pre-harvest levels (Table 2.1, Table 2.4). Averaged
across treatments, the total carbon content of the forest floor increased 10.5 Mg ha-1
(113%) from
pre-harvest to post-site preparation (Table 2.4).
The results for total nitrogen followed the same trends as reported for carbon
concentration and content. There was not a statistically significant difference among the six
levels of biomass retention for total nitrogen concentration of each component of the forest floor
(Table 2.2). However, total nitrogen content decreased significantly from pre-harvest to post-site
preparation (Table 2.2, Table 2.7). Averaged across treatments, the total nitrogen concentration
of the Oi component of the forest floor decreased by 9% (an absolute decline of 1.03 g kg-1
)
(Table 2.8). The Oe+Oa component of the forest floor experienced a total nitrogen concentration
decrease of 30% (an absolute decline of 4.33 g kg-1
), which was the largest nitrogen decrease
(Table 2.8).

35
The total nitrogen content for each component of the forest floor were not statistically
different among the six levels of biomass retention (Table 2.2). Similar to the results of forest
floor carbon content, the post-site preparation forest floor nitrogen content increased
significantly from pre-harvest levels (Table 2.2, Table 2.7). Averaged across treatments, the total
nitrogen content of the forest floor increased 213.8 kg ha-1
(77%) from pre-harvest to post-site
preparation (Table 2.7).
Mineral Soil
Total soil organic carbon (SOC) concentration did not differ significantly among the six
levels of biomass retention of pre-harvest or post-site preparation (Table 2.1). Although total
SOC concentration was 2% (1.5 g kg-1
) larger post-site preparation (Table 2.6), this difference
was not statistically significant (Table 2.1).
An evaluation of total SOC on a content basis revealed similar results among the six
levels of biomass retention with no statistical difference between retention treatments (Table
2.1). Interestingly, there was a significant increase in total SOC content from pre-harvest to post-
site preparation (Table 2.1, Table 2.6). Averaged across treatments, the total SOC content
increased 23.9 Mg ha-1
(29%) from pre-harvest to post-site preparation (Table 2.6). This result
was driven by a significant increase in soil bulk density from pre-harvest to post-site preparations
described below.
The results for total soil nitrogen concentration indicate that there was not a statistically
significant difference among the six levels of biomass retention (Table 2.2). Although total soil
nitrogen concentration was 3% (0.10 g kg-1
) smaller post-site preparation (Table 2.9), this
difference was not statistically significant (Table 2.2).

36
The analysis of total nitrogen on a content basis revealed similar results among the six
levels of biomass retention; with no statistical difference between retention treatments (Table
2.2). Similar to the trend for total SOC content, total nitrogen content increased significantly
from pre-harvest to post-site preparation (Table 2.2, Table 2.9). Averaged across treatments, the
total soil nitrogen content increased 0.8 Mg ha-1
(23%) from pre-harvest to post-site preparation
(Table 2.9).
Soil Bulk Density and Particle Size Distribution
Soil bulk density was used as an index to evaluate levels of soil compaction. Neither pre-
harvest nor post-site preparation levels of soil bulk density differed significantly among the six
levels of biomass retention (P = 0.8028). However, soil bulk density increased significantly from
pre-harvest to post-site preparation (P = <0.0001). Averaged across treatments, soil bulk density
increased 30% (0.23 g cm-3
) from pre-harvest levels to post-site preparation (Table 2.6),
indicating that equipment trafficking during harvest and site-preparation compacted the mineral
soil surface horizon.
From the soil selected for particle size distribution analysis, 18% of the 72 samples
analyzed reflected a change in United States Department of Agriculture (USDA) textural class.
Most soils tested resulted in a textural class change from loamy sand to sandy loam, with average
clay increases of 2 – 16% and average silt increases of 2 – 14%. An evaluation of USDA textural
class change in terms of equipment trafficking resulted in 54% of textural class change occurring
in the more aggressive 30% biomass retention and NOBHG treatments. Consequently, the
change in particle size distribution indicates soil mixing occurred during harvest operations and
site preparation; resulting in finer-textures in the mineral soil surface horizon.

37
Discussion
Concerns about the effects of biomass removals on soil properties and long-term site
productivity have arisen in several different contexts associated with intensive forest
management. These include concerns about increased biomass removals during harvest (Scott
and Dean, 2006; Eisenbies et al., 2009; Munsell and Fox, 2010; Berger et al., 2013), shorter
forest rotations (Tullus et al., 2012; Sochacki et al., 2013; Weih, 2004) and the effects of
pinestraw harvesting (Zerpa et al., 2010; Sanchez et al., 2006; Lopez-Zamorara et al., 2001).
Although results vary among the individual studies completed to address these concerns, most
research completed in the Southeast indicate relatively minor impacts on soil conditions and
forest productivity with increased biomass removal.
In a meta-analysis of 53 studies of biomass harvest intensity in boreal and temperate
forests, Thiffault et al. (2011) concluded that there were no universal effects of increased
biomass removals on forest productivity. In the US southeast, Johnson et al. (2001) evaluated the
results of whole-tree versus stem-only harvests; these authors found that most studies did not
indicate reduced productivity following more intensive harvest even though there were clear
changes in total SOC and soil dynamics, particularly immediately following harvest. Similarly,
in a review of the impacts of organic matter removal and soil compaction from 26 long-term soil
productivity sites, Powers et al. (2005) concluded that complete removal of surface organic
matter was responsible for declines in total soil C concentrations in mineral soil surface horizons
(20 cm depth) and reduced nutrient availability; however, these authors also confirmed that
biomass removal had no influence on forest growth 10 years following harvest (Powers et al.,
2005).

38
Fewer studies have specifically evaluated the effects of residue harvest for bioenergy;
however, those studies that have been completed have generally not found major impacts on site
productivity. In two complimentary studies in the Gulf Coastal Plain of the southeastern US,
Scott and Dean (2006) found that harvesting tree crowns in addition to the merchantable bole
resulted in an 18% reduction in biomass accumulation after 7-10 years of forest regeneration;
however, these authors noted that only sites that were unproductive prior to harvest were at risk
of harvest-induced reductions in productivity (Scott and Dean, 2006). In his study on the effects
of forest floor retention and incorporation on soil nitrogen in a regenerating pine plantation,
Zerpa (2010) concluded that decomposition and nutrient release were not significantly affected
by the level of forest floor retention (Zerpa, 2010).
In the present study, we found reductions in total C and N that were consistent with
residue retention treatments, but more often than not, differences were not statistically
significant. The high variability encountered made it difficult to detect significant differences
among treatments. Unlike smaller plots (0.1 to 0.25 ha) used in many field experiments, the
treatment plots in this study approached and exceeded 10 ha in size and encompassed variability
of normal forest operations. Based on the measured data for total SOC, use of a power test
(Kristiansen et al., 2010; Amponsah et al., 1999) suggest that as many as 163 samples might be
required per plot to detect a difference of 10% at the 95% confidence level (Appendix C). These
results, along with results of earlier studies, suggest that statistically identifying impacts of
residue removal using traditional soil sampling approaches will be difficult. Furthermore, this
observed variance calls into question those parts of biomass harvesting guidelines that restrict
removal levels as few specific impacts have been observed. The exception is physical impacts
such as the increase in bulk density observed here. But even in this case reductions in future

39
growth have been rare. Not only may retention level requirements be of limited value, but our
results suggest that enforcing retention levels under operational (or near-operational) conditions
may be difficult due to high variance. It is unlikely that field assessments could realistically
measure tons per hectare of biomass retention in a manner that would indicate compliance or
non-compliance with regulations, at least using the types of currently accepted sampling
approaches as used in this study.

40
References
Akay, A.E., Yuksel, A., Reis, M., and A. Tutus. 2007. The impacts of ground-based logging
equipment on forest soil. Polish J. of Envion. Stud. 16(3): 371-376
Amponsah, G.I., W.L. Meyer, and H.G. Murchinson. 1999. Soil smapling size estimates for soils
under teak (Tectona grandis Linn. F.) plantations and natural forests in Ashanti Region,
Ghana. Can. Journal of Soil Sci. 80: 327-336
Bouyoucos, G.J. 1962. Hydrometer method improved for making particle size
analysis of soils. Agron. J. 54:464-465
Berger, A.L., B. Palik, A.W. D’Amato, S. Fraver, J.B. Bradford, K. Nislow, D. King, and
T. Brooks. 2013. Ecological impacts of energy-wood harvests: lessons from whole-tree
harvesting and natural disturbance. Journal of Forestry. 111(2): 159-153
Burger, J.A., Gray, G., and D.A. Scott. 2010. Using soil quality indicators for monitoring
sustainable forest management. USDA Forest Service Proceedings RMRS-P-59.
p. 13-41.
Eisenbies, M.H., Vance, E.D., Aust, W.M., and J.R. Seiler. 2009. Intensive utilization of
harvest residues in southern pine plantations: quantities available and implications for
nutrient budgets and sustainable site productivity. Bioenergy Res. 2: 90-98
Fisher, R. F., Binkley, D., and W.L. Pritchett. 2000. Ecology and management of forest soils /
Richard F. Fisher, Dan Binkley. (Vol. 3rd ed., pp. xviii, 489 p. :). New York :: John
Wiley.
Fox, T.R., Allen, H.L., Albaugh, T.J., Rubilar, R., and C.A. Carlson. 2007. Tree nutrition
and forest fertilization of pine plantations in the southern United States. South.
J. Appl. For. 31(1): 5-10

41
Greacen, E.L., and R. Sands. 1980. Compaction of forest soils: a review. Austrailian Journal of
Soil Research 18:163-189
Johnson, D.W., and P.S. Curtis. 2001. Effects of forest management on soil C and N storage:
meta analysis. Forest Ecology and Management 140: 227-238
Johnson, D.W., Knoepp, J.D., Swank, W.T., Shan, J., Morris, L.A., Van Lear, D.H., and P.R.
Kapeluck. 2001. Effects of forest management on soil carbon: results of some long-term
resampling studies. Environmental Pollution 116: S201-S208
Kristiansen, S.M., M. Knadel, J. Rowland, and P. Nornberg. 2010. Sampling intensity required
to adequately describe soil variation at three Danish ecosystems: heather, oak, and
spruce. 19th
World Congress of Soil Science, Soil Solutions for a Changing World.
August 1-6, 2010, Brisbane, Austrailia.
Lopez-Zamora, I., M.L. Duryea, C.M. Wild, N.B. Comerford, and D.G. Neary. 2001. Effect of
pine needle removal and fertilization on tree growth and soil P availability in Pinus
elliotti Englem. Var. elliotti stand. Forest Ecology and Management. 148: 725-184
Ludovici, K.H. 2008. Compacting coastal plain soils changes midrotation loblolly pine allometry
by reducing root biomass. Canadian Journal of Forest Resources 38(8): 2169-2176
Milbrandt, A. 2005. A geographic perspective on the current biomass resource availability
in the United States. Technical Report NREL/TP-560-39181. National Renewable
Energy Laboratory, Golden, CO.
Miller, R.E., Colbert, S.R., and L.A. Morris. 2004. Effects of heavy equipment on physical
properties of soils and on long-term productivity: a review of literature and current
research. National Council for Air and Stream Improvement, Research Triangle Park,
NC. Technical Bulletin No. 887 62p.

42
National Oceanic and Atmospheric Administration. 2013. National climatic data center:
Weather station locator [Online]. Available at
http://lwf.ncdc.noaa.gov/oa/climate/stationlocator.html (verified 2 March 2014)
Natural Resource Conservation Service. Accessed 2013. Available at
http://soils.usda.gov/technical/classification/order.html
Nave, L.E., Vance, E.D., Swanston, C.W., and P.S. Curtis. 2010. Harvest impacts on soil carbon
storage in temperate forests. Forest Ecology and Management 259: 857-866
Page-Dumroese, D.S., Jurgensen, M., and T. Terry. 2010. Maintaining soil productivity during
forest or biomass-to-energy thinning harvests in the western United States. West. J. Appl.
For. 25(1): 5-11
Page-Dumroese, D. S., Jurgensen, M. F., Tiarks, A. E., Ponder Jr, F., Sanchez, F. G., and R.L.
Fleming. 2006. Soil physical property changes at the North American Long-Term Soil
Productivity study sites: 1 and 5 years after compaction. Canadian Journal of Forest
Research 36(3): 551-564
Powers, R.F., D.A. Scott, F.G. Sanchez, R.A. Voldseth, D. Page-Dumroese, S.D. Elioff, D.M.
Stone. 2005. The North American long-term soil productivity experiment: fingdings from
the first decade of research. For. Ecol. Manage. 220(3): 31-50
Roise, J.P., Cubbage, F.W., Abt, R.C., and J.P. Siry. 2000. Regulation of timber yield for
sustainable management of industrial forest plantations- theory and practice.
p. 217-255. In K. von Gadow, T. Pakkula, and M. Tomé (ed.) Sustainable
Forest Management. Kluwer Academic Publishers, The Netherlands.
Sanchez, F.G., D.A. Scott, and K.N. Ludovici. 2006. Negligible effects of sever organic matter
removal and soil compaction on loblolly pine growth over 10 years. Forest Ecol. and
Management. 259: 1480-1489

43
Scott, D.A., and T.J. Dean. 2006. Energy trade-offs between intensive bio-mass
utilization, site productivity loss, and ameliorative treatments in loblolly pine plantations.
Biomass and Bioenergy. 30: 1001-1010
Sochacki, S.J., R.J. Harper, K.R. Smelten, B. Dell, and H. Wu. 2013. Evaluating a sustainability
index for nutrients in a short rotation energy cropping system. GCB Bioenergy. 5:
315-326
Thiffault, E., Paré, D., Brais, S., and B.D. Titus. 2010. Intensive biomass removals and site
productivity in Canada: A review of recent issues. The Forestry Chronicle 86(1):36-42
Tullus, A., L. Rytter, T. Tullus, M. Weih, and H. Tullus. 2012. Short-rotation foirestry with
hybrid aspen (Populus tremula L.x P. tremuloides Michx.) in Northern Europe.
Scandanavian Journal of Forest Research 27: 10-29
Weih, M. 2004. Intensive short rotation forestry in boreal climates: present and future
prospectives. Canadian Journal of Forest Research. 34: 1369-1378
Zerpa, J.L., H.L. Allen, R.G. Campbell, J. Phelan, and H. Duzan. 2010. Influence of variable
organic matter retention on nutrient availability in a 10-year-old loblolly pine planatation.
Forest Ecology and Management. 259: 1480-1489

44
Figure 2.1. Location map of the Biomass Harvesting Guideline study area showing the
location of the four BHG research blocks located in Beaufort County, North Carolina.

45
Table 2.1. Statistical summary (probability>F) of biomass retention (BHG) and harvest effects
on total carbon concentrations and contents of the forest floor and mineral soil, and forest floor
mass for North Carolina replicate blocks (Blocks 1 - 4).
Effect
Total Carbon
(P>F) Concentration (P>F) Content (P>F) Mass
---------------- Forest Floor – Oi + (Oe+Oa) + FWD ---------------
Block --
0.211
0.235
BHG Treatment --
0.570
0.681
Harvest --
0.0002
<0.0001
BHG Treatment*Block --
0.562
0.508
BHG Treatment*Harvest --
0.529
0.586
--------------------------- Forest Floor - Oi -----------------------------
Block 0.017
0.288
0.374
BHG Treatment 0.902
0.331
0.310
Harvest <0.0001
0.388
0.423
BHG Treatment*Block 0.764
0.187
0.323
BHG Treatment*Harvest 0.991
0.446
0.410
--------------------------- Forest Floor - Oe+Oa ------------------------
Block 0.015
0.083
0.272
BHG Treatment 0.439
0.664
0.890
Harvest <0.0001
0.007
0.0001
BHG Treatment*Block 0.490
0.608
0.458
BHG Treatment*Harvest 0.614
0.194
0.354
--------------------------- Forest Floor - FWD -------------------------
Block 0.046
0.055
0.055
BHG Treatment 0.898
0.117
0.118
Harvest <0.0001
<0.0001
<0.0001
BHG Treatment*Block 0.615
0.801
0.794
BHG Treatment*Harvest 0.565
0.295
0.297
------------------------------ Mineral Soil -------------------------------
Block 0.002
<0.0001
--
BHG Treatment 0.529
0.374
--
Harvest 0.733
0.0007
--
BHG Treatment*Block <0.0001
0.470
--
BHG Treatment*Harvest 0.253
0.438
--

46
Table 2.2. Statistical summary (probability>F) of biomass retention (BHG) and harvest effects
on total nitrogen concentrations and contents of the forest floor and mineral soil and forest floor
mass for North Carolina replicate blocks (Blocks 1 - 4).
Effect
Total Nitrogen
(P>F) Concentration
(P>F) Content
(P>F) Mass
---------------- Forest Floor - Oi+(Oe+Oa)+SWD ---------------
Block --
0.245
0.235
BHG Treatment --
0.779
0.681
Harvest --
0.0007
<0.0001
BHG Treatment*Block --
0.263
0.508
BHG Treatment*Harvest --
0.707
0.586
-------------------------- Forest Floor - Oi ------------------------
Block 0.155
0.394
0.374
BHG Treatment 0.614
0.362
0.310
Harvest 0.005
0.888
0.423
BHG Treatment*Block 0.419
0.406
0.323
BHG Treatment*Harvest 0.928
0.461
0.410
--------------------- Forest Floor - Oe+Oa --------------------
Block 0.283
0.529
0.272
BHG Treatment 0.567
0.933
0.890
Harvest 0.0004
0.033
0.0001
BHG Treatment*Block 0.528
0.534
0.458
BHG Treatment*Harvest 0.670
0.692
0.354
--------------------- Forest Floor - SWD -----------------------
Block 0.022
0.126
0.055
BHG Treatment 0.581
0.105
0.118
Harvest 0.833
<0.0001
<0.0001
BHG Treatment*Block 0.200
0.725
0.794
BHG Treatment*Harvest 0.384
0.250
0.297
---------------------------- Mineral Soil -------------------------
Block 0.002
<0.0001
--
BHG Treatment 0.407
0.117
--
Harvest 0.590
0.034
--
BHG Treatment*Block <0.0001
0.598
--
BHG Treatment*Harvest 0.376
0.833
--

47
Table 2.3. Post-site preparation mean cubic volume (m3 ha
-1) of coarse-woody debris (CWD) by
BHG treatment designation for North Carolina replicate blocks (Blocks 1 - 4).
BHG Treatment Block 1 Block 2 Block 3 Block 4 Mean Cubic Volume
(m3/ha)
----------------------Cubic Volume (m3 ha-1)-----------------
NOBIOHAR 113.35 52.78 106.36 102.19 93.67 (13.8) a
30RETCLUS 50.70 42.54 86.78 78.55 64.64 (10.7) ab
30RETDISP 34.64 29.64 90.83 73.26 57.09 (14.9) bc
15RETCLUS 34.33 30.13 56.75 76.03 49.31 (10.7) bc
15RETDISP 29.78 33.04 63.88 23.53 37.56 (9.0) bc
NOBHG 20.54 17.46 38.46 29.38 26.46 (4.7) c
† Numbers in parentheses indicate the standard error (SE), where n=4 for each BHG treatment.
** Means with the same letters are not statistically different between biomass retention treatments at the 0.05 level using
Tukey’s means separation procedure.

48
Table 2.4. Pre-harvest and post-site preparation average mass and total carbon content of the
forest floor (Oi + (Oe+Oa) + FWD) by BHG treatment designation for North Carolina replicate
blocks (Blocks 1 - 4).
Forest Floor Mass Forest Floor Total C Content
BHG Treatment Pre-harvest Post-site Prep. Pre-harvest Post-site Prep.
----------------- Mg ha-1 -----------------
-------- Mg ha-1 ---------
NOBIOHAR 21.26 (2.6)
72.68 (15.0)
9.5
25.1
30RETCLUS 18.28 (1.5)
54.89 (3.7)
7.9
17.6
30RETDISP 28.46 (10.4)
53.50 (9.1)
12.0
18.8
15RETCLUS 20.53 (1.8)
47.13 (7.3)
9.1
17.6
15RETDISP 21.00 (2.2)
46.74 (17.6)
9.4
15.8
NOBHG 18.71 (1.0) 66.66 (17.8) 8.2 24.2
† Numbers in parentheses indicate the standard error (SE), where n=4 for each BHG treatment.

49
Table 2.5. Pre-harvest and post-site preparation average mass and total carbon concentration
and content of the forest floor (Oi, Oe+Oa, and FWD) horizons by BHG treatment designation
for North Carolina replicate blocks (Blocks 1 - 4).
Forest Floor Total C Concentration
Forest Floor Mass
Forest Floor Total C Content
BHG Treatment Pre-harvest Post-site Prep. Pre-harvest Post-site Prep. Pre-harvest Post-site Prep.
Oi
----------------- g kg-1 -----------------
--------- Mg ha-1 ---------
-------- Mg ha-1 ---------
NOBIOHAR 465.97 (3.1)
319.6 (56.2)
5.55 (0.5)
9.41 (3.2)
2.58 3.01
30RETCLUS 465.79 (4.3)
330.1 (27.2)
6.03 (0.4)
4.44 (1.3)
2.81 1.47
30RETDISP 467.13 (4.2)
331.6 (22.1)
6.14 (1.0)
4.69 (1.4)
2.87 1.56
15RETCLUS 470.30 (1.6)
351.4 (15.2)
4.01 (1.0)
4.60 (1.6)
1.88 1.62
15RETDISP 472.36 (3.6)
345.3 (45.0)
6.54 (0.5)
7.74 (1.5)
3.09 2.67
NOBHG 465.67 (6.6)
317.8 (31.0)
6.12 (0.5)
7.44 (2.2)
2.85 2.37
Oe+Oa
NOBIOHAR 433.02 (17.5)
295.98 (53.2)
14.40 (2.0)
37.41 (6.1)
6.24 11.07
30RETCLUS 406.86 (10.3)
290.92 (43.4)
11.13 (1.1)
39.60 (7.0)
4.53 11.52
30RETDISP 405.99 (16.2)
283.14 (11.6)
20.94 (9.0)
25.95 (6.8)
8.5 7.35
15RETCLUS 431.14 (21.5)
358.62 (52.4)
15.33 (2.1)
29.35 (8.6)
6.61 10.52
15RETDISP 429.85 (15.1)
294.79 (36.5)
13.41 (1.7)
25.69 (12.8)
5.76 7.57
NOBHG 414.90 (18.9)
357.13 (41.5)
10.90 (1.1)
44.22 (12.1)
4.52 15.79
FWD
NOBIOHAR 480.3 (2.2)
427.3 (17.8)
1.31 (0.4)
25.87 (9.7)
0.63 11.05
30RETCLUS 472.4 (3.9)
428.2 (8.1)
1.13 (0.4)
10.85 (2.8)
0.53 4.65
30RETDISP 466.6 (5.3)
431.7 (7.0)
1.38 (0.5)
22.86 (2.0)
0.64 9.87
15RETCLUS 477.0 (6.1)
414.6 (22.3)
1.20 (0.2)
13.19 (3.8)
0.57 5.47
15RETDISP 481.7 (2.1)
417.6 (27.4)
1.05 (0.2)
13.32 (3.8)
0.5 5.56
NOBHG 480.0 (1.7) 401.3 (15.2) 1.69 (0.5) 15.00 (4.0) 0.81 6.02
† Numbers in parentheses indicate the standard error (SE), where n=4 for each BHG treatment.

50
Table 2.6. Pre-harvest and post-site preparation total carbon concentration and content of the
mineral soil (0 - 15 cm) depth by BHG treatment designation for North Carolina replicate
blocks (Blocks 1 - 4).
Mineral Soil Total C Conc. Mineral Soil Bulk Density Mineral Soil Total C Content
BHG
Treatment Pre-harvest Post-site Prep. Pre-harvest Post-site Prep. Pre-harvest Post-site Prep.
----------------- g kg-1 -------------
--------- g cm-3 ---------
-------- Mg ha-1 ---------
NOBIOHAR 74.0 (13.8) 86.9 (31.1)
0.74 (0.08) 0.87 (0.10)
82.1 112.8
30RETCLUS 94.1 (47.0) 88.3 (44.3)
0.72 (0.14) 0.93 (0.15)
101.6 122.8
30RETDISP 53.5 (9.9) 61.8 (8.0)
0.81 (0.10) 1.09 (0.09)
64.8 100.6
15RETCLUS 47.4 (9.5) 59.7 (14.8)
0.68 (0.06) 1.08 (0.06)
48.3 96.7
15RETDISP 105.7 (57.4) 86.5 (45.0)
0.78 (0.18) 0.87 (0.12)
122.9 112.9
NOBHG 58.7 (6.1) 59.0 (6.1) 0.84 (0.08) 1.03 (0.03) 73.5 90.7
† Numbers in parentheses indicate the standard error (SE), where n=4 for each BHG treatment.

51
Table 2.7. Pre-harvest and post-site preparation average mass and total nitrogen content of the
forest floor (Oi + (Oe+Oa) + FWD) by BHG treatment designation for North Carolina replicate
blocks (Blocks 1 - 4).
Forest Floor Mass Forest Floor Total N Content
BHG Treatment Pre-harvest Post-site Prep. Pre-harvest Post-site Prep.
----------------- Mg ha-1 -----------------
-------- kg ha-1 ---------
NOBIOHAR 21.26 (2.6)
72.68 (15.0)
273.93
617.84
30RETCLUS 18.28 (1.5)
54.89 (3.7)
248.50
487.01
30RETDISP 28.46 (10.4)
53.50 (9.1)
367.10
544.58
15RETCLUS 20.53 (1.8)
47.13 (7.3)
270.45
399.73
15RETDISP 21.00 (2.2)
46.74 (17.6)
271.83
388.24
NOBHG 18.71 (1.0) 66.66 (17.8) 229.27
506.68
† Numbers in parentheses indicate the standard error (SE), where n=4 for each BHG treatment.

52
Table 2.8. Pre-harvest and post-site preparation average mass and total nitrogen concentration
and content of the forest floor (Oi, Oe+Oa, FWD) horizons by BHG treatment designation for
North Carolina replicate blocks (Blocks 1 - 4).
Total N Concentration
Forest Floor Mass
Total N Content
BHG Treatment Pre-harvest Post-site Prep. Pre-harvest Post-site Prep. Pre-harvest Post-site Prep.
Oi
----------------- g kg-1 -----------------
--------- Mg ha-1 ---------
-------- kg ha-1 ---------
NOBIOHAR 12.3 (0.7)
10.8 (1.5)
5.55 (0.5)
9.41 (3.2)
68.27 101.63
30RETCLUS 12.4 (0.7)
11.2 (1.1)
6.03 (0.4)
4.44 (1.3)
74.77 49.73
30RETDISP 10.9 (0.6)
11.2 (0.9)
6.14 (1.0)
4.69 (1.4)
66.93 52.53
15RETCLUS 11.1 (0.6)
10.8 (1.8)
4.01 (1.0)
4.60 (1.6)
44.51 49.68
15RETDISP 11.5 (0.5)
10.7 (1.6)
6.54 (0.5)
7.74 (1.5)
75.21 82.82
NOBHG 11.9 (0.8)
9.2 (0.6)
6.12 (0.5)
7.44 (2.2)
72.83 68.45
Oe+Oa
NOBIOHAR 13.7 (0.9)
9.1 (1.3)
14.40 (2.0)
37.41 (6.1)
197.28 340.43
30RETCLUS 15.0 (0.5)
9.7 (1.5)
11.13 (1.1)
39.60 (7.0)
166.95 384.12
30RETDISP 13.9 (0.6)
13.5 (4.4)
20.94 (9.0)
25.95 (6.8)
291.07 350.33
15RETCLUS 14.3 (0.9)
9.5 (2.0)
15.33 (2.1)
29.35 (8.6)
219.22 278.83
15RETDISP 14.2 (0.7)
9.4 (2.0)
13.41 (1.7)
25.69 (12.8)
190.42 241.49
NOBHG 13.5 (0.9)
7.4 (1.4)
10.90 (1.1)
44.22 (12.1)
147.15 327.23
FWD
NOBIOHAR 6.4 (0.6)
6.8 (1.6)
1.31 (0.4)
25.87 (9.7)
8.38 175.78
30RETCLUS 6.0 (0.7)
4.9 (0.6)
1.13 (0.4)
10.85 (2.8)
6.78 53.17
30RETDISP 6.6 (0.0)
6.2 (0.8)
1.38 (0.5)
22.86 (2.0)
9.11 141.73
15RETCLUS 5.6 (0.5)
5.4 (1.2)
1.20 (0.2)
13.19 (3.8)
6.72 71.23
15RETDISP 5.9 (0.5)
4.8 (0.9)
1.05 (0.2)
13.32 (3.8)
6.2 63.94
NOBHG 5.5 (0.5) 7.4 (1.9) 1.69 (0.5) 15.00 (4.0) 9.3 111.00
† Numbers in parentheses indicate the standard error (SE), where n=4 for each BHG treatment.

53
Table 2.9. Pre-harvest and post-site preparation total nitrogen concentration and content of the
mineral soil (0 - 15 cm) depth by BHG treatment designation for North Carolina replicate
blocks (Blocks 1 - 4).
BHG Treatment Mineral Soil Total N Conc. Mineral Soil Bulk Density Mineral Soil Total N Content
Pre-
harvest Post-site Prep. Pre-harvest Post-site Prep. Pre-harvest Post-site Prep.
----------------- g kg-1 ----------
--- --------- g cm-3 ---------
-------- Mg ha-1 ---------
NOBIOHAR 3.7 (1.1) 3.2 (0.6)
0.74 (0.08) 0.87 (0.10)
4.1 4.2
30RETCLUS 3.9 (1.6) 4.0 (2.0)
0.72 (0.14) 0.93 (0.15)
4.2 5.6
30RETDISP 2.5 (0.2) 2.1 (0.4)
0.81 (0.10) 1.09 (0.09)
3.0 3.4
15RETCLUS 2.3 (0.7) 1.9 (0.4)
0.68 (0.06) 1.08 (0.06)
2.3 3.1
15RETDISP 3.5 (1.9) 4.1 (2.2)
0.78 (0.18) 0.87 (0.12)
4.1 5.4
NOBHG 2.3 (0.3) 2.3 (0.3) 0.84 (0.08) 1.03 (0.03) 2.9 3.5
† Numbers in parentheses indicate the standard error (SE), where n=4 for each BHG treatment.

54
CHAPTER III
Micro-site Evaluation of Harvest Residual Pile Size on Select Soil Quality Indicators in Coastal Plain
Soils of North Carolina and Georgia
_____________________
1Christian W. Hoadley, Daniel Markewitz, and Lawrence Morris. To be submitted to Biomass and Bioenergy.

55
Abstract
The removal of harvest residues has the potential to negatively affect site productivity in terms of
soil quality. Given the potential role that the Southeast may have to supply biomass for energy
production, understanding the effects that biomass harvests have on soil quality and site
productivity is fundamental to sound management. The objective of this study was to investigate
and quantify relationships between soil quality and piling of harvest residues on soil moisture,
soil temperature, soil respiration, total soil organic carbon (SOC), and total nitrogen at a micro-
site scale. We classified residues piles in small, medium, and large classes and determined soil
attributes at different distances from the piles. Although results varied between study locations,
there was a significant effect of harvest-residue pile size on soil volumetric moisture content.
Average soil moisture was slightly higher for medium sized residue piles compared to large and
small piles. In general, the relationship between soil moisture and distance from the base of
residue piles was not significant. Soil temperature was not affected by residue pile size over the
measurement period. However, observed soil temperature increased with distance from the base
of residue piles. There was a significant effect of residue pile size on average soil respiration.
Average soil respiration results were slightly higher for medium residue piles in North Carolina
and large piles in Georgia. Soil respiration varied with residue pile size and study location;
however, the trend was for soil respiration to decrease or remain relatively static with distance
from each residue pile. There was not a significant effect of pile size on total SOC concentration.
Similarly, for the North Carolina study location there was not a significant linear relationship
between total SOC concentration and distance. However, the observed trend was for total SOC
concentration to increase or remain relatively static. The least-squares regression results for
Georgia were very different; two of the three pile size designations had a significant linear

56
relationship between total SOC and distance. There was not a significant effect of residue pile
size on the average total soil N concentration for North Carolina. Interestingly, there was an
effect of pile size on total soil N concentration for the Georgia study location. The medium size
piles had higher levels of total N compared to the large and small piles. There were no significant
linear relationships between total soil N and distance for the North Carolina location; however,
the observed trend was for total N to increase or remain relatively static. In Georgia, the four
medium residue piles demonstrated a significant decrease in total N with increasing distance
from the pile.
INDEX WORDS: Forest Harvest Residue, Biomass Harvest, Soil Temperature, Soil Moisture, Soil
Respiration, Residue Piles

57
Introduction
Intensively managed loblolly pine (Pinus taeda L.) plantations of the southeastern United
States provide a number of traditional forest products. Recently increased interest in the
production of renewable energy has made traditionally non-merchantable harvest residuals (e.g.,
foliage, branches, cull trees) remaining after timber harvest a potential merchantable product as
feedstock for biomass energy production. However, the removal of this material while harvesting
a site has the potential to negatively affect site productivity in terms of soil quality (Scott and
Dean, 2006; Eisenbies et al., 2009).
The southern United States comprises over 90 million hectares of forested landscape, of
which 13 to 20 million hectares are intensively managed, and contain an estimated 33% of the
country’s industrial wood plantations (Eisenbies et al., 2009; Roise et al., 2000). A review of the
current literature suggests that at a national level, 57 million Mgdry of forestry feedstock residues
could be available annually. From the national total, the southeast and south-central United
States are estimated to contribute a total of 32 million Mgdry forest residues (Milbrant, 2005).
Given the potential role that the Southeast may have to supply forest residues for energy
production, understanding the effects that biomass harvests may have on soil quality and site
productivity in the region is paramount.
In addition to the total amount of residues removed or retained during bioenergy harvests,
the distribution and piling of retained residues may influence measures of site productivity and
ecosystem biodiversity. At a microclimate scale, observed effects of woody debris and organic
material retention include shading and insulation of the soil surface horizon from seasonal
temperature extremes (Devine and Harrington, 2007; Roberts et al., 2005; Proe et al., 2004),
conservation of soil moisture (Roberts et al., 2005; O’Connell et al., 2004), moderation of near-

58
ground air temperature extremes (Devine and Harrington, 2007), decreases in competing
vegetation (Roberts et al., 2005), and increased rates of soil respiration (Gough and Seiler, 2004).
A recent study that investigates the influence of harvest residues and vegetation on
microsite soil and air temperatures concluded that the mean annual soil temperature and diurnal
range in soil temperatures were greater on sites with exposed mineral soil when compared with
sites with an intact forest floor or coarse-woody debris (CWD) and intact forest floor over
mineral soil (Devine and Harrington, 2007). In the same study, Devine and Harrington (2007)
reported that microsite near-ground air temperatures were not significantly different between
surface debris retention treatments. Similarly, a study that examined the effects of harvest
residue retention and competing vegetation on soil moisture and soil temperature concluded that
treatment plots with harvest residue removal experienced increased soil temperatures and
decreased volumetric soil moisture in the 0-20 cm depth increment (Roberts et al., 2005).
The objective of this study was to quantify relationships between piling of post-harvest
residues and soil moisture, soil temperature, soil respiration, total soil organic carbon, and total
nitrogen at a microsite scale. We hypothesized that post-harvest residue pile-size would have a
significant effect on measured parameters of soil quality. Specifically, we hypothesized that soil
moisture, total soil organic carbon (SOC), total nitrogen, and soil respiration would increase with
pile-size, while soil temperature would decrease. Additionally, we anticipated that the pile-size
effect on measured parameters would dissipate with distance from the base of each pile.

59
Materials and Methods
Site Description and Study Design
To evaluate possible micro-site relationships that may exist between forest soils and piled
harvest-residuals, three sites were selected in the Atlantic Coastal Plain. The sites were located in
Beaufort County, North Carolina (35° 35’ N 76° 56’ W), Glynn County, Georgia (31° 10’ N 81°
40’ W), and Effingham County, Georgia (32° 19’ N 81° 10’ W). The climate of Beaufort is
described as being mild with an average growing season (April – October) temperature of 21.8°C
and average growing season rainfall of 829 mm (NOAA, 2013). The climates of both Glynn
County and Effingham County are classified as humid sub-tropical, with an average growing
season (April – October) temperature of 24.5°C, and average growing season rainfall of 835 mm
(NOAA, 2013).
The predominant soil series for the Beaufort County sites, as mapped by the Natural
Resource Conservation Service (NRCS), include Bayboro loam, Leaf silt loam, and Pantego
loam, which are derived from unconsolidated sands and clays of sedimentary origin (NRCS,
2013). These soils range from poorly drained to very poorly drained Ultisols, which are common
in the Atlantic Coastal Plain, and often require engineered drainage features and additional site
preparation (bedding) prior to stand establishment. The Bayboro loam and Pantego loam
(Thermic Umbric Paleaquults) are characterized by a loam surface horizon (umbric epipedon)
and clay or sandy clay loam subsurface (argillic) horizon. In contrast, the Leaf silt loam
(Thermic Typic Albaquult) has a silt loam surface horizon (ochric epipedon) and clay to clay
loam subsurface (argillic) horizon.
The predominant soil series mapped by the NRCS for the Glynn and Effingham County
sites include Bladen fine sandy loam, Meggett fine sandy loam, Rains fine sandy loam, and
Sapelo fine sand (NRCS, 2013). These soil range from somewhat poorly drained to poorly

60
drained Ultisols, Alfisols, and Spodosols. The poor drainage of these soils require the use of
bedding, which is common practice in the upper and lower Coastal Plain and flatwoods of
Georgia. The Bladen fine sandy loam (Thermic Typic Albaquult) and Rains fine sandy loam
(Thermic Typic Paleaquult) are both Ultisols, which feature a fine sandy loam to sandy loam
surface horizon (ochric epipedon) and sandy clay loam (Rains), sandy clay to clay (Bladen)
subsurface (argillic) horizon. Both the Rains and Bladen soil series typically feature a leached
illuvial (albic) E horizon in their profile. Similarly, the Meggett fine sandy loam (Thermic Typic
Albaqualf) also features a fine sandy loam (ochric epipedon) surface horizon and clay or sandy
clay (argillic) subsurface horizon, however, the Meggett series with a base saturation of >35% is
classified as an Alfisol. Finally, the Sapelo fine sands (Thermic Ultic Alaquod) typical profile is
characterized as having a fine sand (ochric epipedon) surface horizon, a fine sand (spodic)
horizon, and a sandy clay loam (argillic) horizon.
The Beaufort County, North Carolina sites were previously planted in loblolly pine
(Pinus taeda L.), which was managed for sawtimber production. The stands were 36 years old at
the time of harvest and each stand received two thinning treatments during the rotation, and mid-
rotation mechanical vegetation control. Following a clear cut harvest in the winter of 2010-11,
each of four separate research blocks was sheared with a v-blade, bedded, and then hand planted
during the winter of 2011-12. Additionally, each block received an aerial chemical application of
10 gallons per acre solution of 48 oz acre of Chopper + 12.8 oz acre of Red River Supreme
surfactant for herbaceous weed control in June of 2012. The active ingredient of Chopper, EPA
Registration number 241 – 296, is an Isopropylamine salt of Imazapyr.

61
The Glynn County, Georgia sites, originally owned and planted in loblolly pine by Union
Camp Corporation, are currently managed by Plum Creek Timber Company, Inc. for a timber
investment group. Unfortunately, there was not a transfer of stand management information
beyond establishment and thinning dates. Two of the three research blocks were thinned at age
15 and timber clear cut at age 26. The third research block was never thinned during the rotation
and was clear cut at age 33.
To evaluate the potential effects that harvest residue piling might have on adjacent forest
soils, ten residue piles were randomly selected and located within the eight biomass harvesting
guideline (BHG) research blocks, established for a biomass retention study, from each state for a
total of 20 piles. The harvest residue piles were visually classified as small, medium, and large
piles following a protocol established by North Carolina State University for the wildlife
component of the biomass retention study (Fritts, 2014). Each pile was systematically located
with a field portable Garmin eTrex Summit HC GPS receiver (Garmin International, Inc.,
Olathe, KS), monumented with painted 2 m rebar, driven 1 m into the adjacent soil, and given a
unique identification for ease of locating during subsequent field excursions. A total of 4 large, 3
medium and 3 small piles were established in the North Carolina research blocks. Similarly, 3
large, 4 medium and 3 small piles were established in the Georgia research blocks.
At each pile study location, a 12 m linear transect was established perpendicular to the
base of the pile; a total of nine sample locations were identified and monumented with labeled
fluorescent-orange stake flags. The first three sample locations were situated 0, 0.5, and 1-m
from the base of the pile. The remaining six sample locations were situated near the center of
each bed and interbed intersected by the transect line, at distances of approximately 2.6, 4.5, 5.7,
7.9, 9.7, and 11.4-m from the base of the residue pile.

62
Field Collection
Mineral soil samples, from the surface 0 to 15 cm depth increment, were collected during
the summer of 2012 from both the North Carolina and Georgia pile study locations. Samples
were obtained for each linear transect, from each of the nine sample points, using a 2 cm inside
diameter Oakfield probe. The Oakfield probe was used to remove six to eight draws of soil,
which were combined into a composite sample and stored in a standard Cooperative Extension
soil sample bag.
To investigate micro-site relationships that may exist between harvest residue piling and
forest soil moisture, time domain reflectometry (TDR) was used to estimate the volumetric
moisture content of the 0 to 15 cm depth. A FieldScout TDR 100 Soil Moisture Meter with 20.32
cm probes (Spectrum Technologies, Inc., Plainfield, IL) was used to measure the average
volumetric moisture content (%) from each of the nine sample points at each transect for the
North Carolina and Georgia pile study locations. Measurements of volumetric moisture content
were conducted several times over the duration of a year, beginning in summer 2012 and ending
summer 2013. At the North Carolina research blocks, volumetric water content was measured on
six separate occasions from July 2012 to July 2013. Similarly, volumetric water content was
measured at the Georgia research blocks on six separate occasions from July 2012 to August
2013.
In addition to soil moisture, this study also investigated the effects of harvest residue
piling on soil temperature. At each of the pile study locations, temperature data loggers
(Embedded Data Systems, Inc., Model – Thermochron ibutton DS1921-G, Lawrenceburg, KY)
were installed in the surface 0 to 15 cm depth increment at the 0, 0.5, and1-m, and 1st bed (2.6
m) locations. Data loggers were programmed to measure and record soil temperature every four

63
hours for a total of six daily measurements. Soil temperature data was retrieved, archived, and
data-loggers re-programmed on six separate occasions to provide a continuous soil temperature
dataset from summer 2012 to summer 2013. Data retrieval was completed on the same dates
previously introduced for volumetric moisture content at the North Carolina and Georgia pile
study locations.
To evaluate the influence that harvest-residue piling may have on microbial activity in
forest soils, this study investigated the amount of soil respiration (hereafter, CO2 efflux) from the
soil over the course of a year following harvest-residue pile creation. A LI-6400 infrared gas
analyzer with a LI-6400-09 soil respiration chamber (LI-COR Environmental, Lincoln, NE) was
used to estimate the rate of soil respiration at each of the harvest-pile study locations.
Measurements of CO2 efflux (µmol CO2 m-2
s-1
) were made at each of the nine sample points on
six separate occasions beginning in summer 2012 and ending in summer 2013.
Sample Preparation and Data Analyses
All mineral soil samples collected for the pile-size study were transported from the field
to the Phillips Wood Utilization Lab in, Athens, Georgia. All composite soil samples were air-
dried, separated from rocks and roots and sieved through a 2-mm mesh screen. A SPEX 8000
ball mill grinder (Spex SamplePrep, LLC, Metuchen, NJ) was used to pulverize approximately 2
g of composite mineral soil sample in preparation for chemical analysis. A subsample of each
ground mineral soil sample (0.095-0.099 g) was combusted using a CHN elemental analyzer (CE
Instruments – model NC2100, CE Elantech Inc., Lakewood, NJ) for quantitative determination
of total C and N concentrations.

64
Statistical Analysis
To evaluate the effect of harvest-residue pile size on adjacent forest soil, measurements
of volumetric moisture content (%), soil temperature (°C), and CO2 efflux (µmol CO2 m-2
s-1
)
were averaged for each residue-pile to obtain an annual mean for each measurement location.
The resulting data were analyzed as a two-way ANOVA using the Statistical Analysis System
(SAS) general linear model (GLM) procedure (Proc GLM, Statistical Analysis Systems software,
version 9.3; SAS Institute Inc. 2010, Cary, NC). In addition, the lab results for percent total soil
organic carbon (SOC) and percent total nitrogen (N) were analyzed using the same statistical
procedure. Differences among pile-size effects were evaluated using Tukey’s means separation
procedure when significant differences (α=0.05) were indicated by the SAS procedure.
Least-squares regression was used to evaluate the distance effect that the piling of
harvest-residues have on adjacent soil. The mean volumetric moisture content (%), soil
temperature (°C), CO2 efflux (µmol CO2 m-2
s-1
), total SOC (%), and total N (%) for each sample
point located within an interbed area (0, 0.5, 1.0, 4.5, 7.9, and 11.4-m) were regressed with
distance for both North Carolina and Georgia study locations. For each pile-size designation, the
least-squares regression equation and coefficient of determination (R2) were obtained from the
linear-regression. Additionally, a one-way ANOVA procedure was used to test whether a
significant linear relationship existed (α=0.05) between each measured variable and distance
from the base of each pile.
65
To further evaluate the effect of harvest-residue piling and distance, a one-way ANOVA
was used to analyze mean values of all measured variables on soil immediately adjacent to each
residue-pile at the 0, 0.5, and 1.0-m sample point locations from each transect. The ANOVA
procedure was conducted using the data analysis tool in Microsoft Excel (Microsoft Excel, 2007
edition; Microsoft 2007, Redmond, WA). Statistical significance was conferred at the α=0.05
level.
Finally, to investigate the effect that harvest-residue piling had on bed locations
compared to interbed locations, a standard t-test procedure was performed on the sample means
for bed and interbed areas from each residue-pile using the Statistical Analysis System (SAS) t-
test procedure (Proc TTEST, Statistical Analysis Systems software, version 9.3; SAS Institute
Inc. 2010, Cary, NC). Again, statistical significance was conferred at the α=0.05 level.
Results
Soil Moisture
As expected, there was a significant effect of residue-pile size on volumetric soil
moisture among the three pile size designations in both the North Carolina and Georgia study
locations (Table 3.1). The average soil moisture was slightly higher for the medium residue piles
in North Carolina compared to the large and small residue piles over the measurement period
(Table 3.2). At the Georgia study locations, the average soil moisture was slightly higher for the
medium residue piles compared to the large residue piles; however, average volumetric soil
moisture was not significantly different between medium and small pile size designations (Table
3.2).
66
In general, volumetric moisture content (VMC), from North Carolina and Georgia
followed opposite trends of increasing and decreasing moisture content moving away from the
base of each pile, respectively (Figures 3.1, Figure 3.2). However, the only least-squares
regression to have a significant linear relationship between VMC and distance was for the three
small residue piles in North Carolina (Figure 3.1), and the three large residue piles from Georgia
(Figure 3.2). The least-squares regression for the three medium residue piles in North Carolina
resulted in a moderately significant linear relationship between VMC and distance (Figure 3.1).
Similarly, the four medium residue piles in Georgia demonstrated a marginally significant linear
relationship (Figure 3.2). The one-way ANOVA comparing VMC in soil immediately adjacent to
each pile indicated that no significant differences exist among the 0, 0.5, and 1.0-m sample
locations for the large, medium, or small pile size designations in either the North Carolina or
Georgia study location (Table 3.3). The comparison of VMC between bed and interbed sample
locations resulted in seven and six of the ten residue piles having significantly higher moisture
content in interbed areas for North Carolina and Georgia, respectively (Table 3.4).
Soil Temperature
There was not a significant effect of residue pile size on average soil temperatures over
the measurement period for either the North Carolina or Georgia study locations (Table 3.1).
Although not statistically significant, soil temperature increased with distance from the base of
each residue pile size class in both the North Carolina and Georgia study locations (Figure 3.3,
Figure 3.4). The least-squares regression for the four medium and three small residue piles in
Georgia resulted in moderately significant linear relationship between soil temperature and
distance (R2=0.89, p=0.06) and (R
2=0.83, p=0.09), respectively. The results of the one-way

67
ANOVA comparing soil temperature immediately adjacent to each pile resulted in no significant
differences among the 0, 0.5, and 1.0-m sample locations for the large, medium, or small pile
size classes in either the North Carolina or Georgia study locations (Table 3.5).
Soil Respiration
There was a significant effect of residue pile size on average soil respiration over the
measurement period at both the North Carolina and Georgia study locations (Table 3.1). The
average soil respiration was slightly higher for the medium residue piles in North Carolina
compared to the small and large piles; however, there was not a significant difference in average
soil respiration between the medium and large residue piles (Table 3.6). At the Georgia study
locations, average soil respiration was slightly higher for the large residue piles compared to the
small and medium residue piles; however, the average soil respiration was not significantly
different between the large and medium residue piles (Table 3.6).
Soil respiration varied between residue-pile size and study location; however, the trend
was for soil respiration to decrease or remain relatively unchanged with distance from each pile
(Figures 3.5, Figure 3.6). The least-squares regression for the three medium residue piles
(R2=0.70, p=0.04) and three large residue piles (R
2=0.72, p=0.03), from the North Carolina and
Georgia study locations, respectively, resulted in a significant linear-relationship between soil
respiration and distance (Figure 3.5, Figure 3.6). There were no significant differences in soil
respiration among the 0, 0.5, and 1.0-m sample locations for both the North Carolina and
Georgia study locations (Table 3.7).

68
For the North Carolina pile study, soil respiration was significantly different in the
comparison between bed and interbed locations, with a significant increase in CO2 efflux from
interbed locations (Table 3.8). However, the comparison between bed and interbed locations in
Georgia did not indicate a significant difference between rates of soil respiration (Table 3.8).
Total Organic Carbon
There was not a significant effect of pile size on average soil organic carbon at either the
North Carolina or Georgia study locations (Table 3.1). For the North Carolina locations there
was not a significant linear relationship between total SOC concentration and distance. However,
the observed trend was for total SOC concentrations to increase or remain relatively static
(Figure 3.7). The least-squares regression results for the Georgia pile study locations were very
different, with two of the three pile size designations having a significant linear relationship
between total SOC and distance. The three small residue piles experienced an increase in total
SOC concentration with distance (R2 = 0.66, p = 0.05) (Figure 3.8). Conversely, the three large
residue piles experienced a significant decrease in total SOC concentration with distance (R2 =
0.65, p = 0.05) (Figure 3.8). The four medium residue piles showed a trend of decreased total
SOC concentration with distance, however, this result was not statistically significant (R2 = 0.53,
p = 0.10) (Figure 3.8). There were no significant differences in total SOC among the 0, 0.5, and
1.0-m sample locations for both the North Carolina and Georgia study locations (Table 3.9).
Similarly, the comparison between bed and interbed locations did not result in any significant
difference in total SOC concentration (Table 3.10).

69
Total Nitrogen
There was not a significant effect of residue pile size on the average total soil N
concentration among the three pile size designations in North Carolina (Table 3.1). Interestingly,
there was an effect of residue pile size on average total soil nitrogen for the Georgia study
location (Table 3.1). There were no significant linear relationships between total soil nitrogen
and distance among the three pile size designations for the North Carolina study locations.
However, the observed trend was for total soil N to increase or remain relatively static (Figure
3.9). The least-squares regression results for the Georgia study locations varied, but one of the
three pile sizes revealed a significant linear relationship. The four medium residue piles
experienced a significant decrease in total soil N concentration with distance (R2 = 0.65, p =
0.05) (Figure 3.10). Similarly, the three large residue piles demonstrated a decrease in total soil
N concentration with distance, however, this result was not statistically significant (R2 = 0.44, p
= 0.15) (Figure 3.10). There were no significant differences in total soil nitrogen concentrations
among the 0, 0.5, and 1.0-m sample locations for either the North Carolina or Georgia study
locations (Table 3.11). Similarly, the comparison between bed and interbed locations did not
result in any significant difference in total nitrogen concentration (Table 3.12).

70
Discussion
The availability of soil water can play a vital role in successful forestry operations. When
soil moisture is reduced to critically low levels, tree growth can be adversely affected by
inhibiting cell elongation, slowing the production of carbohydrates, reducing the transport rate of
auxins and solutes; combined these factors can cause reductions in cambial activity (Buckingham
and Woods, 1969). In their study on the effects of soil moisture stress on terminal elongation in
loblolly pine and shortleaf pine seedlings, Stansky and Wilson (1964) concluded that terminal
elongation in loblolly pine seedlings was drastically reduced when soil moisture tension
approached 3.5 atmospheres (atm); furthermore, visible wilting of new flush occurred when soil
moisture tension approached 5 atm, followed by seedling mortality when soil moisture tension
levels surpassed 5 atm.
Previous research has provided evidence that suggests that retention of harvest residues
conserves soil moisture. Work by Roberts et al. (2005) showed that treatment plots with harvest
residue removal experienced increased soil temperatures and decreased volumetric soil moisture
in the 0-20 cm depth increment. In this study there was a significant effect of harvest residue pile
size on soil moisture in the 0 – 15 cm depth. However, the relationship between pile size and soil
moisture provided unexpected results. The average soil moisture was significantly higher for the
medium pile size designation compared to large piles for both North Carolina and Georgia study
locations. These results may be influenced by differences in soil physical properties, surface
temperatures, and abundance of competing vegetation. Another factor that may contribute to
these results is differences in pile composition; piles with different proportions of coarse-woody
debris, fine-woody debris, and mineral soil may influence soil moisture relations.

71
The relationship between soil moisture and distance from the base of residue piles varied
between study locations. These results may have been influenced by differences in site-
preparation methods. In Georgia, harvest-residues were pushed into long windrows during
bedding operations. The North Carolina study location had harvest-residues purposely
distributed in smaller piles and clusters over treatment areas. There was not a strong relationship
between distance from pile and soil moisture content in the study results. Again, differences in
soil physical properties, surface temperatures, and abundance of competing vegetation may have
influenced these results.
Soil temperature influences many forest processes including seed germination, seedling
shoot and root development, hydraulic conductivity and water use, microbial activity, and
mineralization of soil nutrients (Fisher et al., 2000; Carson and Miller, 1990; Van Cleve et al.,
1990; Lopushinsky and Max, 1990). The management of harvest residues has been demonstrated
to have an impact on soil temperature regimes. Recently harvested areas have altered solar
radiation and wind patterns that influence diurnal fluctuations in temperature extremes (Fisher et
al., 2000). Devine and Harrington (2007) showed that removal of harvest residues resulted in
significantly higher soil temperature compared to soils where harvest residues had been retained.
Results from this study on the effects of harvest residue pile size on soil temperature were not
statistically significant. Similarly, the relationship between distance from residue pile and soil
temperature was not significant. Although not statistically significant, soil temperature increased
with distance from the base of each residue pile in both the North Carolina and Georgia study
locations.

72
Soil microbial respiration of CO2 from the decomposition of organic matter in soil
represents a large flux of carbon from forested ecosystems. Previous research has provided
evidence that suggests that forest disturbance can alter microbial communities and the
biogeochemical cycling of carbon. In a recent meta-analysis of soil microbial biomass responses
to forest disturbance, Holden and Treseder (2013) concluded that forest harvests were
responsible for significant reductions (19%) in microbial biomass. Conversely, Noormets et al.
(2012) showed that an immediate pulse of organic matter following harvest resulted in a 60%
increase in heterotrophic respiration. In this study there was a significant effect of residue pile
size on average soil respiration; however, similar to the results for soil moisture the relationship
between soil respiration and pile size provided unexpected results. The medium pile size
designation in North Carolina had significantly higher rates of soil respiration compared to small
and large sized piles. In Georgia, the large pile size designation soil respiration rate was
significantly higher than that of either the medium or small piles.
Overall, the relationship between soil respiration and distance from the pile was not
significant; however, the trend was for soil respiration to decrease or remain relatively
unchanged with distance from each pile. Additionally, significantly higher rates of soil
respiration in interbed areas were observed where harvest residues were concentrated. The trend
of decreased soil respiration with distance, and increased rates of respiration in interbed areas
suggest that piling of harvest residues may provide soil conditions conducive to increased
microbial activity.

73
The effects of harvest residue pile size on total soil organic carbon and total nitrogen
were not statistically significant. The relationships between total soil organic carbon, total
nitrogen, and distance from the pile varied greatly between study locations and pile size
designations. This variability is difficult to explain; however, differences in site preparation, soil
physical properties, sampling and analytical error may have influenced these results.
74
References
Buckingham, F.M. and F.W. Woods. 1969. Loblolly pine (Pinus taeda L) as influenced by soil moisture
and other environmental factors. Journal of Applied Ecology 6(1):47-67
Carson, W.C., and D.E. Miller. 1990. Target seedling root system size, hydraulic conductivity, and water
use during seedling establishment. General Technical Report RM - Rocky Mountain Forest and
Range Experiment Station. U.S. Department of Agriculture, Forest Service no. 200:53-65
Devine, W.D., and C.A. Harrington. 2007. Influence of harvest residues and vegetation on
microsite soil and temperatures in a young conifer plantation. Agriculture and Forest
Meteorology 145:125-138
Eisenbies, M.H., Vance, E.D., Aust, W.M., and J.R. Seiler. 2009. Intensive utilization of harvest
residues in southern pine plantations: quantities available and implications for nutrient
budgets and sustainable site productivity. Bioenergy Res. 2: 90-98
Fisher, R. F., Binkley, D., and W.L. Pritchett. 2000. Ecology and management of forest soils / Richard F.
Fisher, Dan Binkley. (Vol. 3rd ed., pp. xviii, 489 p. :). New York :: John Wiley.
Gough, M.G., and J.R. Seiler. 2004. The influence of environmental, soil carbon, root, and stand
characteristics on soil CO2 efflux in loblolly pine (Pinus taeda L.) plantations located on
the South Carolina coastal plain. Forest Ecology and Management 191:353-363
Holden, S.R., and K.K. Tresder. 2013. A meat-analysis of soil microbial responses to forest
distrubance. Front. In Microbio. 4:163
Lopushinsky, W., and T.A. Max. 1990. Effect of soil temperature on root and shoot growth and
on budburst timing in conifer seedling transplants. New Forests 4(2):107-124

75
Milbrandt, A. 2005. A geographic perspective on the current biomass resource availability
in the United States. Technical Report NREL/TP-560-39181. National Renewable
Energy Laboratory, Golden, CO.
Noormets, A., McNulty, S.G., Domec, J., Gavsazzi, M., Sun, G., and J.S. King. 2012. The role of
harvest residue in rotation cycle carbon balance in loblolly pine plantations. Respiration
partitioning approach. Global Change Biology 18L:3186-3201
O’Connell, A.M., Grove, T.S., Mendham, D.S., and S.J. Rance. 2004. Impact of harvest residue
management on soil nitrogen dynamics in eucalyptus globules plantations in western
Autrailia. Soil Biol. Biochem 36:39-48
Proe, M.F., and J. Dutch. 1994. Impact of whole-tree harvesting on second-rotation growth of
sitka spruce: the first 10 years. For. Ecol. Manage. 66:39-54
Roberts, S.D., Hurrington, C.A., and T.Terry. 2005. Harvest residue and competing vegetation
affect soil moisture, soil temperature, N availability, and douglas-fir seedling growth.
Forest Ecology and Management 205:333-350
Roise, J.P., Cubbage, F.W., Abt, R.C., and J.P. Siry. 2000. Regulation of timber yield for
sustainable management of industrial forest plantations- theory and practice.
p. 217-255. In K. von Gadow, T. Pakkula, and M. Tomé (ed.) Sustainable
Forest Management. Kluwer Academic Publishers, The Netherlands.
Scott, D.A., and T.J. Dean. 2006. Energy trade-offs between intensive bio-mass
utilization, site productivity loss, and ameliorative treatments in loblolly
pine plantations. Biomass and Bioenergy. 30: 1001-1010
Stransky, J.J., and D.R. Wilson. 1964. Terminal elongation of loblolly pine and shortleaf pine
seedlings under soil moisture stress. Proc. Soil Sci. Soc. Am. 28:439-440

76
Van Cleve, K., Oechel, W.C., and J.L. Hom. 1990. Response of black spruce (Picea mariana)
ecosystems to soil temperature modification in interior Alaska. Canadian Journal of
Forest Research 20(9):1530-1535

77
Figure 3.1. Least-squares regression of mean volumetric moisture content for the interbed sample
points of the North Carolina pile-size study transects (large, medium, small).
5.0
10.0
15.0
20.0
25.0
30.0
0 2 4 6 8 10 12
Volu
met
ric
Mois
ture
Con
ten
t (%
)
Distance from Pile (m)
Large 1
Large 2
Large 3
Large 4 ŷ = 19.90-0.065x, R2 = 0.16, P = 0.43
A
5.0
10.0
15.0
20.0
25.0
30.0
0 2 4 6 8 10 12
Volu
met
ric
Mois
ture
Con
ten
t (%
)
Distance from Pile (m)
Medium 1
Medium 2
Medium 3 ŷ = 18.69+0.365x, R2 = 0.54, p = 0.09
B
5.0
10.0
15.0
20.0
25.0
30.0
0 2 4 6 8 10 12
Volu
met
ric
Mois
ture
Con
ten
t (%
)
Distance from Pile (m)
Small 1
Small 2
Small 3
C
ŷ = 15.16+0.326x, R2 = 0.66, p = 0.04

78
Figure 3.2. Least-squares regression of mean volumetric moisture content for the interbed sample
points of the Georgia pile-size study transects (large, medium, small).
5.0
10.0
15.0
20.0
25.0
30.0
0 2 4 6 8 10 12
Volu
met
ric
Mois
ture
Con
ten
t (%
)
Distance from Pile (m)
Large 1
Large 2
Large 3
ŷ = 11.64-0.213x, R2 = 0.65, p = 0.05
A
5.0
15.0
25.0
35.0
45.0
0 2 4 6 8 10 12
Volu
met
ric
Mois
ture
Con
ten
t (%
)
Distance from Pile (m)
Medium 1
Medium 2
Medium 3
Medium 4
ŷ = 19.77-0.285x, R2 = 0.53, p = 0.10
B
5.0
10.0
15.0
20.0
25.0
30.0
0 2 4 6 8 10 12
Vou
met
ric
Mois
ture
Con
ten
t (%
)
Distance from Pile (m)
Small 1
Small 2
Small 3
ŷ = 16.85-0.365x, R2 = 0.32, p = 0.25
C

79
Figure 3.3. Least-squares regression of mean annual soil temperature for the interbed sample
points of the North Carolina pile-size study transects (large, medium, small).
12.0
14.0
16.0
18.0
20.0
22.0
0 1 2 3 4 5
Soil
Tem
pera
ture
(°C
)
Distance from Pile (m)
Large 1
Large 2
Large 3
Large 4
ŷ = 16.05 + 0.0385x, R2 = 0.0183, P = 0.86
A
10.0
12.0
14.0
16.0
18.0
20.0
22.0
0 1 2 3 4 5
Soil
Tem
pera
ture
(°C
)
Distance from Pile (m)
Medium 1
Medium 2
Medium 3
ŷ = 15.165 + 0.3437x, R2 = 0.61, P = 0.18
B
12.0
14.0
16.0
18.0
20.0
22.0
0 1 2 3 4 5
Soil
Tem
pera
ture
(°C
)
Distance from Pile (m)
Small 1
Small 2
Small 3
ŷ = 16.041+ 0.1533x, R2 = 0..66, P = 0.14
C

80
Figure 3.4. Least-squares regression of mean annual soil temperature for the interbed sample
points of the Georgia pile-size study transects (large, medium, small).
18.0
19.0
20.0
21.0
22.0
23.0
0 1 2 3 4 5
Soil
Tem
pera
ture
(°C
)
Distance from Pile (m)
Large 1
Large 2
Large 3
ŷ = 20.644+ 0.1392x, R2 = 0.62, P = 0.21
A
18.0
19.0
20.0
21.0
22.0
23.0
0 1 2 3 4 5
Soil
Tem
pera
ture
(°C
)
Distance from Pile (m)
Medium 1
Medium 2
Medium 3
Medium 4
ŷ = 20.341+ 0.1741x, R2 = 0.89, P = 0.059
B
18.0
19.0
20.0
21.0
22.0
23.0
0 1 2 3 4 5
Soil
Tem
pera
ture
(°C
)
Distance from Pile (m)
Small 1
Small 2
Small 3
ŷ = 19.972+ 0.2075x, R2 = 0.83, P = 0.09
C

81
Figure 3.5. Least-squares regression of mean soil respiration for the interbed sample points of the
North Carolina pile-size study transects (large, medium, small).
2.0
6.0
10.0
14.0
18.0
0 2 4 6 8 10 12
CO
2 E
fflu
x (
µm
ol
CO
2 m
-2 s
- )
Distance from Pile (m)
Large 1
Large 2
Large 3
Large 4
ŷ = 6.34+0.178x, R2 = 0.01, p = 0.89
A
2.0
6.0
10.0
14.0
18.0
0 2 4 6 8 10 12
CO
2 E
fflu
x (
µm
ol
CO
2 m
-2 s
- )
Distance from Pile (m)
Medium 1
Medium 2
Medium 3
ŷ = 11.53-0.344x, R2 = 0.70, p = 0.04
B
2.0
6.0
10.0
14.0
18.0
0 2 4 6 8 10 12
CO
2 E
fflu
x (
µm
ol
CO
2 m
-2 s
- )
Distance from Pile (m)
Small 1
Small 2
Small 3
ŷ = 5.98+0.003x, R2 = 0.0003, p = 0.97
C

82
Figure 3.6. Least-squares regression of mean soil respiration for the interbed sample points of the
Georgia pile-size study transects (large, medium, small).
2.0
6.0
10.0
14.0
18.0
0 2 4 6 8 10 12
CO
2 E
fflu
x (
µm
ol
CO
2 m
-2 s
- )
Distance from Pile (m)
Large 1
Large 2
Large 3
A
ŷ = 8.83-0.172x, R2 = 0.72, p = 0.03
2.0
6.0
10.0
14.0
18.0
0 2 4 6 8 10 12
CO
2 E
fflu
x (
µm
ol
CO
2 m
-2 s
- )
Distance from Pile (m)
Medium 1
Medium 2
Medium 3
Medium 4
ŷ = 8.20-0.164x, R2 = 0.19, p = 0.38
B
2.0
6.0
10.0
14.0
18.0
0 2 4 6 8 10 12
CO
2 E
fflu
x (
µm
ol
CO
2 m
-2 s
- )
Distance from Pile (m)
Small 1
Small 2
Small 3
C
ŷ = 5.76+0.033x, R2 = 0.03, p = 0.74

83
Figure 3.7. Least-squares regression of mean total organic carbon concentration (%) for the
interbed sample points of the North Carolina pile-size study transects (large, medium, small).
0.0
10.0
20.0
30.0
40.0
0 2 4 6 8 10 12
Tota
l O
rgan
ic C
arb
on
(%
)
Distance from Pile (m)
Large 1
Large 2
Large 3
Large 4
ŷ = 9.26+0.0134x, R2 = <0.01, p = 0.96
A
0.0
10.0
20.0
0 2 4 6 8 10 12
Tota
l O
rgan
ic C
arb
on
(%
)
Distance from Pile (m)
Medium 1
Medium 2
Medium 3
ŷ = 5.79+0.135x, R2 = 0.13, p = 0.48
B
0.0
10.0
20.0
0 2 4 6 8 10 12
Tota
l O
rgan
ic C
arb
on
(%
)
Distance from Pile (m)
Small 1
Small 2
Small 3
ŷ = 4.35+0.0002x, R2 = <0.01, p = 0.99
C

84
Figure 3.8. Least-squares regression of mean total organic carbon concentration (%) for the
interbed sample points of the Georgia pile-size study transects (large, medium, small).
0.0
10.0
20.0
0 2 4 6 8 10 12
Tota
l O
rgan
ic C
arb
on
(%
)
Distance from Pile (m)
Large 1
Large 2
Large 3
ŷ = 3.06-0.105x, R2 = 0.65, p = 0.05
A
0.0
10.0
20.0
0 2 4 6 8 10 12
Tota
l O
rgan
ic C
arb
on
(%
)
Distance from Pile (m)
Medium 1
Medium 2
Medium 3
Medium 4
ŷ = 4.86-0.227x, R2 = 0.53, p = 0.10
B
0.0
10.0
20.0
0 2 4 6 8 10 12
Tota
l O
rgan
ic C
arb
on
(%
)
Distance from Pile (m)
Small 1
Small 2
Small 3
ŷ = 3.00+0.093x, R2 = 0.66, p = 0.05
C

85
Figure 3.9. Least-squares regression of mean total nitrogen concentration (%) for the interbed
sample points of the North Carolina pile-size study transects (large, medium, small).
0.0
0.5
1.0
1.5
0 2 4 6 8 10 12
Tota
l N
itro
gen
(%
)
Distance from Pile (m)
Large 1
Large 2
Large 3
Large 4
ŷ = 0.316+0.001x, R2 = <0.01, p = 0.90
A
0.0
0.2
0.4
0 2 4 6 8 10 12
Tota
l N
itro
gen
(%
)
Distance from Pile (m)
Medium 1
Medium 2
Medium 3
ŷ = 0.212+0.002x, R2 = 0.03, p = 0.76
B
0.0
0.2
0.4
0 2 4 6 8 10 12
Tota
l N
itro
gen
(%
)
Distance from Pile (m)
Small 1
Small 2
Small 3
ŷ = 0.143+0.00005x, R2 = <0.01, p = 0.99
C

86
Figure 3.10. Least-squares regression of mean total nitrogen concentrations for the interbed
sample points of the Georgia pile-size study transects (large, medium, small).
0.0
0.2
0.4
0 2 4 6 8 10 12
To
tal
Nit
rog
en (
%)
Distance from Pile (m)
Large 1
Large 2
Large 3
ŷ = 0.088-0.0035x, R2 = 0.44, p = 0.15
A
0.0
0.2
0.4
0 2 4 6 8 10 12
Tota
l N
itro
gen
(%
)
Distance from Pile (m)
Medium 1
Medium 2
Medium 3
Medium 4
ŷ = 0.163-0.008x, R2 = 0.65, p = 0.05
B
0.0
0.2
0.4
0 2 4 6 8 10 12
Tota
l N
itro
gen
(%
)
Distance from Pile (m)
Small 1
Small 2
Small 3
ŷ = 0.090+0.003x, R2 = 0.54, p = 0.10
C

87
Table 3.1. Statistical summary (probability>F) of pile-size effects on volumetric moisture
content (VMC), soil temperature, soil respiration, total soil organic carbon, and total soil
nitrogen.
Location Attribute -----p-value-----
North Carolina
VMC 0.0014
Soil Temp 0.8700
CO2 Efflux 0.0291
Total SOC 0.1049
Total N 0.1245
Georgia
VMC 0.0032
Soil Temp 0.8223
CO2 Efflux 0.0258
Total SOC 0.1952
Total N 0.0230

88
Table 3.2. Average (bed-interbed) volumetric moisture content (%) for North Carolina and
Georgia large, medium, and small residue pile classes.
Location Pile Size Class Replicate VMC (%)
North Carolina
Large
1 13.50
2 21.05
3 16.55
4 15.40
Mean 16.63b
Medium
1 22.35
2 14.50
3 21.55
Mean 19.47a
Small
1 12.70
2 17.95
3 14.55
Mean 15.07b
Georgia
Large
1 8.15
2 10.20
3 9.50
Mean 9.28b
Medium
1 6.95
2 9.95
3 28.55
4 15.85
Mean 15.33a
Small
1 10.60
2 13.10
3 13.65
Mean 12.45b
† Means with dissimilar letters are significantly different between pile size designations at the
0.05 level using Tukey's means separation procedure.

89
Table 3.3. Statistical summary of one-way ANOVA results for volumetric moisture content (%)
and distance from residue-pile (0, 0.5, & 1.0-m) for North Carolina and Georgia study locations.
Location Pile Size Class Replicate 0-m 0.5-m 1.0-m p-value
-------- VMC (%) --------
North Carolina
Large
1 14.88 14.38 16.08
0.95 2 26.31 29.17 26.67
3 18.93 15.36 20.01
4 18.27 18.72 19.55
Medium
1 14.42 12.55 19.62
0.80 2 12.52 17.19 13.99
3 26.70 21.10 27.75
Small
1 6.88 12.89 12.94
0.90 2 21.65 19.84 15.13
3 14.52 15.91 17.78
Mean 17.51 17.71 18.95
Georgia
Large
1 7.89 7.88 8.08
0.72 2 16.24 16.14 12.10
3 13.65 11.16 10.35
Medium
1 8.37 8.95 9.52
0.96 2 9.71 10.90 13.07
3 36.09 44.08 44.27
4 19.98 15.63 19.06
Small
1 10.05 15.30 13.05
0.21 2 16.32 21.85 23.60
3 12.24 16.72 23.43
Mean 15.05 16.86 17.65

90
Table 3.4. Statistical summary for comparison between bed and interbed mean volumetric
moisture content (%) for North Carolina and Georgia study locations.
Location Pile Size Class Replicate Bed Interbed p-value
----VMC (%) ----
North Carolina
Large
1 11.1 15.9 0.04
2 16.8 25.3 <0.01
3 14.2 18.9 0.13
4 12.8 18.0 0.02
Medium
1 22.9 21.8 0.7
2 12.3 16.7 <0.01
3 18.3 24.8 <0.01
Small
1 10.7 14.7 0.17
2 16.2 19.7 0.04
3 12.0 17.1 <0.01
Mean 14.7 19.3 0.014
Georgia
Large
1 7.9 8.4 0.3
2 8.4 12.0 0.11
3 8.3 10.7 0.08
Medium
1 5.7 8.2 <0.01
2 4.6 15.3 <0.01
3 26.5 30.6 0.34
4 14.3 17.4 0.04
Small
1 9.1 12.1 0.05
2 9.1 17.1 <0.01
3 13.0 14.3 0.71
Mean 10.7 14.6 0.19

91
Table 3.5. Statistical summary of one-way ANOVA results for soil temperature (°C) and
distance from residue-pile (0, 0.5, & 1.0-m) for North Carolina and Georgia study locations.
Location Pile Size Class Replicate 0-m 0.5-m 1.0-m p-value
--Soil Temperature (°C) --
North Carolina
Large
1 16.15 20.68 16.75
0.54 2 15.23 15.87 15.92
3 15.82 16.43 16.35
4 14.08 13.87 16.15
Medium
1 14.39 14.33 10.90
0.82 2 16.61 16.16 16.30
3 15.38 16.71 16.83
Small
1 17.55 17.23 15.70
0.90 2 15.42 14.62 15.57
3 15.96 16.27 16.53
Georgia
Mean 15.66 16.22 15.70
Large
1 18.37 19.91 20.83
0.86 2 20.86 19.81 20.29
3 22.19 22.13 22.22
Medium
1 19.55 19.58 19.94
0.87 2 20.10 21.94 20.49
3 20.08 18.19 20.11
4 21.11 22.00 22.21
Small
1 20.22 18.00 20.56
0.94 2 20.49 20.74 21.10
3 19.95 20.89 18.58
Mean 20.29 20.32 20.63
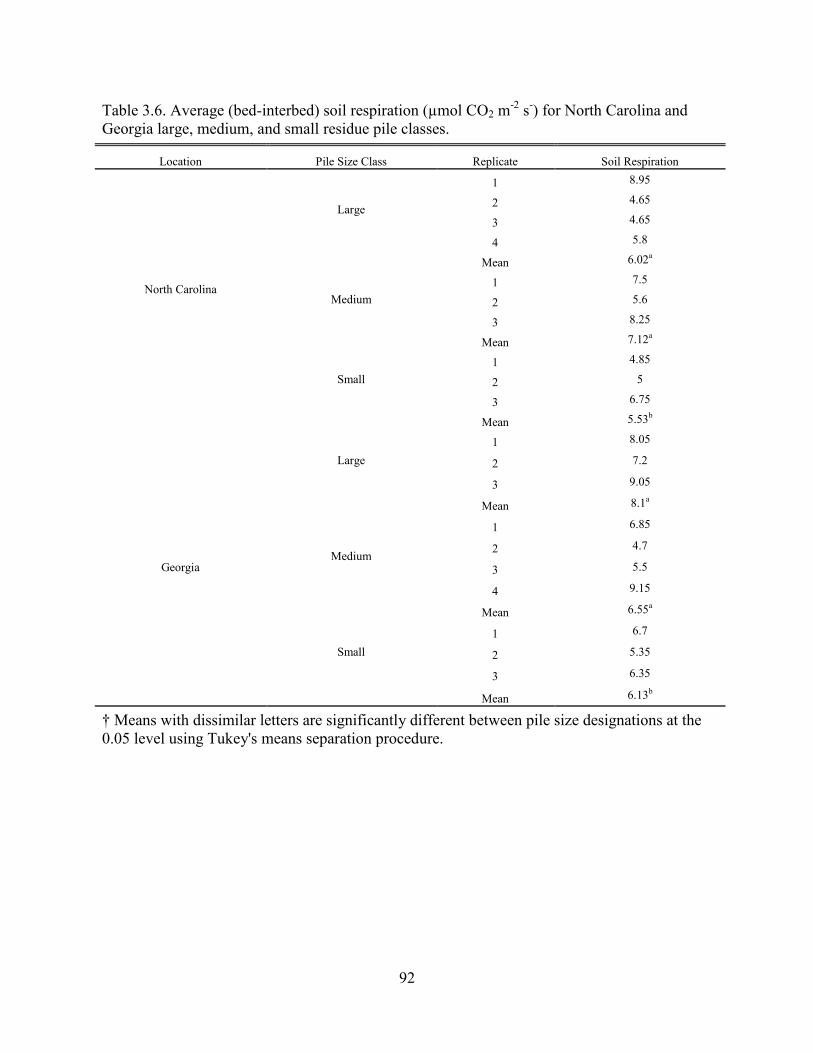
92
Table 3.6. Average (bed-interbed) soil respiration (µmol CO2 m-2
s-) for North Carolina and
Georgia large, medium, and small residue pile classes.
Location Pile Size Class Replicate Soil Respiration
North Carolina
Large
1 8.95
2 4.65
3 4.65
4 5.8
Mean 6.02a
Medium
1 7.5
2 5.6
3 8.25
Mean 7.12a
Small
1 4.85
2 5
3 6.75
Mean 5.53b
Georgia
Large
1 8.05
2 7.2
3 9.05
Mean 8.1a
Medium
1 6.85
2 4.7
3 5.5
4 9.15
Mean 6.55a
Small
1 6.7
2 5.35
3 6.35
Mean 6.13b
† Means with dissimilar letters are significantly different between pile size designations at the
0.05 level using Tukey's means separation procedure.

93
Table 3.7. Statistical summary of one-way ANOVA results for soil respiration (µmol CO2 m-2
s-) and distance from residue-pile (0, 0.5, & 1.0-m) for North Carolina and Georgia study
locations.
Location Pile Size Class Replicate 0-m 0.5-m 1.0-m p-value
------Soil Respiration ------
North Carolina
Large
1 5.44 6.12 5.57
0.79 2 4.75 5.18 5.17
3 6.37 6.13 9.32
4 6.37 5.33 5.02
Medium
1 17.30 11.85 10.04
0.72 2 14.43 8.22 5.38
3 8.10 12.56 16.17
Small
1 3.75 5.07 4.08
0.45 2 5.98 8.28 4.12
3 6.00 7.78 7.98
Mean 7.85 7.65 7.29
Georgia
Large
1 4.57 6.91 8.46
0.95 2 9.66 11.71 9.96
3 11.55 9.10 7.70
Medium
1 14.03 13.28 6.20
0.27 2 7.03 7.52 6.52
3 8.30 5.84 5.36
4 13.93 3.55 9.72
Small
1 4.25 5.11 6.41
0.97 2 8.58 6.50 6.31
3 2.87 4.58 4.17
Mean 8.48 7.41 7.08
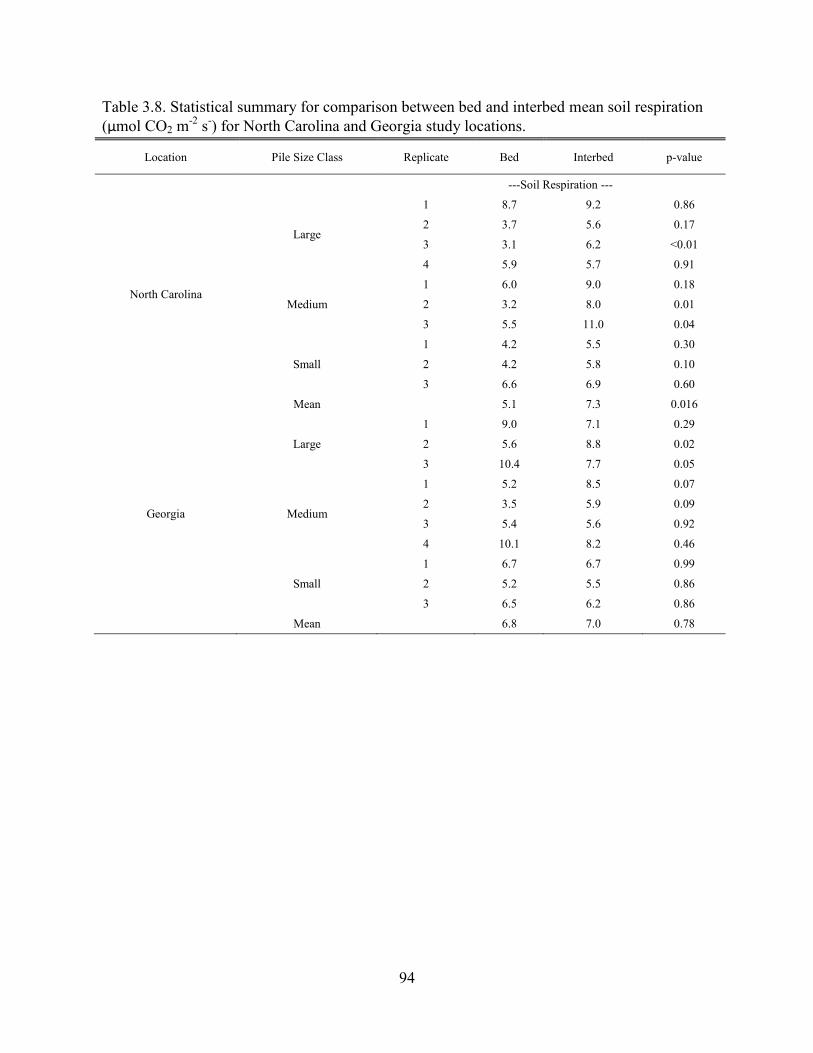
94
Table 3.8. Statistical summary for comparison between bed and interbed mean soil respiration
(µmol CO2 m-2
s-) for North Carolina and Georgia study locations.
Location Pile Size Class Replicate Bed Interbed p-value
---Soil Respiration ---
North Carolina
Large
1 8.7 9.2 0.86
2 3.7 5.6 0.17
3 3.1 6.2 <0.01
4 5.9 5.7 0.91
Medium
1 6.0 9.0 0.18
2 3.2 8.0 0.01
3 5.5 11.0 0.04
Small
1 4.2 5.5 0.30
2 4.2 5.8 0.10
3 6.6 6.9 0.60
Mean 5.1 7.3 0.016
Georgia
Large
1 9.0 7.1 0.29
2 5.6 8.8 0.02
3 10.4 7.7 0.05
Medium
1 5.2 8.5 0.07
2 3.5 5.9 0.09
3 5.4 5.6 0.92
4 10.1 8.2 0.46
Small
1 6.7 6.7 0.99
2 5.2 5.5 0.86
3 6.5 6.2 0.86
Mean 6.8 7.0 0.78

95
Table 3.9. Statistical summary of one-way ANOVA results for total soil organic carbon (%) and
distance from residue-pile (0, 0.5, & 1.0-m) for North Carolina and Georgia study locations.
Location Pile Size Class Replicate 0-m 0.5-m 1.0-m p-value
-----TOC (%) -----
North Carolina
Large
1 5.36 3.31 0.91
0.75 2 27.22 32.36 18.19
3 6.35 4.43 1.25
4 5.94 5.18 3.29
Medium
1 8.23 7.97 5.18
0.77 2 4.59 1.67 3.33
3 5.86 4.38 8.90
Small
1 3.41 2.82 3.69
0.50 2 6.29 3.61 6.78
3 3.86 4.06 4.04
Mean 7.71 6.98 5.56 0.80
Georgia
Large
1 1.73 2.51 2.70
0.76 2 4.80 2.12 1.25
3 3.49 4.18 3.66
Medium
1 9.07 5.84 5.63
0.40 2 4.60 3.61 7.89
3 2.94 1.71 1.75
4 9.35 4.67 2.36
Small
1 2.69 3.89 4.28
0.58 2 3.42 4.24 3.76
3 1.31 1.67 2.32
Mean 4.34 3.44 3.56 0.60

96
Table 3.10. Statistical summary for comparison of bed and interbed mean total soil organic
carbon (%) for North Carolina and Georgia study locations.
Location Pile Size Class Replicate Bed Interbed p-value
--Total SOC (%)--
North Carolina
Large
1 2.5 5.4 0.17
2 10.2 25.0 0.02
3 5.4 3.8 0.44
4 2.7 2.7 0.99
Medium
1 3.9 7.0 0.08
2 5.1 7.1 0.35
3 5.4 5.2 0.69
Small
1 2.9 3.7 0.55
2 5.1 5.2 0.95
3 3.8 4.2 0.53
Mean 4.7 6.9 0.32
Georgia
Large
1 3.8 3.4 0.66
2 2.7 2.0 0.31
3 2.8 2.0 0.54
Medium
1 3.6 5.1 0.43
2 3.1 2.9 0.92
3 3.8 1.8 0.57
4 3.9 3.7 0.88
Small
1 2.8 3.5 0.45
2 2.3 3.0 0.43
3 6.9 4.2 0.43
Mean 3.6 3.2 0.45

97
Table 3.11. Statistical summary of one-way ANOVA results for total soil nitrogen (%) and
distance from residue-pile (0, 0.5, & 1.0-m) for North Carolina and Georgia.
Location Pile Size Class Replicate 0-m 0.5-m 1.0-m p-value
------Total N (%) ------
North Carolina
Large
1 0.16 0.08 0.03
0.79
2 0.91 1.14 0.67
3 0.27 0.16 0.05
4 0.19 0.17 0.12
Medium
1 0.34 0.29 0.17
0.81 2 0.14 0.04 0.09
3 0.20 0.14 0.37
Small
1 0.12 0.10 0.14
0.48 2 0.21 0.13 0.22
3 0.11 0.11 0.12
Mean 0.26 0.24 0.20 0.84
Georgia
Large
1 0.04 0.07 0.08
0.83 2 0.14 0.05 0.03 3 0.09 0.11 0.10
Medium
1 0.31 0.21 0.18
0.44
2 0.15 0.12 0.28 3 0.14 0.09 0.07 4 0.22 0.12 0.09
Small
1 0.05 0.08 0.08
0.67
2 0.12 0.17 0.15 3 0.04 0.05 0.09
Mean 0.13 0.11 0.11 0.76
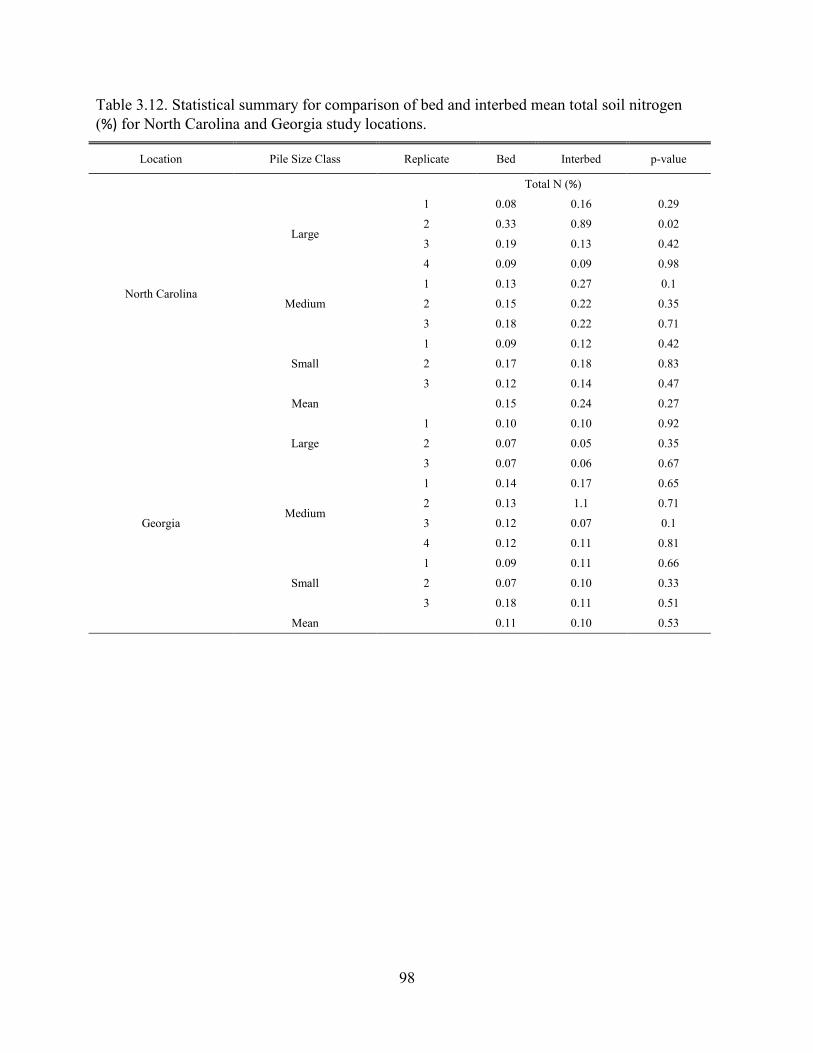
98
Table 3.12. Statistical summary for comparison of bed and interbed mean total soil nitrogen
(%) for North Carolina and Georgia study locations.
Location Pile Size Class Replicate Bed Interbed p-value
Total N (%)
North Carolina
Large
1 0.08 0.16 0.29
2 0.33 0.89 0.02
3 0.19 0.13 0.42
4 0.09 0.09 0.98
Medium
1 0.13 0.27 0.1
2 0.15 0.22 0.35
3 0.18 0.22 0.71
Small
1 0.09 0.12 0.42
2 0.17 0.18 0.83
3 0.12 0.14 0.47
Mean 0.15 0.24 0.27
Georgia
Large
1 0.10 0.10 0.92
2 0.07 0.05 0.35 3 0.07 0.06 0.67
Medium
1 0.14 0.17 0.65 2 0.13 1.1 0.71 3 0.12 0.07 0.1 4 0.12 0.11 0.81
Small
1 0.09 0.11 0.66 2 0.07 0.10 0.33 3 0.18 0.11 0.51
Mean 0.11 0.10 0.53

99
CHAPTER IV
Use of Electromagnetic Induction to Estimate the Quantity of Harvest-Residue Retained
Following Timber Harvest
_____________________
1Christian W. Hoadley, Daniel Markewitz, and Lawrence Morris. To be submitted to Biomass and Bioenergy.

100
Abstract
The development of new biomass harvesting guidelines (BHGs) that focus on the retention of
harvest residues necessitates a need for a relatively rapid, non-destructive, and quantitative
method for determining the density of harvest residue piles. In this study, the objective was to
assess the effectiveness of geo-physical survey methods, using electromagnetic induction (EMI),
to estimate harvest residue pile density. To evaluate the effectiveness of EMI in determining pile
density, two independent field studies were conducted using a Dualem-2S field-portable geo-
physical instrument. In the first study, a field calibration survey measuring the electrical
conductivity of different size residue piles of known densities was completed. The second study
measured the conductivity of harvest residue piles in recently harvested loblolly pine stands
located in the Atlantic Coastal Plain. The results of the field calibration study using EMI to
measure conductivity of residue pile density suggest that the Dualem-2S is sensitive to increases
in the mass of woody debris. Average conductivity values were as low as 2.4 mS m-1
for a pile
density of 130 kg m-3
and increased to an average value as high as 4.1 mS m-1
which
corresponded to a pile density of 173 kg m-3
. The areas occupied by constructed residue piles
could be identified from the spatial correlation models of data collected for the field calibration
study. The mean conductivity values of constructed residue piles were much lower than the
conductivity of the surrounding terrain with low residue retention. The highest density piles
measured in the calibration experiment were consistent with conductivity values for large pile
size designations from the field study.
INDEX WORDS: Electromagnetic Induction, Geo-physical Survey, Residue Pile, Woody
Biomass, Biomass Harvesting Guidelines

101
Introduction
At present there are no state or federal regulations pertaining to the removal of logging-
residues from a harvested site. Most states rely on forestry best management practices (BMPs)
established to mitigate potential negative effects of traditional clear-cut forest harvests. However,
the potential intensity of biomass utilization associated with bioenergy harvests has sparked
interest for many states to develop new biomass harvesting guidelines (BHGs) or update existing
forestry BMPs (Evans et al. 2010). Since 2007, at least seven states have developed new biomass
harvesting guidelines, including: Minnesota (2007), Missouri (2009), Pennsylvania (2008),
Wisconsin (2009), Maine (2010), Michigan (2010), and Kentucky (2011) (Gugelmann, 2011).
The development of new BHGs that focus on the retention of coarse-woody debris (CWD) and
fine-woody woody debris (FWD) on a harvested site necessitates a need for a relatively rapid,
non-destructive, and quantitative method for determining the quantity of harvest residues that
remain after timber harvest.
A number of methods have been employed that estimate the distributional volume of
ground-based coarse-woody debris. The most common method for estimating ground-based
coarse-woody debris volume is the line-intersect sampling technique (Warren and Olsen, 1964;
Van Wagner, 1968; Brown, 1974; DeVries, 1986; Bell et al., 1996; Hess and Zimmerman,
2000). The line-intersect sampling technique is an accepted sampling approach for estimating the
volume of coarse-woody debris on a site; however, forest harvesting operations frequently leave
harvest-residues distributed across a site in piles that vary in size, shape, and material content
(i.e., hardwood, pine, soil).
102
A number of different geometric-methods have been developed to estimate the volume of
woody-debris piles, but the amount of harvest-residue on a site is typically expressed in terms of
mass rather than volume (Long and Boston, 2013). Destructive sampling of harvest-residue piles
to obtain pile mass is time prohibitive and costly. Research on packing ratios of piled woody
debris (Hardy and Vihnanek, 1996) developed estimates that take into account air-space and soil
that are often included in harvest-residue volume estimates. Although packing ratios provide a
more accurate estimation of harvest-residue pile density, destructive sampling from a sub-sample
of residue piles is required.
More recent research has focused on the use of various technologies for estimating the
volume of harvest-residue piles. These technologies include using a laser rangefinder with an
electronic compass to collect pile coordinates, LiDAR-generated volume estimates, and airborne
laser scanning (ALS). In their evaluation of alternative measurement techniques for estimating
the volume of logging residues, Long and Boston (2013) concluded that LiDAR analysis is an
effective tool for modeling the complex shapes and irregular materials found in residue piles;
however, they also noted that the use of LiDAR is unlikely to gain favor as it is cost prohibitive.
A potentially more cost effective approach is ground based geophysical surveys.
Geophysical instruments have been utilized in a variety of disciplines, including geology,
agronomy, pedology, and archeology. Electromagnetic induction (EMI) has been demonstrated
to be a versatile technique in geophysical terrain surveys. Electromagnetic induction instruments
operate by creating a primary magnetic field, which induces electrical current in the underlying
terrain. A secondary induced magnetic field is generated from this current, which is sensed by
the instruments receivers. The response from the secondary magnetic field is used to determine
the terrain conductivity, measured in millisiemens per meter (mS m-1
). (Dualem, 2009). The use

103
of EMI instruments for geo-conductivity terrain surveys allows operators to collect conductivity
data over large survey areas. In this study, the objective was to assess the effectiveness of geo-
physical survey methods, using electromagnetic induction, to estimate harvest residue pile
density.
Materials and Methods
Site Description
To evaluate the effectiveness of electromagnetic induction in determining pile density,
two independent field studies were conducted using a Dualem-2S field-portable geo-physical
instrument (Daulem Inc., Milton, Ontario). The Dualem-2S has a 2 m separation between a
electromagnetic (EM) transmitter, which operates at a fixed frequency, and 2 pairs of EM-
receivers. The transmitter and first pair of EM-receivers are constructed with horizontal internal
windings, which form a horizontal co-planar array (HCP). The second pair of EM-receivers are
constructed with vertical windings, and combined with the transmitter form the perpendicular
array (PRP). The Dualem-2S induces a primary EM field, which is generated by the EM
transmitter coil. This EM field creates a secondary magnetic field when it comes into contact
with the subsurface soil. The secondary magnetic field is measured by the EM-receiver pairs as
electrical conductivity (mS m-1
). The depths of exploration (DOE) for the Dualem-2S are 1 m
and 3 m for the HCP-array and the PRP-array, respectively. Conductivity measurements are
integrated and transmitted by the Dualem-2S instrument to a data-logging GPS receiver once
every second.

104
In the first study, a field calibration survey measuring the conductivity of different size
residue piles of known densities was completed at Whitehall Forest, Athens, Georgia (33° 52’ N
83° 21’ W). The second study, measuring the conductivity of harvest residue piles was
completed in recently harvested loblolly pine stands located in the Atlantic Coastal Plain of
North Carolina and Georgia. These sites were located in Beaufort County, North Carolina (35°
35’ N 76° 56’ W), Glynn County, Georgia (31° 10’ N 81° 40’ W), and Effingham County,
Georgia (32° 19’ N 81° 10’ W).
The Beaufort County, North Carolina sites were previously planted in loblolly pine,
which was managed for sawtimber production. The stands were 36 years old at the time of
harvest and each stand received two thinning treatments during the rotation as well as and a mid-
rotation mechanical vegetation control. Following a clear cut harvest in the winter of 2010-11,
each of four separate research blocks were sheared with a v-blade, bedded, and then hand planted
during the winter of 2011-12. Additionally, each block received an aerial chemical application of
10 gallons per acre solution of 48 oz acre of Chopper + 12.8 oz acre of Red River Supreme
surfactant for herbaceous weed control in June of 2012. The active ingredient of Chopper, EPA
Registration number 241 – 296, is an Isopropylamine salt of Imazapyr.
The Glynn County sites, originally owned and planted in loblolly pine by Union Camp
Corporation, are currently managed by Plum Creek Timber Company, Inc. for a timber
investment group. Unfortunately, there was not a transfer of stand management information
beyond establishment and thinning dates. Two of the three research blocks were thinned at age
15 and timber clear cut at age 26. The third research block was never thinned during the rotation
and was clear cut at age 33.

105
Study Design
Whitehall Forest Calibration Study
To calibrate the Dualem-2S instrument, a 100-m2 survey area was selected in an open
field located in Whitehall Forest. A total of eleven transects 10-m in length, spaced at 1-m
intervals were established within the survey area (Figure 4.1). A control survey was conducted
by walking the Dualem-2S along each transect for 30 to 45 seconds. The Dualem-2S collected
data through the attached Juniper Archer (Juniper Systems, Logan, Utah) with Global Sat GPS,
HGIS, and sensor trac. The conductivity data, measured in millisiemens per meter (mS m-1
), and
GPS coordinates collected during this initial survey were imported into ArcMap 10 (ArcGIS
Desktop, Environmental Systems Research Institute, version 10; Esri 2010, Redlands, CA),
which was used to produce a spatial correlation model of conductivity using ordinary prediction
kriging.
Following the grass field calibration survey, woody debris from recently harvested timber
was collected and delivered to the survey area. A constructed residue pile was then created by
individually weighing and recording each section of woody biomass. Weighed biomass was
added to the center of the survey area until an initial mass of 136 kg was reached. Pile
dimensions (length, width, and height) were recorded and used to calculate total pile volume
using the volume equation for a half-ellipsoid:
(Hardy, 1996).
Additions of soil (36 kg) and coarse-woody debris (CWD) (136 kg) were made following
the previously outlined procedure. A total of twelve residue piles with known densities were
constructed for this calibration study. Each constructed residue pile was surveyed by walking the
survey area with the Dualem-2S in the same manner as outlined in the control survey.
Conductivity data for each residue pile was imported into ArcMap 10, where pile conductivity

106
data was extracted from the total survey area and used to calculate the mean conductivity for
each constructed pile. Additionally, spatial correlation models of conductivity were produced for
each constructed pile using ordinary prediction kriging.
Field Conductivity Study
To field evaluate the effectiveness of geo-physical survey techniques in estimating
residue pile density using EMI with the Dualem-2S, ten residue piles were randomly selected
from each state. The 20 harvest residue piles were located within eight biomass harvesting
guideline research blocks that were established for a biomass retention study. The harvest residue
piles were visually classified as small, medium, and large piles following protocol established by
North Carolina State University for a wildlife component of the biomass retention study (Fritts,
2014). Each pile was systematically located with a field portable Garmin eTrex Summit HC GPS
receiver (Garmin International, Inc., Olathe, KS), monumented with painted 2-m rebar, driven 1-
m into the adjacent soil, and given a unique identification for ease of locating during subsequent
field excursions. A total of 4 large, 3 medium and 3 small piles were established in the North
Carolina research blocks. Similarly, 3 large, 4 medium and 3 small piles were established in the
Georgia research blocks.
Geo-physical surveys measuring conductivity (mS m-1
) were conducted in November and
December of 2012 for the residue pile locations in North Carolina and Georgia, respectively. The
geo-physical surveys were completed following the same protocol outlined in the field
calibration study from Whitehall Forest.

107
However, the interval between survey area transects was increased from 1-m to approximately 2-
m to account for a much larger survey area. Conductivity data for each residue pile was imported
into ArcMap 10 to produce spatial correlation models using ordinary prediction kriging.
Results
The results of the field calibration study using electromagnetic induction to measure conductivity
of residue pile density suggest that the Dualem-2S is sensitive to increases in mass of woody
debris. In Figure 4.2, a first-order regression line, with a 95% confidence level indicates that
mean conductivity values for constructed residue piles increased as woody debris was added to
the survey area. Average conductivity values were as low as 2.4 mS m-1
for a pile density of 130
kg m-3
and increased to an average value as high as 4.1 mS m-1
which corresponded to a pile
density of 173 kg m-3
. Although the trend was for mean conductivity to increase with increased
pile density, the largest density pile constructed (196 kg m-3
) experienced a small (0.4 mS m-1
)
decrease in average pile conductivity from the 4.1 mS m-1
average. The area occupied by
constructed residue piles could be identified from the kriged surface produced from the data
collected during the field calibration study (Figures 4.3 and 4.4). Furthermore, the mean
conductivity values of the constructed residue piles were much lower than the surrounding
terrain conductivity with low residue retention as expected. Spatial correlation models produced
from the geo-physical conductivity surveys in the field made it possible to identify areas
occupied by piled harvest residues (Figure 4.5). A comparison of conductivity values from the
calibration study and field measurements revealed that the highest density piles measured in the
calibration experiment were consistent with conductivity values for large pile size designations
from the field study (Figures 4.2 and 4.5).

108
Discussion
This research tested a geo-conductivity survey technique by using EMI with a field-
portable Dualem-2S instrument in an effort to quantify harvest residue pile density in recently
harvested loblolly pine sites. The benefit of using EMI instruments for geo-conductivity terrain
surveys is that they allow operators to collect conductivity data over large survey areas.
Conductivity measures from the field calibration study indicated that the Dualem-2S is sensitive
to increases in above ground mass. In general, conductivity values for constructed residue piles
increased with additions of woody biomass and soil. Furthermore, spatial correlation models
produced from geo-conductivity survey data identified areas occupied by piled harvest residues.
Conductivity data for the highest density residue piles from the calibration study correlated with
conductivity values for large pile size designations from the field study. Although this research
demonstrated potential for using geo-conductivity surveys to determine residue pile density,
further research into calibration and modeling is needed.
‘

109
References
Bell, G., Kerr, A., McNickle, D., and R. Woollons. 1996. Accuracy of the line intersect method
of post-logging sampling under orientation bias. For. Ecol. Manage. 84:23-28
Brown, J.K., and P.J. Roussopoulos. 1974. Eliminating biases in the planar intersect method for
estimating volumes of small fuels. For. Sci. 20:350-356
DeVries, P.G. 1986. Sampling theory for forest inventory. Springer-Verlag, Berlin. 399p.
Dualem, Inc. 2009. Electromagnetic induction: operation and interpretation especially at low
induction numbers [online]. www.dualem.com/eioi.htm
Evans, A.M., R.T. Perschel, and B.A. Kittler. 2010. Revised assessment of biomass harvesting
and retention guidelines. Forest Guild, Sante Fe, NM.
Gugelmann, B. 2011. An Analysis of Woody Biomass Harvesting Guidelines (BHGs) for North
Carolina Forestry. M.N.R Thesis. North Carolina State University, Raleigh, NC.
Hardy, C.C., and R. Vihnanek. 1996. Packing rations for piled woody debris. USDA Forest
Service, Pacific Northwest Research Station, Seattle, WA.
Hess, G.R., and D. Zimmerman. 2000. Woody debris volume on clearcuts with and without
satellite chip mills. Soth. J. Appl. For. 25(4):173-177
Long, J.J., and K. Boston. 2013. An evaluation of alternative measurement techniques for
estimating the volume of logging residues. For. Sci. 60(1):200-204
Van Wagner, C.E., 1968. The line intersect method in forest fuel sampling. For. Sci. 14:20-26

110
Warren, W.G., and P.F. Olsen. 1964. A line intersect technique for assessing logging waste.
For. Sci. 13:267-276

111
Figure 4.1. Representation of the 100-m2 survey area developed for the field
calibration study.

112
Figure 4.2. Mean conductivity values (mS m-1
) for selected residue-piles of known density
from the electromagnetic induction field calibration study conducted at Whitehall Forest,
Athens, Georgia.

113
Figure 4.3. Spatial correlation model of conductivity (mS m-1
) from ordinary prediction
kriging that corresponds with a pile density of 130.0 kg m-3
.

114
Figure 4.4. Spatial correlation model of conductivity (mS m-1
) from ordinary prediction
kriging that corresponds with a pile density of 196.7 kg m-3
.

115
Figure 4.5. Spatial correlation model of conductivity (mS m-1
) from a geo-physical survey
conducted on a large-density residue-pile located in the Coastal Plain of Georgia.

116
APPENDICES

117
Appendix A. Pre-harvest mean soil bulk density (0-15cm) depth by BHG treatment designation
for North Carolina replicate blocks (Blocks 1 - 4).
BHG
Treatment Block 1 Block 2 Block 3 Block 4 Mean Bulk Density
----------------------------------- g cm-3 -------------------------------
------- g cm-3 -------
NOBIOHAR 0.98
0.70
0.66
0.62
0.74 (0.08)
30RETCLUS 0.99
0.34
0.68
0.87
0.72 (0.14)
30RETDISP 0.81
0.87
1.02
0.53
0.81 (0.10)
15RETCLUS 0.85
0.60
0.62
0.65
0.68 (0.06)
15RETDISP 0.84
0.34
1.21
0.71
0.78 (0.18)
NOBHG 0.86 1.03 0.63 0.82 0.84 (0.08)
† Numbers in parentheses indicate the standard error (SE), where n=4 for each BHG treatment.
Appendix B. Post-site preparation mean soil bulk density (0-15cm) depth by BHG treatment
designation for North Carolina replicate blocks (Blocks 1 - 4).
BHG Treatment Block 1 Block 2 Block 3 Block 4 Mean Bulk Density
--------------------------------- g cm-3 -----------------------------
------- g cm-3 -------
NOBIOHAR 1.10
0.70
0.72
0.94
0.87 (0.10)
30RETCLUS 0.94
0.58
0.89
1.30
0.93 (0.15)
30RETDISP 1.14
0.86
1.27
1.07
1.09 (0.09)
15RETCLUS 1.19
0.90
1.15
1.08
1.08 (0.06)
15RETDISP 0.90
0.52
1.09
0.97
0.87 (0.12)
NOBHG 1.03 1.11 1.02 0.94 1.03 (0.03)
† Numbers in parentheses indicate the standard error (SE), where n=4 for each BHG treatment.

118
Appendix C. Additional samples required for each BHG treatment designation to determine the
mean value with 95% confidence.
BHG Treatment Block 1 Block 2 Block 3 Block 4 Total Samples Required
----------------------Additional Samples----------------------
NOBIOHAR 68 44 22 29 163
30RETCLUS 55 44 8 53 160
30RETDISP 11 32 11 18 72
15RETCLUS 2 70 23 27 122
15RETDISP 1 8 48 33 90
NOBHG 9 6 16 62 93
Appenidix D. Input parameters and output statistics for spatial correlation models of
conductivity (mS m-1
) from ordinary prediction kriging.
Pile size
Pile
Density
(kg m-3)
Lag Size Number
of Lags
Neighbors
to include
Major
Range Nugget
Full
Sill
Nugget:Sill
Ratio
Conductivity
(mS m-1)
Small 130.0 8.88*106 12 5 7.38*105 1.12 3.43 0.33
Medium 196.7 6.46*106 12 5 5.33*105 1.35 2.91 0.46
Large ----- 1.37*105 12 5 1.22*104 3.71 55.69 0.07