Embed Size (px)
Citation preview

JOURNAL OF GEOPHYSICAL RESEARCH, VOL. 106, NO. C10, PAGES 22,067-22,093, OCTOBER 15, 2001
North Atlantic surface circulation during the 1990's observed with satellite-tracked drifters
David M. Fratantoni Department of Physical Oceanography, Woods Hole Oceanographic Institution, Woods Hole, Massachusetts, USA
Abstract. A new compilation of Lagrangian velocity observations describes the state of the North Atlantic surface circulation during the 1990s. Gridded fields of velocity and eddy kinetic energy (EKE) are constructed from trajectories of more than 1500 15-m drogued satellite-tracked surface drifters in service between January 1990 and December 1999. This time period overlaps a coordinated field study of circulation and variability in the North Atlantic completed between 1996-2000 as part of the World Ocean Circulation Experiment. We describe the construction of a self-consistent drifter climatology, present decadal-mean quasi-Eulerian velocity and EKE fields computed on a 1 ø grid, and compare these results with contemporary satellite measurements. Detailed discussion of the inferred surface circulation is focused on three regions: (1) The Gulf Stream and North Atlantic Current, (2) the Labrador Sea and subpolar gyre, and (3) the Caribbean Sea. The swiftest drifter motions were found in the equatorial region and along the tropical, subtropical, and subpolar western boundaries. The maximum instantaneous speed determined from a single (quality-controlled and filtered) drifter observation was 273 cm s -• in the Gulf Stream southeast of Cape Cod. The highest EKE value in the North Atlantic (2790 cm 2 s -2) was found in the Gulf Stream just downstream of the New England Seamounts. Over most of the Atlantic basin, drifter-derived EKE values were found to be O(100 cm 2 s -2) higher than corresponding values derived from satellite altimetry. In the Labrador Sea a region of sharply elevated EKE appears to be geographically related to the localized ejection of drifters (and by extension, mass and kinetic energy) from the energetic West Greenland Current between 60 ø and 62øN. When compared to drifter measurements made in the late 1970s our results suggest (but do not statistically confirm) an enhancement and slight northward shift of the zonal Gulf Stream extension. Such a shift is consistent in sign with expectations based on observed interdecadal variations in wind stress and subtropical gyre potential energy associated with the North Atlantic Oscillation.
1. Introduction
Over the last 75 years, numerous investigators have attempted to describe and quantify the low-frequency circulation of the North Atlantic using an expanding collection of hydrographic profiles and direct velocity measurements. Notable among these efforts are the pioneering field studies of Iseh'n [1936] who elucidated the large-scale structure of the subtropical gyre and the Gulf Stream, and the syntheses of I4/orthington [1976] who quantified transports and tracer relationships throughout the North Atlantic. Recent synthesis efforts [e.g., Schmitz and Richardson, 1991: Schmitz and McCartney, 1993; Schmitz, 1995] have incorporated direct measurements of ocean velocities in an effort to refine estimates of the three-dimensional
ocean circulation and illuminate transport pathways between the North Atlantic, its marginal seas. and the neighboring South Atlantic. Within the last 20 years, satellite-tracked Lagrangian drifters have emerged as an efficient means to explore upper- ocean circulation patterns independent of subsurface hydrographic measurements and the requisite (and sometimes difficult) choice of a geostrophic reference level. The number of drifter observations in the North Atlantic has increased
sufficiently to enable a relatively high-resolution depiction of the
Copyright 2001 by the American Geophysical Union.
Paper number 2000JC000730. 0148-0227/01/2000JC000730509.00
basin-scale circulation and its variability. Of equal importance, the standardization of drifter design and drogue geometry [e.g., Sybrandy and Nillet, 1991: Nillet et al., 1995] has allowed the meaningful compilation of drifter trajectories measured at substantially different times enabling improved statistical confidence in the resulting circulation schemes.
Here we describe a quality-controlled, self-consistent compilation of 15-m drogued satellite-tracked surface drifter trajectories. This data set is used to generate a basin-scale summary of the North Atlantic surface circulation and its eddy variability during the 1990s. This time period overlaps a coordinated field study of circulation and variability in the North Atlantic completed between 1996 and 2000 as part of the World Ocean Circulation Experiment (WOCE). Other contemporary investigators [e.g., Krauss, 1986; Br•igge, 1995; Martins and Fiuza, 2001] have looked in detail at the circulation in smaller regions of the North Atlantic and over different time periods. Rather than attempt to combine many years of potentially incompatible trajectory data (different drogue depth and surface buoy configurations being the principal sources of incompatibility) into an exhaustive drifter climatology, we chose to assemble a more limited but self-consistent data set to enable a
broad and meaningful description of the North Atlantic surface circulation during a restricted (but relatively data dense) time period.
The remainder of this article is structured as follows. In
section 2 we describe the acquisition and processing of the raw drifter trajectory data. Some of the more interesting features revealed by these trajectories are briefly discussed in section 3.
22,067

22,068 FRATANTONI: NORTH ATLANTIC SURFACE CIRCULATION IN '['HE 1990'S
In section 4 we construct quasi-Eulerian mean fields of velocity and eddy kinetic energy (EKE) for the North Atlantic and compare these fields with previous measurements and with contemporary satellite altimetry. Finally, in section 5 we consider the potential of this new drifter climatology as a benchmark for identifying interdecadal circulation variability associated with large-scale climate fluctuations in the North Atlantic.
, ric Drog e
2. Data
Approximately 1500 individual drifter trajectories totaling 402,581 drifter days of position and temperature were acquired from the public archives of the Global Drifter Data Assembly Center at the National Oceanographic and Atmospheric Administration's Atlantic Oceanographic and Meteorological Laboratory (AOML) in Miami, Florida. The majority of the surface drifters used in this study (Plate 1) are similar in construction to the WOCE / Tropical Ocean-Global Atmosphere (TOGA) Lagrangian drifter described by Sybrandy and Niiler [1991]. Less than 3% of the drifters are of an older but similar- performing [Nillet et al., 1995] TRISTAR design. All drifters were fitted with a submerged cylindrical drogue which hung suspended at a central depth of 15 m beneath a buoyant surface float. Processing of the data at AOML, including acquisition of raw data from Service Argos and initial quality control, is described in detail by Hansen and Herman [ 1989] and Hansen and Poulain [1996]. Gaps in the data, including those resulting from the operation of many drifters on a one-third duty cycle (i.e., transmitter activated 1 day out of 3, or 8 hours out of 24), were filled using a kriging technique [see Hansen and Herman, 1989]. The final data generated by AOML consists of 6-hourly interpolated position and surface temperature measurements.
Subsequent to the quality control procedures applied at AOML, each drifter position time series was truncated when drogue detachment was indicated by an onboard submergence sensor (through 1992) or strain gauge. Without an attached drogue the water velocity measured by the drifter may be contaminated by the direct influence of wind on the exposed surface buoy. Niiler et al. [ 1995] investigated the effectiveness of both the WOCE/TOGA and TRISTAR designs and found that wind-induced slippage was less than 1 cm s -1 in wind speeds of 10 m s -• with an attached drogue. This is comparable to the expected velocity accuracy resulting from Argos positioning [Niiler et al., 1995]. Elimination of undrogued trajectory segments reduced the total amount of available data by approximately 23% to 309,728 drifter days. A 2-day Gaussian filter was applied to the final trajectories to suppress tidal fluctuations. Drifter velocities were computed from the filtered position time series using a cubic spline function at each 6-hourly interpolated position.
3. Drifter Trajectories
A composite plot of all drifter trajectories used in this analysis is shown in Plate 2. Data density is highest in the western Atlantic, particularly near the Gulf Stream and its eastward extension. In contrast, a large area in the eastern tropical North Atlantic is almost devoid of data. The number of operational drifters in the North Atlantic increased from 1990 to 1996 and then remained relatively constant during the 1996-2000 WOCE Atlantic field program (Figure l a). The temporal distribution of trajectory data over the 10-year period does not exhibit any appreciable seasonal bias (Figure lb). In contrast, the spatial distribution of drifter observations varies significantly throughout the decade (Plate 3). Note the geographical shift in observational emphasis from the Gulf Stream region (1990-1992),
Subs . - I ,
Plate 1. A WOCE/TOGA Lagrangian drifter on the surface shortly after being deployed. The fabric drogue is weighted and will quickly sink to a vertical position beneath the surface float. Photograph courtesy of Mark Swenson, NOAA/AOML.
to the eastern subtropical gyre (1992-1995), to the Labrador Sea and subpolar gyre (1995-1998), and finally to the western tropical Atlantic and Caribbean Sea (1997-2000). This temporal variability in data density hampers our ability to compute true "decadal-mean" circulation statistics in several regions of the

FRATANTONI: NORTH ATLANTIC SURFACE CIRCULATION IN THE 1990'S 22,069
60N
40N
20N
100W 80W 60W 40W 20W 0
1990 1991 1992 1993 1994 1995 1996 1997 1998 1999
Plate 2. A composite diagram of all drifter trajectories used in the present analysis (gray lines) and the first valid position of each drifter during the January 1990 to December 1999 time period (colored dots).

22,070 FRATANTONI: NORTH ATLANTIC SURFACE CIRCULATION IN THE 1990'S
1990 1995 2000 J F M A M J J A S O N D
Year Month
200 o o
150 o
100
O
50 o
0 E z
Figure 1. Temporal distribution of drifter data presented in histogram form. The vertical axis indicates the number of 6-hourly measurements of position and velocity. (a) Distribution by year from 1990 to 1999. (b) Distribution by month.
North Atlantic. For example, while the mean circulation field deduced for the Labrador Sea region (see below) contains data from 1993 to 2000, most trajectories were obtained between 1996 and 1998.
A summary of the fastest- and slowest-moving drifter trajectory segments in this 10-year compilation is shown in Plate 4. Only those segments meeting the specified speed criterion for a contiguous 36-hour period are shown. The swiftest drifter motions (>40 cm s-•; Plate 4a) were found in a relatively continuous swath encompassing the equatorial region, the Caribbean Sea and Gulf of Mexico, the Florida Current and Gulf Stream, the western North Atlantic Current, and a narrow band near 35øN corresponding to the Azores Current. Rapid drifter motions are also identified in the East and West Greenland
Currents and, as reported previously by Poulain e! al. [1996], parallel to the continental shelfbreak in the Norwegian Sea. In several regions the distribution of"fast" drifters and bathymetric features appears to be related. For example, the fastest drifters in the northern subtropical gyre appear to be contained to the west of the Mid-Atlantic Ridge. Similarly, in the subpolar gyre, fast drifters surround but do not typically cross Rockall Plateau and the Reykjanes Ridge. Rapid trajectory segments in the low- latitude Atlantic are suggestive of rotary motion with meridional scales of several hundred kilometers. These fluctuations are most
likely associated with meanders in the eastward North Equatorial Countercurrent (particularly in the western basin) and with tropical instability waves [e.g., Weisberg and Weingartner, 1988; Fratantoni and Richardson, 1999]. Also notable in Plate 4 are the high-speed tra•jectory segments found away from the western boundary in the north central Labrador Sea and south of Iceland. As will be shown below, these areas of rapid drifter movement correspond to localized regions of elevated eddy kinetic energy.
The mean and instantaneous maximum speeds observed in subregions corresponding to the major currents of the North Atlantic are summarized in Table 1. The maximum instantaneous
speed determined from a single (6-hourly, quality-controlled and filtered) drifter observation was 273 cm s -• near 65øW, 39øN in the Gulf Stream southeast of Cape Cod. The greatest average drifter speed (97 cm s '•) was recorded in the Florida Current. The intense Florida Current is bracketed to the north and south by the Gulf of Mexico Loop Current (61 cm s -•) and the Gulf Stream (60 cm s-I). The pronounced difference between the mean and maximum current observations in the Gulf Stream region is attributable to the extreme variability in both flow intensity and
direction resulting from meandering and ring generation. A similar disparity in mean and maximum current speeds in the Azores Current suggests similar eddy variability.
The greatest number of slow-moving drifters (<10 cm s-•; Plate 4b) were found in the eastern subtropical Atlantic and in the Norwegian and Irminger Seas adjacent to Iceland. There are very few drifter observations in the eastern tropical North Atlantic. This region is characterized by particularly low surface wind stress but relatively large wind-forced surface divergence which tends to repel drifters from a wedge-shaped domain surrounding the Cape Verde Islands (see Mayer and Weisberg [1993] for a description of the mean wind field). Based on the climatologically weak wind forcing in the eastern tropical Atlantic we speculate that the area of particularly slow surface velocities depicted in Plate 4b is actually considerably larger and may extend southward to 10øN through the region of low data density (Plate 2). Although the dynamical relevance to the near- surface circulation is questionable, we note that this wedge- shaped area of slow flow speeds and limited communication with the subtropical and tropical gyres coincides geographically with the thnventilated shadow zone of LPS thermocline theory [Luyten et al., 1983].
4. Eulerian Mean Circulation
4.1. Construction of the Fields
The quality-controlled drifter velocity measurements were grouped into spatial bins to construct quasi-Eulerian fields of velocity and EKE. In any such analysis there is an inevitable trade-off between spatial resolution, areal coverage, and statistical reliability of the box-averaged quantities. The fields presented here are based on velocity observations grouped into 1 ø x 1 ø boxes. This box size was chosen to provide a reasonable depiction of major ocean circulation features (particularly boundary currents in the subtropical and subpolar regions) while ensuring that most boxes contain sufficient data to form statistically reliable mean values. Only boxes containing a minimum of five independent velocity measurements were retained. Measurements in a given box were judged to be independent if (1) they resulted from different drifters or (2) they resulted from the same drifter but that drifter remained in the box
for more than one Lagrangian integral timescale, taken here to be 10 days. This value is comparable to previous estimates

FRATANTONI: NORTH ATLANTIC SURFACE CIRCULATION IN THE 1990'S 22,071
Plate 3. Temporal and spatial distribution of drifter trajectories for each year from 1990 to1999. Note the shift in observational emphasis from the Gulf Stream region (1990-1992) to the eastern subtropical gyre (1992-1995) to the subpolar gyre (1995-1998) and finally to the western tropical Atlantic and Caribbean Sea (1997-1999)

22,072 FRATANTONI' NORTH ATLANTIC SURFACE CIRCULATION IN THE 1990'S
o o o
c•
o c• •
• o t,..,
o ?•-•
<•

FRATANTONI' NORTH ATLANTIC SURFACE CIRCULATION IN THE 1990'S 22,073
Table 1. Mean and Maximum Speeds of Major North Atlantic Currents
Current Maximum Speed, a Mean Speed. NOBS b cm s -1 cm s -1
South Equatorial Current 145 34 8,788 (35øW-20øW, 5øS-4øN)
North Equatorial Countercurrent 147 42 5,750 (40øW-20øW, 4øN-8øN)
North Brazil Current 171 45 3,621 (60øW-50øW, 5øN - 10øN)
Caribbean Current 123 31 9,669 (75øW-65øW, 11øN-18øN)
Yucatan Current 177 41 2,537 (90øW-84øW, 18øN-22øN)
Gulf of Mexico Loop Current 209 61 2,208 (90øW-80øW, 22øN-28øN)
Florida Current 239 97 277
(81 øW-78øW, 24øN-28øN) Gulf Stream 273 60 10,024
(70øW-60øW, 37øN-39øN) North Atlantic Current 209 38 25,694
(50øW-40øW, 40øN-50øN) Labrador Current 107 21 2,372
(56øW-5 løW, 52øN-56øN) East Greenland Current 188 27 3,864
(45øW-40øW, 58øN-64øN) West Greenland Current 179 27 18,856
(53øW-46øW, 59øN-64øN) Norwegian Current 106 18 34,399
(10øW - 10øE, 61 øN-66øN) Azores Current 111 18 46,099
(45øW-25øW, 32øN-36øN)
a Maximum speed shown is the highest single 6-hourly observation identified in the stated geographic region after the drifter trajectories were quality controlled and filtered to remove tidal and inertial fluctuations (see text for details). Mean speed is the 1990- 2000 average computed over the same region.
b NOBS indicates the total number of individual 6-hourly velocity observations contained within the stated geographic region.
computed by Freeland et al. [1975] and used by Richardson [1983] and agrees with more recent midocean values computed by Bragge [1995] and Martins and Fiuza [2001]. In the smaller sub-basins such as the Norwegian and Caribbean Seas this value is probably an overly conservative estimate (see Poulain et al. [1996] who find an integral timescale of 2-3 days in the Nordic Seas). Our choice of box size results in somewhat higher spatial resolution than previous studies in the Atlantic which used a smaller number of drifters [e.g., Richardson, 1983; Br•igge, 1995; Martins and Fiuza, 2001]. Consequently, the standard error of our box-averaged velocity estimates is, in some regions, larger than these previous studies. In the figures which follow we have suppressed those velocity vectors whose magnitude is smaller than the magnitude of their standard error. No such suppression was enforced for the calculation or display of EKE.
The number of independent velocity measurements per 1 ø square (as defined above) is shown in Plate 5. Data density is highest in the subtropical gyre and the northeastern subpolar gyre. Considerably fewer drifter observations exist at tropical and equatorial latitudes, particularly in the eastern tropical Atlantic. Data density in a given area is a function of both initial deployment density and the intensity of the regional circulation. For example, the relatively low data density in the Straits of Florida and the Gulf of Mexico is, in part, a reflection of the high speed at which drifters transit this region. The high concentration
of drifter observations in the eastern subtropical Atlantic near the Azores results from drifter deployments associated with subduction studies conducted in the early 1990s [e.g., Joyce et al., 1998; Zhou et al., 2000].
4.2. Basin-Scale Summary
The mean surface velocity field for the North Atlantic during the 1990s is presented in Plate 6a. Expanded plots of several subregions will be presented and discussed in greater detail below. In this and subsequent figures, colored vectors are used to highlight the most intense circulation features. A schematic representing the most significant circulation features elucidated by Plate 6a is shown in Plate 6b. Surface velocities greater than 15 and 30 cm s -• (yellow and red vectors, respectively, in Plate 6a) are generally confined to the western boundary currents and to the zonal equatorial jets. Exceptions include the diffuse northeastward flow of the North Atlantic
Current (NAC) between Flemish Cap and the eastern boundary of the Norwegian Basin and the relatively narrow Azores Current flowing eastward along 34øN. The separation of the Gulf Stream from the western boundary at Cape Hatteras is apparent in the 1 ø field, as is the cyclonic rim current in the Labrador Sea. In the western equatorial Atlantic, two branches of the high-velocity South Equatorial Current (SEC) spawn the North Brazil Current

22,074 FRATANTONI: NORTH ATLANTIC SURFACE CIRCULATION IN THE 1990'S
7O
60 - • ,
,i
5O
4O
3O
20-
10
't
lO
5-10
1
ß 15-25
>25
1 O0 90 80 70 60 50 40 30 20 10 0 10
Plate 5. The number of independent velocity observations (see text) per 1 ø square. No symbol is plotted for squares with less than five independent observations.

FRATANTONI: NORTH ATLANTIC SURFACE CIRCULATION IN THE 1990'S 22,075
70
60
5O
4O
3O
2O
10
10
100 90 80 70 60 50 40 30 20 10 0 10
Plate 6. (a) Decadal-mean surface velocity field resulting from the quasi-Eulerian averaging of drifter trajectories in 1 ø square boxes. Vectors are shown only for boxes in which the magnitude of the mean velocity exceeds the standard error. Error ellipses correspond to one standard error in the zonal and meridional directions. Red and yellow vectors indicate velocity magnitudes greater than 30 and 15 cm s -•, respectively. (b) A schematic representing the most significant surface circulation features identified in the drifter-derived mean velocity field. For clarity, several features are abbreviated as follows: Gulf of Mexico Loop Current (LC); Caribbean Current (CC); Irminger Current (IC), Norwegian Current (NC), East and West Greenland Currents (EGC and WGC). (c) Eddy kinetic energy (EKE), defined as one-half the sum of the zonal and meridional velocity variances, resulting from 1 ø quasi-Eulerian averaging of the drifter trajectories

22,076 FRATANTONI' NORTH ATLANTIC SURFACE CIRCULATION IN THE 1990'S
70
60 - ,•
50
40
30
20
10
10
North America
Grad
ß
tream
Greenland
South America
Africa
100 90 80 70 60 50 40 30 20 10 0 10
Plate 6. (continued)

FRATANTONI: NORTH ATLANTIC SURFACE CIRCULATION IN TIlE 1990'S 22,077
1 O0 90 80 70 60 50 40 30 20 10 0 10
0 100 200 300 400 500 1000 1500 2000 2500 3000
Eddy Kinetic Energy (cm2/s 2) Plate 6. (continued)
22,078 FRATANTONI' NORTH ATLANTIC SURFACE CIRCULATION IN THE 1990'S
70
60 -
50 -
40 -
30
20 -
10
10
'• TOPEX/ERS Altimeter EKE
100 90 80 70 60 50 40 30 20 10 0 10
0 100 200 300 400 500 1000 1500 2000 2500 3000
Eddy Kinetic Energy (cm2/s2) Plate 7. EKE in the subtropical and subpolar gyres computed from a blend of ERS and TOPEX satellite altimetry The contour intervals and shading are identical to Plate 6c. Figure based on data provided by Nicolas Ducet

FRATANTONI: NORTH ATLANTIC SURFACE CIRCULATION IN THE 1990'S 22,079
70
60 -
40
30
20
EKE along 5oøW ........ ' ', Difference
Altimeter EKE ,, ,,.
.... "-'-'-"V :\\ •r• / ••rifterEKE 1000 w •
500 -
o
40 5O Latitude
o• i -"
1 O0 90 80 70 60 50 40 30 20 10 0 10
Altimeter > Drifter I Drifter > Altimeter
-250 0 250
Eddy Kinetic Energy Difference (cm•/s •)
Plate 8. The point-by-point difference between drifter- and altimeter-derived 1 ø EKE fields (i.e., Plate 7 subtracted from Plate 6c.) Red (blue) shades indicate drifter EKE values larger (smaller) than those resulting from altimeter measurements. Grey areas contain insufficient data for valid comparison. Inset shows EKE and EKE difference along 50øW between 30 ø and 50øN. Note the smoother, broader peak associated with the Gulf Stream in the drifter- derived EKE and the resulting difference pattern.

22,080 FRATANTONI' NORTH ATLANTIC SURFACE CIRCULATION IN THE 1990'S
(NBC) which subsequently retroflects near 8øN to form the eastward North Equatorial Countercurrent (NECC). Both the mean velocities and their standard error ellipses are particularly large in the weakly sampled but strongly time-dependent low- latitude Atlantic. An almost complete lack of data in the northeastern tropical Atlantic near the Cape Verde Islands prevents comparison with recently reported energetic northward flows along the eastern boundary at intermediate depths [Fratantoni and Richardson, 1999].
The apparent termination of the NECC in the Gulf of Guinea as indicated by the abrupt cessation of drifter trajectories and velocity vectors in this region is curious (Plates 2 and 6a). Drifters enter the Gulf of Guinea from the west, but, in the mean, few appear to exit the region to the south. In fact, several individual drifters entering the Gulf are observed to wander slowly towards the west during the seasonal reversal of the NECC in the eastern Atlantic [e.g., Richardson and Reverdin, 1987]. Previous drifter observations in this area during the SEQUAL experiment [Richardson, 1984; Richardson and Reverdin, 1987] revealed a similar circulation pattern with little evidence for southward migration of drifters along the eastern boundary.
Over most of the North Atlantic there is relatively little difference between the large-scale surface circulation observed with drifters and the "expected" wind-driven circulation based on the curl of the wind stress and linear Sverdrup theory [e.g., Mayer and Weisberg, 1993; Fratantoni et al., 2000]. In the central and western tropical Atlantic (e.g., 40ø-60 o W, 10 ø-20 øN) the present drifter compilation indicates occasional northward surface velocities that, although relatively small (5-15 cm s-t), are nearly perpendicular to the expected near-zonal interior Sverdrup circulation. The Ekman component of surface velocity (proportional to the wind stress and inversely proportional to latitude) constitutes a substantial fraction of the total surface velocity in this area and results in drifter-derived mean velocities directed to the right of the northeast trade winds. Methods of velocity measurement relying solely on geostrophic calculations (e.g., shipboard hydrographic measurements, satellite altimetry) cannot directly observe the ageostrophic Ekman component of the surface velocity field.
The basin-scale EKE field computed from the box- averaged drifter data is shown in Plate 6c. The distribution of EKE represents a combination of the temporal and spatial current variability within each 1 ø box. Previous investigators, most notably Richardson [1983], carefully considered the impact of time-varying surface winds on drifter measurements of oceanic EKE. Van Meurs and Nillet [ 1997] describe a method by which the variance associated with the Ekman component of surface drifter motion (that is, due to local winds and not to the large- scale ocean circulation) can be estimated from an independent estimate of the time-varying wind stress field. Ducet et al. [1999] applied this technique to a large collection of recent surthce drifter trajectories in the North Atlantic. They found the drifter- derived EKE associated with the Ekman component of the surface currents to be smaller than 20 cm 2 s -2 everywhere in the North Atlantic. This wind-induced variance is considerably smaller than the dominant spatial variation of EKE in the western Atlantic and well below the expected error of the EKE computations. Accordingly, we did not repeat the analysis of Ducet et al. [1999] nor did we apply any correction for wind- induced current variance to the computed EKE field.
The highest EKE values in the North Atlantic are fbund in the Gulf Stream downstream of the New England Seamounts (near 40øN, 60øW). We find EKE values approaching 2800 cm 2 s -2 in this area, in close agreement with the earlier results of Richardson [1983]. Locally enhanced EKE is also observed in the Gulf of Mexico (associated with the Loop Current; peak value near 2000 cm 2 s '2) and in the western tropical Atlantic near the NBC retroflection (maximum 1300 cm 2 s -2 near 8øN, 52øW). A
3000
2000 LU
• 1000 e o Oo o%•oo o
o o s o o o •o%o,1•o o
lOOO 2000
Drifter EKE (cm2/s 2) 3OOO
000
500
i:5 -5OO
tu -1000
0 2o 4o 6o
Latitude
•" 1000] .... ' .... I , , • o ø
E
o 5oo- t ,o o c 0
:, :, m -• 000 , ,
0 • 000 20O0
Drifter EKE (cm2/s
o
o
3000
Figure 2. Comparison of drifter- and altimeter-derived EKE measurements presented in three different ways. (a) Drifter- derived EKE versus altimeter-derived EKE. Drifter EKE values
are generally slightly higher than altimeter-derived values. (b) The difference between drifter- and altimeter-derived EKE (i.e., the values displayed in Plate 8) presented as a function of latitude. The solid line denotes a 1 ø zonal average of the EKE difference. Maximum differences occur near the North Brazil Current
retroflection (8øN) and near the latitude of the Gulf Stream extension (40øN). (c) EKE difference presented as a function of drifter EKE.
swath of elevated EKE associated with the NBC ring translation corridor [e.g., Fratantoni et al., 2000] extends northwestward along the South American coast to the Lesser Antilles. Typical EKE magnitudes in the well-sampled but low-energy eastern

FRATANTONI: NORTH ATLANTIC SURFACE CIRCULATION IN THE 1990'S 22,081
subtropical gyre range from 45 to 60 cm 2 s -2. Other interesting features include a zonal band of slightly elevated EKE along 35øN associated with the Azores Current and Front [see Rudnick and Luyten, 1996] and a localized region of significantly enhanced EKE associated with the West Greenland Current
(60øN) in the Labrador Sea. Enhanced eddy energy in the latter area has been recently observed by Cuny et al. [2001 ] (hereinafter referred to as Cuny et al. [2001] using a subset of the surface drifters described herein, by Prater [2001] using satellite altimetry, and by Lilly et al. [2001] using moored velocity observations. Drifter observations in this region are discussed below •n greater detail.
In Plates 7 and 8 and in Figure 2 we compare the drifter-derived EKE field with a similar product computed from a blend of TOPEX and ERS satellite altimetry obtained during the period 1992-1998 (N. Ducet, personal communication, 2000). At lowest order the agreement between the two products is reasonably good, with many similarities in the large-scale structure of the EKE field (Plates 6c and 7). Both depictions include the multiple high-EKE lobes located east of the Grand Banks and the swath of elevated EKE associated with the zonal
Azores current. Notable differences occur near the Lesser
Antilles in the eastern Caribbean, the Gulf Stream region, and in the subpolar gyre including the Labrador Sea (Plate 8). The enhanced EKE in the Labrador Sea seen in Plate 6c is not
represented as strongly in the altimeter-derived field (Plate 7). RMS sea level anomalies from ERS and TOPEX (not shown) confirm the localized region of enhanced sea surface height variability in the vicinity of the West Greenland Current as seen in the drifter-based EKE field. Prater [2001] has recently shown that TOPEX sea surface height variability in this area exhibits a strong seasonal cycle, with greatest variability occurring in winter.
Over most of the Atlantic basin the driller-derived EKE
values are O(100 cm 2 s -2) higher than the corresponding altimeter-derived values (Plate 8 and Figure 2). In the Gulf Stream region (40øN) the altimeter-derived EKE differs by more than 500 cm 2 s -2 from that implied by the drifters in a symmetric manner centered about the approximate mean path of the Gulf Stream (Figure 2). A smaller but more consistent offset is also noted near the North Brazil Current retroflection (8øN) and in the Labrador Sea and subpolar gyre (50ø-65øN) with drifter EKE values everywhere higher than altimeter values. One complicating factor of such a comparison is that the drifter-derived EKE field is necessarily smoother than the altimeter-based field due to differences in measurement resolution and spatial/temporal averaging. This smoothness is the most likely explanation for the large and symmetric differences near the Gulf Stream axis where small differences in the inferred mcridional location and width of
the mean jet result in locally large EKE differences between the two data products (see inset, Plate 8). As shown in Figure 2c, the difference between drifter- and altimeter-derived EKE is greatest in high-EKE regions. This is consistent with an expectation that more energetic regions are likely to exhibit greater ageostrophic (i.e., inertial and/or Ekman) velocity contributions that are immeasurable with satellite altimetry. In contrast, the largest EKE differences (found in the Gulf Stream region) reflect spatial differences near the Gulf Stream due to smoothing as described above and are not systematically biased.
4.3. Regional Discussion
In this section we examine in greater detail some of the salient features of the North Atlantic circulation revealed by this drifter compilation. Three regions are discussed in detail: The Gulf Stream and North Atlantic Current, the Labrador Sea and subpolar gyre, and the Caribbean Sea.
4.3.1. Gulf Stream and North Atlantic
Current. Plate 9 depicts the mean surface circulation and EKE in the vicinity of the Gulf Stream. Note the step-like northward jump in the latitude of maximum eastward velocity between 65øW and 60øW and the ensuing broadening of the zonal Gulf Stream extension. This northward shift of the Gulf Stream at the longitude of the New England Seamounts (near 63øW, 38øN) was first noted by Richardson [1980] in an investigation of the climatological temperature field at mid-thermocline depth. This shift is particularly evident in Figure 3, in which meridional profiles of eastward velocity and EKE across the Gulf Stream are shown at several longitudes. Downstream of the seamounts the cross-stream structure of
both velocity and EKE are indicative of a wider and more energetic eastward flow. Although they do not appear clearly in the mean vector plot, counterflows reminiscent of a southern recirculation gym [e.g., Hogg, 1992] are evident at every longitude in Figure 3a.
At least three significant anticyclonic recirculation cells (schematized in Plate 6b) are evident in the mean velocity field. One is located south of Gulf Stream extension (near 50øW, 39øN) and another east of the North Atlantic Current (NAC) in the Newfoundland Basin (near 45øW, 41øNs). The position of these cells appears to be related to the location of abrupt bathymetric features, the first located just south of the protruding Southeast Newfoundland Ridge and the second trapped between this ridge and the Milne Seamounts located near 40øW. A third
anticyclonic feature, located in the northern Newfoundland Basin near 40øW, 50øN. is a representation of the time-averaged Northwest Corner of the NAC. Using surface drifters and tracer measurements, Lazier [1994] found that this retrofiection of the NAC was highly variable in both its intensity and its path. Temporal averaging of such variability results in the rather ill- defined quasi-Eulerian mean flow depicted in Plate 9a. Nevertheless, the northern extent of the Northwest Corner in Plate 9a, near 52øN. is in close agreement with the synoptic observations of Lazier [1994] and the historical summary of Kearns and Rossby [ 1998].
North of the Gulf Stream there is a weak but consistent
equatorward flow along the continental shelf between Cape Cod and Chesapeake Bay. Similarly, the Labrador Current merges with an equatorward current inshore of the NAC which flows parallel to the shelfbreak around Flemish Cap. Based on tracer distributions, Chapman and Beardsley [1989] hypothesized a continuous shelfbreak current from the southern coast of
Greenland to the Mid-Atlantic Bight. While the mean surface field is suggestive of such a connection, horizontal resolution and data density on the southern periphery of the Grand Banks is insufficient to reveal a continuous surface flow between these two
regions. The mean path of the Gulf Stream inferred from
satellite surface temperature observations [Lee and Cornillon, 1996] is superimposed on the regional EKE field in Plate 9b. The highest EKE values in the northwest Atlantic are found along the mean path of the Gulf Stream jet and reach a maximum of 2790 cm • s -• at 39øN, 61øW. An isolated lobe of elevated EKE due east of Newfoundland is near the retrofiection of the NAC at the
Northeast Corner. Note that the highest velocities and attendant high EKE values (Plate 9b) associated with the retrofiection of the NAC are generally contained within the 4000 m isobath. Also shown in Plate 9b are the principal axes of variation [Fofonoff, 1969] which define a normal set of coordinates such that the cross correlation of the fluctuating velocity components vanishes (<u'v'>-0). In general, the observed variance in the Gulf Stream

22,082 FRATANTONI: NORTH ATLANTIC SURFACE CIRCULATION IN THE 1990'S
50
40
30
50 -
40
30
80 70 6O 50 40 30
0 100 200 300 400 500 1000 1500 2000 2500 aooo
Eddy Kinetic Energy (cm2/s 2)
Plate 9. (a) Mean velocity and (b) EKE for a region encompassing the Gulf Stream. The mean path of the Gulf Stream inferred from satellite sea surface temperature observations [Lee and Cornilion, 1996] is superimposed.

FRATANTONI: NORTH ATLANTIC SURFACE CIRCULATION IN THE 1990'S 22,083
70
60
50
70
60
50
60 50 40 30 20 10 0 10
! I I
0 100 200 300 400 500 1000 1500 2000 2500 3000
Eddy Kinetic Energy (cm2/5 2)
Plate 10. (a) Mean velocity and (b) EKE for a region encompassing the Labrador Sea and the subpolar gyre

22,084 FRATANTONI: NORTH ATLANTIC SURFACE CIRCULATION IN THE 1990'S
70W 65W 60W 55W 50W
-50 0 50 100 150 200 250
U (cm/s)
70W 65W 60W 55W 50W
0 1000 2000 3000 4000 5000 6000
EKE (cm2/s 2) Figure 3. Meridional profiles of drifter-derived (a) zonal velocity and (b) EKE across the axis of the Gulf Stream at several longitudes. Individual profiles are offset by (a) 50 cm s '1 and (b) 1000 cm 2 s -2.
and its extension is nearly isotropic. Near continental margins the primary direction of variance is parallel to the topographic slope. In Plate 9b this is most evident near the separation of the Gulf Stream from the coast at 33ø-36øN and adjacent to the Grand Banks.
4.3.2. Labrador Sea and subpolar gyre. The mean surface velocity and EKE fields for the Labrador Sea and subpolar gyre are shown in Plate 10. Clearly evident are the East and West Greenland Currents and their continuation as a rim current into the southeastward Labrador Current. Recent
observations by Lavender et al. [2000] at midthermocline depths have revealed an anticyclonic counterflow just offshore of this rim current system. We do not detect such a circulation feature in the 1 o averaged data set, nor do we find compelling evidence for such a pathway based on individual drifter trajectories. Cuny et al. [2001] performed a similar quasi-Eulerian averaging procedure on a comparable collection of surface drifter data in the Labrador Sea at somewhat higher resolution and, upon application of a objective interpolation procedure, recovered the suggestion of a surface counterflow. The counterflows observed by Cuny et al. [2001] and Lavender et al. [2000] appear to be composed of a series of elongated cyclonic recirculation cells. When box-averaged to generate a quasi-Eulerian velocity field, the relatively constant offshore segment of these cells (i.e., the flow parallel to but opposite the boundary current) survives the averaging process while the more spatially variable cross-shore segments are diminished. The lack of such a mean counterflow in
the present compilation (Plate 10a) is likely due to fundamental differences in resolution (Cuny et al. [2001]) use løx 0.5 ø boxes versus 1 ø x 1 ø in the present study) and the relatively restrictive nature of our averaging scheme. While we require a minimum of five independent observations (as many as 50 days) per box, Cuny et al. [2001] require just six drifter days of data for each box. A consequence is that only the most temporally and spatially robust circulation features appear in Plate 10a.
EKE in the Labrador Sea (Plate 10b) is generally a full order of magnitude smaller than in the Gulf Stream region with a maximum value near 450 cm 2 s -2 at 62øN, 53øW. The localized region of high EKE west of Greenland extends, with reduced amplitude, southwestward across the full width of the basin. As depicted in satellite temperature imagery by Prater [2001], the central Labrador Sea is full of eddies assumed to be spawned by instabilities of the rim current system. Prater [2001] used acoustically tracked subsurface RAFOS floats to determine the kinematic properties of several of these eddies, and Lilly [2001] and Lilly et al. [2001] describe the water mass and velocity structure of the eddies using moored data. A closer examination of individual surface drifter trajectories in this region (Plate 11) indicates that a large fraction of the drifters rounding Cape Farewell in the East/West Greenland Current leave the boundary current between 60 ø and 62øN and enter the interior where they loop and meander for an extended period. Similar observations of 1ooping surface drifters in the central Labrador Sea were noted by Cuny et al. [2001]. We identified 21 drifters in the compilation that rounded Cape Farewell within 100 km of the Greenland coast. Of these, 14 left the boundary and entered the
18
16
14
Drifters .........
ADCP ..........
12
-i00 -75 -50 -25 0 25
U (cm!s) Figure 4. A comparison of meridional sections of zonal velocity across the Caribbean Sea at 66øW obtained from surface drifters
(solid) and a 1997 shipboard ADCP section [Hernandez-Guerra and Joyce, 2000] (dashed). The ADCP measurements have been averaged by latitude into 0.5 ø bins, and the drifter observations were averaged into 3 ø longitude x 0.5 ø latitude boxes centered on 66øW. The shaded region corresponds to one standard error.
FRATANTONI: NORTH ATLANTIC SURFACE CIRCULATION IN THE 1990'S 22,085
North Atlantic
Current
Gulf Stream
50N
Newfoundland
Basin
40N
70W
Gulf Stream
Extension
50W 30W
25OO
2OOO
--• 1500
E o
LLI 1000
5O0
Gulf Stream Gulf Stream Newfoundland North Atlantic
Extension Basin Current
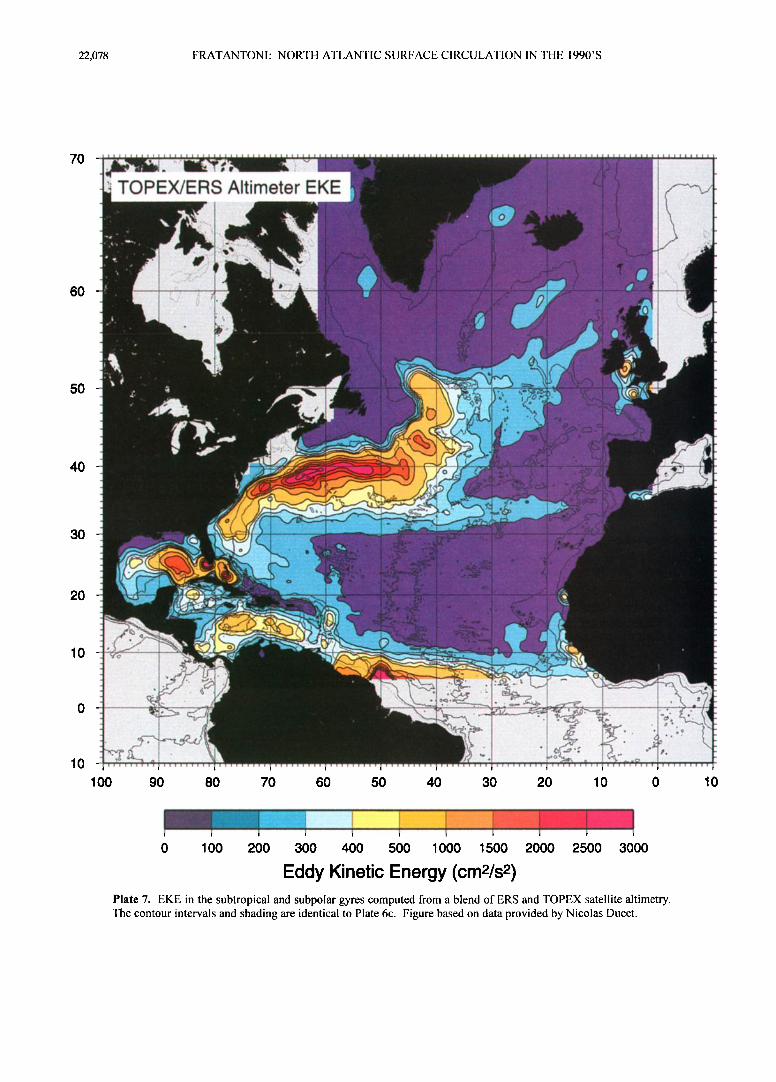
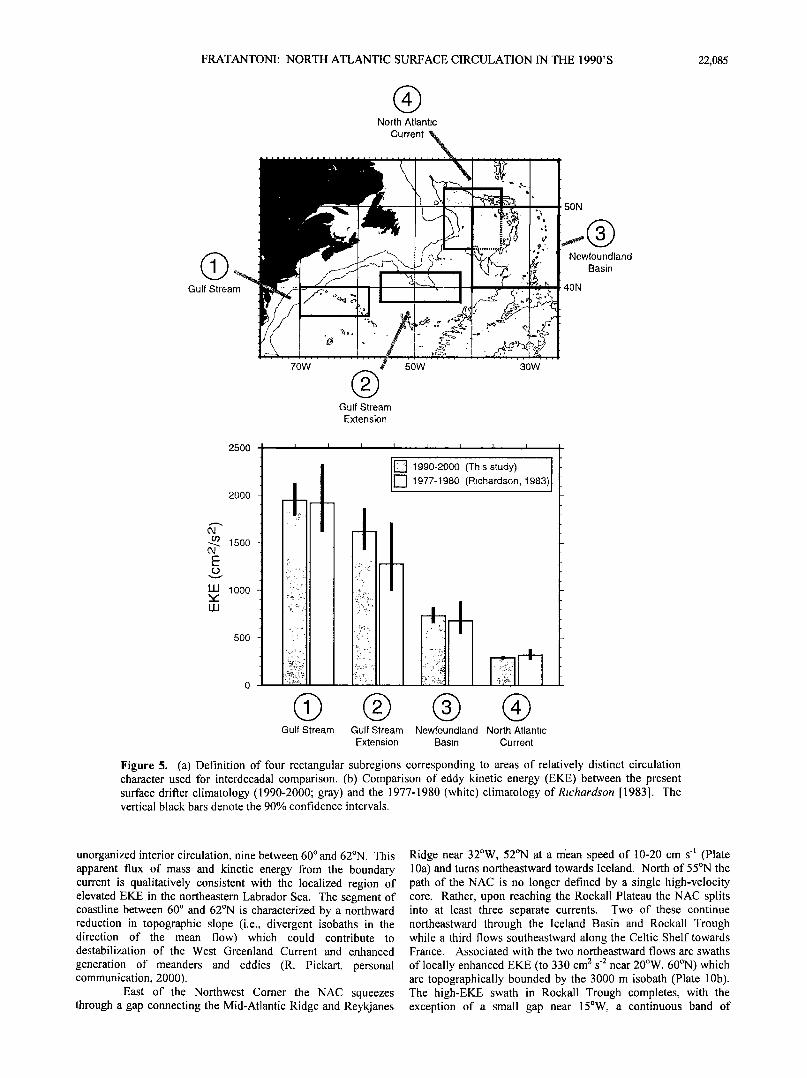
Figure 5. (a) Definition of four rectangular subregions corresponding to areas of relatively distinct circulation character used for interdecadal comparison. (b) Comparison of eddy kinetic energy (EKE) between the present surface drifter climatology (1990-2000; gray) and the 1977-1980 (white) climatology of Richardson [ 1983]. The vertical black bars denote the 90% confidence intervals.
unorganized interior circulation, nine between 60 ø and 62øN. This Ridge near 32øW, 52øN at a mean speed of 10-20 cm s -• (Plate apparent flux of mass and kinetic energy from the boundary 10a) and turns northeastward towards Iceland. North of 55øN the current is qualitatively consistent with the localized region of path of the NAC is no longer defined by a single high-velocity elevated EKE in the northeastern Labrador Sea. The segment of coastline between 60 ø and 62øN is characterized by a northward reduction in topographic slope (i.e., divergent isobaths in the direction of the mean flow) which could contribute to destabilization of the West Greenland Current and enhanced
generation of meanders and eddies (R. Pickart, personal communication, 2000).
East of the Northwest Corner the NAC squeezes through a gap connecting the Mid-Atlantic Ridge and Reykjanes
core. Rather, upon reaching the Rockall Plateau the NAC splits into at least three separate currents. Two of these continue northeastward through the Iceland Basin and Rockall Trough while a third flows southeastward along the Celtic Shelf towards France. Associated with the two northeastward flows are swaths
of locally enhanced EKE (to 330 cm 2 s -2 near 20øW, 60øN) which are topographically bounded by the 3000 m isobath (Plate 10b). The high-EKE swath in Rockall Trough completes, with the exception of a small gap near 15øW, a continuous band of

22,086 FRATANTONI: NORTH ATLANTIC SURFACE CIRCULATION IN THE 1990'S
65
60
55
60 55 50 45 4O
0 100 200 300 400 500 1000 1500 2000 2500 3000
Eddy Kinetic Energy (cm2/s 2) Plate 11. Enlarged ¾i½w of EKE; and individual drifter trajectories in the Labrador Sea. All aYailablc trajectories arc shown. Trajectories of drifters which pass within 100 km oœ Cape Farewell in the East Greenland Current arc hishlishtcd in red.

FRATANTONI' NORTH ATLANTIC SURFACE CIRCULATION IN THE 1990'S 22,087
x ß fiDO
20 .
(3'
lO
• •o •OO •
o
ß
.
1000 cm2/s 2
90 80 70 60
i !
0 100 200 300 400 500 1000 1500 2000 2500 3000
Eddy Kinetic Energy (cm•/s 2) Plate 12, (a) Mean velocity and (b) EKE œor a region encompassing the Caribbean Sea

22,088 FRATANTONI: NORTH ATLANTIC SURFACE CIRCULATION IN THE 1990'S
40 65W • t 1977-198o• ,-
-10
3oo 55W
1oo
500
45 40 35 30 45 40 35 30
Latitude Latitude
Figure 6. A comparison of the meridional structure of (top) zonal velocity and (bottom) EKE between the present surface drifter climatology (1990-2000; dashed) and the 1977-1980 (solid) climatology of Richardson [1983]. Error bars indicate 90% confidence bounds.
elevated eddy energy stretching from Flemish Cap into the Norwegian Basin. In the Norwegian Basin the mean velocity field is in close agreement with the more detailed regional study of Poulain et al. [1996] and indicates a fast 25-50 cm s -• northeastward boundary current along the Norwegian coast.
There is a weak but significant anticyclonic flow around much of Iceland with the exception of the southeast quadrant where the flow direction is more variable. Though the density of observations is quite high in this area (Plate 5), the magnitude of the mean flow does not generally exceed its
Gulf of Mexico and is the upstream origin of the Florida Current / Gulf Stream system. Surface velocities in the Caribbean Sea are highest (70 cm s -l) near the southern boundary along the coast of Venezuela and the Netherlands Antilles (Plate 12a). In agreement with both historical inferences from hydrographic measurements [e.g., Wast, 1964; Gordon, 1967] and more recent observations and numerical models [Johns et al., 2001], the inflow to the eastern Caribbean Sea in the surface layer is dominated by flow through the Grenada, St. Vincent, and St. Lucia Passages. The drifter-derived 1 ø mean velocity field does not resolve these
standard error. Several individual drifter trajectories (not shown individual passages but does indicate a clear distinction in inflow in detail, but see Plate 3)follow segments of this pathway. East of strength and significance to the north and south of Martinique Greenland there is evidence for a large cyclonic recirculation in (61øW, 14øN). An intense recirculation gyre in the southwest the Irminger Sea bounded on the east by the Reykjanes Ridge. No particular distinction is evident in the velocity field between the East Greenland and Irminger Currents. The latter, generally warm and salty, is located adjacent to and offshore of the colder, fresher, shelfbreak-trapped East Greenland Current and both exhibit similar surface velocities in shipboard hydrographic sections (R. Pickart, personal communication, 2001).
4.3.3. Caribbean Sea. The westward flowing Caribbean Current connects the western tropical Atlantic with the
corner of the Colombian Basin (80øW, 12øN) is more than 200 km wide and drives strong (60 cm s -l) boundary currents along the Panamanian and Colombian coasts. There is minimal flow over the Nicaragua Rise with most of the northwestward flow channeled through a trough southwest of Jamaica. Once past this obstruction the flow turns sharply westward while crossing the Cayman Basin and enters the Gulf of Mexico as a narrow current boundary intensified against the Yucatan Peninsula.
A band of elevated EKE follows the South American

FRATANTONI: NORTH ATLANTIC SURFACE CIRCULATION IN THE 1990'S 22,089
coastline from the NBC retrofiection near 8øN to the Windward
Islands and across the Caribbean towards Jamaica (Plate 12b). External to the Caribbean Basin and northward along the Atlantic side of the Lesser Antilles the region of elevated EKE can be traced to translating NBC rings [Johns et al., 1990; Richardson et al., 1994; Fratantoni et al., 1995]. Inside the Caribbean the origin of this high-EKE band is less clear. Recent Lagrangian observations [Fratantoni et al., 1999; Glickson et al., 2000] support the notion of North Brazil Current ring destruction on the eastern flank of the Lesser Antilles followed by westward drift of ring fragments into the Caribbean. Using a numerical simulation, Murphy et al. [1999] found that eddy variability inside the Caribbean results from a combination of westward advected
potential vorticity generated by flow through the Windward Island passages and locally generated eddy energy resulting from instabilities of the zonal Caribbean Current. Molinari et al.
[1981] suggested, based on drifter observations, that the abrupt topography of the Aves and Beatta Ridges (64øW and 72øW, respectively) may be responsible for much of the mesoscale meandering of the Caribbean Current, much like the impact of the New England Seamounts on the Gulf Stream as discussed above. Further analysis beyond the scope of this study is required to reconcile the various in situ, remote, and numerical inferences about the characteristics and sources of eastern Caribbean surface
variability. The apparent importance of external mesoscale
phenomena on the circulation of the eastern Caribbean leads us to wonder if the "mean" flow field depicted by the present drifter climatology bears any resemblance to synoptic reality. To investigate this, we compared a zonal velocity profile derived from the drifter climatology with a shipboard acoustic Doppler current profiler (ADCP) section obtained during a meridional section along 66øW occupied in 1997 and described by Hernc•ndez-Guerra and Joyce [2000]. For this comparison the ADCP measurements (at 20 m depth) were averaged by latitude into 0.5 o bins, and the drifter observations were averaged into 3 ø longitude x 0.5 ø latitude boxes centered on 66øW. Away from the southern boundary the agreement between the synoptic ADCP section and the mean drifter profile is generally quite good, with a relative minimum in westward flow near mid-basin and a general increase towards the south (Figure 4). Neither the drifter climatology nor the ADCP measurements indicate substantial westward flow in the northern half basin at 66øW. Near the
southern boundary (the Netherlands Antilles) the shipboard ADCP section indicates a fast westward jet approximately 150 km in width. The absence of this strong, boundary-intensified feature in the drifter climatology is likely due to a combination of both spatial and temporal sampling differences. An examination of the regional wind field [e.g., Mayer and Weisberg, 1993] suggests that the upwelling-favorable easterly trades should force a seasonally varying coastal boundary current. Such a seasonal current would be significantly diminished in the multiyear, multiseason mean velocity field.
Finally, if we assume the drifter-derived mean velocities on the 66øW trans-Caribbean section diminish to one-
half their surface values at 100 m depth (consistent with ADCP shear observations by Hernandez-Guerra and Joyce [2000]), then the total implied transport above 100 m is approximately 9 +/- 4 Sv. This agrees reasonably well with the 8.9 Sv estimate of Schmitz and Richardson [1991] of Caribbean inflow transport warmer than 24øC.
5. Can Drifter Measurements Be Used to Identify Interdecadal Circulation Changes?
Having assembled a drifter climatology with limited temporal scope it seems reasonable to ask whether the decade of
the 1990s was significantly different from other time periods with respect to surface circulation and variability. This comparison is motivated in part by recent investigations of decadal variability using historical North Atlantic hydrography. In particular, Curry and McCartney [2001] present evidence in support of a relationship between baroclinic ocean transport in the North Atlantic subtropical gyre and the phase of the atmospheric North Atlantic Oscillation (NAO). Curry and McCartney [2001] hypothesize, and eventually substantiate using a monumental hydrographic database [Curry, 1996], that oscillating wind forcing associated with the NAO results in changes in the distribution of oceanic potential energy throughout the subtropical North Atlantic. We speculate that these potential energy changes (e.g., changes to tbermocline depth as a result of wind stress curl and/or buoyancy forcing) should express themselves as observable changes in upper ocean kinetic energy in the form of enhancement of the mean circulation and/or
increase in the amplitude of eddy variability. Richardson [1983] (R83 hereinafter) synthesized a
relatively small collection of North Atlantic surface drifter measurements (110 individual drifters) during the period 1977- 1980. This time interval coincides with a period during which the NAO index [Hurtell, 1995] was relatively low (Plate 13). In contrast, the 1990s were characterized by particularly high values of the NAO index. Elevated values of the NAO index correspond to stronger westerly winds and tend to result in a more northerly Gulf Stream position [Taylor and Stephens, 1998] and a stronger subtropical gyre / Gulf Stream transport [Curry and McCartney, 2001]. Indices for these characteristics are displayed with the NAO index in Plate 13. Note that all three indices were relatively low in the late 1970s and relatively high in the 1990s. We hypothesize that variations in the baroclinic transport of the subtropical gym / Gulf Stream system associated with the NAO should result in observable changes in the surface circulation. In particular. we expect to observe a stronger Gulf Stream in a more northerly position during the 1990s than during the 1970s. We further speculate that a stronger Gulf Stream should exhibit enhanced EKE as a result of increased thermocline slope and horizontal velocity shear.
To investigate this possibility we compared the R83 quasi-Eulerian circulation statistics with those resulting from the 1990-2000 analysis. There are significant differences in both data volume and spatial distribution between the two climatologies. The 1990-2000 climatology contains almost an order of magnitude more data than the 1977-1980 analysis, and the data are distributed more widely about the North Atlantic. We tried to minimize the importance of this difference in data coverage by concentrating the comparisons on a region encompassing the Gulf Stream and the North Atlantic Current, features that are reasonably well sampled in both analyses. We first computed the area-averaged surface velocity and EKE within four spatial subregions (Figure 5) using both drifter climatologies. No significant increase in average surface velocity was identified in any of the four regions (Table 2). Although increases in EKE were noted relative to the R83 measurements in the Gulf Stream
(1%), Gulf Stream extension (25%), and Newfoundland Basin (8%) subregions, the inferred interdecadal differences were smaller than the 90% confidence limits on the individual
climatologies (Figure 5). Note, however, that the R83 climatology includes both drogued and undrogued drifter trajectories. The R83 EKE values could therefore be overestimates of the true eddy energy, particularly in the Gulf Stream region where large wind stresses and strong synoptic atmospheric variability may account for much of the motion of an undrogued surface drifter. Were a correction for this measurement discrepancy possible, the impact would be to enhance the inferred interdecadal differences in EKE amplitude by lowering the R83 EKE estimates.

22,090 FRATANTONI: NORTH ATLANTIC SURFACE CIRCULATION IN THE 1990'S
, , o3 3.0 x --- 70 Transport Index _
• • 2.0 : •60 10 E
1950
I .-- -o.o ß ' * •' -1.0 ..--
•T,' Gulf Stream 'lnde x -2.0 (5 1960 1970 1980 1990 2000
Plate 13. The North Atlantic Oscillation (NAO) index for the past 50 years (histogram from Hurrell [1995]) Red (blue) bars denote high (low) values of the index. Also shown is the Taylor and Stephens [ 1998] Gulf Stream index (green, positive indicates a northward excursion of the current), and the Curry and McCartney [2001] subtropical gyre transport index (black). Time intervals corresponding to the Richardson [1983] surface drifter analysis (1977- 1980) and the present analysis (1990-2000) are shaded. Note that all three indices were relatively low in the late 1970s and high in the 1990s. Figure adapted from Curry and McCartney (2001).
In Figure 6 we compare sections of zonal velocity and EKE across the Gulf Stream at 55øW and 65øW. Values at each
latitude were computed for 10 ø x 1 ø boxes centered on the appropriate longitude. At 65øW there is very little difference between the eastward velocity measured by R83 and the present drifter compilation. The structure of the jet appears somewhat narrower in the 1990-2000 time period than during 1977-1980, perhaps due to the inclusion of drifters intentionally launched in Gulf Stream rings in the late 1970s. At 55øW there is a slight (1 ø latitude) northward shift in the location of the eastward jet and the associated EKE maximum in the 1990-2000 climatology relative
to the 1977-1980 realization. The sense of this shift is consistent with our initial hypothesis based on the phase of the NAO but is only barely significant at the 90% level. Similar comparisons were made using temporal subsets of the present drifter compilation (e.g., 1990-1995: 1993-1995) in an attempt to strengthen the contrast between the two time periods by neglecting the late-1990s downturn in the NAO, Gulf Stream, and transport indices (Plate 13). These further comparisons did yield results suggestive of interdecadal change but at still lower significance levels due to the reduced data quantity. We conclude that the available drifter observations of surface velocity and EKE
Table 2. Comparison of Velocity and EKE in Four Subregions of the North Atlantic a
U V EKE OBS b GulfStream
1990-2000 16.2 +/- 2.6 3.7 +/- 2.0 1947 +181/-158 724 1977-1980 15 +/- 6 2 +/- 5 1920 +400/-300 167
GulfStream Extension
1990-2000 17.2 +/- 3.3 0.5 +/- 3.2 1623 +244/- 197 300 1977-1980 18 +/- 7 -2 +/- 7 1280 +430/-280 76
Newfoundland Basin
1990-2000 6.9 +/- 1.8 1.9 +/- 1.9 732 +89/-75 439 1977-1980 8 +/- 5 2 +/- 4 680 +210/- 140 91
North Atlantic Current
1990-2000 4.0 +/- 0.6 -1.2 +/- 0.6 293 +22/-19 1424 1977-1980 9 +/- 2 0 +/- 2 320 +60/-50 189
a Uncertainties provided are one standard error for velocity and 90% confidence intervals for EKE. b Number of observations refers to the number of independent velocity measurements (as defined in text) for the 1990-2000
climatology and to the number of degrees of freedom assuming one degree of freedom corresponds to 20 semidaily velocity observations.
FRATANTONI: NORTH ATLANTIC SURFACE CIRCULATION IN THE 1990'S 22,091
in the vicinity of the Gulf Stream are insufficient to substantiate a significant change in regional circulation strength or character from the late 1970s to the 1990s.
6. Summary and Conclusions
In this article we described the compilation of a new self-consistent drifter climatology which summarizes the state of the North Atlantic surface circulation during the 1990s. Approximately 1500 quality-controlled, satellite-tracked drifter trajectories were used to construct quasi-Eulerian mean fields of velocity and eddy kinetic energy. The most significant circulation features revealed in these fields were examined in
detail and interpreted in light of supporting hydrographic and remotely sensed observations. Finally, we attempted to substantiate a hypothesis that variations in the baroclinic transport of the subtropical gyre / Gulf Stream system associated with decadal changes in atmospheric forcing would result in observable changes in North Atlantic surface circulation. The main conclusions of this study can be summarized as follows.
I n During the period 1990-1999, drifter data density was found to be highest in the western subtropical gyre and the northeastern subpolar gyre with considerably fewer observations at tropical and equatorial latitudes. In particular, we find there are insufficient drifter measurements in the eastern tropical Atlantic to adequately describe the regional surface circulation. Mean velocities significantly different from zero exist over only a small fraction of the surface area of the North Atlantic.
2. The swiftest drifter motions were found in the
equatorial region and along the tropical, subtropical, and subpolar western boundaries. The maximum instantaneous speed recorded by a single drifter was 273 cm s -• in the Gulf Stream southeast of Cape Cod. The greatest number of persistently slow-moving drifters were found in the eastern subtropical Atlantic and in the Norwegian and Irminger Seas adjacent to Iceland. The highest EKE value in the North Atlantic (2790 cm 2 s -2) was found in the Gulf Stream just downstream of the New England Seamounts. High values of EKE were also observed in the Gulf of Mexico (peak value near 2000 cm 2 s -2) and in the western tropical Atlantic near the NBC retrofiection (maximum 1300 cm 2 s-2). Typical EKE magnitudes in the well-sampled but low-energy eastern subtropical gyre range from 45 to 60 cm 2 s '2.
3. Over most of the Atlantic basin, drifter-derived EKE values were found to be O(100 cm 2 s -•) higher than corresponding values derived from satellite altimetry. In the Gulf Stream region the altimeter-derived EKE differed by more than 500 cm 2 s -2 from that implied by the drifters in a symmetric manner centered about the approximate mean path of the Gulf Stream. This discrepancy is thought to result largely from differences in the spatial resolution and temporal averaging associated with the two measurement techniques. Other areas of significant disagreement include the NBC retrofiection region and the Labrador Sea.
4. In the northeastern Labrador Sea a region of sharply elevated EKE appears to be geographically related to localized ejection of drifters from the West Greenland Current between 60 ø and 62øN. The observed rotary character of surface drifter trajectories in the central Labrador Sea warrants further investigation of individual eddy features to determine if they are dynamically similar to translating eddies identified by Prater [2001] with subsurface floats at 375 m depth. We were unable to detect in our mean velocity field an anticyclonic counterflow offshore of the Labrador Sea rim current system reported recently by Lavender et al. [2000] and Cuny et al. [2001]. We surmise that this counterflow, at least at the surface, results from the rectification of smaller time-varying and spatially varying
recirculation cells which were insufficiently robust to survive our stringent quality control and averaging procedures.
5. In agreement with inferences from hydrographic observations and numerical models the inflow to the eastern
Caribbean Sea in the surface layer was found to be dominated by flow through the Grenada, St. Vincent, and St. Lucia Passages. We estimate the mean transport of the Caribbean Current at 66øW to be approximately 9 +/- 4 Sv for depths above 100 m.
6. It was hypothesized that subtropical gyre potential energy variations associated with the NAO should express themselves as observable changes in upper ocean kinetic energy in the form of enhancement of the mean circulation and/or
increase in the amplitude of eddy variability during the 1990s relative to the 1970s. Using the present drifter compilation and a previous climatology assembled by Richardson [1983], we found a 25% increase in EKE near the Gulf Stream extension and a
slight (1 ø) northward shift in the meridional position of the Gulf Stream jet near 55øW. However, the magnitude of the inferred interdecadal differences are insufficient to substantiate a change in regional circulation strength or character from the late 1970s to the 1990s. As the number of drifter observations in the Atlantic
continues to grow, we believe it will become increasingly possible and useful to supplement descriptions of oceanic and atmospheric variability with direct measurements of near-surface kinetic energy inferred from drifters.
Acknowledgments. We thank the many principal investigators responsible for procurement and deployment of the drifters discussed herein. Peter Niiler, in particular, is acknowledged for his efforts in promoting platform standardization and the expansion of global drifter observations. Acquisition and initial processing of the raw drifter data were performed at the Global Drifter Data Assembly Center at NOAA/AOML in Miami, Florida. We acknowledge the assistance of Mayra Pazos in extracting and transmitting the data. The blended TOPEX/ERS altimetry data used for comparison with the drifter climatology was provided by Nicolas Ducet of CLS Space Oceanography Division, France. Chris Wooding performed much of the programming required for the computations reported here. Phil Richardson, Jerome Cuny, and an anonymous reviewer provided constructive comments that improved the quality and readability of the manuscript. Initial motivation for the interdecadal comparisons resulted from discussions with Saskia Esselborn, Bob Cheney, and Ruth Curry. This work was supported by the National Science Foundation through grant OCE-9729765 and by subcontract 40-AA-NE- 005335 from the National Oceanic and Atmospheric Administration. This is contribution 10479 from the Woods Hole
Oceanographic Institution.
References
Briigge, B., Near surface mean circulation and kinetic energy in the central North Atlantic from drifter data, J. Geophys. Res., 100, 20,543-20,554, 1995.
Chapman, D.C., and R.C. BeardsIcy, On the origin of shelf water in the Middle Atlantic Bight, J. Phys. Oceanogr., 19, 384- 391, 1989.
Cuny, J., P.B. Rhines, P.P. Niiler, and S. Bacon, Labrador Sea boundary currents and the fate of Irminger Sea water, J. Phys. Oceanogr., in press, 2001.
Curry, R.G., HydroBase: A database of hydrographic stations and tools for climatologic analysis, Woods Hole Oceanogr. Inst. Tech. Rep. 96-01, 50 pp., Woods Hole Oceanogr. Inst., Woods Hole, Mass., 1996.
Curry, R.G., and M.S. McCartney, Ocean gyre circulation

22,092 FRATANTONI: NORTH ATLANTIC StIRFACE CIRCULATION IN THE 1990'S
changes associated with the North Atlantic Oscillation, d. Phys. Oceanogr., in press, 2001.
Ducet, N., P.-Y. Le Traon, and G. Reverdin, How accurately can we map the mesoscale ocean surface variability from the combination of T/P and ERS-1/2 altimetric data?, Int. WOCE Newsl., 37, 40-43, 1999.
Fofonoff, N.P., Spectral characteristics of internal waves in the ocean, Deep Sea Res., 16, suppl., 59-71, 1969.
Fratantoni, D.M., and P.L. Richardson, SOFAR float observations of an intermediate-depth eastern boundary current and mesoscale variability in the eastern tropical Atlantic Ocean, d. Phys. Oceanogr., 29, 1265-1278, 1999.
Fratantoni, D.M., W.E. Johns, and T.L. Townsend, Rings of the North Brazil Current: Their structure and behavior inferred
from observations and a numerical simulation, d. Geophys. Res., 100, 10,633-10,654, 1995.
Fratantoni, D.M., P.L. Richardson, W.E. Johns, C.I. Fleurant, R.H. Smith, S. Garzoli, W.D. Wilson, and G.J. Goni, The North Brazil Current Rings Experiment (abstract), Eos Trans. AGU, 80(17), Spring Meet. Suppl., S 179, 1999.
Fratantoni, D.M., W.E. Johns, T.L. Townsend, and H.E. Hurlburt, Low-latitude circulation and mass transport pathways in a model of the tropical Atlantic Ocean, d. Phys. Oceanogr., 8, 1944-1966, 2000.
Freeland, H.F., P.B. Rhines, and H.T. Rossby, Statistical observations of the trajectories of neutrally-buoyant floats in the North Atlantic, d. Mar. Res., 33, 383-404, 1975.
Glickson, D.A., D.M. Fratantoni. C.M. Wooding, and P.L. Richardson, North Brazil Current Rings Experiment: Surface drifter data report, November 1998-2000, Woods Hole Oceanog., Inst. Tech. Rep., WHOI-00-10, 129 pp.
Gordon, A.L., Circulation of the Caribbean Sea, d. Geophys. Res., 72, 6207-6223, 1967.
Hansen, D.V., and A. Herman, Temporal sampling requirements for surface drifter buoys in the tropical Pacific, d. Atmos. Oceanic Technol., 6, 599-607, 1989.
Hansen, D.V., and P.-M. Poulain, Quality control and interpolations of WOCE/TOGA drifter data, d. Atmos. Oceanic Technol., 13, 900-909, 1996.
Hernfindez-Guerra, A., and T.M. Joyce, Water masses and circulation in the surface layers of the Caribbean at 66øW, Geophys. Res. Lett., 27, 3497-3500, 2000.
Hogg, N.G., On the transport of the Gulf Stream between Cape Hatteras and the Grand Banks, Deep Sea Res., 39(7/8), 1231-1246, 1992.
Hurrell, J.W., Decadal trends in the North Atlantic Oscillation: Regional temperatures and precipitation, Science, 269, 676- 679, 1995.
Iselin, C.O., A study of the circulation of the western North .Atlantic, Pap. Phys. Oceanogr. Meteorol., 4, 1-101, 1936.
Johns, W.E., T.N. Lee, F.A. Schott, R.J. Zantopp, and R.H. Evans, The North Brazil Current retroflection: Seasonal structure and eddy variability, d. Geophys. Res., 95, 22,103- 22,120, 1990.
Johns, W.E., T.L. Townsend, D.M. Fratantoni, and W.D. Wilson, On the Atlantic inflow to the Caribbean Sea, Deep Sea Res., in press, 2001.
Joyce, T.M., J.R. Luyten, A. Kubryakov, F.B. Bahr, and J.S. Pallant, Meso- to large-scale structure of subducting water in the subtropical gyre of the eastern North Atlantic Ocean, d. Phys. Oceanogr., 28, 40-61, 1998.
Kearns, E.J., and H.T. Rossby, Historical position of the North Atlantic Current, d. Geophys. Res., 103, 15,509-15,524, 1998.
Krauss, W., The North Atlantic Current, d. Geophys. Res., 91, 5061-5074, 1986.
Lavender, K.L., R.E. Davis, and W.B. Owens, Mid-depth
recirculation observed in the interior Labrador and Irminger Seas by direct velocity measurements, Nature, 407, 66-69, 2000.
Lazier, J.R.N., Observations in the northwest corner of the North Atlantic Current, d. Phys. Oceanogr., 24, 1449-1463, 1994.
Lee, T., and P. Cornilion, Propagation and growth of Gulf Stream meanders between 75øW and 45øW, d. Phys. Oceanogr., 26, 225-241, 1996.
Lilly, J.M., Coherent eddies in the Labrador Sea observed from a mooring, d. Phys. Oceanogr., in press. 2001.
Lilly. J.M., et al., The structure and variability of the Labrador Sea eddy field, 1994-1999, I, The mooring perspective, d. Phys. Oceanogr., in press. 2001.
Luyten, J.R., J. Pedlosky, and H. Stommel, The ventilated thermocline, d. Phys. Oceanogr., 13(2), 292-309, 1983.
Martins, C.S., and A. Fiuza, The surface circulation on the eastern North Atlantic from drifters and altimetry, d. Geophys. Res., in press, 2001.
Mayer, D.A., and R.H. Weisberg, A description of the COADS surface meteorological fields and the implied Sverdrup transports for the Atlantic Ocean from 30S to 60N, d. Phys. Oceanogr., 23, 2201-2221, 1993.
Molinari, R.L., M. Spillane, I. Brooks, D. Atwood, and C. Duckett, Surface currents in the Caribbean Sea as deduced from Lagrangian observations, d. Geophys. Res., 86, 6537- 6542, 1981.
Murphy, S.J., H.E. Hurlburt, and J.J. O'Brien, The connectivity of eddy variability in the Caribbean Sea, the Gulf of Mexico, and the Atlantic Ocean, d. Geophys. Res., 104, 1431-1453, 1999.
Niiler, P.P., A.S. Sybrandy, K. Bi, P.M. Poulain, and D. Bitterman, Measuretnents of the water-following capability of holey-sock and TRISTAR drifters, Deep Sea Res., Part I, 42, 1951-1964, 1995.
Poulain, P.-M., A. Warn-Varnas, and P.P. Niiler, Near-surface circulation of the Nordic Seas as measured by Lagrangian drifters, d. Geophys. Res., 101, 18,237-18,258, 1996.
Prater, M.D., Eddies in the Labrador Sea as observed by profiling RAFOS floats and remote sensing, d. Phys. Oceanogr., in press, 2001.
Richardson, P.L., Gulf Stream System: The average temperature field at a depth of 450 m, paper presented at International Council for the Exploration of the Sea, Hydrography Committee, C.'31, 1980.
Richardson, P.L., Eddy kinetic energy in the North Atlantic from surface drifters, d. Geophys. Res., 88, 4355-4367, 1983.
Richardson, P.L., Drifting buoy trajectories in the Atlantic North Equatorial Countercurrent during 1983, Geophys. Res. Lett., 11,745-748, 1984.
Richardson, P.L., and G. Reverdin, Seasonal cycle of velocity in the Atlantic North Equatorial Countercurrent as measured by surface drifters, current meters, and ship drifts, d. Geophys. Res., 92, 3691-3708, 1987.
Richardson, P.L., G.E. Hufford, R. Limeburner, and W.S. Brown, North Brazil Current retroflection eddies, d. Geophys. Res., 99, 5081-5093, 1994.
Rudnick, D.L., and J.R. Luyten, Intensive surveys of the Azores Front 1: Tracers and dynamics, d. Geophys. Res., 101, 923- 939, 1996.
Schmitz, W.J., Jr., On the interbasin-scale thermohaline circulation, Rev. Geophys., 33, 151-173, 1995.
Schmitz, W.J., Jr., and M.S. McCartney, On the North Atlantic circulation, Rev. Geophys., 31, 29-49, 1993.
Schmitz, W.J., Jr., and P.L. Richardson, On the sources of the Florida Current, Deep Sea Res., 38, S389-S409, 1991.
Sybrandy, A.L., and P.P. Niiler, WOCE/TOGA Lagrangian

FRATANTONI: NORTH ATLANTIC SURFACE CIRCULATION IN THE 1990'S 22,093
drifter construction manual, SIO Ref 91/6, WOCE Rep. 63, 58 pp., Scripps Inst. of Oceanogr., La Jolla, Calif., 1991.
Taylor, A.H., and J.A. Stephens, The North Atlantic Oscillation and the latitude of the Gulf Stream, Tellus, 50A, 134-142, 1998.
Van Meurs, P., and P.P. Niiler, Temporal variability of the large scale geostrophic surface velocity in the northeast Pacific, d. Phys. Oceanogr., 27, 2288-2297, 1997.
Weisberg, R.H., and T.J. Weingartner, Instability waves in the equatorial Atlantic Ocean, J. Phys. Oceanogr., 18, 1641- 1657, 1988.
Worthington, L.V., On the North Atlantic circulation, in The Johns Hopkins Oceanographic Studies, vol. 6, 110 pp., Johns Hopkins Univ. Press, Baltimore, MD, 1976.
Wiist, G., Stratification and Circulation in the Antillean- Caribbean Basins. Part 1, Spreading and Mixing of the Water Types With an Oceanographic Atlas, 201 pp., Columbia Univ. Press, New York, 1964.
Zhou, M., J.D. Paduan, and P.P. Niiler, Surface currents in the Canary Basin from drifter observations, d. Geophys. Res., 105, 21893-21911, 2000.
D. M. Fratantoni, Department of Physical Oceanography, Woods Hole Oceanographic Institution, MS #21, Woods Hole, MA 02543-1050 USA. (dfi'atantoni(•;whoi.edu)
(Received November 21, 2000; revised June 20, 2001; accepted June 26, 2001.)