Embed Size (px)
Citation preview
NORTH AMERICA’S
AIRPORTLEADERS
2019MAKE SMARTER MOVES
Published June 2019
2
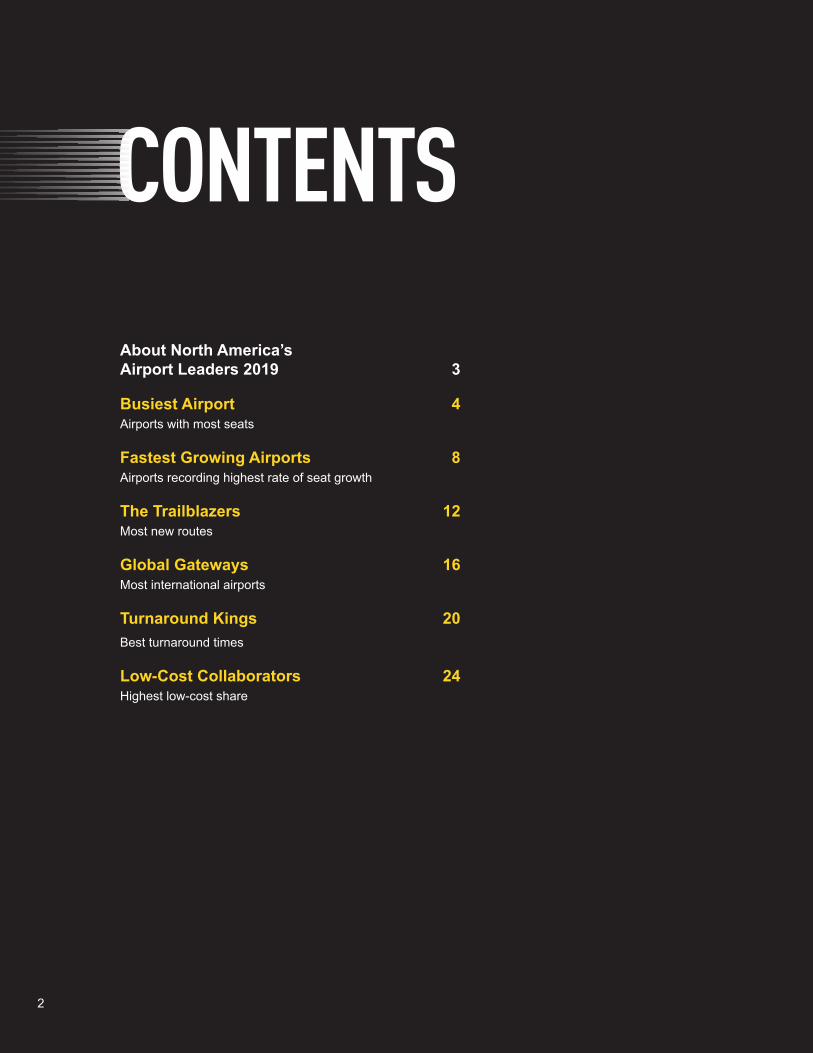
About North America’s Airport Leaders 2019 3
Busiest Airport 4Airports with most seats
Fastest Growing Airports 8Airports recording highest rate of seat growth
The Trailblazers 12Most new routes
Global Gateways 16Most international airports
Turnaround Kings 20Best turnaround times
Low-Cost Collaborators 24Highest low-cost share
CONTENTS
3
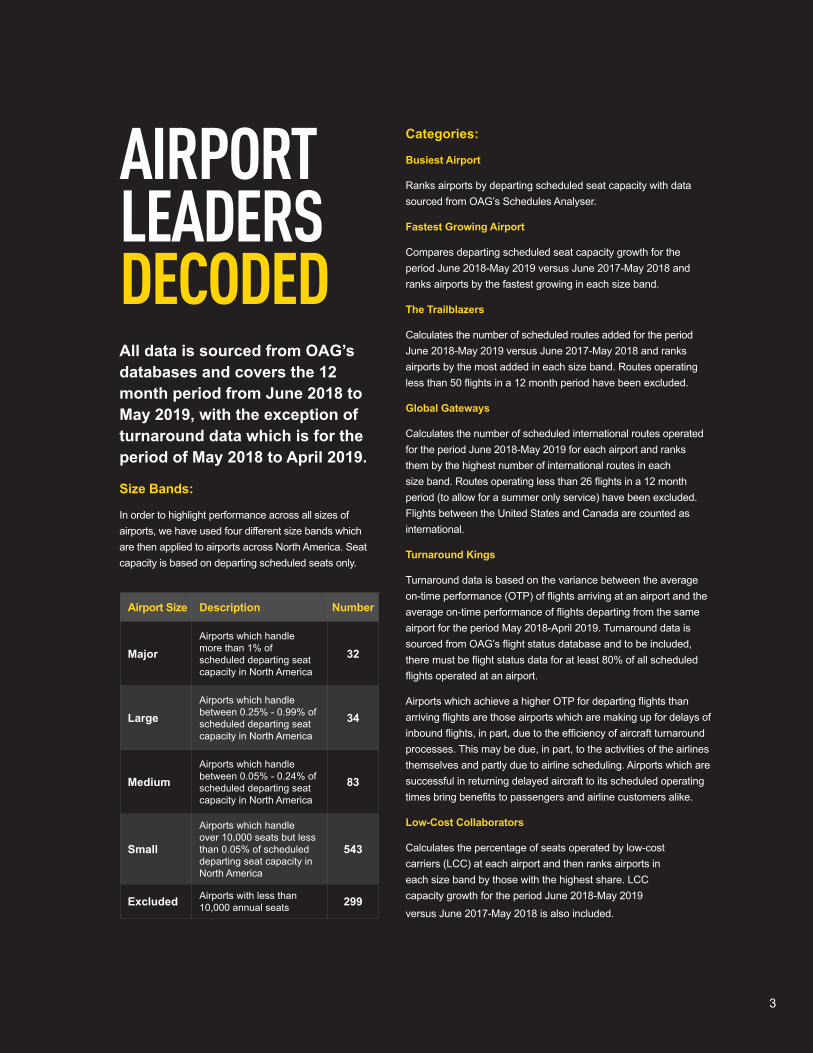
All data is sourced from OAG’s databases and covers the 12 month period from June 2018 to May 2019, with the exception of turnaround data which is for the period of May 2018 to April 2019.
Size Bands:
In order to highlight performance across all sizes of airports, we have used four different size bands which are then applied to airports across North America. Seat capacity is based on departing scheduled seats only.
Categories:
Busiest Airport
Ranks airports by departing scheduled seat capacity with data sourced from OAG’s Schedules Analyser.
Fastest Growing Airport
Compares departing scheduled seat capacity growth for the period June 2018-May 2019 versus June 2017-May 2018 and ranks airports by the fastest growing in each size band.
The Trailblazers
Calculates the number of scheduled routes added for the period June 2018-May 2019 versus June 2017-May 2018 and ranks airports by the most added in each size band. Routes operating less than 50 flights in a 12 month period have been excluded.
Global Gateways
Calculates the number of scheduled international routes operated for the period June 2018-May 2019 for each airport and ranks them by the highest number of international routes in each size band. Routes operating less than 26 flights in a 12 month period (to allow for a summer only service) have been excluded. Flights between the United States and Canada are counted as international.
Turnaround Kings
Turnaround data is based on the variance between the average on-time performance (OTP) of flights arriving at an airport and the average on-time performance of flights departing from the same airport for the period May 2018-April 2019. Turnaround data is sourced from OAG’s flight status database and to be included, there must be flight status data for at least 80% of all scheduled flights operated at an airport.
Airports which achieve a higher OTP for departing flights than arriving flights are those airports which are making up for delays of inbound flights, in part, due to the efficiency of aircraft turnaround processes. This may be due, in part, to the activities of the airlines themselves and partly due to airline scheduling. Airports which are successful in returning delayed aircraft to its scheduled operating times bring benefits to passengers and airline customers alike.
Low-Cost Collaborators
Calculates the percentage of seats operated by low-cost carriers (LCC) at each airport and then ranks airports in each size band by those with the highest share. LCC capacity growth for the period June 2018-May 2019
versus June 2017-May 2018 is also included.
AIRPORT LEADERS DECODED
Airport Size Description Number
MajorAirports which handle more than 1% of scheduled departing seat capacity in North America
32
LargeAirports which handle between 0.25% - 0.99% of scheduled departing seat capacity in North America
34
Medium Airports which handle between 0.05% - 0.24% of scheduled departing seat capacity in North America
83
Small
Airports which handle over 10,000 seats but less than 0.05% of scheduled departing seat capacity in North America
543
Excluded Airports with less than 10,000 annual seats 299
4
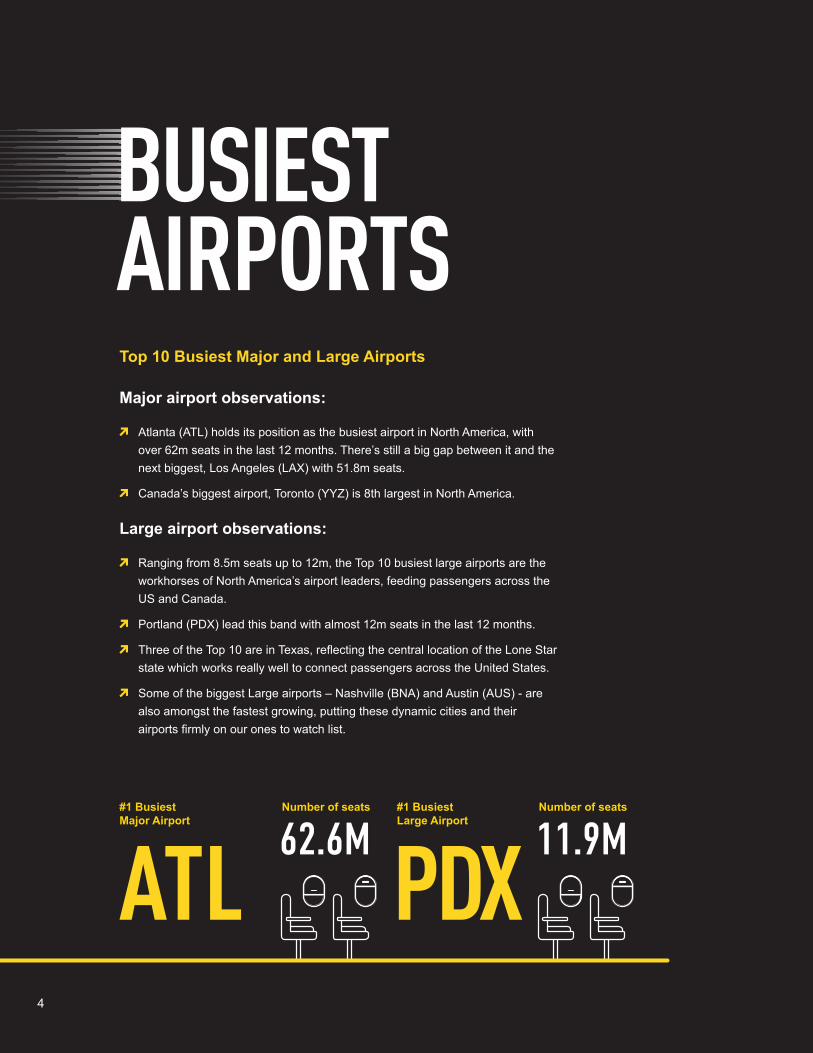
AIRPORTSTop 10 Busiest Major and Large Airports
Major airport observations:
Atlanta (ATL) holds its position as the busiest airport in North America, with over 62m seats in the last 12 months. There’s still a big gap between it and the next biggest, Los Angeles (LAX) with 51.8m seats.
Canada’s biggest airport, Toronto (YYZ) is 8th largest in North America.
Large airport observations:
Ranging from 8.5m seats up to 12m, the Top 10 busiest large airports are the workhorses of North America’s airport leaders, feeding passengers across the US and Canada.
Portland (PDX) lead this band with almost 12m seats in the last 12 months.
Three of the Top 10 are in Texas, reflecting the central location of the Lone Star state which works really well to connect passengers across the United States.
Some of the biggest Large airports – Nashville (BNA) and Austin (AUS) - are also amongst the fastest growing, putting these dynamic cities and their airports firmly on our ones to watch list.
ATL#1 Busiest Major Airport
62.6MNumber of seats
PDX#1 Busiest Large Airport
11.9MNumber of seats
BUSIEST

5
Rank Airport Airport Name Seats
1 ATL Atlanta Hartsfield - Jackson 62,644,729
2 LAX Los Angeles 51,818,960
3 ORD Chicago O'Hare 50,113,124
4 DFW Dallas Dallas / Fort Worth 41,402,481
5 JFK New York John F. Kennedy 38,175,455
6 DEN Denver 37,775,601
7 SFO San Francisco 34,309,877
8 YYZ Toronto Lester B. Pearson 29,983,962
9 SEA Seattle-Tacoma 29,388,709
10 LAS Las Vegas McCarran 29,177,528
Rank Airport Airport Name Seats
1 PDX Portland 11,962,913
2 YYC Calgary 10,743,519
3 DAL Dallas Love Field 10,469,710
4 BNA Nashville 10,468,752
5 AUS Austin-Bergstrom 9,959,917
6 STL St Louis Lambert 9,899,014
7 SJC San Jose Norman Y. Mineta 9,619,415
8 HOU Houston William P. Hobby 9,332,091
9 OAK Oakland International 8,777,234
10 MSY New Orleans Louis Armstrong 8,447,915
MAJOR AIRPORTS
LARGE AIRPORTS
Source:
Source:
6
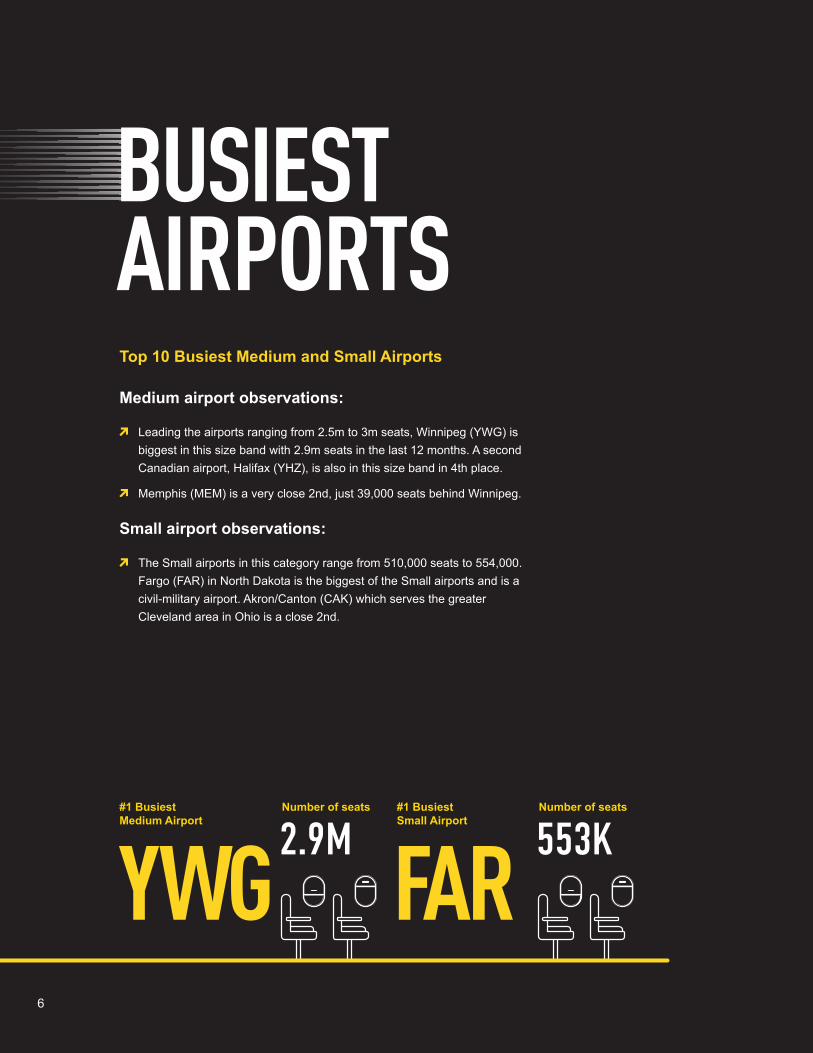
AIRPORTSTop 10 Busiest Medium and Small Airports
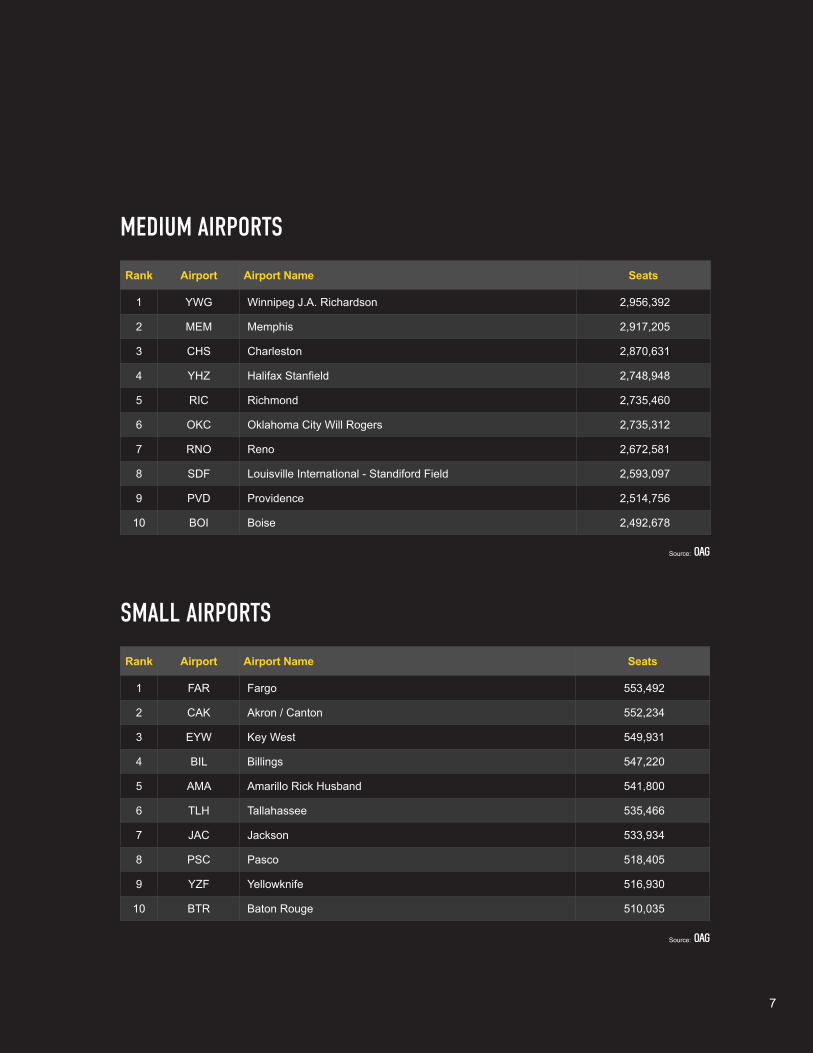
Medium airport observations:
Leading the airports ranging from 2.5m to 3m seats, Winnipeg (YWG) is biggest in this size band with 2.9m seats in the last 12 months. A second Canadian airport, Halifax (YHZ), is also in this size band in 4th place.
Memphis (MEM) is a very close 2nd, just 39,000 seats behind Winnipeg.
Small airport observations:
The Small airports in this category range from 510,000 seats to 554,000. Fargo (FAR) in North Dakota is the biggest of the Small airports and is a civil-military airport. Akron/Canton (CAK) which serves the greater Cleveland area in Ohio is a close 2nd.
YWG#1 Busiest Medium Airport
FAR#1 Busiest Small Airport
2.9MNumber of seats
553KNumber of seats
BUSIEST
7
Rank Airport Airport Name Seats
1 YWG Winnipeg J.A. Richardson 2,956,392
2 MEM Memphis 2,917,205
3 CHS Charleston 2,870,631
4 YHZ Halifax Stanfield 2,748,948
5 RIC Richmond 2,735,460
6 OKC Oklahoma City Will Rogers 2,735,312
7 RNO Reno 2,672,581
8 SDF Louisville International - Standiford Field 2,593,097
9 PVD Providence 2,514,756
10 BOI Boise 2,492,678
Rank Airport Airport Name Seats
1 FAR Fargo 553,492
2 CAK Akron / Canton 552,234
3 EYW Key West 549,931
4 BIL Billings 547,220
5 AMA Amarillo Rick Husband 541,800
6 TLH Tallahassee 535,466
7 JAC Jackson 533,934
8 PSC Pasco 518,405
9 YZF Yellowknife 516,930
10 BTR Baton Rouge 510,035
MEDIUM AIRPORTS
SMALL AIRPORTS
Source:
Source:
8
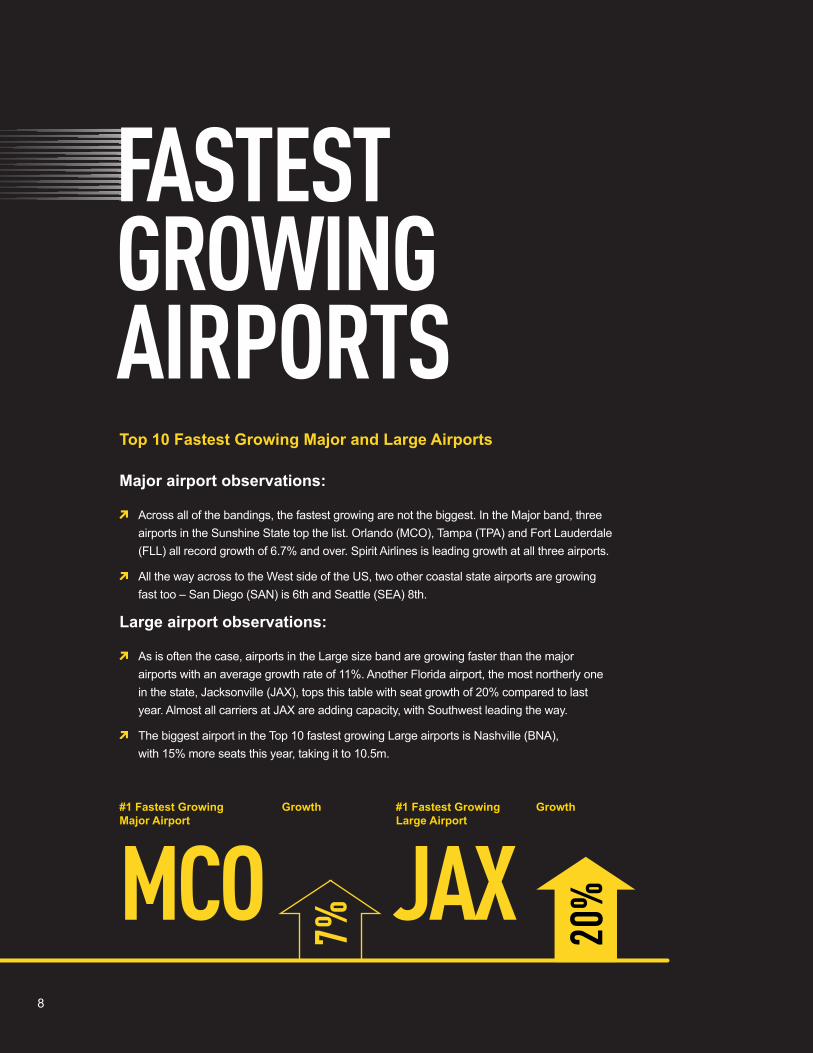
Top 10 Fastest Growing Major and Large Airports
Major airport observations:
Across all of the bandings, the fastest growing are not the biggest. In the Major band, three airports in the Sunshine State top the list. Orlando (MCO), Tampa (TPA) and Fort Lauderdale (FLL) all record growth of 6.7% and over. Spirit Airlines is leading growth at all three airports.
All the way across to the West side of the US, two other coastal state airports are growing fast too – San Diego (SAN) is 6th and Seattle (SEA) 8th.
Large airport observations:
As is often the case, airports in the Large size band are growing faster than the major airports with an average growth rate of 11%. Another Florida airport, the most northerly one in the state, Jacksonville (JAX), tops this table with seat growth of 20% compared to last year. Almost all carriers at JAX are adding capacity, with Southwest leading the way.
The biggest airport in the Top 10 fastest growing Large airports is Nashville (BNA), with 15% more seats this year, taking it to 10.5m.
GROWINGAIRPORTS
MCO#1 Fastest Growing Major Airport
#1 Fastest Growing Large Airport
JAXGrowth Growth
20%
7%
FASTEST
9
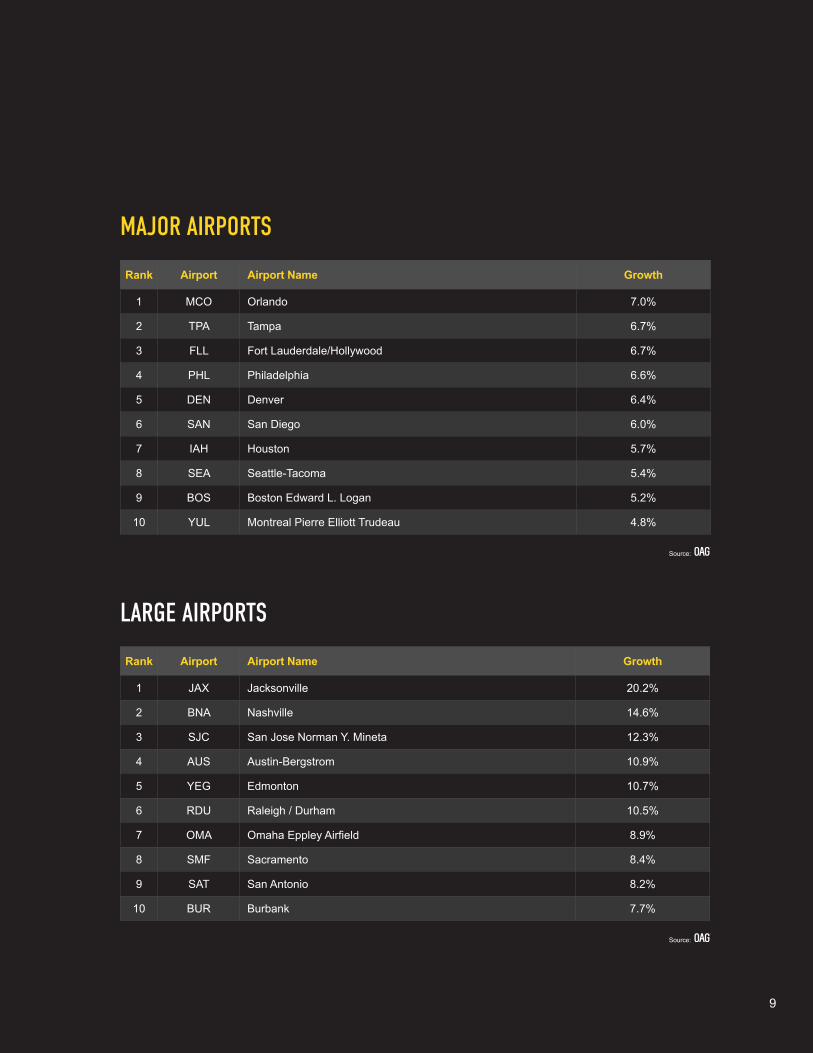
Rank Airport Airport Name Growth
1 MCO Orlando 7.0%
2 TPA Tampa 6.7%
3 FLL Fort Lauderdale/Hollywood 6.7%
4 PHL Philadelphia 6.6%
5 DEN Denver 6.4%
6 SAN San Diego 6.0%
7 IAH Houston 5.7%
8 SEA Seattle-Tacoma 5.4%
9 BOS Boston Edward L. Logan 5.2%
10 YUL Montreal Pierre Elliott Trudeau 4.8%
Rank Airport Airport Name Growth
1 JAX Jacksonville 20.2%
2 BNA Nashville 14.6%
3 SJC San Jose Norman Y. Mineta 12.3%
4 AUS Austin-Bergstrom 10.9%
5 YEG Edmonton 10.7%
6 RDU Raleigh / Durham 10.5%
7 OMA Omaha Eppley Airfield 8.9%
8 SMF Sacramento 8.4%
9 SAT San Antonio 8.2%
10 BUR Burbank 7.7%
MAJOR AIRPORTS
LARGE AIRPORTS
Source:
Source:
10
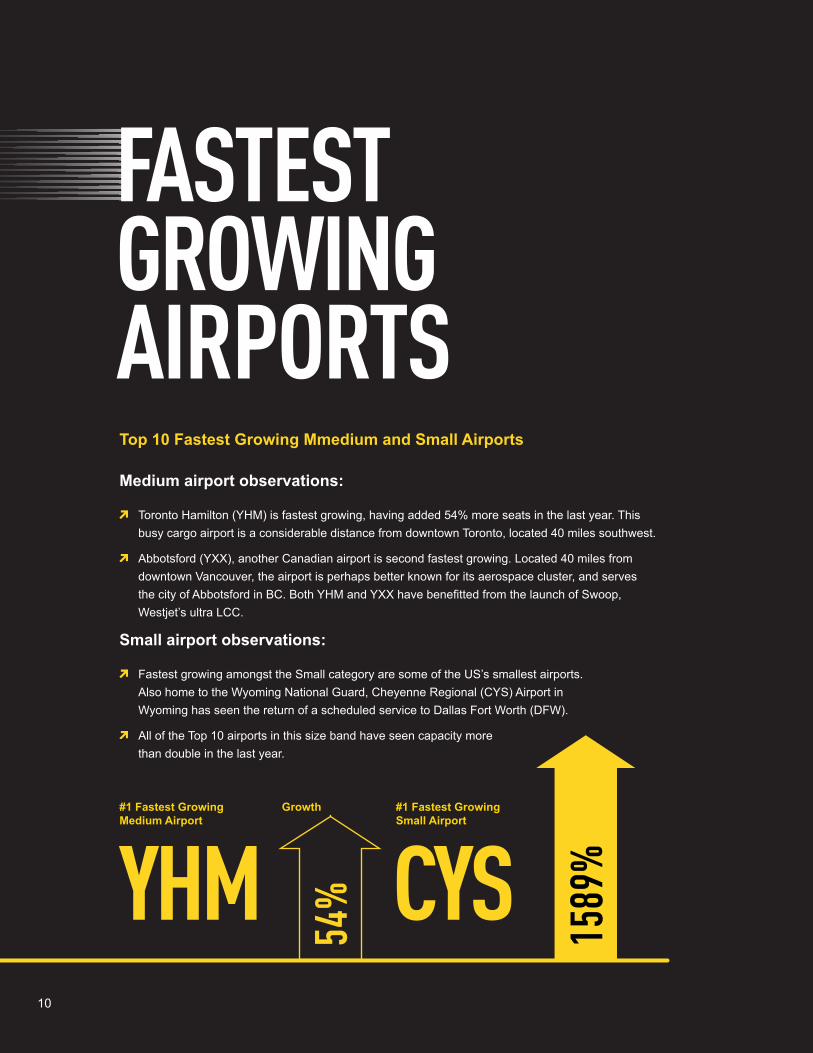
Top 10 Fastest Growing Mmedium and Small Airports
Medium airport observations:
Toronto Hamilton (YHM) is fastest growing, having added 54% more seats in the last year. This busy cargo airport is a considerable distance from downtown Toronto, located 40 miles southwest.
Abbotsford (YXX), another Canadian airport is second fastest growing. Located 40 miles from downtown Vancouver, the airport is perhaps better known for its aerospace cluster, and serves the city of Abbotsford in BC. Both YHM and YXX have benefitted from the launch of Swoop, Westjet’s ultra LCC.
Small airport observations:
Fastest growing amongst the Small category are some of the US’s smallest airports. Also home to the Wyoming National Guard, Cheyenne Regional (CYS) Airport in Wyoming has seen the return of a scheduled service to Dallas Fort Worth (DFW).
All of the Top 10 airports in this size band have seen capacity more than double in the last year.
GROWINGAIRPORTS
YHM#1 Fastest Growing Medium Airport
#1 Fastest Growing Small Airport
CYSGrowth
1589
%
54%
FASTEST
11
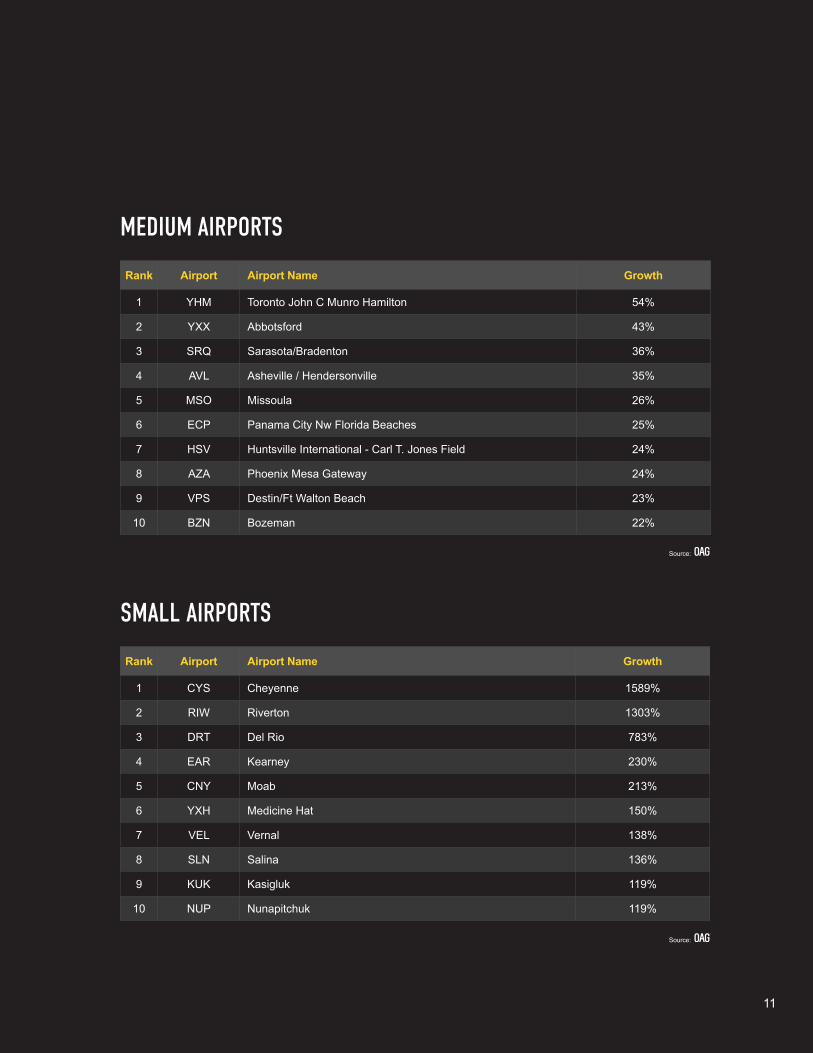
Rank Airport Airport Name Growth
1 YHM Toronto John C Munro Hamilton 54%
2 YXX Abbotsford 43%
3 SRQ Sarasota/Bradenton 36%
4 AVL Asheville / Hendersonville 35%
5 MSO Missoula 26%
6 ECP Panama City Nw Florida Beaches 25%
7 HSV Huntsville International - Carl T. Jones Field 24%
8 AZA Phoenix Mesa Gateway 24%
9 VPS Destin/Ft Walton Beach 23%
10 BZN Bozeman 22%
Rank Airport Airport Name Growth
1 CYS Cheyenne 1589%
2 RIW Riverton 1303%
3 DRT Del Rio 783%
4 EAR Kearney 230%
5 CNY Moab 213%
6 YXH Medicine Hat 150%
7 VEL Vernal 138%
8 SLN Salina 136%
9 KUK Kasigluk 119%
10 NUP Nunapitchuk 119%
MEDIUM AIRPORTS
SMALL AIRPORTS
Source:
Source:

TRAILBLAZERSTop 10 Major and Large Airports with Most New Routes Added
Major airport observations:
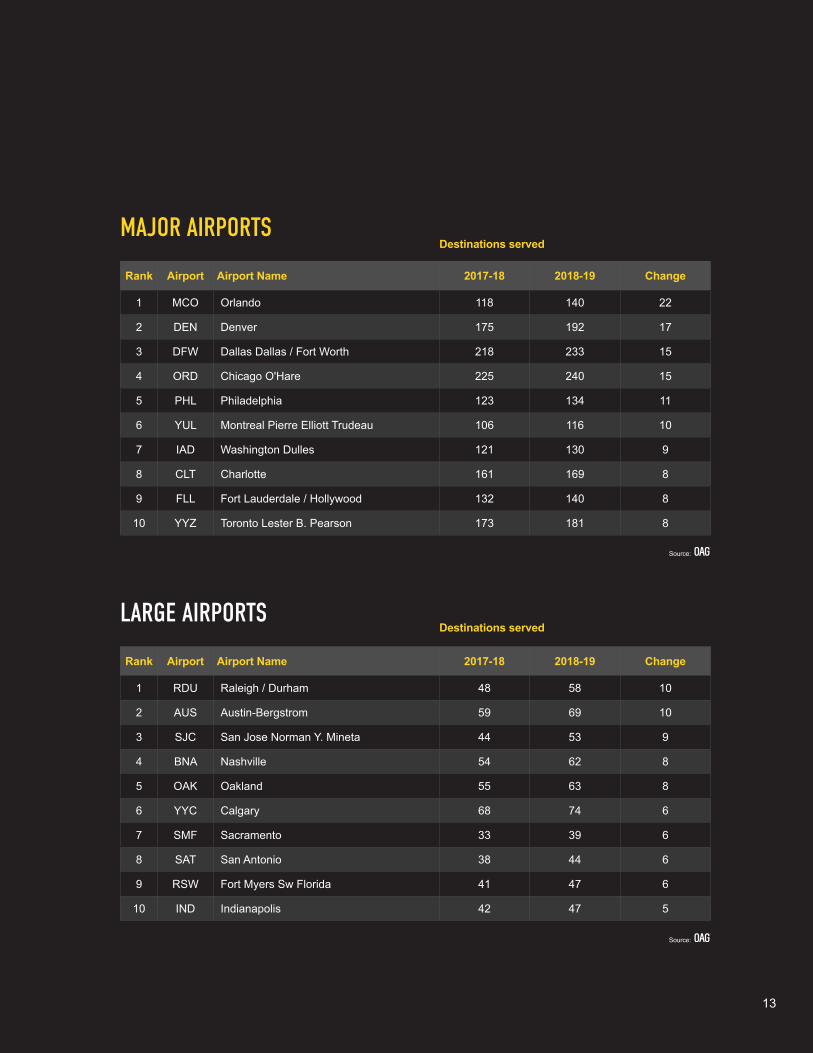
With 22 new routes added in the last 12 months, Orlando (MCO) is the airport with the newest destinations in North America.
Denver (DEN) is not far behind with 17 more destinations than last year.
Chicago (ORD) serves most destinations of the Top 10, with 240. 15 of these have been added in the last 12 months.
Large airport observations:
Of the Large airports, Raleigh/Durham (RDU) and Austin (AUS) have seen the most route growth with both airports adding 10 new destinations in the last 12 months.
Six of the airports with the most newest destinations are also in the Top 10 fastest growing airports.
MCO#1 Most new routes Major Airport
RDU#1 Most new routes Large Airport
+22 +10
New routes New routes
THE
12
MAJOR AIRPORTS
Rank Airport Airport Name 2017-18 2018-19 Change
1 MCO Orlando 118 140 22
2 DEN Denver 175 192 17
3 DFW Dallas Dallas / Fort Worth 218 233 15
4 ORD Chicago O'Hare 225 240 15
5 PHL Philadelphia 123 134 11
6 YUL Montreal Pierre Elliott Trudeau 106 116 10
7 IAD Washington Dulles 121 130 9
8 CLT Charlotte 161 169 8
9 FLL Fort Lauderdale / Hollywood 132 140 8
10 YYZ Toronto Lester B. Pearson 173 181 8
Destinations served
LARGE AIRPORTS
Rank Airport Airport Name 2017-18 2018-19 Change
1 RDU Raleigh / Durham 48 58 10
2 AUS Austin-Bergstrom 59 69 10
3 SJC San Jose Norman Y. Mineta 44 53 9
4 BNA Nashville 54 62 8
5 OAK Oakland 55 63 8
6 YYC Calgary 68 74 6
7 SMF Sacramento 33 39 6
8 SAT San Antonio 38 44 6
9 RSW Fort Myers Sw Florida 41 47 6
10 IND Indianapolis 42 47 5
Destinations served
13
Source:
Source:
14
TRAILBLAZERSTop 10 Medium and Small Airports with Most New Routes Added
Medium airport observations:
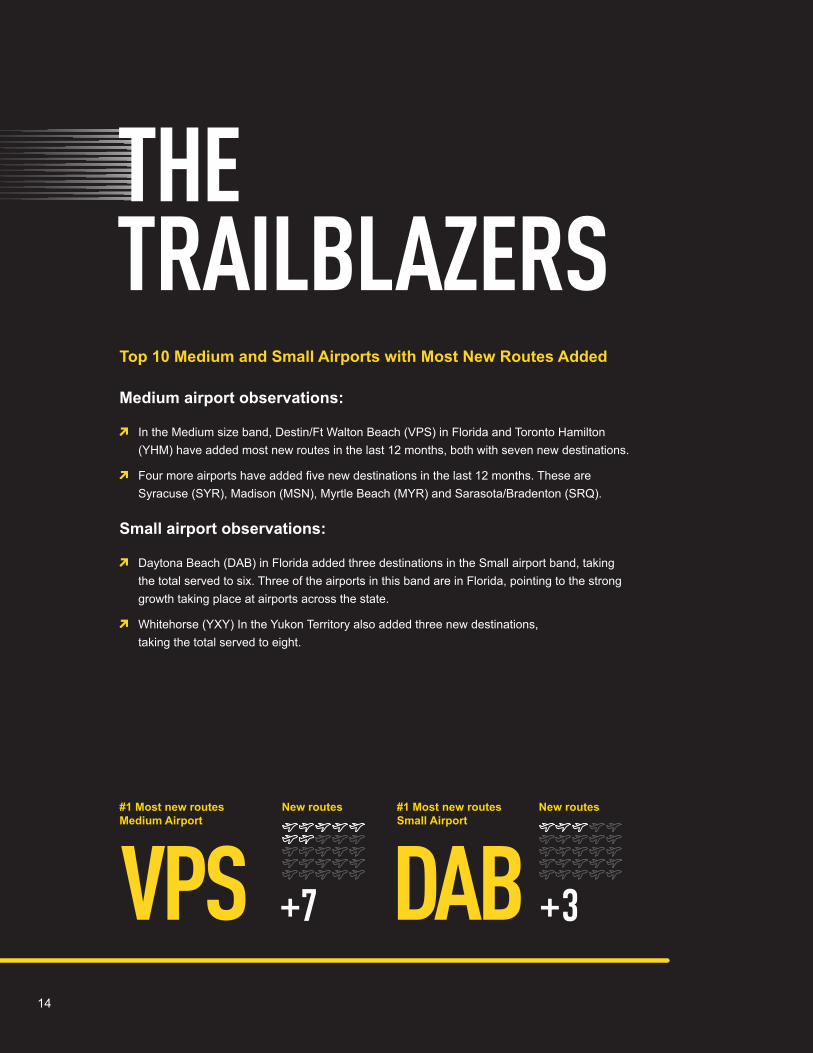
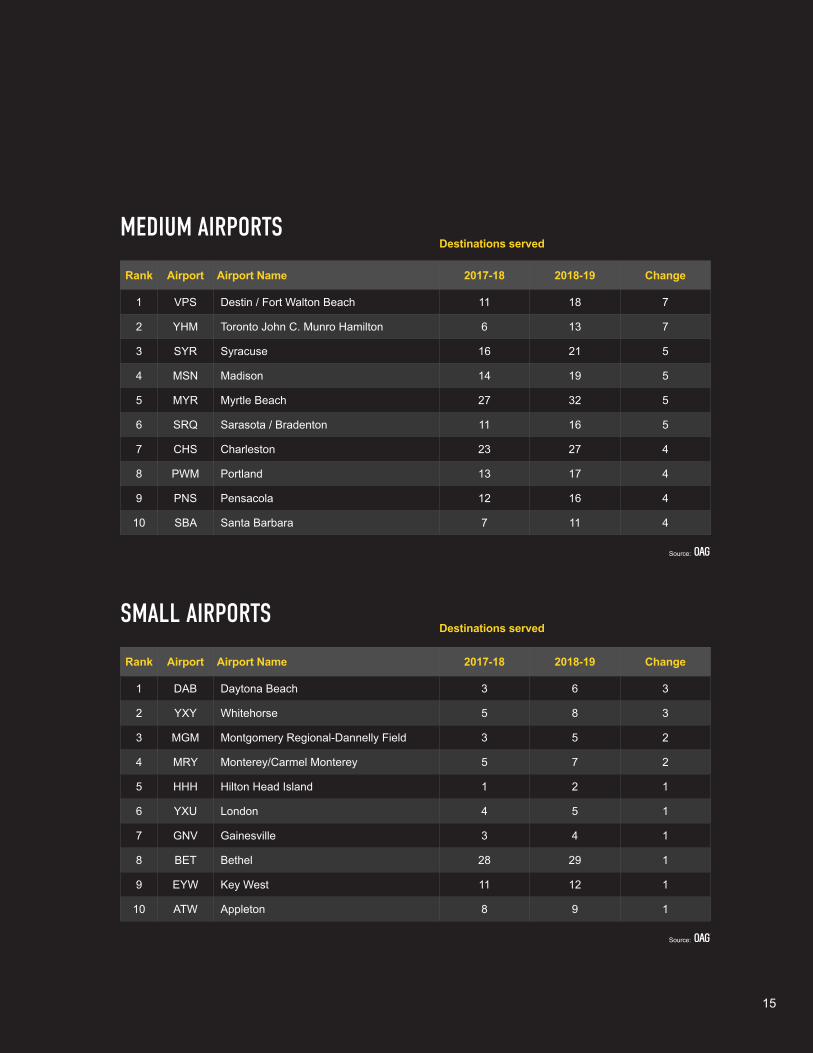
In the Medium size band, Destin/Ft Walton Beach (VPS) in Florida and Toronto Hamilton (YHM) have added most new routes in the last 12 months, both with seven new destinations.
Four more airports have added five new destinations in the last 12 months. These are Syracuse (SYR), Madison (MSN), Myrtle Beach (MYR) and Sarasota/Bradenton (SRQ).
Small airport observations:
Daytona Beach (DAB) in Florida added three destinations in the Small airport band, taking the total served to six. Three of the airports in this band are in Florida, pointing to the strong growth taking place at airports across the state.
Whitehorse (YXY) In the Yukon Territory also added three new destinations, taking the total served to eight.
VPS#1 Most new routes Medium Airport
DAB#1 Most new routes Small Airport
+7 +3
New routes New routes
14
THE
15
MEDIUM AIRPORTS
SMALL AIRPORTS
Rank Airport Airport Name 2017-18 2018-19 Change
1 VPS Destin / Fort Walton Beach 11 18 7
2 YHM Toronto John C. Munro Hamilton 6 13 7
3 SYR Syracuse 16 21 5
4 MSN Madison 14 19 5
5 MYR Myrtle Beach 27 32 5
6 SRQ Sarasota / Bradenton 11 16 5
7 CHS Charleston 23 27 4
8 PWM Portland 13 17 4
9 PNS Pensacola 12 16 4
10 SBA Santa Barbara 7 11 4
Rank Airport Airport Name 2017-18 2018-19 Change
1 DAB Daytona Beach 3 6 3
2 YXY Whitehorse 5 8 3
3 MGM Montgomery Regional-Dannelly Field 3 5 2
4 MRY Monterey/Carmel Monterey 5 7 2
5 HHH Hilton Head Island 1 2 1
6 YXU London 4 5 1
7 GNV Gainesville 3 4 1
8 BET Bethel 28 29 1
9 EYW Key West 11 12 1
10 ATW Appleton 8 9 1
Destinations served
Destinations served
15
Source:
Source:
16
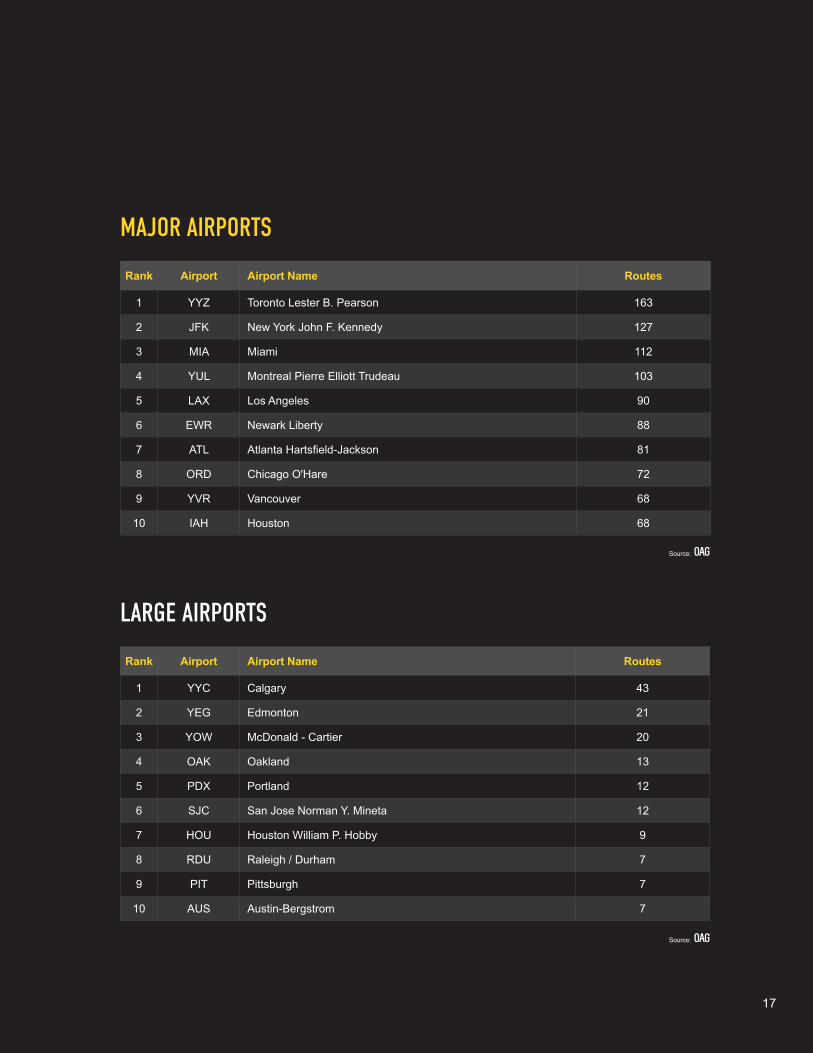
GATEWAYSTop 10 Most International Major and Large Airports
Major airport observations:
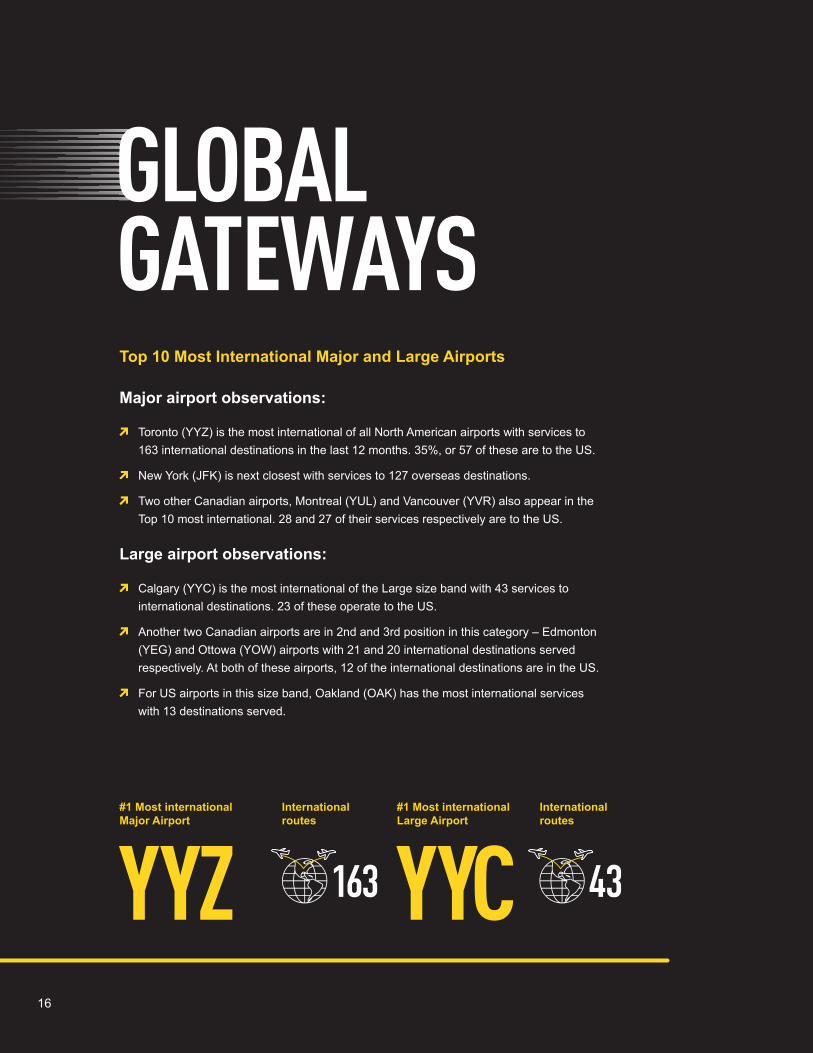
Toronto (YYZ) is the most international of all North American airports with services to 163 international destinations in the last 12 months. 35%, or 57 of these are to the US.
New York (JFK) is next closest with services to 127 overseas destinations.
Two other Canadian airports, Montreal (YUL) and Vancouver (YVR) also appear in the Top 10 most international. 28 and 27 of their services respectively are to the US.
Large airport observations:
Calgary (YYC) is the most international of the Large size band with 43 services to international destinations. 23 of these operate to the US.
Another two Canadian airports are in 2nd and 3rd position in this category – Edmonton (YEG) and Ottowa (YOW) airports with 21 and 20 international destinations served respectively. At both of these airports, 12 of the international destinations are in the US.
For US airports in this size band, Oakland (OAK) has the most international services with 13 destinations served.
YYZ#1 Most international Major Airport
YYC#1 Most international Large Airport
163 43
International routes
International routes
GLOBAL
17
Rank Airport Airport Name Routes
1 YYZ Toronto Lester B. Pearson 163
2 JFK New York John F. Kennedy 127
3 MIA Miami 112
4 YUL Montreal Pierre Elliott Trudeau 103
5 LAX Los Angeles 90
6 EWR Newark Liberty 88
7 ATL Atlanta Hartsfield-Jackson 81
8 ORD Chicago O'Hare 72
9 YVR Vancouver 68
10 IAH Houston 68
Rank Airport Airport Name Routes
1 YYC Calgary 43
2 YEG Edmonton 21
3 YOW McDonald - Cartier 20
4 OAK Oakland 13
5 PDX Portland 12
6 SJC San Jose Norman Y. Mineta 12
7 HOU Houston William P. Hobby 9
8 RDU Raleigh / Durham 7
9 PIT Pittsburgh 7
10 AUS Austin-Bergstrom 7
MAJOR AIRPORTS
LARGE AIRPORTS
Source:
Source:

18
Top 10 Most International Medium and Small Airports
Medium airport observations:
As the size bands decrease, so do the number of airports with international services. For Medium airports, the average international destinations served for the Top 10 is eight. Halifax (YHZ) is above average with services to 20 international destinations.
Seven airports in this band are in Canada.
Small airport observations:
New York Stewart (SWF) received a boost from the arrival of Norwegian who operated services to five European destinations. Some of these are stopping, and as of Summer 2019, there is just one international destination served, Dublin.
Four of the airports in this size band are in Greenland.
YHZ#1 Most international Medium Airport
SWF#1 Most international Small Airport
International routes
International routes
20 5
GLOBALGATEWAYS

19
Rank Airport Airport Name Routes
1 YHZ Halifax Stanfield 20
2 YQB Quebec 14
3 YWG Winnipeg J. A. Richardson 12
4 YHM Toronto John C. Munro Hamilton 9
5 SFB Orlando Sanford 7
6 PVD Providence 6
7 YTZ Bishop Billy City 5
8 PSP Palm Springs 5
9 YLW Kelowna 5
10 YXE Saskatoon 5
MEDIUM AIRPORTS
SMALL AIRPORTS
Rank Airport Airport Name Routes
1 SWF New York Stewart 5
2 FSP St Pierre 3
3 SFJ Kangerlussuaq 2
4 GOH Nuuk 2
5 MOB Mobile 2
6 UAK Narsarsuaq 2
7 MFE McAllen / Mission 1
8 CXH Vancouver Coal Harbour 1
9 KUS Kulusuk Island 1
10 YQG Windsor 1
Source:
Source:
20
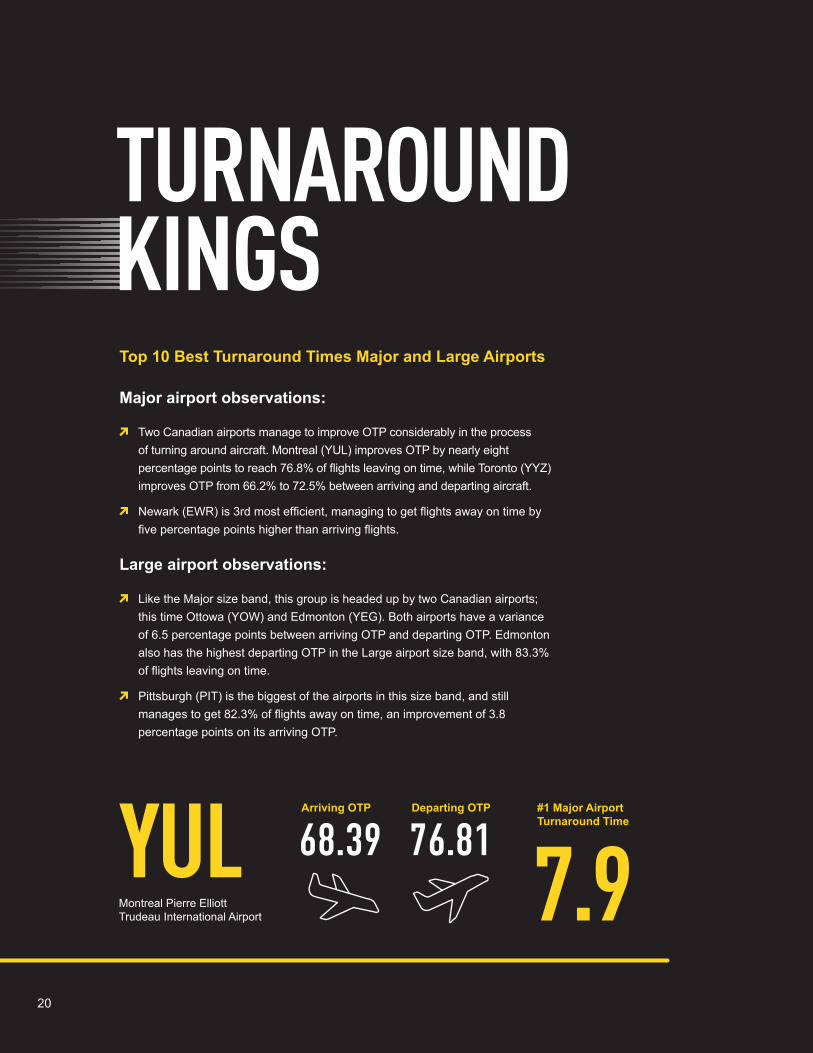
Top 10 Best Turnaround Times Major and Large Airports
Major airport observations:
Two Canadian airports manage to improve OTP considerably in the process of turning around aircraft. Montreal (YUL) improves OTP by nearly eight percentage points to reach 76.8% of flights leaving on time, while Toronto (YYZ) improves OTP from 66.2% to 72.5% between arriving and departing aircraft.
Newark (EWR) is 3rd most efficient, managing to get flights away on time by five percentage points higher than arriving flights.
Large airport observations:
Like the Major size band, this group is headed up by two Canadian airports; this time Ottowa (YOW) and Edmonton (YEG). Both airports have a variance of 6.5 percentage points between arriving OTP and departing OTP. Edmonton also has the highest departing OTP in the Large airport size band, with 83.3% of flights leaving on time.
Pittsburgh (PIT) is the biggest of the airports in this size band, and still manages to get 82.3% of flights away on time, an improvement of 3.8 percentage points on its arriving OTP.
TURNAROUND
YULMontreal Pierre Elliott Trudeau International Airport
68.39 76.81Arriving OTP Departing OTP
7.9#1 Major Airport Turnaround Time
KINGS

21
Rank Airport Airport Name Arriving OTP % Departing OTP % Variance %
1 YUL Montreal Pierre Elliott Trudeau 68.93 76.81 7.9
2 YYZ Toronto Lester B. Pearson 66.18 72.48 6.3
3 EWR Newark Liberty 67.04 72.35 5.3
4 YVR Vancouver 72.45 77.73 5.3
5 LGA New York LaGuardia 70.93 75.33 4.4
6 SFO San Francisco 71.92 76.31 4.4
7 SEA Seattle-Tacoma 77.18 81.27 4.1
8 IAD Washington Dulles 78.90 82.68 3.8
9 JFK New York John F. Kennedy 75.51 79.08 3.6
10 BOS Boston Edward L. Logan 72.70 76.26 3.6
MAJOR AIRPORTS
LARGE AIRPORTS
Rank Airport Airport Name Arriving OTP % Departing OTP % Variance %
1 YOW McDonald - Cartier 71.85 78.35 6.5
2 YEG Edmonton 76.87 83.34 6.5
3 ANC Anchorage Ted Stevens 77.56 83.03 5.5
4 BDL Hartford Bradley 77.28 82.10 4.8
5 SAT San Antonio 77.68 82.29 4.6
6 ONT Ontario 78.59 82.83 4.2
7 IND Indianapolis 77.61 81.68 4.1
8 OMA Omaha Eppley Airfield 78.53 82.52 4.0
9 BUF Buffalo 76.27 80.21 3.9
10 PIT Pittsburgh 78.48 82.33 3.8
Source:
Source:

22
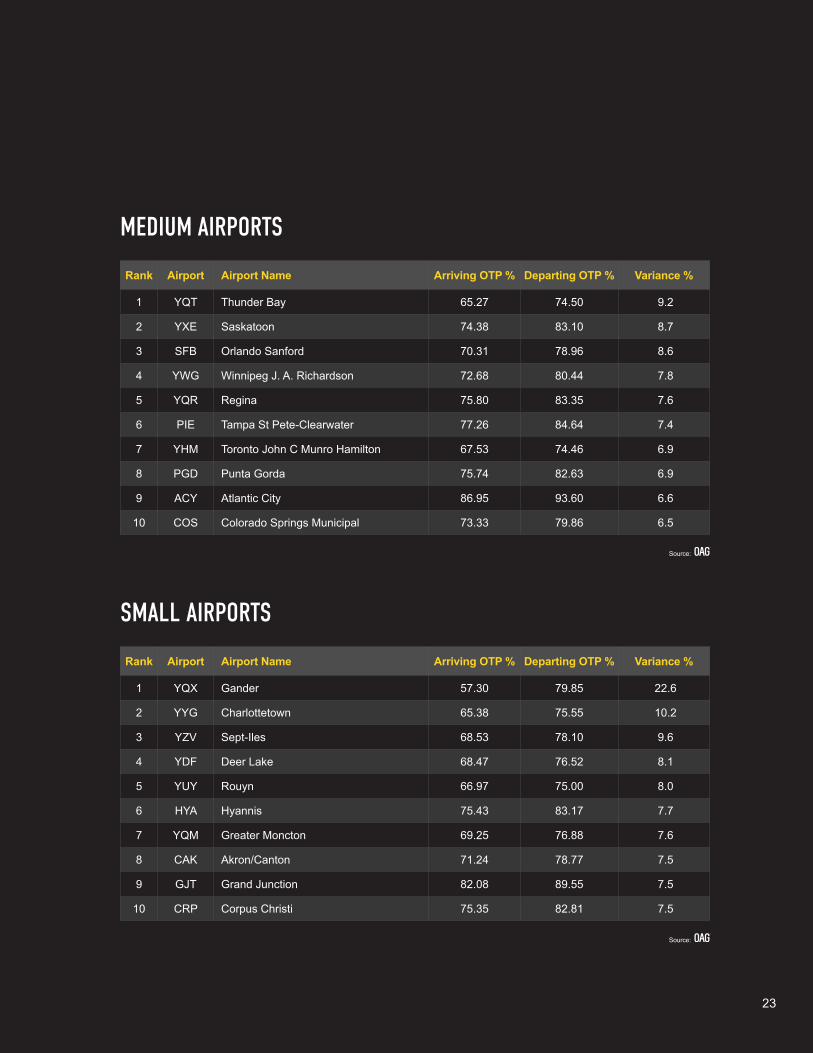
TURNAROUNDTop 10 Best Turnaround Times Medium and Small Airports
Medium airport observations:
Continuing the trend, another two Canadian airports top this size band. Thunder Bay (YQT) and Saskatoon (YXE) both manage to improve departing OTP by around nine percentage points over arriving OTP. They are joined in the Top 10 for Medium airports by Winnipeg (YWG), Regina (YQR) and Toronto Hamilton (YHM).
Small airport observations:
Arguably smaller airports should have excellent OTP as they are less congested. The Top 10 airports in the Small size band have a slightly lower average OTP for departing flights than the Medium size band, with an average of 79.6% of flights leaving on time, versus 81.5% for their slightly bigger peers.
Again, Canada dominates with six of the Top 10 airports in this band all improving OTP between arriving and departing flights to the greatest degree.
YQTThunder Bay
65.27 74.50Arriving OTP Departing OTP
9.2#1 Medium Airport Turnaround Time
KINGS
23
MEDIUM AIRPORTS
SMALL AIRPORTS
Rank Airport Airport Name Arriving OTP % Departing OTP % Variance %
1 YQT Thunder Bay 65.27 74.50 9.2
2 YXE Saskatoon 74.38 83.10 8.7
3 SFB Orlando Sanford 70.31 78.96 8.6
4 YWG Winnipeg J. A. Richardson 72.68 80.44 7.8
5 YQR Regina 75.80 83.35 7.6
6 PIE Tampa St Pete-Clearwater 77.26 84.64 7.4
7 YHM Toronto John C Munro Hamilton 67.53 74.46 6.9
8 PGD Punta Gorda 75.74 82.63 6.9
9 ACY Atlantic City 86.95 93.60 6.6
10 COS Colorado Springs Municipal 73.33 79.86 6.5
Rank Airport Airport Name Arriving OTP % Departing OTP % Variance %
1 YQX Gander 57.30 79.85 22.6
2 YYG Charlottetown 65.38 75.55 10.2
3 YZV Sept-Iles 68.53 78.10 9.6
4 YDF Deer Lake 68.47 76.52 8.1
5 YUY Rouyn 66.97 75.00 8.0
6 HYA Hyannis 75.43 83.17 7.7
7 YQM Greater Moncton 69.25 76.88 7.6
8 CAK Akron/Canton 71.24 78.77 7.5
9 GJT Grand Junction 82.08 89.55 7.5
10 CRP Corpus Christi 75.35 82.81 7.5
Source:
Source:

24
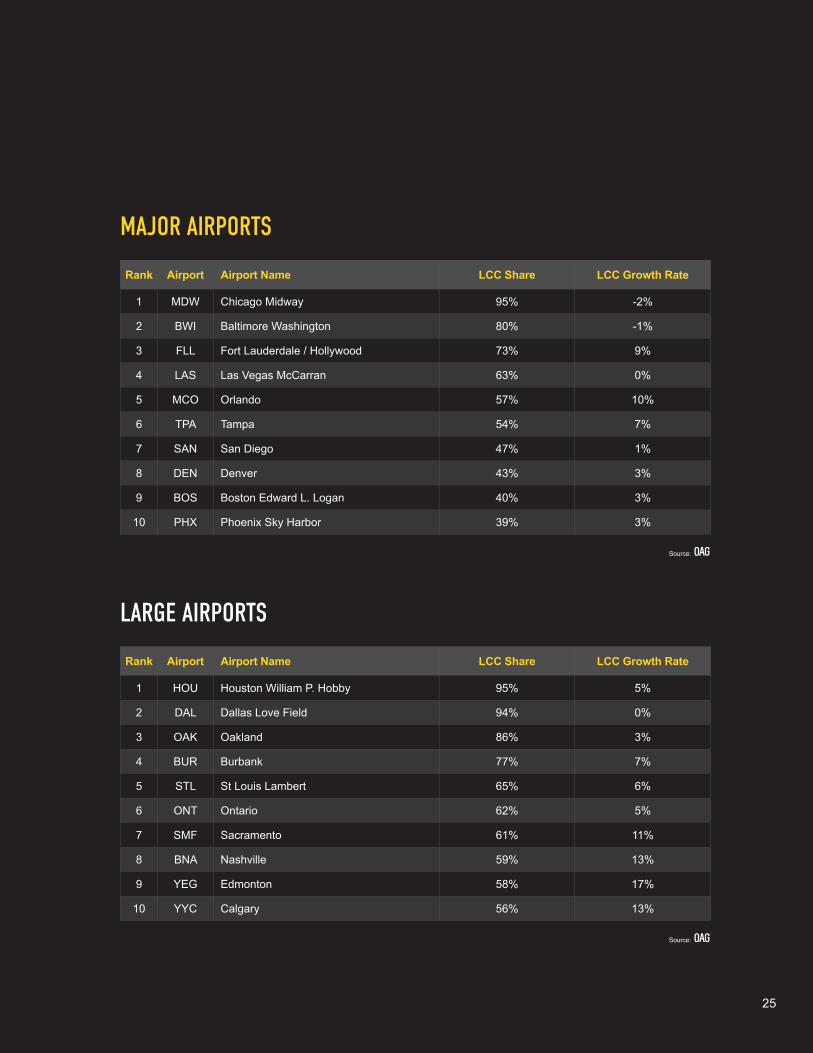
LOW-COSTCOLLABORATORSTop 10 Major and Large Airports by LCC Share
Major airport observations:
It’s not a surprise to see Chicago Midway (MDW) topping this league as 95% of flights from the airport are operated by LCCs, giving them the biggest LCC share in this size band. 93% of the airport’s capacity is operated by Southwest.
Baltimore (BWI) is the next biggest, with 80% of seats operated by LCCs, 67% of the airport’s capacity is operated by Southwest.
Fort Lauderdale (FLL), in 3rd place, Orlando (MCO) in 5th, and Tampa (TPA) in 6th are the only Major airports seeing any real LCC growth with 7-10% growth between them.
Large airport observations:
Two more Southwest strongholds, Houston Hobby (HOU) and Dallas Love Field (DAL) top the Large airport size band for the greatest share of LCC capacity with 95% and 94% of seats respectively operated by LCCs, namely Southwest.
Some of the airports in this band are seeing strong growth in LCC capacity with Edmonton (YEG) recording a 17% increase in LCC seats in the last 12 months, taking LCC share to 58%. Nashville (BNA) is another Large airport also recording strong LCC growth – 13% increase taking LCC share to 59%.
MDW
HOU
BWI
DAL
FLL
OAK
Top 3 Major Airport LCC Share
Top 3 Large Airport LCC Share
95%
95%
80%
94%
73%
86%
25
MAJOR AIRPORTS
LARGE AIRPORTS
Rank Airport Airport Name LCC Share LCC Growth Rate
1 MDW Chicago Midway 95% -2%
2 BWI Baltimore Washington 80% -1%
3 FLL Fort Lauderdale / Hollywood 73% 9%
4 LAS Las Vegas McCarran 63% 0%
5 MCO Orlando 57% 10%
6 TPA Tampa 54% 7%
7 SAN San Diego 47% 1%
8 DEN Denver 43% 3%
9 BOS Boston Edward L. Logan 40% 3%
10 PHX Phoenix Sky Harbor 39% 3%
Rank Airport Airport Name LCC Share LCC Growth Rate
1 HOU Houston William P. Hobby 95% 5%
2 DAL Dallas Love Field 94% 0%
3 OAK Oakland 86% 3%
4 BUR Burbank 77% 7%
5 STL St Louis Lambert 65% 6%
6 ONT Ontario 62% 5%
7 SMF Sacramento 61% 11%
8 BNA Nashville 59% 13%
9 YEG Edmonton 58% 17%
10 YYC Calgary 56% 13%
Source:
Source:

26
LOW-COSTCOLLABORATORSTop 10 Medium and Small Airports by LCC Share
Medium airport observations:
Many of the Medium size airports have a high LCC share with eight of the Top 10 having over 90% of seats operated by LCCs.
Phoenix Mesa (AZA) has seen strong growth in LCC seats in the last 12 months of 23%. Allegiant dominates here with 96% of seats.
Abbotsford (YXX) and Toronto (YHM) stand out again in this category as they benefit from the launch of the Westjet backed ultra LCC Swoop.
Small airport observations:
All the airports in the Small size band have 100% of seats operated by LCCs. Some are experiencing faster growth than others.
Concord (USA) has 30% more LCC seats in the last 12 months, while Portsmouth (PSM) has recorded a seat increase of 52%.
PGD
TTN
ACY
USA
AZA
LBE
Top 3 Medium Airport LCC Share
Top 3 Small Airport LCC Share
100%
100%
100%
100%
99%
100%
26

27
MEDIUM AIRPORTS
SMALL AIRPORTS
Source:
Source:
Rank Airport Airport Name LCC Share LCC Growth Rate
1 PGD Punta Gorda 100% 11%
2 ACY Atlantic City 100% 1%
3 AZA Phoenix Mesa 99% 23%
4 PIE Tampa St Pete-Clearwater 99% 3%
5 YXX Abbotsford 96% 46%
6 ISP Islip 95% -3%
7 SFB Orlando Sanford 91% 5%
8 YHM Toronto John C. Munro Hamilton 91% 66%
9 LGB Long Beach 88% -14%
10 MYR Myrtle Beach 66% 12%
Rank Airport Airport Name LCC Share LCC Growth Rate
1 TTN Philadelphia Trenton-Mercer 100% 16%
2 USA Concord 100% 30%
3 LBE Latrobe 100% 4%
4 IAG Niagara Falls 100% -1%
5 SCK Sacramento Stockton Metropolitan 100% 4%
6 RFD Chicago / Rockford 100% -1%
7 PVU Provo 100% 12%
8 PSM Portsmouth Pease 100% 52%
9 YKF Toronto Region of Waterloo 100% -22%
10 YBR Brandon 100% 4%
27
Free trial Find out more at www.oag.com Make your next move a smart move.
Analyser Powerful analytical platform to drive commercial and operational decision making across the aviation industry.
Schedules TrafficConnections Mapper DOT
MAKE SMARTER MOVES
Usage and attribution
This information can be reproduced either in whole or in part, online or in print, for non-commercial purposes only but must include attribution to OAG and a link to www.oag.com.
Disclaimer
The intended recipient (“The Customer”) acknowledges that all data provided by or available through OAG is owned either by OAG Aviation Worldwide Ltd or by a third party provider (“The Owners”) and that the customer shall not acquire any ownership or interest in such data.
OAG data is solely for the benefit and purposes of the intended recipient and may not be disclosed to, used by or copied by anyone other than the intended recipient. OAG Aviation Worldwide Ltd has used reasonable efforts in collecting and preparing data in the report but cannot and does not warrant that the information contained in this report is complete or accurate. OAG Aviation Worldwide Ltd hereby disclaims liability to any person for any loss or damage caused by errors or omissions in this report.
© 2019 OAG Aviation Worldwide Limited. All rights reserved


![[MC-DRT]: Distributed Routing Table (DRT) Version 1€¦ · Distributed Routing Table (DRT) Version 1.0 Intellectual Property Rights Notice for Open Specifications Documentation](https://img.pdfslide.us/doc/110x75/603ec42a19edb942e54403aa/mc-drt-distributed-routing-table-drt-version-1-distributed-routing-table-drt.jpg)