Embed Size (px)
Citation preview

North American pollution outflow and the trapping of convectively
lifted pollution by upper-level anticyclone
Qinbin Li,1 Daniel J. Jacob, Rokjin Park, Yuxuan Wang, Colette L. Heald, Rynda Hudman,
and Robert M. YantoscaDepartment of Earth and Planetary Sciences, Division of Engineering and Applied Sciences, Harvard University, Cambridge,Massachusetts, USA
Randall V. MartinDepartment of Physics and Atmospheric Science, Dalhousie University, Halifax, Nova Scotia, Canada
Mathew EvansSchool of the Environment, University of Leeds, Leeds, UK
Received 19 May 2004; revised 12 December 2004; accepted 18 February 2005; published 17 May 2005.
[1] We examine the major outflow pathways for North American pollution to the Atlanticin summer by conducting a 4-year simulation with the GEOS-CHEM global chemicaltransport model, including a coupled ozone-aerosol simulation with 1� � 1� horizontalresolution for summer 2000. The outflow is driven principally by cyclones trackingeastward across North America at 45–55�N, every 5 days on average. Anthropogenic andfire effluents from western North America are mostly transported north and east,eventually merging with the eastern U.S. pollution outflow to the Atlantic. Asemipermanent upper-level anticyclone traps the convective outflow and allows it to agein the upper troposphere over the United States for several days. Rapid ozone productiontakes place in this outflow, driven in part by anthropogenic and lightning NOx and inpart by HOx radicals produced from convectively lifted CH2O that originates frombiogenic isoprene. This mechanism could explain ozonesonde observations of elevatedozone in the upper troposphere over the southeastern United States. Asian and Europeanpollution influences in the North American outflow to the Atlantic are found to bedispersed into the background and do not generate distinct plumes. Satellite observationsof CO columns from MOPITT and of aerosol optical depths (AODs) from MODISprovide useful mapping of outflow events, despite their restriction to clear-sky scenes.
Citation: Li, Q., D. J. Jacob, R. Park, Y. Wang, C. L. Heald, R. Hudman, R. M. Yantosca, R. V. Martin, and M. Evans (2005), North
American pollution outflow and the trapping of convectively lifted pollution by upper-level anticyclone, J. Geophys. Res., 110,
D10301, doi:10.1029/2004JD005039.
1. Introduction
[2] North America is a major source of anthropogenictrace gases and aerosols to the global atmosphere[Intergovernmental Panel on Climate Change (IPCC),2001]. The International Consortium on AtmosphericTransport and Transformation (ICARTT) campaign, to beconducted in July–August 2004, will characterize NorthAmerican chemical outflow through extensive measure-ments of greenhouse gases, oxidants, aerosols, and theirprecursors from several aircraft platforms based in theeastern United States. Successful execution of the campaignand interpretation of the data requires an understanding ofthe pathways and mechanisms for the outflow. We address
this issue here with a global three-dimensional (3-D)chemical transport model (CTM) applied to simulations offour past summers (1998, 2000, 2001, 2002) and includingan assessment of the value of satellite measurements of CO(MOPITT) and aerosols (MODIS) for observing NorthAmerican outflow.[3] Midlatitude cyclones drive most of the outflow from
North America to the North Atlantic, even in summer whenthey are relatively weak [Dickerson et al., 1995; Merrilland Moody, 1996; Moody et al., 1996]. The summertimecyclones form in the lee of the Rocky Mountains andalong the mid-Atlantic east coast [Zishka and Smith, 1980;Whittaker and Horn, 1984]. They propagate eastward andpoleward before weakening south of Greenland. The asso-ciated surface cold fronts sweep southeastward across theeastern United States. There are four basic types of air-streams associated with a midlatitude cyclone: the warmconveyor belt (WCB) ahead of the cold front, the coldconveyor belt (CCB), the dry airstream (DA) subsiding
JOURNAL OF GEOPHYSICAL RESEARCH, VOL. 110, D10301, doi:10.1029/2004JD005039, 2005
1Now at Jet Propulsion Laboratory, California Institute of Technology,Pasadena, California, USA.
Copyright 2004 by the American Geophysical Union.0148-0227/05/2004JD005039$09.00
D10301 1 of 18
behind the cold front, and the post cold front (PCF)boundary layer airstream [Carlson, 1980; Browning andMonk, 1982; Browning and Roberts, 1994; Carlson, 1998;Cooper et al., 2001; Cooper et al., 2002a, 2002b].[4] Convection has also long been recognized as an
effective mechanism for ventilating the continental bound-ary layer of the United States and providing a direct conduitto the upper troposphere [Dickerson et al., 1987; Pickeringet al., 1988, 1992; Jacob et al., 1993; Thompson et al.,1994]. Convection is particularly important for ventilatingthe southeastern United States in summer, as the WCBsfrom the midlatitude cyclones generally do not extend thatfar south. This convective outflow can then remain forseveral days over the United States in a circulation arounda semipermanent upper-level anticyclone, leading to highconcentrations of ozone.[5] In the present work we first conduct a 4-year simu-
lation of carbon monoxide (CO) with the GEOS-CHEMCTM to examine the interannual variability of NorthAmerican pollution outflow. CO is emitted by incompletecombustion and is also produced within the atmosphere byoxidation of hydrocarbons. It has a lifetime in the atmo-sphere of about 2 months against oxidation by OH,making it a sensitive tracer for long-range transport ofpollution [Staudt et al., 2001; Liu et al., 2003]. We thenfocus on examining the impact of upper-level anticycloneon convective outflow in the southern United States.
2. Model Description
[6] The GEOS-CHEM CTM is driven by assimilatedmeteorological data with 6-hour resolution (3-hour forsurface variables and mixing depths) from the GoddardEarth Observing System (GEOS-3) of the NASA DataAssimilation Office (DAO). The first description ofGEOS-CHEM as applied to simulation of troposphericozone-NOx-hydrocarbon chemistry was presented by Beyet al. [2001a]. Other applications have focused on CO[Duncan et al., 2003; Palmer et al., 2003a] and aerosols[Park et al., 2003, 2004; B. N. Duncan et al., Model studyof the variability and trends of carbon monoxide (1988–1997): 1. Model formulation, evaluation, and sensitivity,submitted to Journal of Geophysical Research, 2005, here-inafter referred to as Duncan et al., submitted manuscript,2005]. Applications to North American outflow of ozone,CO, and nitrogen oxides were presented by Li et al. [2002a,2002b, 2004]. We use here GEOS-CHEM version 5.04(available at http://www-as.harvard.edu/chemistry/trop/geos), which includes a simulation of aerosol chemistrycoupled to ozone-NOx-hydrocarbon chemistry [Park et al.,2004].[7] The GEOS-3 meteorological data are available at
1� � 1� horizontal resolution and 48 s vertical levels. Theboundary layer up to 2 km is resolved by nine layers withmidpoints at 10, 45, 115, 220, 370, 580, 870, 1250, and1740 m altitude for a column based at sea level. Wepresent here global GEOS-CHEM simulations of COconducted at 2� � 2.5� resolution (i.e., by degrading themeteorological data from 1� � 1� to 2� � 2.5�) for thesummers of 1998, 2000, 2001, and 2002. We also presenta coupled ozone-aerosol full-chemistry simulation at 1� �1� resolution for the summer of 2000 with a nested model
version for North America and the adjacent oceans (10–60�N, 40–140�W) using dynamic boundary conditionsfrom a global 4� � 5� simulation. A detailed descriptionof this one-way nesting in the GEOS-CHEM model isgiven by Wang et al. [2004]. All simulations presentedhere were conducted for 6 months (March–August) usingstandard GEOS-CHEM model output as initial conditions.The first 3 months were used for initialization, and wefocus our attention on results for June–August.[8] The model includes over 80 chemical species and 300
reactions to describe tropospheric ozone-NOx-hydrocarbon-sulfur chemistry. The aerosol simulation is described byPark et al. [2003, 2004] and includes sulfate-nitrate-ammonium and carbonaceous aerosols. For sea salt and soildust aerosols we use monthly mean fields for 1997 from theGOCART CTM [Ginoux et al., 2001; Chin et al., 2002]. Wetdeposition of soluble gases and aerosols in GEOS-CHEM isdescribed by Liu et al. [2001] and includes scavenging fromconvective updrafts, rainout from convective anvils, andrainout and washout from large-scale precipitation.[9] Our CO simulation uses the same CO sources in all
4 years in order to focus on variability in transport. COsources in the model include fossil fuel and biofuelcombustion, biomass burning emissions, and chemicalproduction from atmospheric oxidation of methane, iso-prene, and other volatile organic compounds (VOCs).Aseasonal fuel emissions for 1998 are taken from Duncanet al. (submitted manuscript, 2005). Biomass burning emis-sions are from the Duncan et al. [2003] climatology with1� � 1� spatial resolution and monthly temporal resolution.This climatology includes large forest fires in Canada andthe western United States in summer. In the nested simu-lation for summer 2000, we use specific biomass burningemissions for that year from Duncan et al. [2003], againwith monthly temporal resolution. Compared with theclimatology, the summer of 2000 had few boreal forestfires in Canada but large forest fires in the northwesternUnited States in July and August.[10] The major sink for CO is reaction with OH. The CO-
only simulations presented here use archived OH fieldsfrom a full chemistry simulation, as was done previously byBey et al. [2001b]. To identify source regions and typescontributing to the North American outflow, we transportseparately in the model a suite of CO tracers, i.e., ‘‘tagging’’emissions from different source regions and types, atechnique that has been used previously in a number ofGEOS-CHEM applications [Bey et al., 2001b; Li et al.,2002a; Liu et al., 2003]. We use here four geographicaltracers for anthropogenic emissions (North America, Asia,Europe, and the rest of the world) and two for biomassburning (North America and the rest of the world). Sinceour simulation of CO is linear, the sum of the separatetracers is close to the total simulated CO concentrations,not exactly so because of small nonlinearities in transport.
3. Observations
[11] We will compare here the GEOS-CHEM fields to COcolumns from MOPITT and to AODs from MODIS andfrom the AERONET network. Both MOPITT and MODISare aboard the Terra satellite in Sun-synchronous polar orbitwith 1030 local time overpass (another MODIS instrument
D10301 LI ET AL.: NORTH AMERICAN POLLUTION OUTFLOW
2 of 18
D10301

is on board the Aqua satellite but those data were not usedhere). MOPITT observes the infrared emission of CO in thenadir and obtains 1–2 pieces of information on the verticalprofile weighted toward the middle and upper troposphere[Deeter et al., 2003; Heald et al., 2003]. Previous compar-isons of GEOS-CHEM to MOPITT were presented byHeald et al. [2003] in a study of Asian outflow andtranspacific transport of pollution and by Arellano et al.[2004] in a global inverse analysis of CO sources. Forcomparison with MOPITT, we sample GEOS-CHEM alongthe satellite orbit track and only for scenes with successfulretrievals (clear skies). Following Heald et al. [2003], wefocus on the column CO data and apply the MOPITTaveraging kernels for the individual retrievals to theGEOS-CHEM vertical profiles. Figure 1 (top) showsobserved and simulated monthly mean CO columns for
July 2000. Elevated CO columns are seen in the easternUnited States and downwind over the North Atlantic.[12] Simulated CO columns are 14% too high relative to
MOPITT values, particularly over the source regions suchas the Middle Atlantic states, the Gulf Coast, and the LosAngles Basin and downwind of these source regions(Figure 2). Comparison of MOPITT and model simulatedvertical profiles over the region defined by 75�–85�W,40�–45�N (Maryland, Delaware, New Jersey, and Penn-sylvania), where the discrepancy is largest, shows thatmodel simulated CO concentrations are higher by 20–40 ppb than MOPITT retrievals. This discrepancy maypartly be explained by the relatively low sensitivity ofMOPITT in the lower tropoposphere, particularly in theboundary [Heald et al., 2003]. Applying the MOPITTaveraging kernel bringing model simulated boundary layer
Figure 1. Monthly mean CO columns from MOPITT and aerosol optical depths at 550 nm fromMODIS for July 2000. White areas indicate missing data. Corresponding GEOS-CHEM model results areon the right. The observations are at 1030 local time and model results are sampled at 0900–1200 localtime. MOPITT data are available for 1–3, 15–31 July only. GEOS-CHEM results for comparison withMOPITT are sampled along the MOPITT orbit tracks, for scenes with successful retrievals, and areprocessed with the local MOPITT averaging kernels as described by Heald et al. [2003].
D10301 LI ET AL.: NORTH AMERICAN POLLUTION OUTFLOW
3 of 18
D10301

CO concentrations by 20–25 ppb, as shown in Figure 1.Considering that we used 1998 emissions for all the modelsimulations presented here, the discrepancy could also bepartly explained by the difference in CO emissionsbetween 1998 and 2000. Emission trends data from theU.S. Environmental Protection Agency indicate a 5% peryear average annual decrease in CO vehicular emissions[United States Environmental Protection Agency, 2000;Parrish et al., 2002].[13] MODIS uses observations of solar backscatter in
seven spectral channels (470–2100 nm) for its AODretrieval [Kaufman et al., 1997; Tanre et al., 1997].Validation with the AERONET surface network indicatesretrieval errors of DAOD = ±0.05 ± 0.2AOD over land
[Chu et al., 2002] and of DAOD = ±0.03 ± 0.05AOD overocean [Remer et al., 2002]. Since MODIS provides about95% coverage of the Earth in a day [Chu et al., 2003], wedo not attempt to resolve orbit tracks and simply samplethe model globally for that particular day at 0900–1200local time. We calculate the AOD in GEOS-CHEM fromthe mass concentration and extinction efficiency for eachaerosol type following Martin et al. [2003]. Aerosolproperties assumed in the model may be different fromthose assumed in the MODIS retrieval, but we do notattempt to take into account this difference. Figure 1(bottom) shows observed and simulated monthly meanAODs (at 550 nm) for July 2000. Elevated AODs areseen over the eastern United States. The weaker pollution
Figure 2. Difference between MOPITT and GEOS-CHEM simulated monthly mean CO columns July2000. White areas indicate missing data. Bottom left shows scatterplot of MOPITT and model COcolumns. Bottom right shows averaged CO vertical profiles over 75�–85�W, 40�–45�N.
D10301 LI ET AL.: NORTH AMERICAN POLLUTION OUTFLOW
4 of 18
D10301

influence over the North Atlantic as compared withMOPITT reflects scavenging of aerosols. The unusuallyhigh values east of Newfoundland are likely due to cloudcontamination. Dusty regions of the western United States,where MODIS also observes high values, are known to besubject to large retrieval errors [Chu et al., 2003].[14] Sites of the AERONET network make direct solar
radiation measurements at 340–1020 nm wavelengths withSun-sky scanning spectral radiometers [Holben et al.,1998]. We use here AODs reported at 440 nm. Figure 3compares simulated versus observed time series ofAERONET AODs at Wallops Island, Virginia (75.5�W,37.9�N). Model values are also for 440 nm and are averagesfor 0900–1200 local time. The model captures the majorpollution episodes seen in the observations; the arrowindicates a specific event to be discussed in the text.
4. North American Outflow Pathways
4.1. Meteorological Setting
[15] Summertime cyclones over North America are gen-erally located farther north than their cold-season counter-parts and are less frequent. The summer maximum ofcyclone activity is between 45�N and 55�N, with themaximum frequency found in the James Bay area ofCanada and off the Labrador coast [Zishka and Smith,1980; Whittaker and Horn, 1984]. The cyclones form inthe lee of the Rocky Mountains and over the mid-Atlanticcoast of the United States. There are four main cyclonetracks: two across central Canada merging over James Bay,one across the northern United States, and a fourth alongthe mid-Atlantic coast. As the cyclones track northeast-ward, the associated surface cold fronts sweep southeast-ward across eastern North America. South of 35�N, thecold fronts often become stationary and dissipate as the
temperature contrast across the front decreases. As a result,the WCBs associated with the cold fronts generally origi-nate in the central United States [Stohl, 2001; Eckhardt andStohl, 2004] and extend northeastward, ending in the uppertroposphere over the Canadian Maritime Provinces andNewfoundland.[16] Figure 4 shows GEOS-3 winds at 950 hPa and
500 hPa for July of the 4 simulation years. At 950 hPawinds are weak and disorganized over the eastern UnitedStates. Northwesterly flow prevails from Manitoba to theGreat Lakes and the northeast coast, strongest in 1998,while southwesterly flow prevails from the northeast coastto the Canadian Maritime Provinces and Newfoundland. Aprominent feature of the circulation over the United Statesis the strong low-level jet transporting air and moisturefrom the Gulf of Mexico to the central United States up toabout 45�N, weakest in 2002. The low-level jet and thesurface heat low in summer lead to convergence andconvection in the central United States, resulting in frequentoccurrence of mesoscale convective complexes (MCCs)[Maddox, 1980].[17] At 500 hPa, a strong anticyclone dominates the
south-central and southwestern United States. Previousclimatological analyses have shown that this anticycloneis semipermanent in summer due to intense surfaceheating [Bell and Bosart, 1989; Parker et al., 1989]. Itonly occasionally breaks open. As will be discussed insection 5, this anticyclonic circulation has importantimplications for the fate of convective outflow over theUnited States. The anticyclone, the strong upper-levelHudson Bay Low, and the northward expansion of thesubtropical Bermuda high result in a wave-like flowpattern at 500 hPa. Northwesterly flow prevails fromManitoba to the northeast coast, while southwesterly flowdominates from the northeast coast to the Canadian
Figure 3. Aerosol optical depths (at 440 nm) at Wallops, Virginia (75.5�W, 37.9�N) for July 2000. Thedots are AERONET observations (from http://aeronet.gsfc.nasa.gov) and the solid line is GEOS-CHEMaverage over 0900–1200 local time. The arrow indicates the pollution episode discussed in the text.
D10301 LI ET AL.: NORTH AMERICAN POLLUTION OUTFLOW
5 of 18
D10301

Figure 4. Monthly mean GEOS-3 winds at 950 hPa and 500 hPa for July 2000 and the differencesrelative to July 2000 for 1998, 2001, and 2002.
D10301 LI ET AL.: NORTH AMERICAN POLLUTION OUTFLOW
6 of 18
D10301
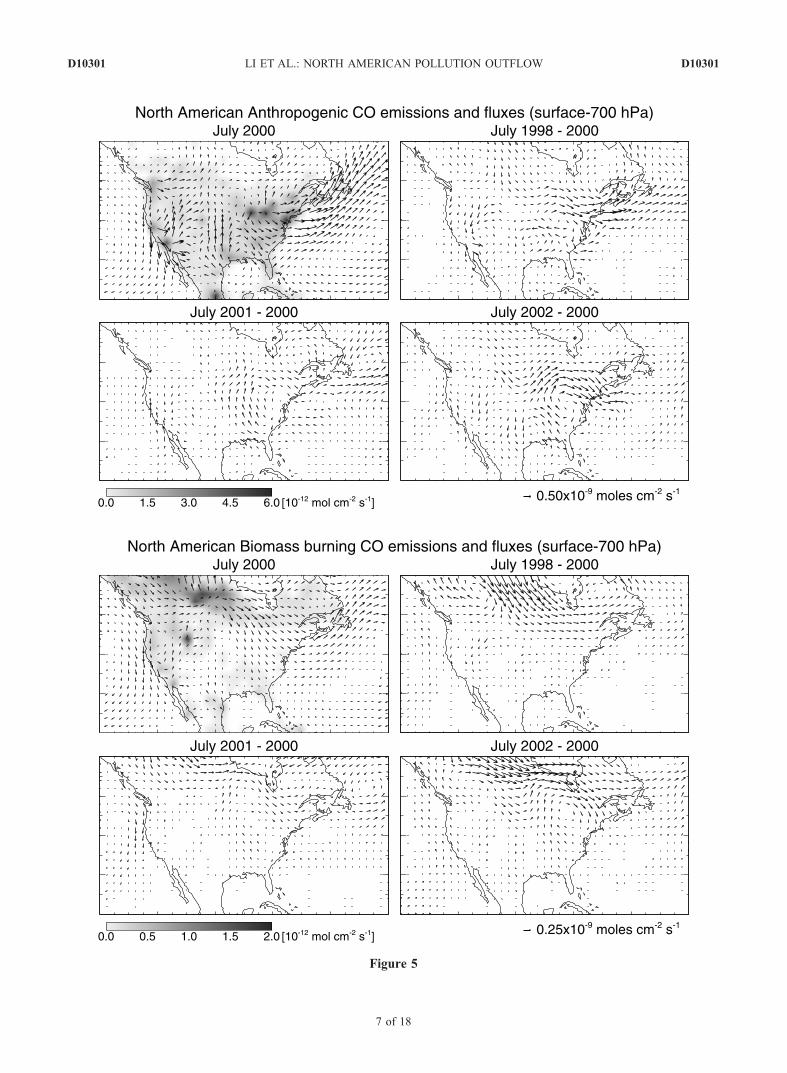
Figure 5
D10301 LI ET AL.: NORTH AMERICAN POLLUTION OUTFLOW
7 of 18
D10301

Maritime Provinces and Newfoundland. The maximumwinds across the east coast are further south in 2000 and2001 than in 1998 and 2002. Flow patterns at 300 hPa aresimilar to those at 500 hPa and are not shown here. Theanticyclonic circulation is also evident at 300 hPa.
4.2. Interannual Variability of North AmericanOutflow
[18] Figure 5 shows July monthly mean horizontal fluxesof North American anthropogenic and biomass burning COaveraged over the 1000–700 hPa column for the 4 simula-tion years. These fluxes were calculated from the tagged COtracer simulation (section 2). Strong CO fluxes across theeast coast of North America span a wide latitude rangebetween 30�N and 55�N, consistent with a previous study ofNorth American outflow to the North Atlantic byWhelpdaleet al. [1984]. The northeastern United States, the CanadianMaritime Provinces, and Newfoundland are heavilyinfluenced by anthropogenic outflow, which is strongest
in 1998 and 2002 and weakest in 2001, reflecting thedifferent strength of the respective winds (Figure 4). Bio-mass burning CO, mainly emitted in boreal Canada and thenorthwestern United States in summer, is transported firstsoutheastward to the Great Lakes region and the northeastUnited States and then northeastward to the CanadianMaritime Provinces and Newfoundland. Biomass burninginfluence reaches the southeast United States in July 2000and 1998 but not significantly in the other 2 years. Previousstudies have shown that Canadian forest fire emissions cancause major enhancements of CO and aerosols in thesoutheastern United States in summer [Wotawa and Trainer,2000; Park et al., 2003; Lamarque et al., 2003]. Biomassburning outflow is strongest in 1998 and 2002.[19] The West Coast of the United States is a major
anthropogenic source. The main export route from thisregion is northward to 45–50�N, then eastward to themidwest, and eventually merging with the east coast pollu-tion outflow. About half of this export takes place in the free
Figure 5. GEOS-CHEM monthly mean horizontal fluxes of North American anthropogenic and biomass burning COaveraged over the 1000–700 hPa column for July 2000 and the difference relative to July 2000 for 1998, 2001, and2002.‘‘North American CO’’ refers to CO originating from anthropogenic and biomass burning emissions over NorthAmerican continent. Also shown are anthropogenic and biomass burning CO emissions. Anthropogenic emissions from1998 and climatological biomass burning emissions are used for all 4 years so that flux differences are due to meterology.Note the difference in arrow scales for the anthropogenic and biomass burning parts.
Figure 6. GEOS-CHEM monthly mean vertical fluxes of North American CO at 3 km for July 1998,2000, 2001, and 2002.
D10301 LI ET AL.: NORTH AMERICAN POLLUTION OUTFLOW
8 of 18
D10301

troposphere above 3 km. Only a small fraction of the WestCoast pollution is exported southwest to the Pacific where itenters the large-scale transport around the Pacific High. Thelatter mechanism is known to cause events of long-rangetransport of North American pollution to Hawaii in summer[Galasyn et al., 1987; Moxim, 1990; Balkanski et al., 1992],but it is in fact only a minor outflow pathway. Pollutionfrom the Gulf coast and Texas is similarly transported to45–50�N by the low-level jet followed by eastward trans-port to the Great Lakes region and the northeast UnitedStates, merging there with the east coast outflow. This is animportant export route for the Gulf Coast pollution inaddition to convective outflow.[20] Figure 6 shows mean North American CO vertical
fluxes at 3 km in July for the four simulation years. HereNorth American CO refers to CO originating from both
anthropogenic and biomass burning emissions over thecontinent. Deep convection is most active over the Midwest,the Gulf Coast, and the east coast. It lifts surface pollution tothe upper troposphere from where it is generally transportednortheastward. However, we find that surface pollutionconvected to the upper troposphere over the central andsoutheast United States tends to circulate around the upper-level southwestern U.S. anticyclone (Figure 4, bottom) andcan age for several days over the United States, as will befurther discussed in section 5.[21] Figure 7 shows the simulated latitude-altitude cross
section at 70�W (roughly along the east coast) of monthlymean concentrations and eastward fluxes of North Ameri-can CO for July. In all 4 years, North American pollutioninfluence is strongest at 35�–50�N in the boundary layerand at 30�–40�N in the upper troposphere. The tagged
Figure 7. GEOS-CHEM monthly mean zonal fluxes (line contours) and concentrations (color contours)of North American CO at 70�W for July 1998, 2000, 2001, and 2002.
Table 1. North American Outflow of CO Across 70�W Longitude in Julya
Altitude 1998 2000 2001 2002
0–3 kmAnthropogenic 0.285 (3.44) 0.229 (2.76) 0.186 (2.25) 0.280 (3.38)Biomass burning 0.090 (1.08) 0.070 (0.84) 0.066 (0.80) 0.100 (1.21)
3–8 km 0.137 (3.17) 0.133 (3.06) 0.123 (2.83) 0.137 (3.17)8–15 km 0.119 (3.65) 0.101 (3.08) 0.099 (3.03) 0.104 (3.18)
aResults are monthly averages at 30�–60�N along 70�W longitude. Values given in units of mol cm2 s�1. Values in parenthesesare outflow in units of Tg CO.
D10301 LI ET AL.: NORTH AMERICAN POLLUTION OUTFLOW
9 of 18
D10301

tracer simulations show that both reflect anthropogenicemissions. The same simulations also indicate that biomassburning influence is strongest at 40�–55�N in the boundarylayer. Case studies have shown that smoke from large firescan be injected to altitudes as high as 15 km by supercellconvection[Fromm and Servranckx, 2003]. Data on forestfire plume heights, not yet available, are required for a morerealistic simulation of biomass burning emission influence.Table 1 compares the strength of North American COoutflow in the 4 simulation years. Outflow is strongest in1998 both in the boundary layer and in the free troposphereand weakest in 2001. North American CO outflow in theboundary layer accounts for 33%, 31%, 28%, and 35% ofthe total eastward export.[22] We also compared the frequency and intensity of
North American outflow events in July of the 4 simulationyears by examining time series of North American COconcentrations along the east coast. Figure 8 shows timeseries of simulated 950 hPa North American anthropogenicCO concentrations at 10�–60�N along 70�W longitude.Again, North American outflows are concentrated at 35�–50�N. The frequency of North American outflow events(defined here as North American anthropogenic CO largerthan 50 ppb) is five to seven, typical for July of the 4 years.The outflow events in July 2000 as indicated by COconcentrations correspond very well with outflow eventsindicated by the AODs observed at Wallops (Figure 3).Outflow is most frequent and strongest in 1998 among the4 years with seven events and highest CO enhancements.
Outflow is least frequent and weakest in 2001. Examina-tion of time series of 300 hPa North American COconcentrations indicate that convective outflow is alsostrongest in 1998 and weakest in 2001 (not shown here).
4.3. Episodic North American Outflow
[23] Export from North America is highly episodic,associated with the passage of cold fronts and convectiveactivity [Cooper et al., 2001]. We find 21 outflow eventsassociated with frontal passages during the summer of 2000,for a mean recurring frequency of every 4 to 5 days. We findthat the most typical North American outflow pattern insummer is associated with cyclones tracking from the GreatLakes region to Newfoundland and the associated surfacecold fronts sweeping across the northeastern United States.Here we illustrate one such event that took place on 3–6 July and terminated a regional pollution episode.[24] Pollution episodes in the eastern United States are
associated with weak anticylones [Logan, 1989], and suchwere the conditions on the days preceding 3 July. Thepollution episode over the east coast is indicated by theelevated CO columns on 2–3 July (Figure 9, top).Enhanced CO columns are seen over and to the east ofNewfoundland due to a previous outflow event. On 4 Julythe high pressure over the eastern United States began togive way as low pressure forming over James Bay movedsoutheastward. The low intensified into a cyclone and theassociated surface cold front swept southeastward acrossthe northeastern United States. On 5 July the cyclone was
Figure 8. Time series of GEOS-CHEM simulated North American anthropogenic CO concentrations at950 hPa along 70�W for July 1998, 2000, 2001, and 2002. Values below 50 ppb are not shown. Thedashed lines separate the different outflow events.
D10301 LI ET AL.: NORTH AMERICAN POLLUTION OUTFLOW
10 of 18
D10301

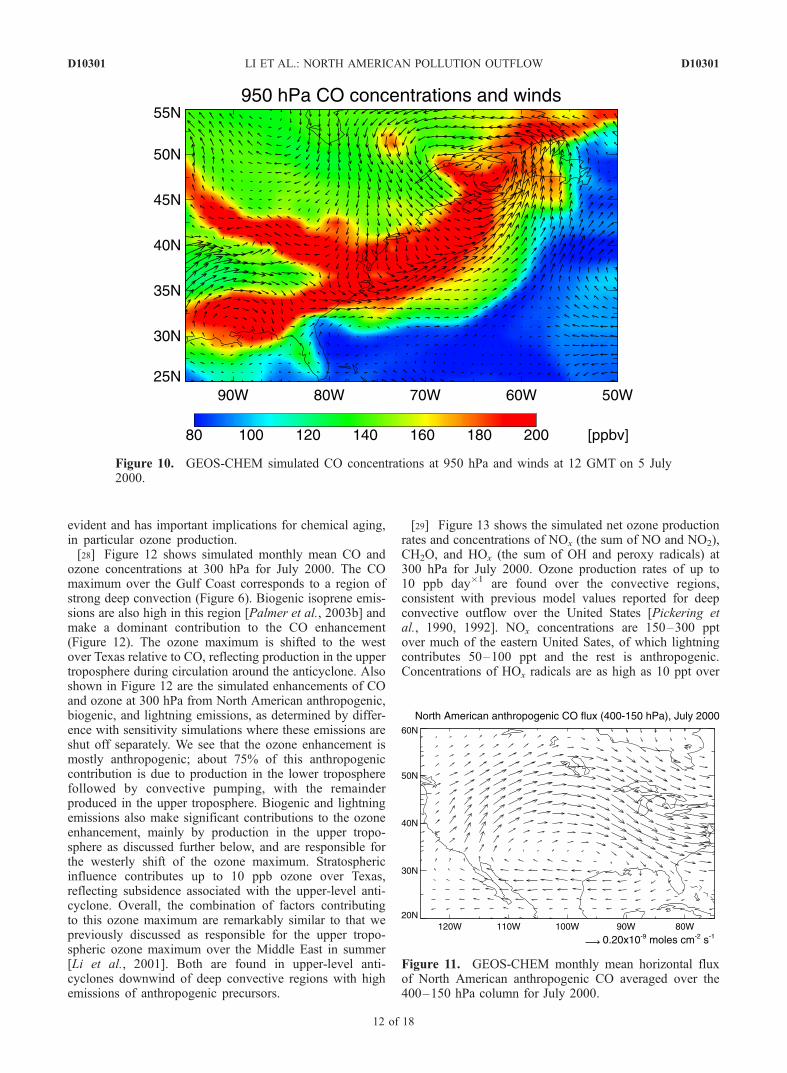
located over the Gulf of St. Lawrence, where the WCBreached its highest altitude.[25] Figure 10 shows simulated CO concentrations at
950 on 5 July. The sharp change in the direction of the950 hPa wind indicates the location of the surface coldfront. There was WCB outflow ahead of and boundarylayer outflow behind the surface front. High AODs wereseen by MODIS in the boundary layer outflow (Figure 9,bottom). MODIS does not provide aerosol data in regionscovered by clouds, but model AODs indicate transport inthe WCB at 33–37�N along the east coast. AERONETAODs at Wallops, Virginia increased from 0.2 on 2 July toover 0.8 on 3 July during the pollution episode anddecreased back to 0.2 on 5–6 July (Figure 3) as the coldfront passed through.[26] We find that boundary layer outflow is capped below
3 km altitude, with highest concentrations reaching 240, 90,and 5 ppb below 2 km for CO, ozone, and sulfate,respectively. The WCB outflow reached 8–10 km altitudein the upper troposphere over the Gulf of St. Lawrence,
where ozone concentrations are still elevated (80 ppb) whilesulfate is depleted. A subsiding tongue of high ozone fromthe upper troposphere is seen behind the cold front, reachingdown to 4 km, associated with the dry intrusion behind thecold front [Cooper et al., 2001; Cooper et al., 2002a].
5. Anticyclonic Circulation of Convective Outflowin the Upper Troposphere
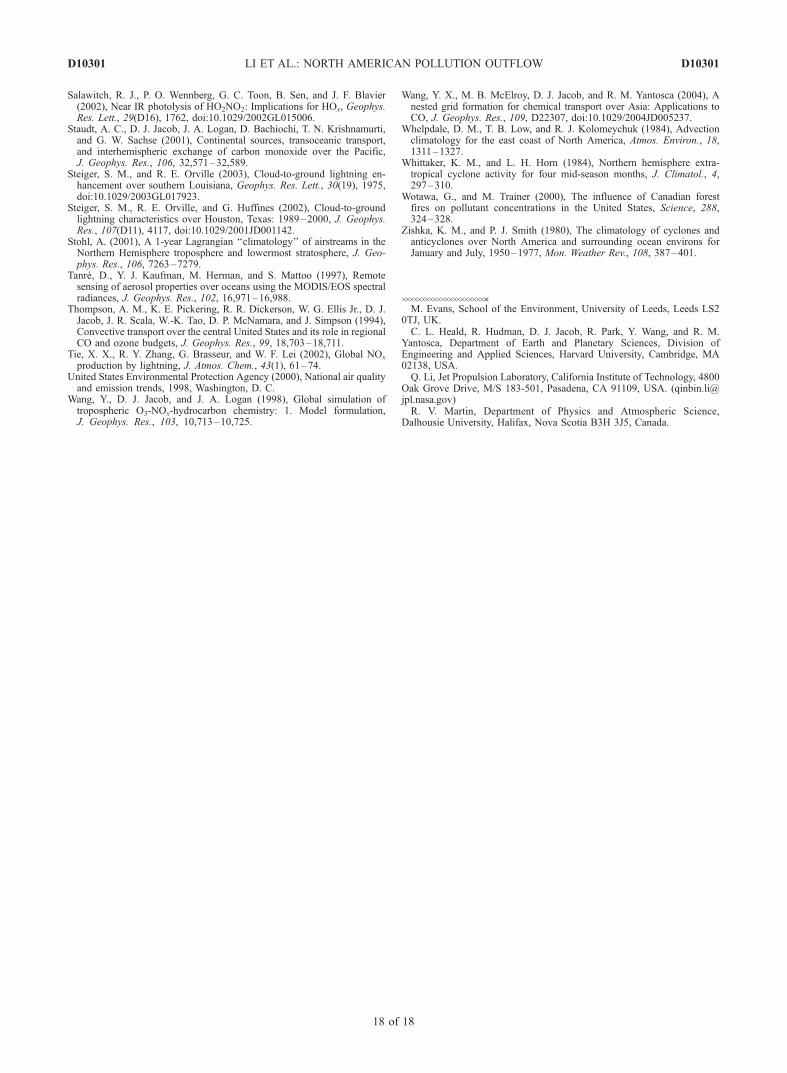
[27] In summer, and particularly in July and August, theupper-level flow over the southern United States isdominated by a semipermanent subtropical anticyclone(section 4.1). Convective outflow to the upper tropo-sphere, as frequently occurs over the central and south-eastern United States in summer (Figure 6), can circulatearound this anticyclone for several days. Figure 11 showsthe GEOS-CHEM monthly mean horizontal flux of NorthAmerican anthropogenic CO averaged over the uppertropospheric 400–150 hPa column for July 2000. Circu-lation of pollution around the upper-level anticyclone is
Figure 9. Composite maps of CO columns for 2–3 July 2000 from MOPITT and aerosol optical depths(at 550 nm) for 5 July 2000 from MODIS. Corresponding GEOS-CHEM results are shown at the right.
D10301 LI ET AL.: NORTH AMERICAN POLLUTION OUTFLOW
11 of 18
D10301
evident and has important implications for chemical aging,in particular ozone production.[28] Figure 12 shows simulated monthly mean CO and
ozone concentrations at 300 hPa for July 2000. The COmaximum over the Gulf Coast corresponds to a region ofstrong deep convection (Figure 6). Biogenic isoprene emis-sions are also high in this region [Palmer et al., 2003b] andmake a dominant contribution to the CO enhancement(Figure 12). The ozone maximum is shifted to the westover Texas relative to CO, reflecting production in the uppertroposphere during circulation around the anticyclone. Alsoshown in Figure 12 are the simulated enhancements of COand ozone at 300 hPa from North American anthropogenic,biogenic, and lightning emissions, as determined by differ-ence with sensitivity simulations where these emissions areshut off separately. We see that the ozone enhancement ismostly anthropogenic; about 75% of this anthropogeniccontribution is due to production in the lower tropospherefollowed by convective pumping, with the remainderproduced in the upper troposphere. Biogenic and lightningemissions also make significant contributions to the ozoneenhancement, mainly by production in the upper tropo-sphere as discussed further below, and are responsible forthe westerly shift of the ozone maximum. Stratosphericinfluence contributes up to 10 ppb ozone over Texas,reflecting subsidence associated with the upper-level anti-cyclone. Overall, the combination of factors contributingto this ozone maximum are remarkably similar to that wepreviously discussed as responsible for the upper tropo-spheric ozone maximum over the Middle East in summer[Li et al., 2001]. Both are found in upper-level anti-cyclones downwind of deep convective regions with highemissions of anthropogenic precursors.
[29] Figure 13 shows the simulated net ozone productionrates and concentrations of NOx (the sum of NO and NO2),CH2O, and HOx (the sum of OH and peroxy radicals) at300 hPa for July 2000. Ozone production rates of up to10 ppb day�1 are found over the convective regions,consistent with previous model values reported for deepconvective outflow over the United States [Pickering etal., 1990, 1992]. NOx concentrations are 150–300 pptover much of the eastern United Sates, of which lightningcontributes 50–100 ppt and the rest is anthropogenic.Concentrations of HOx radicals are as high as 10 ppt over
Figure 10. GEOS-CHEM simulated CO concentrations at 950 hPa and winds at 12 GMT on 5 July2000.
Figure 11. GEOS-CHEM monthly mean horizontal fluxof North American anthropogenic CO averaged over the400–150 hPa column for July 2000.
D10301 LI ET AL.: NORTH AMERICAN POLLUTION OUTFLOW
12 of 18
D10301

Figure 12. Simulated CO and ozone concentrations at 300 hPa for July 2000. The top shows the meanvalues from the standard simulation. The bottom shows the enhancements from North Americananthropogenic, biogenic, and lightning emissions, as determined by difference with sensitivitysimulations where these emissions are shut off separately.
D10301 LI ET AL.: NORTH AMERICAN POLLUTION OUTFLOW
13 of 18
D10301

the southeastern United States, reflecting photolysis ofCH2O originating from biogenic isoprene [Lee et al.,1998; Palmer et al., 2003b] and convectively pumped tothe upper troposphere. Dominance of convectively liftedCH2O as a source of the HOx over the southeastern UnitedStates in summer has previously been suggested in a globalmodel study by Muller and Brasseur [1999]. We find in themodel that primary HOx production, P(HOx) as defined byJaegle et al. [2001] exceeds 2000 ppt day�1 in the uppertroposphere. This value of P(HOx) together with the NOx
concentrations of 150–300 imply a NOx-limited chemicalregime for ozone production in the upper troposphere[Jaegle et al., 2001]. This NOx-limited regime is manifestedin the spatial correlation of ozone production and NOx
concentration in Figure 13. Nevertheless, the coincidenceof high isoprene emissions and frequent deep convectionover the southeastern United States plays a major role indriving ozone production in the upper troposphere.[30] The role of isoprene-generated CH2O in driving
ozone production in the upper troposphere becomes evenlarger if NOx emissions from lightning are increased.Lightning represents the largest uncertainty among thevarious NOx sources [Price et al., 1997; Nesbitt et al.,2000; Tie et al., 2002]. Lightning NOx emissions in
GEOS-CHEM are parameterized as a function of deepconvective cloud top [Price and Rind, 1992; Wang et al.,1998] to yield a global source of 6 Tg N yr�1 [Martin etal., 2002]. This global estimate is constrained to reproduceobserved ozone and NOy concentrations in the tropics[Martin et al., 2002] but there is no effective constraintfor emissions over the United States. Lightning emissionscould possibly be much higher there as anthropogenicaerosols stimulate lightning activity, especially in summer[Orville et al., 2001; Steiger et al., 2002; Steiger andOrville, 2003]. In addition, process-based models forlightning NOx generation give a range of 5–25 Tg N yr�1
for the global source [Price et al., 1997]. We conducted asensitivity simulation with lightning NOx emissions overNorth America increased by a factor of four relative thestandard simulation. Figure 14 shows the resulting netozone production rates and concentrations of NOx, CH2O,and HOx at 300 hPa for July 2000. Ozone production ratesare enhanced over the convective regions with maximareaching 12–17 ppb day�1. NOx concentrations are above400 ppt over much of the eastern United States withmaxima over major lightning source regions. HOx concen-trations decrease by 25–30% relative to the standardsimulation because of losses from the NO2 + OH and
Figure 13. Simulated ozone net production and concentrations of NOx, CH2O, and HOx at 300 hPa forJuly 2000. NOx is the sum of NO and NO2, and HOx is the sum of OH and peroxy radicals.
D10301 LI ET AL.: NORTH AMERICAN POLLUTION OUTFLOW
14 of 18
D10301

HNO3 + OH reactions [Jaegle et al., 2001]. HOx loss dueto the HNOx + OH reaction is less important because ofthe competing photolysis of HNOx in the near infrared[Roehl et al., 2002; Salawitch et al., 2002]. The chemicalregime for ozone production is now NOx-saturated [Jaegleet al., 2001]. Thus the highest ozone production ratescorrespond to the region of highest HOx concentrations inFigure 14. The ozone enhancement in the upper tropo-sphere (not shown) has the same pattern as in the standardsimulation, with a maximum over Texas, reflecting ozoneproduction during the circulation around the upper-levelanticyclone.[31] There is some evidence from ozonesonde profiles for
such an enhancement of ozone in the upper troposphereover the southern United States in summer. Ozonesondeprofiles over Huntsville, Alabama (34.7�N, 86.5�W) show adistinct July–August enhancement in the upper troposphereabove 400 hPa, with ozone concentrations over 80 ppb[Newchurch et al., 2003]. This enhancement starts in lateJune and disappears in September, corresponding with thetiming of the upper-level anticyclone (see section 4.1).Figure 15 shows the four ozonesonde profiles measuredby Newchurch et al. [2003] over Huntsville in July 2000.Also shown are the simulated monthly ozone vertical profile
from the standard simulation (with anthropogenic, biogenic,and lightning enhancements indicated) and from the simu-lation with lightning �4 emissions. Ozone concentrations inthe upper troposphere are over 80 ppb in the observationsand about 70 ppb in the standard simulation. Increasinglightning emissions by a factor of 4 corrects the discrepancy.However, the discrepancy could also arise from a modelunderestimate of stratospheric influence in regions ofpreferential downwelling [Hudman et al., 2004].
6. Summary and Conclusions
[32] We have used a global 3-D chemical transport modeldriven by assimilated meteorological observations (GEOS-CHEM) to examine export pathways for North Americanpollution to the Atlantic in summer. Simulations of CO for4 years (1998, 2000, 2001, and 2002) with 2� � 2.5�horizontal resolution were used to examine mean outflowpatterns and interannual variability. A higher-resolution(1� � 1�) simulation of tropospheric ozone-aerosol chem-istry for the summer of 2000 was used to characterize thevarious types of outflow events and their differentialimpact on CO, ozone, and aerosols. We also examinedthe value of satellite observations of CO columns from
Figure 14. Same as Figure 13, but from a simulation with lightning NOx emissions over North Americaincreased by a factor of four from the standard simulation.
D10301 LI ET AL.: NORTH AMERICAN POLLUTION OUTFLOW
15 of 18
D10301

MOPITT and aerosol optical depths (AODs) from MODIStoward diagnosing North American outflow.[33] We find that North American anthropogenic outflow
to the Atlantic occurs over a broad latitude range (30–55�N), covering much of the east coast. Forest fires inCanada and the western United States are occasional con-tributors to the outflow. Deep convective outflow takesplace preferentially over the U.S. Midwest, the Gulf Coast,and the east coast. Pollution from the West Coast isprincipally transported north to 45–50 N and then east,merging with the eastern U.S. pollution outflow to theAtlantic. Outflow in the boundary layer accounts for about30% of the total export of North American CO.[34] Outflow of North American pollution to the North
Atlantic is driven principally by midlatitude cyclones thatform in the lee of the Rocky Mountains and generallypropagate northeastward. The frequency of North Americanoutflow events is about 5–7 per month in summer. Theassociated surface cold fronts move southeastward and tendto dissipate south of 35�N. The warm conveyor belts(WCBs) associated with the cold fronts originate generallynorth of 30�N and extend northeastward. They lift pollutionfrom the central and northeastern United States but usually
do not reach the southeastern United States. The ascendingmotion in the WCBs reaches the upper troposphere overNewfoundland. Additional strong outflow takes place in theboundary layer behind the cold fronts.[35] Deep convection plays an important role in ventilat-
ing the central and southeastern United States in summer.The semipermanent anticyclone centered in the upper tro-posphere over the southern United States can circulate thisconvective outflow over the United States for several daysbefore eventual export to the Atlantic. Rapid ozone produc-tion (up to 10 ppb day�1) takes place in the circulatingoutflow. This production is driven in part by anthropogenicand lightning NOx and in part by HOx radicals producedfrom convectively lifted CH2O that originates from biogenicisoprene. It takes place near the transition between NOx-limited and NOx-saturated regimes for ozone production.We thus predict a large anthropogenic maximum in ozone(>80 ppbv) in the upper troposphere across the southernUnited States. Some evidence for this maximum is apparentin ozonesonde observations over Alabama.
[36] Acknowledgments. This work was performed in part at HarvardUniversity, with support from the Office of Global Programs of the NationalOceanic and Atmospheric Administration (NOAA), and at Jet PropulsionLaboratory, California Institute of Technology, under contract with theNational Aeronautics and Space Administration (NASA). Discussions withOwen Cooper, Andreas Stohl, Hongyu Liu, and Jennifer Logan were veryhelpful.
ReferencesArellano, A. F., Jr., P. S. Kasibhatla, L. Giglio, G. R. van der Werf, and J. T.Randerson (2004), Top-down estimates of global CO sources usingMOPITT measurements, Geophys. Res. Lett., 31, L01104, doi:10.1029/2003GL018609.
Balkanski, Y. J., D. J. Jacob, R. Arimoto, and M. A. Kritz (1992), Long-range transport of radon-222 over the North Pacific Ocean: Implicationsfor continental influence, J. Atmos. Chem., 14, 353–374.
Bell, G. D., and L. F. Bosart (1989), A 15-year climatology of northernhemisphere 500 mb closed cyclone and anticyclone centers, Mon.Weather Rev., 117, 2142–2164.
Bey, I., D. J. Jacob, R. M. Yantosca, J. A. Logan, B. D. Field, A. M. Fiore,Q. B. Li, H. Liu, L. J. Mickley, and M. G. Schultz (2001a), Globalmodeling of tropospheric chemistry with assimilated meteorology: Modeldescription and evaluation, J. Geophys. Res., 106, 23,073–23,095.
Bey, I., D. J. Jacob, J. A. Logan, and R. M. Yantosca (2001b), Asianchemical outflow to the Pacific: Origins, pathways, and budgets, J. Geo-phys. Res., 106, 23,097–23,113.
Browning, K. A., and G. A. Monk (1982), A simple model for the synopticanalysis of cold fronts, Q. J. R. Meteorol. Soc., 108, 435–452.
Browning, K. A., and N. M. Roberts (1994), Structure of a frontal cyclone,Q. J. R. Meteorol. Soc., 120, 1537–1557.
Carlson, T. N. (1980), Airflow through midlatitude cyclones and the commacloud pattern, Mon. Weather Rev., 108, 1498–1509.
Carlson, T. N. (1998), Mid-Latitude Weather Systems, Am. Meteorol. Soc.,Boston, Mass.
Chin, M., P. Ginoux, S. Kinne, O. Torres, B. Holben, B. N. Duncan, R. V.Martin, J. A. Logan, A. Higurashi, and T. Nakajima (2002), Troposphericaerosol optical thickness from the GOCART model and comparisons withsatellite and sunphotometer measurements, J. Atmos. Sci., 59, 461–483.
Chu, D. A., Y. J. Kaufman, C. Ichoku, L. A. Remer, D. Tanre, and B. N.Holben (2002), Validation of MODIS aerosol optical depth retrieval overland, Geophys. Res. Lett., 29(12), 8007, doi:10.1029/2001GL013205.
Chu, D. A., Y. J. Kaufman, G. Zibordi, J. D. Chern, J. Mao, C. Li, and B. N.Holben (2003), Global monitoring of air pollution over land from theEarth Observing System-Terra Moderate Resolution Imaging Spectrora-diometer (MODIS), J. Geophys. Res., 108(D21), 4661, doi:10.1029/2002JD003179.
Cooper, O. R., J. L. Moody, D. D. Parrish, M. Trainer, J. S. Hplloway, T. B.Ryerson, G. Hubler, F. C. Fehsenfeld, S. J. Oltmans, and M. J. Evans(2001), Trace gas signatures of the airstreams within North Atlanticcyclones: Case studies from the North Atlantic Regional Experiment(NARE’97) aircraft intensive, J. Geophys. Res., 106, 5437–5456.
Cooper, O. R., J. L. Moody, D. D. Parrish, M. Trainer, J. S. Holloway, T. B.Ryerson, G. Hubler, F. C. Fehsenfeld, S. J. Oltmans, and M. J. Evans
Figure 15. Vertical profiles of ozone concentrations atHuntsville, Alabama (86.6�W, 34.7�N) in July 2000. Thethin solid lines are five ozonesonde soundings made duringthe month (1, 8, 15, 22, and 29 July) by Newchurch et al.[2003]. The thick solid line shows the model monthly meanvalues.The thin dotted, dashed, and dash-dotted lines showthe simulated enhancements from North American anthro-pogenic, biogenic, and lightning emissions, respectively, asdetermined by difference with simulations where theseemissions are shut off. The thick long dashes line shows themodel monthly mean values from a simulation withlightning NOx emissions over North America increased bya factor of four.
D10301 LI ET AL.: NORTH AMERICAN POLLUTION OUTFLOW
16 of 18
D10301

(2002a), Trace gas composition of midlatitude cyclones over the westernNorth Atlantic Ocean: A conceptual model, J. Geophys. Res., 107(D7),4056, doi:10.1029/2001JD000901.
Cooper, O. R., J. L. Moody, D. D. Parrish, M. Trainer, J. S. Holloway,G. Hubler, F. C. Fehsenfeld, and A. Stohl (2002b), Trace gas compo-sition of midlatitude cyclones over the western North Atlantic Ocean:A seasonal comparison of O3 and CO, J. Geophys. Res., 107(D7), 4057,doi:10.1029/2001JD000902.
Deeter, M. N., et al. (2003), Operational carbon monoxide retrieval algo-rithm and selected results for the MOPITT instrument, J. Geophys. Res.,108(D14), 4399, doi:10.1029/2002JD003186.
Dickerson, R. R., et al. (1987), Thunderstorms - An important mechanismin the transport of air pollutants, Science, 235, 460–464.
Dickerson, R. R., B. Doddridge, P. Kelley, and K. Rhoads (1995), Largescale pollution of the atmosphere over the remote Atlantic Ocean:Evidence from Bermuda, J. Geophys. Res., 100, 8945–8952.
Duncan, B. N., R. V. Martin, A. C. Staudt, R. M. Yevich, and J. A. Logan(2003), Interannual and seasonal variability of biomass burning emissionsconstrained by satellite observations, J. Geophys. Res., 108(D2), 4100,doi:10.1029/2002JD002378.
Eckhardt, S., and A. Stohl (2004), A 15-year climatology of warm conveyorbelts, J. Climate., 17, 218–237.
Fromm, M. D., and R. Servranckx (2003), Transport of fire smoke abovethe tropopause by supercell convection, Geophys. Res. Lett., 30(10),1542, doi:10.1029/2002GL016820.
Galasyn, J. F., K. L. Tschudy, and B. J. Huebert (1987), Seasonal anddiurnal variability of nitric acid vapor and ionic aerosol species in theremote free troposphere at Mauna Loa, Hawaii, J. Geophys. Res., 92,3105–3113.
Ginoux, P., M. Chin, I. Tegen, J. M. Prospero, B. Holben, O. Dubovik, andS. Lin (2001), Sources and distributions of dust aerosols simulated withGOCART model, J. Geophys. Res., 106, 3805–3818.
Heald, C. L., et al. (2003), Asian outflow and trans-Pacific transport ofcarbon monoxide and ozone pollution: An integrated satellite, aircraft,and model perspective, J. Geophys. Res., 108(D24), 4804, doi:10.1029/2003JD003507.
Holben, B. N., et al. (1998), AERONET - A federated instrument networkand data archive for aerosol characterization, Remote Sens. Environ., 66,1–16.
Hudman, R. C., et al. (2004), Ozone production in transpacific Asian pollu-tion plumes and implications for ozone air quality in California, J. Geo-phys. Res., 109, D23S10, doi:10.1029/2004JD004974.
Intergovernmental Panel on Climate Change (IPCC) (2001), ClimateChange 2001: The Scientific Basis, edited by J. T. Houghton et al.,p. 944, Cambridge Univ. Press, New York.
Jacob, D. J., J. A. Logan, G. M. Gardner, R. M. Yevich, C. M. Spivakovsky,and S. C. Wofsy (1993), Factors regulating ozone over the United Statesand its export to the global atmosphere, J. Geophys. Res., 98, 14,817–14,826.
Jaegle, L., D. J. Jacob, W. H. Brune, and P. O. Wennberg (2001), Chemistryof HOx radicals in the upper troposphere, Atmos. Environ., 35, 469–489.
Kaufman, Y. J., D. Tanre, L. A. Remer, E. F. Vermote, A. Chu, and B. N.Holben (1997), Operational remote sensing of tropospheric aerosol overthe land from EOS-MODIS, J. Geophys. Res., 102, 17,051–17,067.
Lamarque, J.-F., et al. (2003), Identification of CO plumes from MOPITTdata: Application to the August 2000 Idaho-Montana forest fires, Geo-phys. Res. Lett., 30(13), 1688, doi:10.1029/2003GL017503.
Lee, Y. N., et al. (1998), Atmospheric chemistry and distribution of for-maldehyde and several multioxygenated carbonyl compounds during the1995 Nashville Middle Tennessee Ozone Study, J. Geophys. Res.,103(D17), 22,449–22,462.
Li, Q. B., et al. (2001), A tropospheric ozone maximum over the MiddleEast, Geophys. Res. Lett., 28, 3235–3238.
Li, Q. B., et al. (2002a), Transatlantic transport of pollution and its effectson surface ozone in Europe and North America, J. Geophys. Res.,107(D13), 4166, doi:10.1029/2001JD001422.
Li, Q. B., D. J. Jacob, T. D. Fairlie, H. Liu, R. M. Yantosca, and R. V.Martin (2002b), Stratospheric versus pollution influences on ozoneat Bermuda: Reconciling past analyses, J. Geophys. Res., 107(D22),4611, doi:10.1029/2002JD002138.
Li, Q. B., D. J. Jacob, R. M. Yantosca, J. W. Munger, and D. D. Parrish(2004), Export of NOy from the North American boundary layer: Recon-ciling aircraft observations and global model budgets, J. Geophys. Res.,109, D02313, doi:10.1029/2003JD004086.
Liu, H., D. J. Jacob, I. Bey, and R. M. Yantosca (2001), Constrains from210Pb and 7Be on wet deposition and transport in a global three-dimensional chemical tracer model driven by assimilated meteorolo-gical fields, J. Geophys. Res., 106, 12,109–12,128.
Liu, H., D. J. Jacob, I. Bey, R. M. Yantosca, and B. N. Duncan (2003),Transport pathways for Asian outflow over the Pacific: Interannual and
seasonal variations, J. Geophys. Res., 108(D20), 8786, doi:10.1029/2002JD003102.
Logan, J. A. (1989), Ozone in rural-areas of the United States, J. Geophys.Res., 94(D6), 8511–8532.
Maddox, R. A. (1980), Mesoscale convective complexes, Bull. Am.Meteorol. Soc., 61, 1374–1387.
Martin, R. V., et al. (2002), Interpretation of TOMS observations of tropicaltropospheric ozone with a global model and in situ observations,J. Geophys. Res., 107(D18), 4351, doi:10.1029/2001JD001480.
Martin, R. V., D. J. Jacob, R. M. Yantosca, M. Chin, and P. Ginoux (2003),Global and regional decreases in tropospheric oxidants from photochem-ical effects of aerosols, J. Geophys. Res., 108(D3), 4097, doi:10.1029/2002JD002622.
Merrill, J. T., and J. L. Moody (1996), Synoptic meteorology and transportduring the North Atlantic Regional Experiment (NARE) intensive: Over-view, J. Geophys. Res., 101, 28,903–28,921.
Moody, J. L., J. C. Davenport, J. T. Merrill, S. J. Oltmans, D. D. Parrish,J. S. Holloway, H. Levy II, G. L. Forbes, M. Trainer, and M. Buhr(1996), Meteorological mechanisms for transporting O3 over the westernNorth Atlantic Ocean: A case study for August 24–29, 1993, J. Geophys.Res., 101, 29,213–29,227.
Moxim, W. J. (1990), Simulated transport of NOy to Hawaii duringAugust—A synoptic study, J. Geophys. Res., 95, 5717–5729.
Muller, J.-F., and G. Brasseur (1999), Sources of upper tropospheric HOx:A three-dimensional study, J. Geophys. Res., 104, 1705–1715.
Nesbitt, S. W., R. Y. Zhang, and R. E. Orville (2000), Seasonal and globalNOx production by lightning estimated from the Optical TransientDetector (OTD), Tellus, Ser. B, 52, 1206–1215.
Newchurch, M. J., M. A. Ayoub, S. Oltmans, B. Johnson, and F. J.Schmidlin (2003), Vertical distribution of ozone at four sites in the UnitedStates, J. Geophys. Res., 108(D1), 4031, doi:10.1029/2002JD002059.
Orville, R. E., G. Huffines, J. Nielsen-Gammon, R. Y. Zhang, B. Ely,S. Steiger, S. Phillips, S. Allen, and W. Read (2001), Enhancementof cloud-to-ground lightning over Houston, Texas, Geophys. Res.Lett., 28, 2597–2600.
Palmer, P. I., D. J. Jacob, D. B. A. Jones, C. L. Heald, B. M. Yantosca,J. A. Logan, G. W. Sachse, and D. G. Streets (2003a), Inverting foremissions of carbon monoxide from Asia using aircraft observations overthe western Pacific, J. Geophys. Res., 108(D21), 8825, doi:10.1029/2002JD003176.
Palmer, P. I., D. J. Jacob, A. M. Fiore, R. V. Martin, K. Chance, and T. P.Kurosu (2003b), Mapping isoprene emissions over North America usingformaldehyde column observations from space, J. Geophys. Res.,108(D6), 4180, doi:10.1029/2002JD002153.
Park, R. J., D. J. Jacob, M. Chin, and R. V. Martin (2003), Sources ofcarbonaceous aerosols over the United States and implications for naturalvisibility, J. Geophys. Res., 108(D12), 4355, doi:10.1029/2002JD003190.
Park, R. J., D. J. Jacob, B. D. Field, R. M. Yantosca, and M. Chin (2004),Natural and transboundary pollution influences on sulfate-nitrate-ammo-nium aerosols in the United States: Implications for policy, J. Geophys.Res., 109, D15204, doi:10.1029/2003JD004473.
Parker, S. S., J. T. Hawes, S. J. Colucci, and B. P. Hayden (1989), Clima-tology of 500 mb cyclones and anticyclones, 1950–1985, Mon. WeatherRev., 117, 558–571.
Parrish, D. D., M. Trainer, D. Hereid, E. J. Williams, K. J. Olszyna, R. A.Harley, J. F. Meagher, and F. C. Fehsenfeld (2002), Decadal change incarbon monoxide to nigrogen oxide ratio in U.S. vehicular emissions,J. Geophys. Res., 107(D12), 4140, doi:10.1029/2001JD000720.
Pickering, K. E., R. R. Dickerson, G. J. Huffman, J. F. Boatman, andA. Schanot (1988), Trace gase transport in the vicinity of frontalconvective clouds, J. Geophys. Res., 93, 759–773.
Pickering, K. E., A. M. Thompson, R. R. Dickerson, W. T. Luke, D. P.McNamara, J. P. Greenberg, and P. R. Zimmerman (1990), Model calcu-lations of tropospheric ozone production potential following observedconvective events, J. Geophys. Res., 95, 14,049–14,062.
Pickering, K. E., A. M. Thompson, J. R. Scala, W.-K. Tao, R. R. Dickerson,and J. Simpson (1992), Free tropospheric ozone production followingentrainment of urban plumes into deep convection, J. Geophys. Res.,97, 17,985–18,000.
Price, C., and D. Rind (1992), A simple lightning parameterization forcalculating global lightning distributions, J. Geophys. Res., 97, 9919–9933.
Price, C., J. Penner, and M. Prather (1997), NOx from lightning: 1. Globaldistribution based on lightning physics, J. Geophys. Res., 102, 5929–5941.
Remer, L. A., et al. (2002), Validation of MODIS aerosol retrieval overocean, Geophys. Res. Lett., 29(12), 8008, doi:10.1029/2001GL013204.
Roehl, C. M., S. A. Nizkorodov, H. Zhang, G. A. Blake, and P. O.Wennberg (2002), Photodissociation of peroxynitric acid in the near-IR,J. Phys. Chem. A, 106(15), 3766–3772, doi:10.1021/jp013536v.
D10301 LI ET AL.: NORTH AMERICAN POLLUTION OUTFLOW
17 of 18
D10301
Salawitch, R. J., P. O. Wennberg, G. C. Toon, B. Sen, and J. F. Blavier(2002), Near IR photolysis of HO2NO2: Implications for HOx, Geophys.Res. Lett., 29(D16), 1762, doi:10.1029/2002GL015006.
Staudt, A. C., D. J. Jacob, J. A. Logan, D. Bachiochi, T. N. Krishnamurti,and G. W. Sachse (2001), Continental sources, transoceanic transport,and interhemispheric exchange of carbon monoxide over the Pacific,J. Geophys. Res., 106, 32,571–32,589.
Steiger, S. M., and R. E. Orville (2003), Cloud-to-ground lightning en-hancement over southern Louisiana, Geophys. Res. Lett., 30(19), 1975,doi:10.1029/2003GL017923.
Steiger, S. M., R. E. Orville, and G. Huffines (2002), Cloud-to-groundlightning characteristics over Houston, Texas: 1989–2000, J. Geophys.Res., 107(D11), 4117, doi:10.1029/2001JD001142.
Stohl, A. (2001), A 1-year Lagrangian ‘‘climatology’’ of airstreams in theNorthern Hemisphere troposphere and lowermost stratosphere, J. Geo-phys. Res., 106, 7263–7279.
Tanre, D., Y. J. Kaufman, M. Herman, and S. Mattoo (1997), Remotesensing of aerosol properties over oceans using the MODIS/EOS spectralradiances, J. Geophys. Res., 102, 16,971–16,988.
Thompson, A. M., K. E. Pickering, R. R. Dickerson, W. G. Ellis Jr., D. J.Jacob, J. R. Scala, W.-K. Tao, D. P. McNamara, and J. Simpson (1994),Convective transport over the central United States and its role in regionalCO and ozone budgets, J. Geophys. Res., 99, 18,703–18,711.
Tie, X. X., R. Y. Zhang, G. Brasseur, and W. F. Lei (2002), Global NOx
production by lightning, J. Atmos. Chem., 43(1), 61–74.United States Environmental Protection Agency (2000), National air qualityand emission trends, 1998, Washington, D. C.
Wang, Y., D. J. Jacob, and J. A. Logan (1998), Global simulation oftropospheric O3-NOx-hydrocarbon chemistry: 1. Model formulation,J. Geophys. Res., 103, 10,713–10,725.
Wang, Y. X., M. B. McElroy, D. J. Jacob, and R. M. Yantosca (2004), Anested grid formation for chemical transport over Asia: Applications toCO, J. Geophys. Res., 109, D22307, doi:10.1029/2004JD005237.
Whelpdale, D. M., T. B. Low, and R. J. Kolomeychuk (1984), Advectionclimatology for the east coast of North America, Atmos. Environ., 18,1311–1327.
Whittaker, K. M., and L. H. Horn (1984), Northern hemisphere extra-tropical cyclone activity for four mid-season months, J. Climatol., 4,297–310.
Wotawa, G., and M. Trainer (2000), The influence of Canadian forestfires on pollutant concentrations in the United States, Science, 288,324–328.
Zishka, K. M., and P. J. Smith (1980), The climatology of cyclones andanticyclones over North America and surrounding ocean environs forJanuary and July, 1950–1977, Mon. Weather Rev., 108, 387–401.
�����������������������M. Evans, School of the Environment, University of Leeds, Leeds LS2
0TJ, UK.C. L. Heald, R. Hudman, D. J. Jacob, R. Park, Y. Wang, and R. M.
Yantosca, Department of Earth and Planetary Sciences, Division ofEngineering and Applied Sciences, Harvard University, Cambridge, MA02138, USA.Q. Li, Jet Propulsion Laboratory, California Institute of Technology, 4800
Oak Grove Drive, M/S 183-501, Pasadena, CA 91109, USA. ([email protected])R. V. Martin, Department of Physics and Atmospheric Science,
Dalhousie University, Halifax, Nova Scotia B3H 3J5, Canada.
D10301 LI ET AL.: NORTH AMERICAN POLLUTION OUTFLOW
18 of 18
D10301


![Summertime influence of Asian pollution in the free ......summertime inflow and outflow of pollution over North America [Singh et al., this issue]. INTEX-A was part of the larger International](https://img.pdfslide.us/doc/110x75/60ae67dec3e6e52ff9393759/summertime-influence-of-asian-pollution-in-the-free-summertime-inflow-and.jpg)