Embed Size (px)
Citation preview
DeDe JonesSteven KloseWill KeelingGreg Kaase
Analyzing the Impact of COVID-19 on Texas High
Plains Agriculture
Focus
AssistanceAssistance
Farm Assistance Focus 2020-1May 2020
FARMFARM
Department of Agricultural Economics, Texas AgriLife Extension Service Texas A&M University System
farmassistance.tamu.edu
Texas High Plains producers face many new uncertainties due to the arrival of COVID-19. Significant supply chain disruptions, reductions in
consumer demand and decreases in travel have caused negative impacts on the agricultural industry. For example, efforts taken to stem the contagion decreased the amount of food consumed away from home, and restrictions on movement sharply reduced gasoline usage, and with it demand for grain ethanol. Elevated cases among livestock processing facilities have disrupted normal business practices and increased costs. In fact, the Texas High Plains region is considered a COVID-19 “hot spot” as many area processing plants are experiencing a reduced workforce and slowed production due to high numbers of positive cases. This study looks at farm level impacts of COVID-19 on six case study model operations created by Texas A&M AgriLife Extension risk management specialists in the Northern Texas Panhandle. For a broader discussion of COVID-19 impacts across Texas see the COVID-19 Impact publication by the Agricultural and Food Policy Center (AFPC).
Model Farm Overview
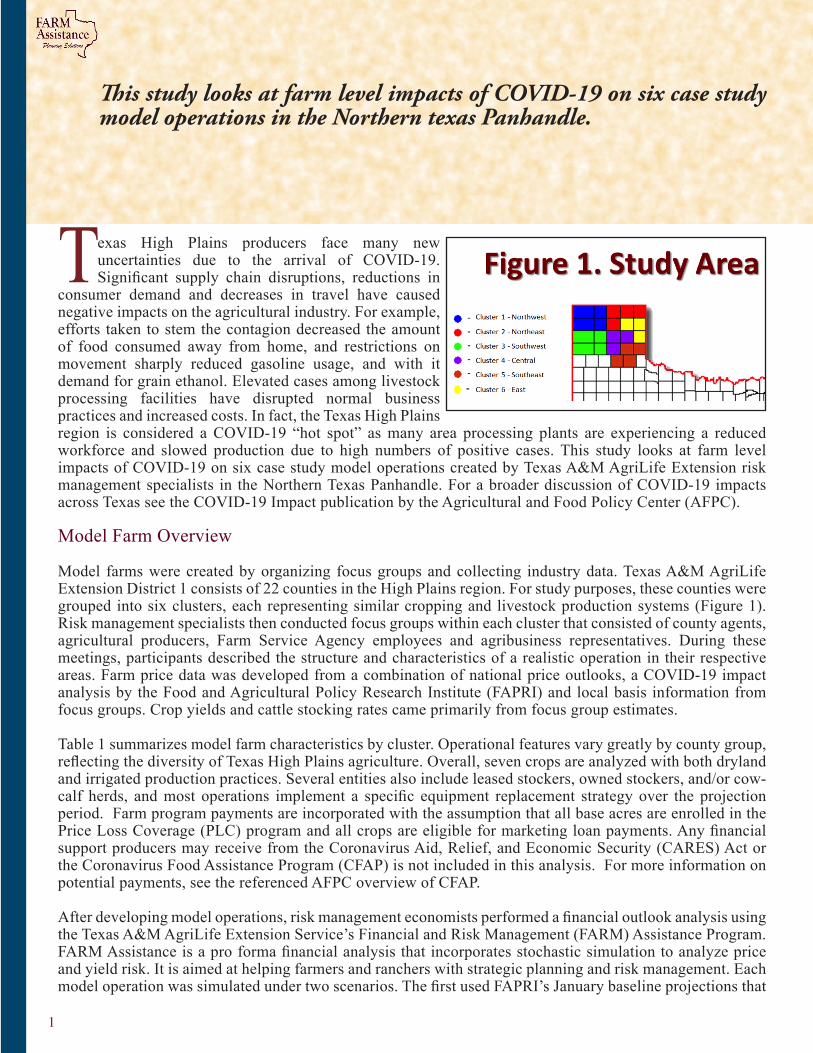
Model farms were created by organizing focus groups and collecting industry data. Texas A&M AgriLife Extension District 1 consists of 22 counties in the High Plains region. For study purposes, these counties were grouped into six clusters, each representing similar cropping and livestock production systems (Figure 1). Risk management specialists then conducted focus groups within each cluster that consisted of county agents, agricultural producers, Farm Service Agency employees and agribusiness representatives. During these meetings, participants described the structure and characteristics of a realistic operation in their respective areas. Farm price data was developed from a combination of national price outlooks, a COVID-19 impact analysis by the Food and Agricultural Policy Research Institute (FAPRI) and local basis information from focus groups. Crop yields and cattle stocking rates came primarily from focus group estimates.
Table 1 summarizes model farm characteristics by cluster. Operational features vary greatly by county group, reflecting the diversity of Texas High Plains agriculture. Overall, seven crops are analyzed with both dryland and irrigated production practices. Several entities also include leased stockers, owned stockers, and/or cow-calf herds, and most operations implement a specific equipment replacement strategy over the projection period. Farm program payments are incorporated with the assumption that all base acres are enrolled in the Price Loss Coverage (PLC) program and all crops are eligible for marketing loan payments. Any financial support producers may receive from the Coronavirus Aid, Relief, and Economic Security (CARES) Act or the Coronavirus Food Assistance Program (CFAP) is not included in this analysis. For more information on potential payments, see the referenced AFPC overview of CFAP.
After developing model operations, risk management economists performed a financial outlook analysis using the Texas A&M AgriLife Extension Service’s Financial and Risk Management (FARM) Assistance Program. FARM Assistance is a pro forma financial analysis that incorporates stochastic simulation to analyze price and yield risk. It is aimed at helping farmers and ranchers with strategic planning and risk management. Each model operation was simulated under two scenarios. The first used FAPRI’s January baseline projections that
This study looks at farm level impacts of COVID-19 on six case study model operations in the Northern texas Panhandle.
1
Analyzing the Impact of COVID-19 on Texas High Plains Agriculture
2
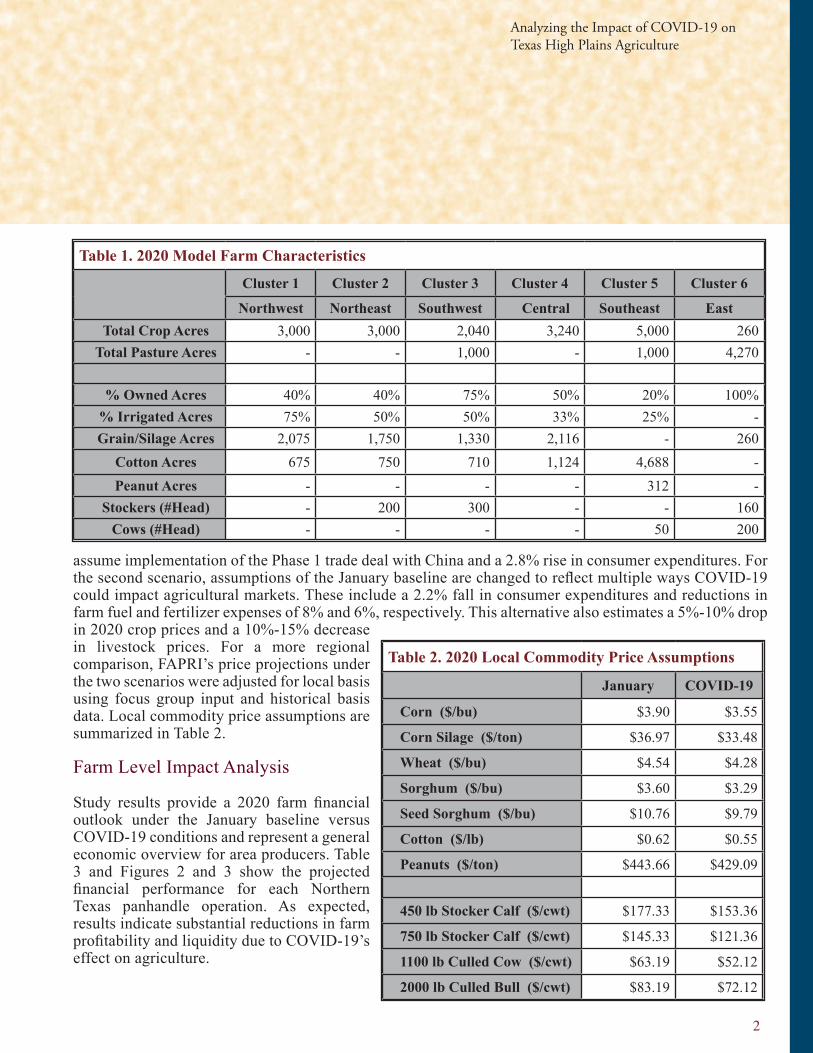
assume implementation of the Phase 1 trade deal with China and a 2.8% rise in consumer expenditures. For the second scenario, assumptions of the January baseline are changed to reflect multiple ways COVID-19 could impact agricultural markets. These include a 2.2% fall in consumer expenditures and reductions in farm fuel and fertilizer expenses of 8% and 6%, respectively. This alternative also estimates a 5%-10% drop in 2020 crop prices and a 10%-15% decrease in livestock prices. For a more regional comparison, FAPRI’s price projections under the two scenarios were adjusted for local basis using focus group input and historical basis data. Local commodity price assumptions are summarized in Table 2.
Farm Level Impact Analysis
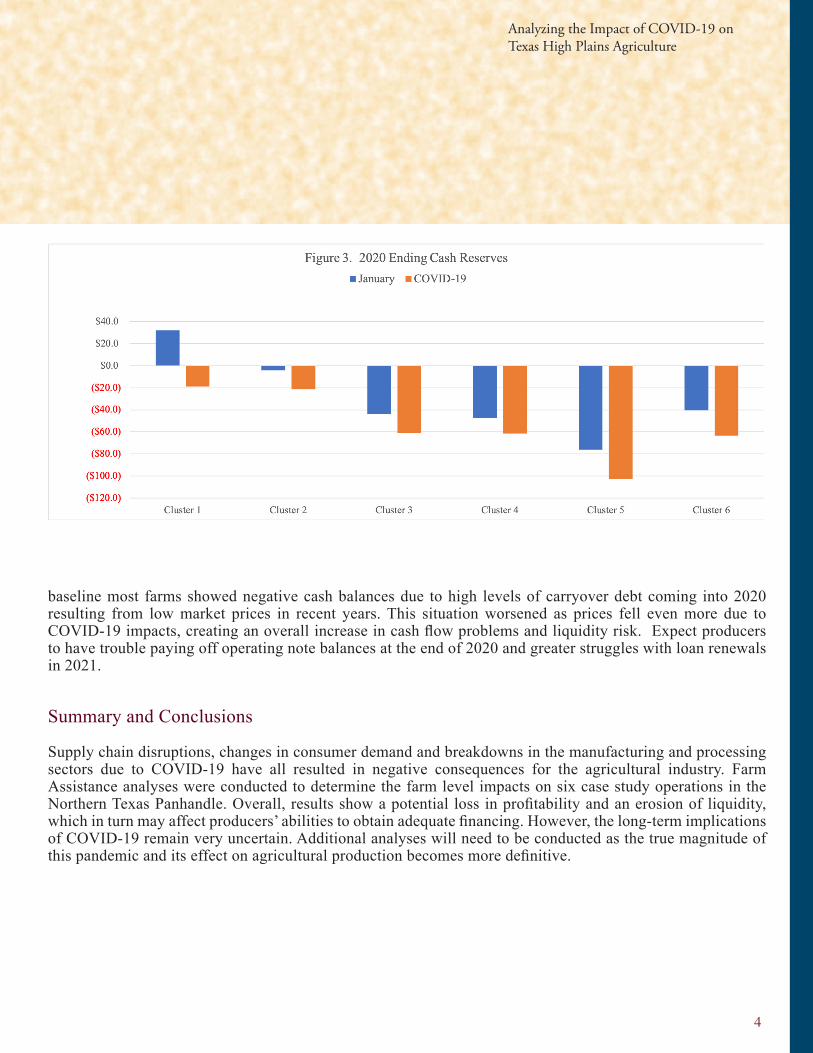
Study results provide a 2020 farm financial outlook under the January baseline versus COVID-19 conditions and represent a general economic overview for area producers. Table 3 and Figures 2 and 3 show the projected financial performance for each Northern Texas panhandle operation. As expected, results indicate substantial reductions in farm profitability and liquidity due to COVID-19’s effect on agriculture.
Table 1. 2020 Model Farm Characteristics
Cluster 1 Cluster 2 Cluster 3 Cluster 4 Cluster 5 Cluster 6
Northwest Northeast Southwest Central Southeast East Total Crop Acres 3,000 3,000 2,040 3,240 5,000 260
Total Pasture Acres - - 1,000 - 1,000 4,270
% Owned Acres 40% 40% 75% 50% 20% 100%% Irrigated Acres 75% 50% 50% 33% 25% -Grain/Silage Acres 2,075 1,750 1,330 2,116 - 260
Cotton Acres 675 750 710 1,124 4,688 -Peanut Acres - - - - 312 -
Stockers (#Head) - 200 300 - - 160Cows (#Head) - - - - 50 200
Table 2. 2020 Local Commodity Price Assumptions
January COVID-19
Corn ($/bu) $3.90 $3.55
Corn Silage ($/ton) $36.97 $33.48
Wheat ($/bu) $4.54 $4.28
Sorghum ($/bu) $3.60 $3.29
Seed Sorghum ($/bu) $10.76 $9.79
Cotton ($/lb) $0.62 $0.55
Peanuts ($/ton) $443.66 $429.09
450 lb Stocker Calf ($/cwt) $177.33 $153.36
750 lb Stocker Calf ($/cwt) $145.33 $121.36
1100 lb Culled Cow ($/cwt) $63.19 $52.12
2000 lb Culled Bull ($/cwt) $83.19 $72.12
While a few farm expenses are projected to fall in the COVID-19 scenario (primarily those influenced by reduced fuel costs), the major impact is lower commodity and livestock prices and reduced revenues. Farm program payments grow with these declines in crop prices, but even with higher government payments, agricultural profits will likely be hit hard in 2020. Much of the increase in 2020 payments come from an elevated likelihood of higher loan deficiency payments or marketing loan benefits in cotton. PLC payments received in 2020 are only marginally higher as they are based on 2019 crop marketing year prices. When the
economic impacts of COVID-19 began in March of 2020, the bulk of the 2019 crop was already sold, meaning the marketing year average price which triggers PLC was mostly established. The 2020 crop marketing year prices should trigger higher PLC payments, but those will not come until the fall of 2021. As a result, they will do little to alleviate the immediate cash flow problems producers could experience.
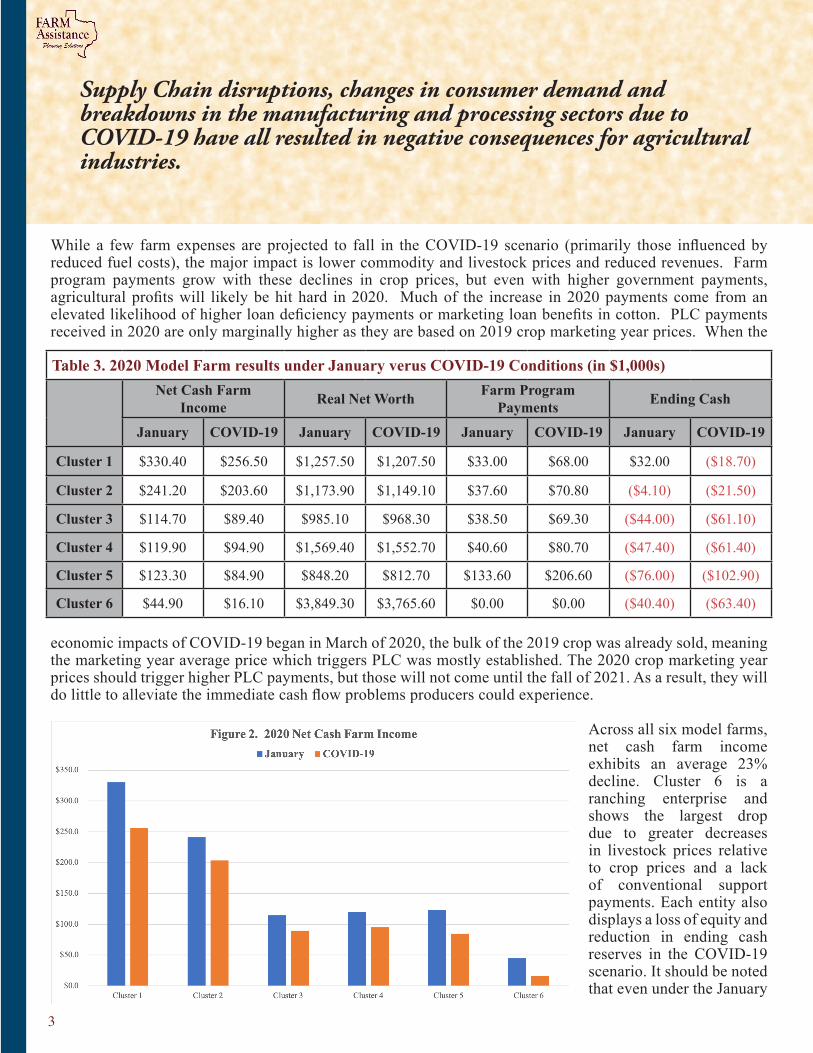
Across all six model farms, net cash farm income exhibits an average 23% decline. Cluster 6 is a ranching enterprise and shows the largest drop due to greater decreases in livestock prices relative to crop prices and a lack of conventional support payments. Each entity also displays a loss of equity and reduction in ending cash reserves in the COVID-19 scenario. It should be noted that even under the January
3
Table 3. 2020 Model Farm results under January verus COVID-19 Conditions (in $1,000s)Net Cash Farm
Income Real Net Worth Farm Program Payments Ending Cash
January COVID-19 January COVID-19 January COVID-19 January COVID-19
Cluster 1 $330.40 $256.50 $1,257.50 $1,207.50 $33.00 $68.00 $32.00 ($18.70)
Cluster 2 $241.20 $203.60 $1,173.90 $1,149.10 $37.60 $70.80 ($4.10) ($21.50)
Cluster 3 $114.70 $89.40 $985.10 $968.30 $38.50 $69.30 ($44.00) ($61.10)
Cluster 4 $119.90 $94.90 $1,569.40 $1,552.70 $40.60 $80.70 ($47.40) ($61.40)
Cluster 5 $123.30 $84.90 $848.20 $812.70 $133.60 $206.60 ($76.00) ($102.90)
Cluster 6 $44.90 $16.10 $3,849.30 $3,765.60 $0.00 $0.00 ($40.40) ($63.40)
Supply Chain disruptions, changes in consumer demand and breakdowns in the manufacturing and processing sectors due to COVID-19 have all resulted in negative consequences for agricultural industries.
Analyzing the Impact of COVID-19 on Texas High Plains Agriculture
4
baseline most farms showed negative cash balances due to high levels of carryover debt coming into 2020 resulting from low market prices in recent years. This situation worsened as prices fell even more due to COVID-19 impacts, creating an overall increase in cash flow problems and liquidity risk. Expect producers to have trouble paying off operating note balances at the end of 2020 and greater struggles with loan renewals in 2021.
Summary and Conclusions
Supply chain disruptions, changes in consumer demand and breakdowns in the manufacturing and processing sectors due to COVID-19 have all resulted in negative consequences for the agricultural industry. Farm Assistance analyses were conducted to determine the farm level impacts on six case study operations in the Northern Texas Panhandle. Overall, results show a potential loss in profitability and an erosion of liquidity, which in turn may affect producers’ abilities to obtain adequate financing. However, the long-term implications of COVID-19 remain very uncertain. Additional analyses will need to be conducted as the true magnitude of this pandemic and its effect on agricultural production becomes more definitive.
Additional analysis will need to be conducted as the magnitude of this pandemic and its effect on agricultural production become more definitive.
5
Produced by FARM Assistance, Texas A&M AgriLife Extension Service, Visit Texas AgriLife Extension Service at: http://texasagrilife.tamu.eduEducation programs conducted by The Texas AgriLife Extension Service serve people of all ages regardless of socioeconomic level, race, color, sex,
religion, handicap or national origin.
References
Panhandle Model Farms – 2018 Case Studies of Texas High Plains Agriculture. Texas A&M AgriLife Extension Service, Department of Agricultural Economics, Texas A&M University System, Farm Assistance Focus Series, No. 19-1, January 2019.https://farmassistance.tamu.edu/files/2019/01/2019-1.pdf
U.S. Agricultural Market Outlook, Trade Friction Baseline and a Phase 1 Scenario. Food & Agricultural Policy Research Institute, University of Missouri, FAPRI-MU Report #01-20, March 2020.https://www.fapri.missouri.edu/wp-content/uploads/2020/03/2020-U.S.-Agricultural-Market-Outlook.pdf
Early Estimates of the Impacts of COVID-19 on U.S. Agricultural Commodity Markets, Farm Income and Government Outlays. Food & Agricultural Policy Research Institute, University of Missouri, FAPRI-MU Report #02-20, April 2020.https://www.fapri.missouri.edu/wp-content/uploads/2020/04/FAPRI-Report-02-20.pdf
COVID-19 Impact on Texas Production Agriculture. Agricultural and Food Policy Center, Department of Agricultural Economics, Texas A&M University System, AFPC Research Report 20-01, April 2020.https://www.afpc.tamu.edu/research/publications/files/698/RR-20-01.pdf
Overview of the Coronavirus Food Assistance Program (CFAP). Agricultural and Food Policy Center, Department of Agricultural Economics, Texas A&M University System, AFPC Research Report 20-02, April 2020.https://www.afpc.tamu.edu/research/publications/files/699/RR-20-02.pdf


![[Clarinet_Institute] Klose 25 Daily Exercises for Sax](https://img.pdfslide.us/doc/110x75/563db94f550346aa9a9c14f6/clarinetinstitute-klose-25-daily-exercises-for-sax.jpg)


![[Clarinet_Institute] Klose 25 Daily Exercises for Sax.pdf](https://img.pdfslide.us/doc/110x75/545aa489b1af9f40378b59d2/clarinetinstitute-klose-25-daily-exercises-for-saxpdf.jpg)

