Embed Size (px)
Citation preview
0
ISSN: 2250-0359 Volume 3 Issue 4 2013
NORMATIVE NASALANCE VALUES ACROSS STIMULI AND GENDER
IN MALAYALAM SPEAKING INDIVIDUALS
*Gnanavel Kuppusamy *Gopisankar Ramaswamy *Pushpavathi Mariswamy
All India Institute of Speech and Hearing
Mysore
Introduction
Nasality is the common problem in subjects with repaired / unrepaired cleft palate, which
affects the speech intelligibility. Nasal resonance is not only seen in disordered speech, even normal
speech also consist some amount of nasality. Example: Among the Indian languages, Malayalam has
got more nasal resonance than any other languages. Nasality can be assessed by subjective as well as
objective methods. Perceptual judgment of nasality is done using various rating scales. These rating
scales have used different rating points ranging from five point scale to nine point scales. The judges
for these rating scales were from trained speech pathologists to clients themselves. Since this is a
subjective task, standard data / normative data cannot be established due to many disadvantages
associated with this method. Hence, standard objective methods are essential to assess the
velopharyngeal dysfunction and to provide guidelines for suitable rehabilitation method.
Nasometer is a non-invasive measurement technique which can be used outside medical
settings. Nasometer assesses the nasality of speech by measuring the acoustic output from both the
nasal and oral cavity by using two microphones, separated by an acoustic shield that rests on the upper
lip, which is mounted on a head set which gives appropriate position for the microphones. Additionally it
1
is a personal computer based device that can be easily installed and can measure the nasality at any
point of the sample. Extensive studies on the nasometer’s validity have generally shown high levels of
correspondence between listener judgments and measures made by device (3,7,9).In addition to research
directed to a direct clinical application of Nasometer measurements, there have been investigations into
factors that influence nasalance measures in normal speech. These studies have shown that
nasalance of normal speech is sensitive to phonetic composition of the speech stimulus 26, native
language1, age and gender 21. However, the findings are not universally consistent.
Since the Nasometer was introduced in 1986, several articles have appeared in the literature on
developing the normative data in various languages. These studies indicated that nasalance scores
vary across languages (1,12,18,21,22,23,25,27). In Indian context, Sunitha, Roopa Nagarajan and Prakash 21
conducted a study to establish the normative data in Tamil speaking individual. In the first phase, ten
meaningful sentences using the various sound classes in Tamil were developed. These were repeated
by 120 children (60 boys and 60 girls) in the age range of 5 to 15 years. The data was analyzed using
the Kay Nasometer (Model 6500) and the results revealed that girls showed higher nasalance value
than boys. The results showed the normative for oral stimuli (9-15%), nasal stimuli (58-62%), and
predominately oral stimuli (20-40%). The nasalance cut-off ranged between 13% and 17% across the
gender and age for Tamil language.
Jayakumar and Pushpavathi 21 studied nasalance values in 50 children (25 males, 25
females) in the age range of 5-10 (mean age 8.1years) years and 50 adults (25 males, 25 females) in
the age of 20-35 (mean age 26.1years) years. The subjects were asked to repeat eight oral sentences
and eight nasal sentences. The Nasometer II 6400 was used to for the data collection and analysis. The
results revealed that in adults, significant difference was evident across gender. In males, for nasal
sentences the nasalance value was 48.27 (8.74) and for oral sentences 8.77% (4.76). In females, for
nasal sentences the nasalance value was 58.22% (8.40) and for oral sentences 14.69% (5.86).No
significant differences were found across gender for children group. This difference was attributed to the
basic structural and functional differences between gender, children and adult
There is some controversy regarding gender differences in mean nasalance scores in normal
speakers. Mean nasalance score also vary across gender. Gender related differences in nasalance
value can possibly be related to basic structural and functional differences across gender. The
2
resonance of voice is influenced by the size, shape and surface of infraglottal and supraglottal
resonating structures and cavities. Previous studies found that female speakers have significantly
higher nasalance scores than male speaker on passage containing nasal consonants (7,11,20,25). Fletcher
7 reported higher nasal value for normal men on nasal sentences. But Hutchinson (1978) reported
higher nasal value for women on three reading passages.
Many studies reported that a significant difference was not evident in nasalance scores across
gender (22,23,24). Van Lierde et al.24 evaluated 33 children (15 girls and 18 boys) in Flemish language.
Three different types of stimuli were used. (Oral, oronasal and nasal text). They recorded children
producing sounds and the read three texts. They compared the nasal resonance data from the children
with those of 58 adults that have been obtained in a previous study. Results suggested that women
had higher scores than men during the production of the /u/ in the oro nasal text and the nasal text. But
it was not statistically significant. This may be due to the velar length, elevation which is greater for men
compare to women.
Sweeney et al. 22 evaluated 70 normal Irish children with age range of 4 years to 13 years.
Children repeated each of the 16 sentences individually. The sentences were presented in groups
according to consonant type (High pressure, low pressure and nasal consonant). Normative nasalance
scores were obtained for three groups of sentences. The group mean nasalance score for boys was
26% (SD 4.18), and the group means nasalance score for girls was 27% (SD of 4.12). There was no
significant difference in nasalance scores between males and female speakers.
The nasometry as an objective measure of perceived nasal acoustic energy involves
manipulating the speech sample used. Several speech samples and materials and reading materials
(Rainbow passage, zoo Research has shown that the zoo passage (devoid of nasal consonants) is
useful in identifying individuals with velopharyngeal dysfunction. Traditionally long passage such as zoo
passage was used to assess nasalance. This paragraph contains a variety of oral consonants
(plosives, fricatives, glides). The zoo passage has 83 syllables in length and presumably it is
sufficiently long to obtain valid and stable measures of nasalance.
Lewis, Watterson and Quint 14 compared the nasalance scores with nine different speech
stimuli with vowel content controlled. The subjects were 19 children with velopharyngeal dysfunction
and 19 normal children. The stimuli consisted of five sentences and four sustained vowels. One
3
sentence contained only high front vowel, one contained only high back vowel and so on. The result
showed that high vowels were associated with significantly higher nasalance scores than low vowels for
both sentence and sustained vowels. Difference was evident among front / back vowel contrasts.
These natural difference in oral and nasal sound intensity would some in the direction of increased
nasalance on high vowels would explain the findings. However, nasalance scores may be differed by
the vowel content of the speech stimulus.
Overall, selection of the speech sample to be used for Nasometer testing has been shown to
affect results. Sentence repetition is considered to be an effective way of collecting a speech sample in
children 2. In the evaluation of speakers with nasality and nasal airflow errors, Karnell 13 has
recommended the use of separate high-pressure consonant sentences and low-pressure consonant
sentences when obtaining nasalance scores. He stated that when nasal turbulence is present,
nasalance scores on high- pressure consonant sentences may be artificially high. The elevation of
nasalance scores on high-pressure consonant sentences may become apparent in subjects with nasal
emission, nasal turbulence, or both if separate nasalance scores are obtained for high-pressure
consonants and low-pressure consonant sentences. Sweeney et al. 22 reported that separate analysis of
the high-pressure and low-pressure category nasalance scores may inform the clinician’s differential
diagnosis regarding hypernasality and nasal airflow errors, but it was not well established.
Perceptual ratings of speech nasality are susceptible to problems that influence their reliability
for example rating scale used, clinical exposure of the judges on nasality, and the presence of other
speech characteristics that may mask the perception of nasality8. In individuals with velopharyngeal
inadequacy, accurate assessment of the disorder is critical. The above mentioned studies have shown
that nasalance of normal speech is sensitive to the phonetic composition of the speech stimuli, native
language, regional dialect age and gender. This makes the strong need for establishment of regional
norms as there are very few standardized normal nasalance scores for normal speakers in Indian
languages.
AIM OF THE STUDY
1) To study the effect of stimuli and gender differences on nasalance scores in Malayalam
speaking adult population.
4
2) To establish normative nasalance scores for adults speaking in Malayalam language using
Nasometer II 6400.
3) To compare normative scores across Nasal View and Nasometer II 6400.
METHOD
Participants
Sixty normal subjects (30 Males and 30 Females) in the age range of 18 to 25 years were
participated in the present study. Each subject was evaluated by an experienced speech pathologist to
check the oral structure and function. Normal speech and language ability were also evaluated
informally during five-minute conversation. Background information regarding medical history and
hearing ability was collected. Individuals with normal hearing, normal orofacial structure and function,
normal speech and language ability were considered for the study. All the participants were native
speakers of Malayalam language.
Stimuli:
Two sets of meaningful Malayalam words and sentences were prepared. One set consisted of
nasal sentences and nasal words, which had predominantly nasal consonants and the other set was
oral sentence and oral words, which predominantly consisted of oral consonants. Each category
consisted of 5 words and 5 sentences. An experienced speech language pathologist whose mother
tongue was Malayalam assessed the content validity of the stimuli.
Instrumentation:
The Nasometer II, (6400) a microcomputer based system developed by Fletcher7 and
manufactured by Kay Elemetrics (1982) was used to record the data. The Nasometer consists of head
set containing a sound separator with microphones on either side which detects oral and nasal
components of the speech which rests on the subject’s upper lip. The signal from each of the
microphones is filtered individually and digitized by customized electronic modules. The resulting signal
is a ratio of nasal: nasal plus oral acoustic energy in term of percentage (nasalance) multiplied by
hundred.
5
Nasalance = (Nasal / Nasal + Oral) 100
Procedure:
The Nasometer was setup in a suitable quiet recording room. The instrument was calibrated
prior to the experiment based on the instructions provided in the manual. The subjects were assessed
and recorded individually. After selecting the subjects, they were seated comfortably, and the
Nasometer headset was placed on the subject’s head. The position of the Nasometer head set was
adjusted and secured firmly in accordance with the manufacturer’s instructions. In particular the angle
of the metal sound bottle against the subjects face was checked throughout the recording to ensure that
it maintained its position. The subjects were instructed to repeat speech stimulus (words and
sentences) after the speech pathologist for a reliable output. At the end of each stimulus, an interval of
two seconds was provided, so that the instrument acquired the sentences with a separation, and it
allowed for subsequent identification of different stimuli for analysis.
Data Analysis:
The mean, maximum, minimum nasalance for each stimulus (10 words and 10 sentences) in
each category were calculated. Using the Nasometer statistical function, these scores were then
recorded in a separate sheet form suitable for subsequent statistical analysis using “SPSS” program
package version 18. Descriptive statistics, paired “t” test and Mixed ANOVA were used for analysis.
RESULTS
The present study aimed at establishing the normative values for Nasometer II (Model 6400)
in Malayalam language for adults. The data was analyzed using descriptive statistic, paired t test, and
Mixed ANOVA using SPSS software (version, 18.0) package.
a) Effect of Gender on Nasalance scores of Malayalam speaking Individuals
The normative mean nasalance values for adult Malayalam speaking individuals for words and
sentences across gender were depicted in Table 1. The mean values were lesser for words compared
to sentences. In words and sentences, the oral stimuli have lesser mean values compared to nasal
stimuli.
6
Gender
Mean and S.D for Nasalance scores for different stimuli in (%)
Oral words Nasal words Oral sentences Nasal sentences
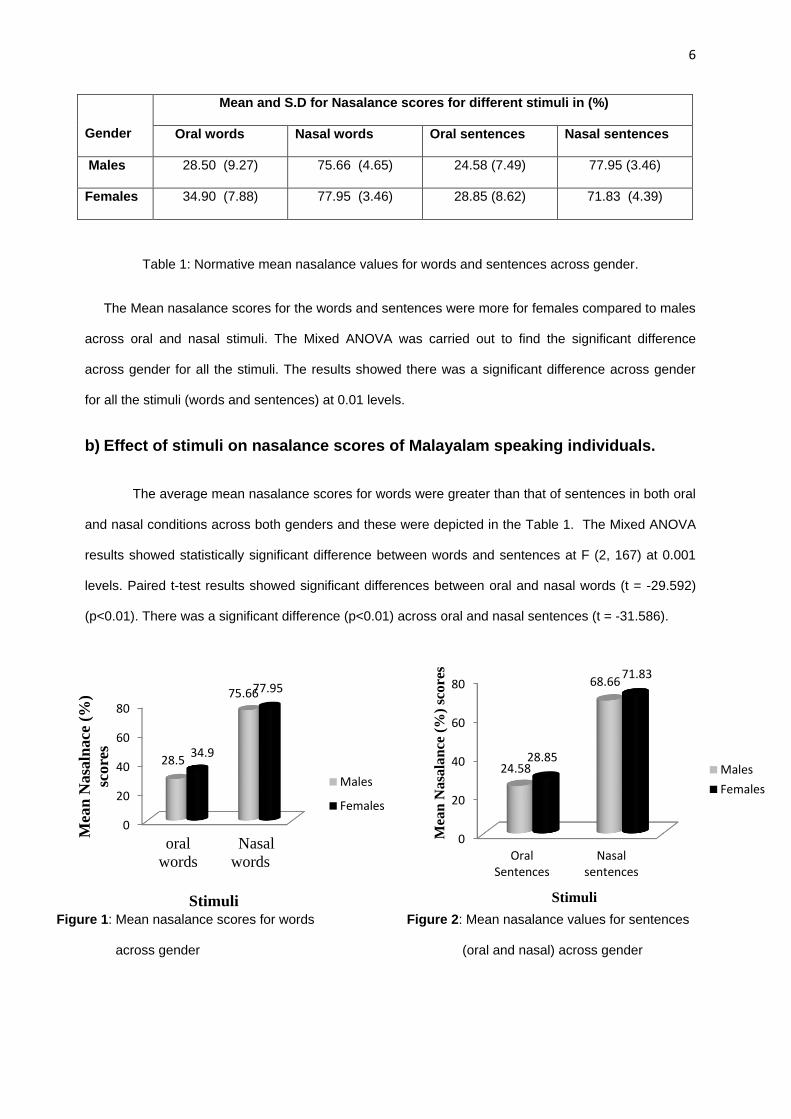
Males 28.50 (9.27) 75.66 (4.65) 24.58 (7.49) 77.95 (3.46)
Females 34.90 (7.88) 77.95 (3.46) 28.85 (8.62) 71.83 (4.39)
Table 1: Normative mean nasalance values for words and sentences across gender.
The Mean nasalance scores for the words and sentences were more for females compared to males
across oral and nasal stimuli. The Mixed ANOVA was carried out to find the significant difference
across gender for all the stimuli. The results showed there was a significant difference across gender
for all the stimuli (words and sentences) at 0.01 levels.
b) Effect of stimuli on nasalance scores of Malayalam speaking individuals.
The average mean nasalance scores for words were greater than that of sentences in both oral
and nasal conditions across both genders and these were depicted in the Table 1. The Mixed ANOVA
results showed statistically significant difference between words and sentences at F (2, 167) at 0.001
levels. Paired t-test results showed significant differences between oral and nasal words (t = -29.592)
(p<0.01). There was a significant difference (p<0.01) across oral and nasal sentences (t = -31.586).
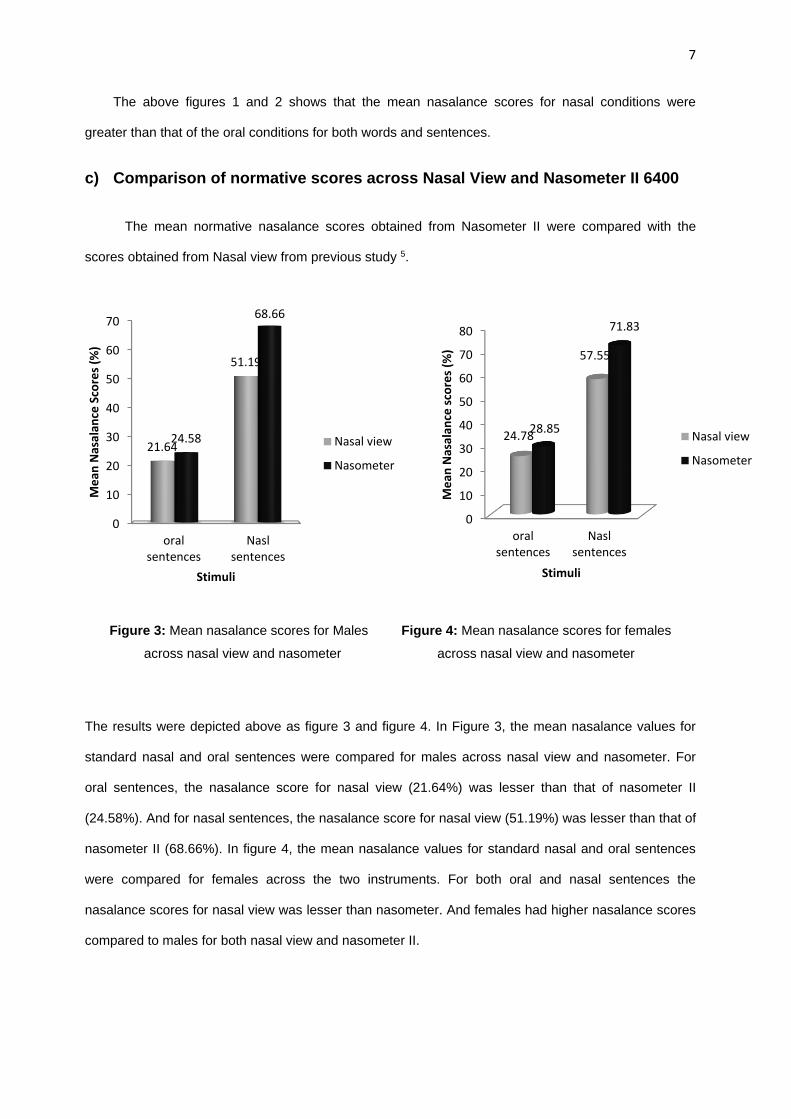
Figure 1: Mean nasalance scores for words Figure 2: Mean nasalance values for sentences
across gender (oral and nasal) across gender
0
20
40
60
80
oral
words
Nasal
words
28.5
75.66
34.9
77.95
Mea
n N
asa
lnace
(%
)
score
s
Stimuli
Males
Females
0
20
40
60
80
OralSentences
Nasalsentences
24.58
68.66
28.85
71.83
Mea
n N
asa
lan
ce (
%)
score
s
Stimuli
Males
Females
7
The above figures 1 and 2 shows that the mean nasalance scores for nasal conditions were
greater than that of the oral conditions for both words and sentences.
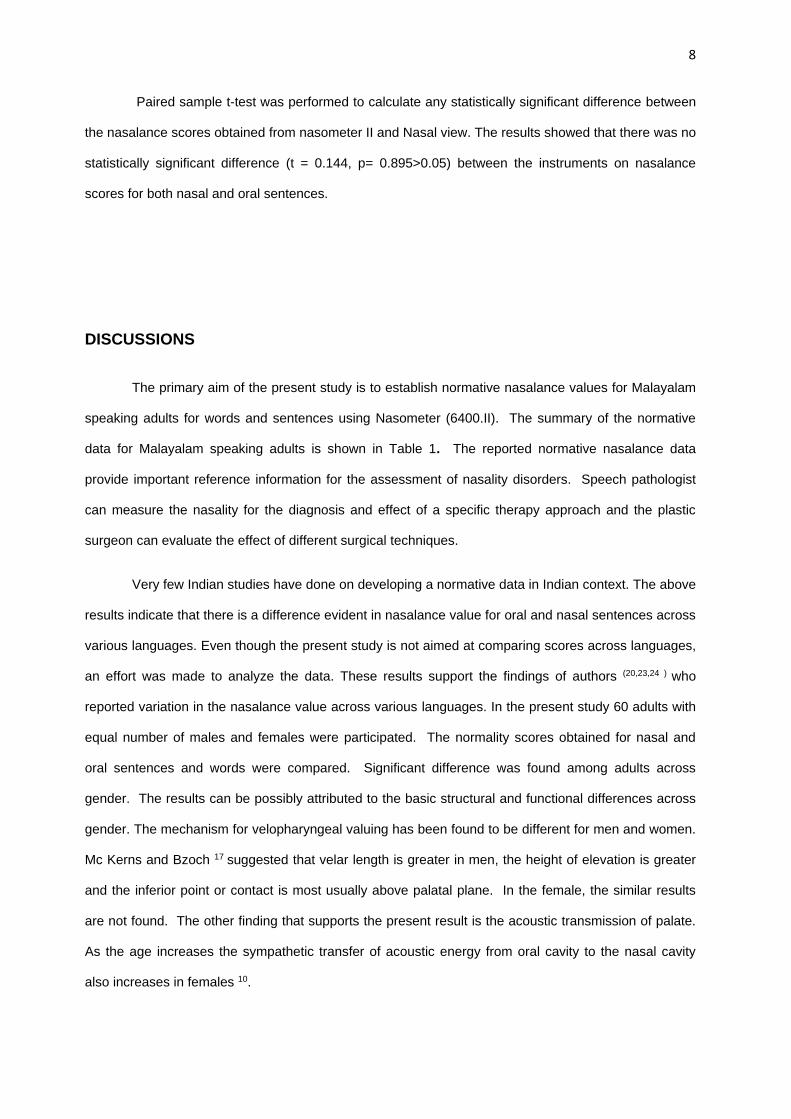
c) Comparison of normative scores across Nasal View and Nasometer II 6400
The mean normative nasalance scores obtained from Nasometer II were compared with the
scores obtained from Nasal view from previous study 5.
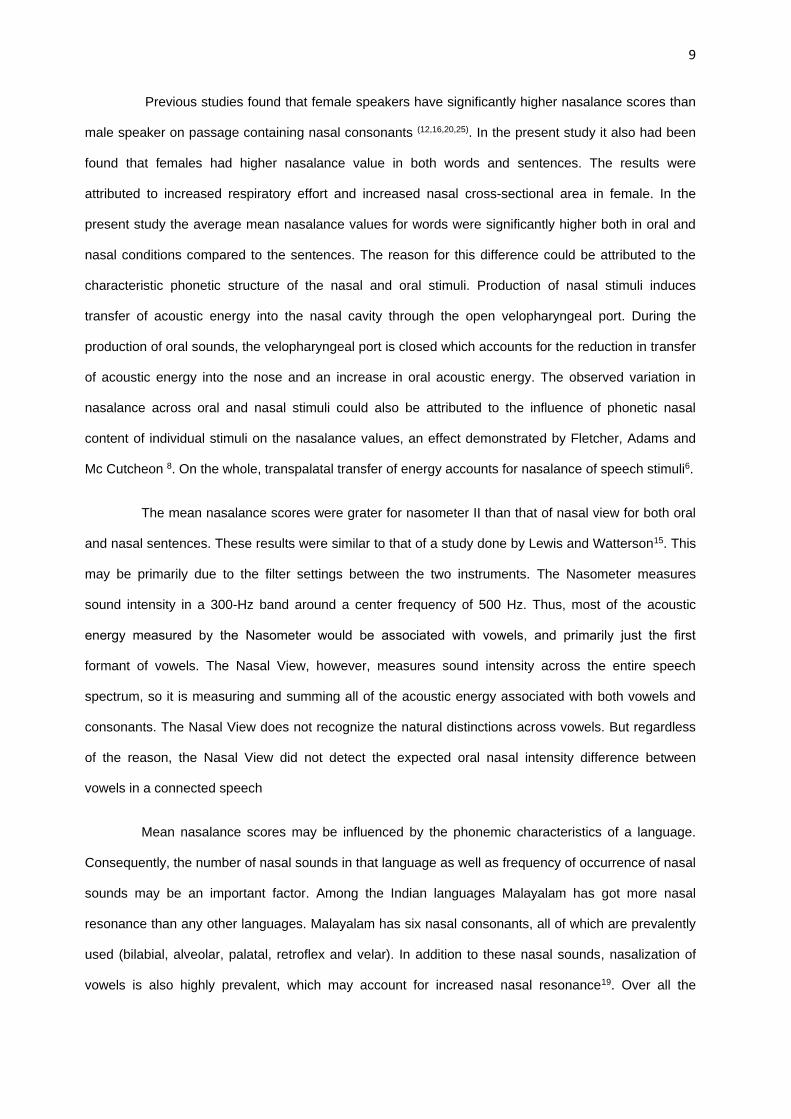
Figure 3: Mean nasalance scores for Males Figure 4: Mean nasalance scores for females
across nasal view and nasometer across nasal view and nasometer
The results were depicted above as figure 3 and figure 4. In Figure 3, the mean nasalance values for
standard nasal and oral sentences were compared for males across nasal view and nasometer. For
oral sentences, the nasalance score for nasal view (21.64%) was lesser than that of nasometer II
(24.58%). And for nasal sentences, the nasalance score for nasal view (51.19%) was lesser than that of
nasometer II (68.66%). In figure 4, the mean nasalance values for standard nasal and oral sentences
were compared for females across the two instruments. For both oral and nasal sentences the
nasalance scores for nasal view was lesser than nasometer. And females had higher nasalance scores
compared to males for both nasal view and nasometer II.
0
10
20
30
40
50
60
70
80
oralsentences
Naslsentences
24.78
57.55
28.85
71.83
Me
an N
asal
ance
sco
res
(%)
Stimuli
Nasal view
Nasometer
0
10
20
30
40
50
60
70
oralsentences
Naslsentences
21.64
51.19
24.58
68.66
Me
an N
asal
ance
Sco
res
(%)
Stimuli
Nasal view
Nasometer
8
Paired sample t-test was performed to calculate any statistically significant difference between
the nasalance scores obtained from nasometer II and Nasal view. The results showed that there was no
statistically significant difference (t = 0.144, p= 0.895>0.05) between the instruments on nasalance
scores for both nasal and oral sentences.
DISCUSSIONS
The primary aim of the present study is to establish normative nasalance values for Malayalam
speaking adults for words and sentences using Nasometer (6400.II). The summary of the normative
data for Malayalam speaking adults is shown in Table 1. The reported normative nasalance data
provide important reference information for the assessment of nasality disorders. Speech pathologist
can measure the nasality for the diagnosis and effect of a specific therapy approach and the plastic
surgeon can evaluate the effect of different surgical techniques.
Very few Indian studies have done on developing a normative data in Indian context. The above
results indicate that there is a difference evident in nasalance value for oral and nasal sentences across
various languages. Even though the present study is not aimed at comparing scores across languages,
an effort was made to analyze the data. These results support the findings of authors (20,23,24 ) who
reported variation in the nasalance value across various languages. In the present study 60 adults with
equal number of males and females were participated. The normality scores obtained for nasal and
oral sentences and words were compared. Significant difference was found among adults across
gender. The results can be possibly attributed to the basic structural and functional differences across
gender. The mechanism for velopharyngeal valuing has been found to be different for men and women.
Mc Kerns and Bzoch 17 suggested that velar length is greater in men, the height of elevation is greater
and the inferior point or contact is most usually above palatal plane. In the female, the similar results
are not found. The other finding that supports the present result is the acoustic transmission of palate.
As the age increases the sympathetic transfer of acoustic energy from oral cavity to the nasal cavity
also increases in females 10.
9
Previous studies found that female speakers have significantly higher nasalance scores than
male speaker on passage containing nasal consonants (12,16,20,25). In the present study it also had been
found that females had higher nasalance value in both words and sentences. The results were
attributed to increased respiratory effort and increased nasal cross-sectional area in female. In the
present study the average mean nasalance values for words were significantly higher both in oral and
nasal conditions compared to the sentences. The reason for this difference could be attributed to the
characteristic phonetic structure of the nasal and oral stimuli. Production of nasal stimuli induces
transfer of acoustic energy into the nasal cavity through the open velopharyngeal port. During the
production of oral sounds, the velopharyngeal port is closed which accounts for the reduction in transfer
of acoustic energy into the nose and an increase in oral acoustic energy. The observed variation in
nasalance across oral and nasal stimuli could also be attributed to the influence of phonetic nasal
content of individual stimuli on the nasalance values, an effect demonstrated by Fletcher, Adams and
Mc Cutcheon 8. On the whole, transpalatal transfer of energy accounts for nasalance of speech stimuli6.
The mean nasalance scores were grater for nasometer II than that of nasal view for both oral
and nasal sentences. These results were similar to that of a study done by Lewis and Watterson15. This
may be primarily due to the filter settings between the two instruments. The Nasometer measures
sound intensity in a 300-Hz band around a center frequency of 500 Hz. Thus, most of the acoustic
energy measured by the Nasometer would be associated with vowels, and primarily just the first
formant of vowels. The Nasal View, however, measures sound intensity across the entire speech
spectrum, so it is measuring and summing all of the acoustic energy associated with both vowels and
consonants. The Nasal View does not recognize the natural distinctions across vowels. But regardless
of the reason, the Nasal View did not detect the expected oral nasal intensity difference between
vowels in a connected speech
Mean nasalance scores may be influenced by the phonemic characteristics of a language.
Consequently, the number of nasal sounds in that language as well as frequency of occurrence of nasal
sounds may be an important factor. Among the Indian languages Malayalam has got more nasal
resonance than any other languages. Malayalam has six nasal consonants, all of which are prevalently
used (bilabial, alveolar, palatal, retroflex and velar). In addition to these nasal sounds, nasalization of
vowels is also highly prevalent, which may account for increased nasal resonance19. Over all the
10
present study adds to the body of evidence that there are stimuli and gender differences in nasalance
scores. Clinically the normative data reported in the present study may help identifying children with
resonance disorders. It may also be used to monitor the success of the rehabilitation techniques such
as speech therapy and surgery.
CONCLUSIONS
The present study aimed to study the stimuli and gender effects on mean nasalance scores of
normal Malayalam speaking individuals. Results revealed significant difference between two different
stimuli and gender. The females showed significantly higher mean nasalance scores than males for all
the stimuli. Overall this study adds to the body of evidence that there are gender differences in
nasalance values. Also, this study supports the existing literature on normative data in various
languages and helps to quantify the hypernasality in clinical population.
AKNOWLEDGEMENTS
The authors would like to thank Dr.S.R.Savithri, Director, All India Institute of Speech and
Hearing, Mysore for permitting us to carry out this study. Also we would like to thank the subjects who
participated in this study. We thank Dr. Vasanthalakshmi M.S, Lecturer in bio statistics for her timely
help and valuable guidance for the Statistical analysis. Also we would like to thank the subjects and
judges who participated in this study.
REFERENCES
1. Anderson, RT. Nasometric values for normal Spanish speaking females: a preliminary report.
Cleft Palate Craniofacial Journal 1996; 33: 333–336.
2. Antanio, LL & Scherer, NJ. The evaluation of speech disorder associated with clefting. In R.J.
Shprintzen &J.Bardach (Eds.), Cleft palate management: A Multidisplinary approach, St.Louis,
Mosby, 1995.
3. Dalston, RM & Warren, DW. Comparison of Tonar II, pressure -flow, and listener judgments of
hypemasality in the assessment of velopharyngeal function. Cleft palate craniofacial Journal
1986; 23:108-115.
4. Dalston, RM & Seaver, EJ.Nasometric and phoyotransductive measurements of reaction time
among the normal adult speakers. Cleft Palate Craniofacial Journal 1990, 27, 61-67.
5. Devi, TR & Pushpavathi, M Normative nasalance value in Malayalam language. Student
research at AIISH, Mysore, Volume VII: 2009: 67-82.
11
6. Emily, L & David JZ. Estimation of transpalatal nasalance during production of voiced stop
consonants by non cleft speakers using an oral-nasal mask. Cleft Palate Craniofacial Journal
2006; 43(6):691- 701.
7. Fletcher, SG. Diagnosing speech disorders from Cleft Palate. New York: Grune and Stratton,
1978.
8. Fletcher, SG, Adams, LE, & McCutcheon, MJ. Cleft palate speech assessment through oral-
nasal acoustic measures. In: Bzoch, K.R, (Ed.). Communicative Disorders Related to Cleft Lip
and Palate. Boston: Little Brown 1989:246–257.
9. Hardin, MA, Van Demark, DR, Morris, HL, & Payne, MM. Correspondence between nasalance
scores and listener judgments of hypernasality. Cleft Palate Craniofacial Journal 1992; 29: 349-
351.
10. Holit, JD, Watson, PJ, Hixon, KE, McMahon, P, &Johnson, CL. Age and velopharyngeal
function during speech production. Journal of Speech and Hearing Research 1994; 37:295-302.
11. Hutchinson, JM, Robinson, L, & Nerbonne, MA. Pattern of Nasalance in a sample of normal
gerontologic subjects. Journal of communication disorders 1978, 11,469-481.
12. Jayakumar, T. & Pushpavathi .M. Normative scores for nasometer in Kannada. Student
research at AIISH, Mysore, Volume III, 2005: 44-61.
13. Karnell, MP. Discrimination of hypernasality and turbulent nasal air flow. Cleft Palate
Craniofacial Journal 1995, 32:145-148.
14. Lewis, KE, Watterson, T. & Quint, T. The effect of vowels on nasalance values. Cleft Palate-
Craniofacial Journal 2000; 37 (6): 584-89.
15. Lewis, KE, & Watterson, T. Comparison of nasalance scores obtained from the Nasometer and
the Nasal View. Cleft Palate Craniofacial Journal 2003; 40: 40–45.
16. Mahesh, SM, & Pushpavathi, M. Nasalance value for Rainbow passage: Normative value for
non- native speakers. Journal of All India Institute of Speech and Hearing 2008; 27: 22-28.
17. McKerns, D, & Bzoch,KR. Variations in velopharyngeal valving: The factor of sex. Cleft Palate
Journal 1970; 7: 652-62.
18. Nandurkar, A. Nasalance measures in Marathi consonant-vowel-consonant syllables with
pressure consonants produced by children with and without cleft lip and palate. The Cleft
palate-Craniofacial Journal 2002; 39(1): 59-65.
19. Ramakrishna, BS, Nair, KK, Chiplunkar, VN, Atal, BS, Ramachandra, V, &Subramanian, R.
Some Statistics of Indian Languages. In: Some Aspects of the Relative Efficiencies of Indian
Languages, Catholic Press, Ranchi, India, 1962: 12-17.
20. Seaver, EJ, Dalston, RM, Leeper, HA, & Adams, L. A study of nasometric values for normal
nasal resonance. Journal of Speech and Hearing Research 1991; 34: 715–721.
21. Sunitha, Roopa, N., &Prakash, B. Proceedings of 4th Annual congress of Indian Society of Cleft
lip, Palate & Craniofacial Anomalies (Abstract). Hyderabad, India, 1994.
22. Sweeney, T, Sell, D, & O’Regan, M. Nasalance scores for normal speaking Irish children. Cleft
palate craniofacial Journal 2004; 41(2): 168-174.
12
23. Van Doorn, J, &Purcell, A. Nasalance level in speech of normal Australian children. Cleft palate
craniofacial Journal 1998; 35:287-292.
24. Van Lierde, KM, Wuyts, FL, Bodt, MD, & Cauwenberge, P. Age related pattern of nasal
resonance in normal Flemish children and young adults. Scandinavian Journal of Plastic
Reconstructive Surgery2003; 37:344-350.
25. Van Lierde, KM., Wuyts, FL, De Bodt, M, & Van Cauwenberge, P. Normative value for normal
nasal resonance in the speech of young Flemish adults. Cleft Palate Craniofacial Journal 2001;
38: 112-118.
26. Watterson, T, Hinton, J, & McFarlane, S. Novel stimuli for obtaining nasalance measures from
young children. Cleft Palate Craniofacial Journal 1996; 33: 67–73.
27. Whitehill, TL Nasalance measures in Cantonese-speaking women. Cleft Palate Craniofacial
Journal 2001; 38: 119–125.