Embed Size (px)
Citation preview
Seediscussions,stats,andauthorprofilesforthispublicationat:https://www.researchgate.net/publication/283903140
Normativedataforhandgripstrengthandkeypinchstrength,stratifiedbyageandgenderforamulti-ethnicAsianpopulation
ARTICLEinSINGAPOREMEDICALJOURNAL·NOVEMBER2015
ImpactFactor:0.6·DOI:10.11622/smedj.2015164
READS
33
6AUTHORS,INCLUDING:
Hui-TingGoh
TexasWoman'sUniversity
27PUBLICATIONS62CITATIONS
SEEPROFILE
ShahrulBahyahKamaruzzaman
UniversityofMalaya
44PUBLICATIONS267CITATIONS
SEEPROFILE
AiVyrnChin
UniversityofMalaya
32PUBLICATIONS416CITATIONS
SEEPROFILE
MawPinTan
UniversityofMalaya
87PUBLICATIONS335CITATIONS
SEEPROFILE
Allin-textreferencesunderlinedinbluearelinkedtopublicationsonResearchGate,
lettingyouaccessandreadthemimmediately.
Availablefrom:MawPinTan
Retrievedon:09April2016
SMJ Singapore Medical Journal
Normative data for hand grip strength and key pinch strength,
stratified by age and gender for a multi-ethnic Asian population
Ngee Wei Lam1, MD, MMED, Hui Ting Goh2, PT, PhD, Shahrul Bahyah Kamaruzzaman3,4,
MRCP, PhD, Ai-Vyrn Chin3,4, MRCP, MD, Philip Jun Hua Poi3,4, MRCP, Maw Pin Tan3,4,
MRCP, MD
1Department of Medicine, 2Department of Rehabilitation Medicine, 3Division of Geriatric
Medicine, Department of Medicine, 4Ageing and Age-Associated Disorders Research Group,
Faculty of Medicine, University of Malaya, Malaysia
Correspondence: Dr Tan Maw Pin, Associate Professor, Division of Geriatric Medicine,
Department of Medicine, Faculty of Medicine, University of Malaya, 50603 Kuala Lumpur,
Malaysia. [email protected]
Singapore Med J 2015, 1–21
doi: 10.11622/smedj.2015164
Published ahead of print: 13 November 2015
Online version can be found at
https://sma.org.sg/publications/index.aspx?ID=220
ONLINE FIRST PUBLICATION
Online first papers have undergone full scientific review and copyediting, but have not been
typeset or proofread. To cite this article, use the DOIs number provided. Mandatory typesetting
and proofreading will commence with regular print and online publication of the online first
papers of the SMJ.
Page 1 of 21
ABSTRACT
Introduction: Hand strength is a good indicator of physical fitness and frailty among the
elderly. However, there are no published hand strength references for Malaysians aged > 65
years. This study aimed to establish normative data for hand grip strength (HGS) and key
pinch strength (KPS) for Malaysians aged ≥ 60 years, and to explore the relationship between
hand strength and physical ability.
Methods: Healthy participants aged ≥ 60 years with no neurological conditions were
recruited from rural and urban locations in Malaysia. HGS and KPS were measured using
hand grip and key pinch dynamometers. Basic demographic data, anthropometric measures,
modified Barthel indices and results of the Functional Reach Test (FRT), Timed Up and Go
(TUG) test and Jebsen Taylor Hand Function Test (JTHFT) were recorded.
Results: 362 subjects aged 60–93 years were recruited. The men were significantly stronger
than the women in both HGS and KPS (p < 0.001). The hand strength of the study cohort was
significantly lower than that of elderly Western populations. Significant correlations were
observed between hand strength, and residential area (p < 0.001), FRT (r = 0.236, p = 0.028),
TUG (r = −0.227, p = 0.009) and JTHFT (r = −0.927, p < 0.001).
Conclusion: Reference ranges for HGS and KPS for rural and urban elderly Malaysian
subpopulations were established. These will aid the use of hand strength as a screening tool
for frailty among elderly persons in Malaysia. Future studies to determine the modifiable
factors for poor hand strength are required.
Keywords: aged, frailty, functional impairment, hand strength
Page 2 of 21
INTRODUCTION
The older population is more susceptible to disease and physical deconditioning following
acute illness, with subsequent increased risk of prolonged hospital stay, immobility,
dependency and institutionalisation.(1) The susceptibility of the older population to negative
insults is dependent on their level of frailty.(2) With appropriate strategies, the ageing process
and degree of frailty in older adults are modifiable, allowing these individuals to live longer
without severe disability.(3) Hand grip strength (HGS) is a well-established health indicator
for frailty and risk of disability among the elderly; it allows early risk identification and
intervention.(4) HGS is also a predictor of negative health outcomes, including mortality and
hospital discharge outcome.(5-7) Gale et al reported that each standard deviation increase in
HGS was associated with a significant reduction in the relative risk of death from all causes,
including cardiovascular disease and male cancer.(5) A pilot study conducted on a cohort of
older inpatients in a geriatric ward in Malaysia revealed that after adjustment for gender, age
and height, the HGS of the patients was negatively associated with the length of hospital
stay.(8) HGS may therefore have a role as a prognostic indicator for acute hospital episodes
and the potential for a wider range of applications.(9)
As HGS measurement is simple, noninvasive and of low cost, it may also be used to
help determine appropriate interventions, measure response to therapy and manage healthcare
resources. Since the publication of the first normative study for HGS in 1971, which lacked
procedural standardisation,(10) numerous normative studies have been performed over the last
few decades in different countries and populations.(11-18) The reported HGS norms in different
populations varied significantly, suggesting that a universal HGS norm does not exist.
However, the findings of the aforementioned studies consistently demonstrated that HGS is
significantly influenced by age, gender and body size. In addition, the individuals’ nutritional
status, lifestyle and occupation may also affect HGS.(19) As previously published normative
Page 3 of 21
data on HGS for older adults have predominantly been collected in Western populations, this
data is unlikely to be applicable to our Southeast Asian population, which is made up of
persons who are of smaller stature and have different genetics, lifestyles and occupations.
HGS normative data for Malaysians was published by Kamarul et al in 2006.(20) In
that study, Kamarul et al reported that the overall HGS of the Malaysian population was 1.5
times lower than that of Western populations.(20) However, that study excluded individuals
over the age of 65 years. To date, and to the best of our knowledge, there are no standardised,
normative values of HGS for Malaysians aged 60 years and above. Thus, the primary purpose
of the present study was to establish normative values of HGS and key pinch strength (KPS)
for the older Malaysian population. The secondary aim of the present study was to evaluate
the association between HGS and measures of physical ability.
METHODS
Individuals aged 60 years and above were recruited from the urban area of Klang Valley,
Selangor, Malaysia, and the rural town of Bahau, Negeri Sembilan, Malaysia. Participants
were: (a) individuals who were recruited via word of mouth and/or media advertising; or (b)
visitors to the inpatient and outpatient departments of University Malaya Medical Centre,
Kuala Lumpur, Malaysia, or persons attending community based healthcare screening
programmes, who were approached by our research staff. The exclusion criteria were: (a)
acute illness; (b) hospitalisation within the past month; (c) history of upper limb injury or
deformity with motor impairment; (d) neurological disorders involving the hand (e.g. stroke,
Parkinsonism and neurodegenerative disorders); or (e) a modified Barthel Index score < 90.
The study protocol was reviewed and approved by the University of Malaya Medical
Centre’s Medical Ethics Committee.
Page 4 of 21
Basic demographic information and a brief medical history were recorded for each of
the participants. Functional status was assessed using the modified Barthel Index. Healthy
volunteers who attended a clinic visit were additionally measured for their performance on
the Jebsen Taylor Hand Function Test (JTHFT), Functional Reach Test (FRT), and Timed Up
and Go (TUG) test. These tests were not administered for the participants recruited from
community health screening programmes due to time and resource limitations.
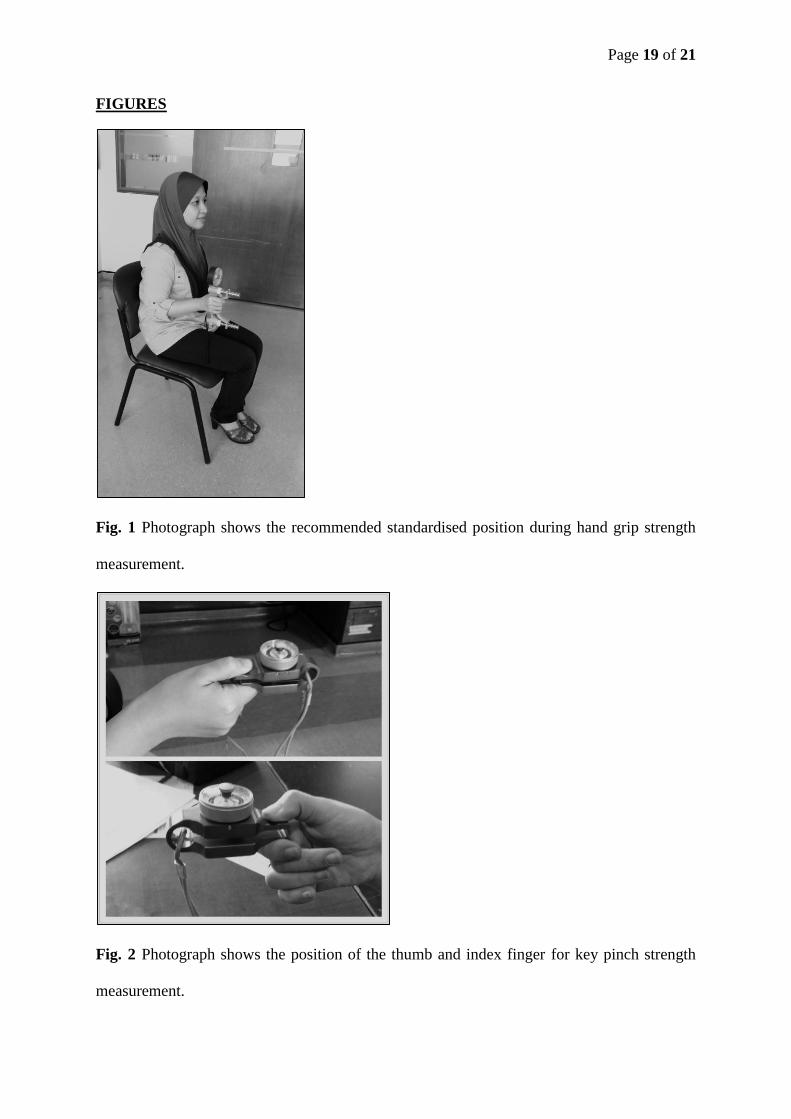
In the present study, the Jamar hydraulic hand dynamometer was used for HGS
measurement, while the Baseline® pinch gauge was used for KPS measurement. The
dynamometers were calibrated prior to the first measurement. Participants were seated on a
standard height chair without armrests, and positioned as per the American Society of Hand
Therapist’s recommendation.(21) Each participant was seated with his/her shoulder adducted
and neutrally rotated, his/her elbow flexed at 90o, his/her forearm in a neutral position, and
his/her wrist between 0° and 30° dorsiflexion and between 0o and 15o ulnar deviation.(21,22)
The grip handle of the dynamometer was adjusted based on the participant’s hand size, such
that an optimal grip position was obtained (Fig. 1). The test was performed with standardised
verbal instructions (i.e. “one, two, three, squeeze… harder… harder…”) and the participants
were asked to use the non-dominant hand first, followed by the dominant hand. Three
measurements of HGS were taken for each hand, with a 10–20-second rest between the
measurements to avoid fatigue. The mean value of all three measurements was calculated. A
similar procedure was performed for the KPS measurement. For measurement of the KPS,
the Baseline® pinch gauge was placed between the thumb and the lateral aspect of the index
finger (Fig. 2). As the Baseline® pinch gauge used in the present study malfunctioned
towards the end of the data collection phase, this resulted in fewer data collected on the KPS
(246, instead of 362).
Page 5 of 21
Hand function was measured using the JTHFT, which consists of seven subtests to
assess fine motor, non-weighted and weighted hand functions with activities such as writing,
card turning, picking up small common objects and placing them in a container, stacking
checkers, simulated feeding, and moving light and heavy objects. All subtests were
performed with standardised verbal instructions, starting with the non-dominant hand and
followed by the dominant hand.(23) Duration (in seconds) required to complete each subtest
was used to quantify the function; the maximum time allocated per subtest is 120 seconds.
The sum of the duration required for all the seven subtests was computed to yield the total
score. Lower scores indicated greater levels of hand function. Static balance was measured
using the FRT,(24) which measures the maximum distance an individual can reach forward
while standing in a fixed position. Walking ability and dynamic balance were assessed using
the TUG test.(25)
All collected data was analysed using IBM SPSS Statistics version 21.0 (IBM Corp,
Armonk, NY, USA). Categorical variables were presented as frequency (percentage).
Continuous variables were initially evaluated using histogram plots and the Komolgorov-
Sminov test to determine normal distributions. Variables that were normally distributed were
presented as mean ± standard deviation. The variables that were not normally distributed
were presented as median (interquartile range). The hand strength (i.e. HGS and KPS) results
were first presented according to age groups and gender, in means ± standard deviations and
95% confidence intervals (to represent normal ranges). These values were then descriptively
compared with international reference norms. The independent t-test was used to compare
hand strength between males and females, and urban and suburban/rural participants. The
analysis of variance test was used to compare the hand strength among the age groups and
among the different ethnicities. The JTHFT score was transformed into a normally distributed
variable by calculating the inversed JTHFT (i.e. 1/JTHFT). The correlations between hand
Page 6 of 21
strength with age, 1/JTHFT, FRT and TUG were assessed using the Pearson’s correlation
test. A p-value < 0.05 was considered statistically significant.
RESULTS
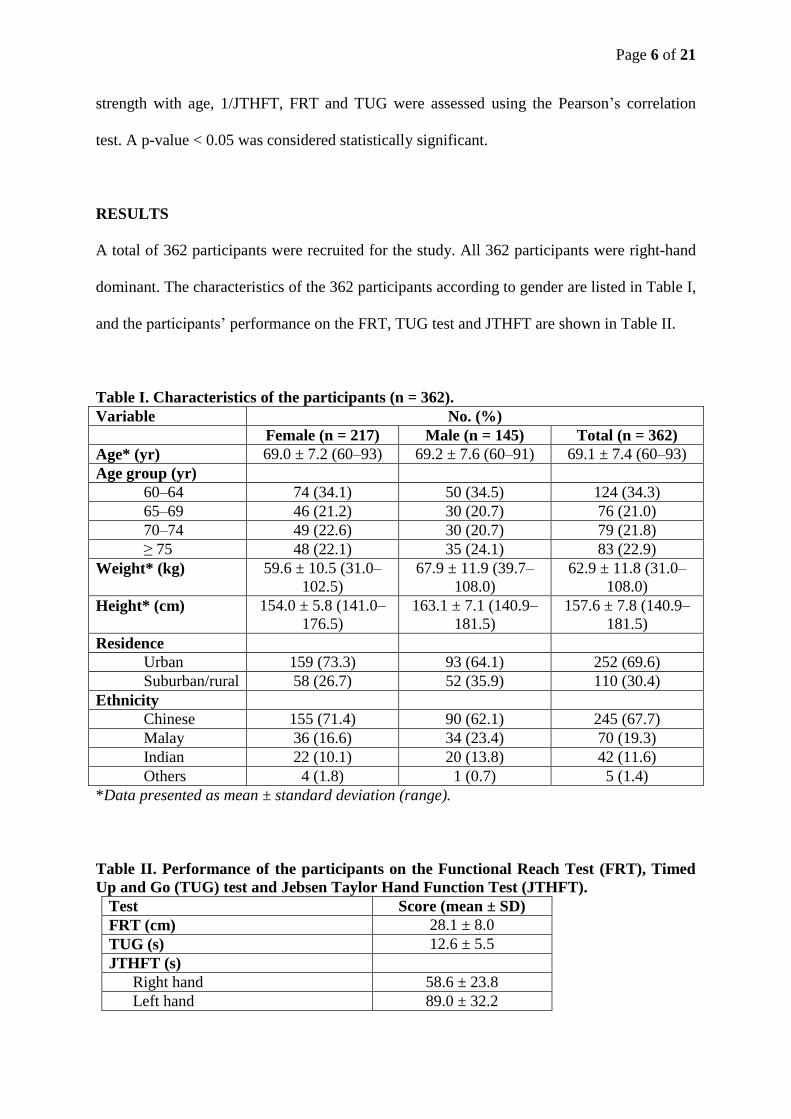
A total of 362 participants were recruited for the study. All 362 participants were right-hand
dominant. The characteristics of the 362 participants according to gender are listed in Table I,
and the participants’ performance on the FRT, TUG test and JTHFT are shown in Table II.
Table I. Characteristics of the participants (n = 362).
Variable No. (%)
Female (n = 217) Male (n = 145) Total (n = 362)
Age* (yr) 69.0 ± 7.2 (60–93) 69.2 ± 7.6 (60–91) 69.1 ± 7.4 (60–93)
Age group (yr)
60–64 74 (34.1) 50 (34.5) 124 (34.3)
65–69 46 (21.2) 30 (20.7) 76 (21.0)
70–74 49 (22.6) 30 (20.7) 79 (21.8)
≥ 75 48 (22.1) 35 (24.1) 83 (22.9)
Weight* (kg) 59.6 ± 10.5 (31.0–
102.5)
67.9 ± 11.9 (39.7–
108.0)
62.9 ± 11.8 (31.0–
108.0)
Height* (cm) 154.0 ± 5.8 (141.0–
176.5)
163.1 ± 7.1 (140.9–
181.5)
157.6 ± 7.8 (140.9–
181.5)
Residence
Urban 159 (73.3) 93 (64.1) 252 (69.6)
Suburban/rural 58 (26.7) 52 (35.9) 110 (30.4)
Ethnicity
Chinese 155 (71.4) 90 (62.1) 245 (67.7)
Malay 36 (16.6) 34 (23.4) 70 (19.3)
Indian 22 (10.1) 20 (13.8) 42 (11.6)
Others 4 (1.8) 1 (0.7) 5 (1.4)
*Data presented as mean ± standard deviation (range).
Table II. Performance of the participants on the Functional Reach Test (FRT), Timed
Up and Go (TUG) test and Jebsen Taylor Hand Function Test (JTHFT).
Test Score (mean ± SD)
FRT (cm) 28.1 ± 8.0
TUG (s) 12.6 ± 5.5
JTHFT (s)
Right hand 58.6 ± 23.8
Left hand 89.0 ± 32.2
Page 7 of 21
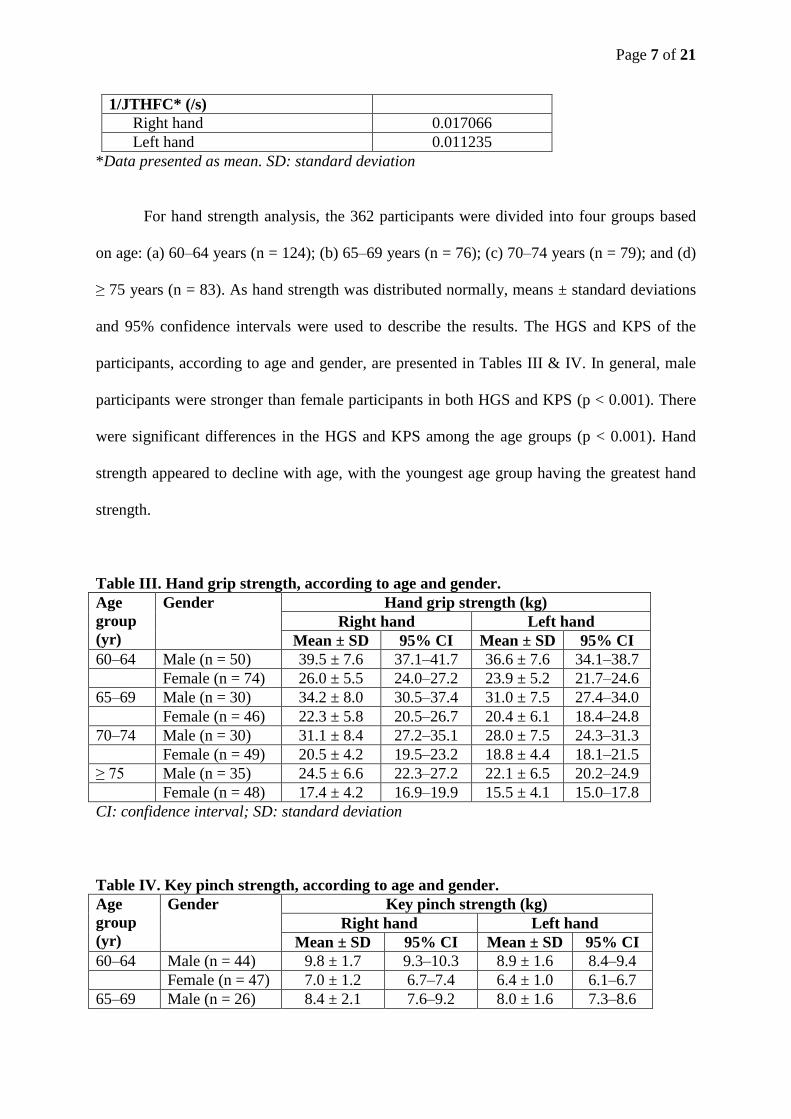
1/JTHFC* (/s)
Right hand 0.017066
Left hand 0.011235
*Data presented as mean. SD: standard deviation
For hand strength analysis, the 362 participants were divided into four groups based
on age: (a) 60–64 years (n = 124); (b) 65–69 years (n = 76); (c) 70–74 years (n = 79); and (d)
≥ 75 years (n = 83). As hand strength was distributed normally, means ± standard deviations
and 95% confidence intervals were used to describe the results. The HGS and KPS of the
participants, according to age and gender, are presented in Tables III & IV. In general, male
participants were stronger than female participants in both HGS and KPS (p < 0.001). There
were significant differences in the HGS and KPS among the age groups (p < 0.001). Hand
strength appeared to decline with age, with the youngest age group having the greatest hand
strength.
Table III. Hand grip strength, according to age and gender.
Age
group
(yr)
Gender Hand grip strength (kg)
Right hand Left hand
Mean ± SD 95% CI Mean ± SD 95% CI
60–64 Male (n = 50) 39.5 ± 7.6 37.1–41.7 36.6 ± 7.6 34.1–38.7
Female (n = 74) 26.0 ± 5.5 24.0–27.2 23.9 ± 5.2 21.7–24.6
65–69 Male (n = 30) 34.2 ± 8.0 30.5–37.4 31.0 ± 7.5 27.4–34.0
Female (n = 46) 22.3 ± 5.8 20.5–26.7 20.4 ± 6.1 18.4–24.8
70–74 Male (n = 30) 31.1 ± 8.4 27.2–35.1 28.0 ± 7.5 24.3–31.3
Female (n = 49) 20.5 ± 4.2 19.5–23.2 18.8 ± 4.4 18.1–21.5
≥ 75 Male (n = 35) 24.5 ± 6.6 22.3–27.2 22.1 ± 6.5 20.2–24.9
Female (n = 48) 17.4 ± 4.2 16.9–19.9 15.5 ± 4.1 15.0–17.8
CI: confidence interval; SD: standard deviation
Table IV. Key pinch strength, according to age and gender.
Age
group
(yr)
Gender Key pinch strength (kg)
Right hand Left hand
Mean ± SD 95% CI Mean ± SD 95% CI
60–64 Male (n = 44) 9.8 ± 1.7 9.3–10.3 8.9 ± 1.6 8.4–9.4
Female (n = 47) 7.0 ± 1.2 6.7–7.4 6.4 ± 1.0 6.1–6.7
65–69 Male (n = 26) 8.4 ± 2.1 7.6–9.2 8.0 ± 1.6 7.3–8.6
Page 8 of 21
Female (n = 22) 6.9 ± 1.4 6.3–7.5 6.5 ± 1.3 5.9–7.1
70–74 Male (n = 21) 8.6 ± 2.2 7.6–9.6 7.8 ± 1.9 7.0–8.7
Female (n = 26) 6.2 ± 1.5 5.6–6.9 5.9 ± 1.6 5.2–6.5
≥ 75 Male (n = 26) 7.5 ± 1.6 6.8–8.1 6.9 ± 1.6 6.2–7.5
Female (n = 34) 5.7 ± 1.2 5.2–6.1 5.3 ± 1.1 4.9–5.7
CI: confidence interval; SD: standard deviation
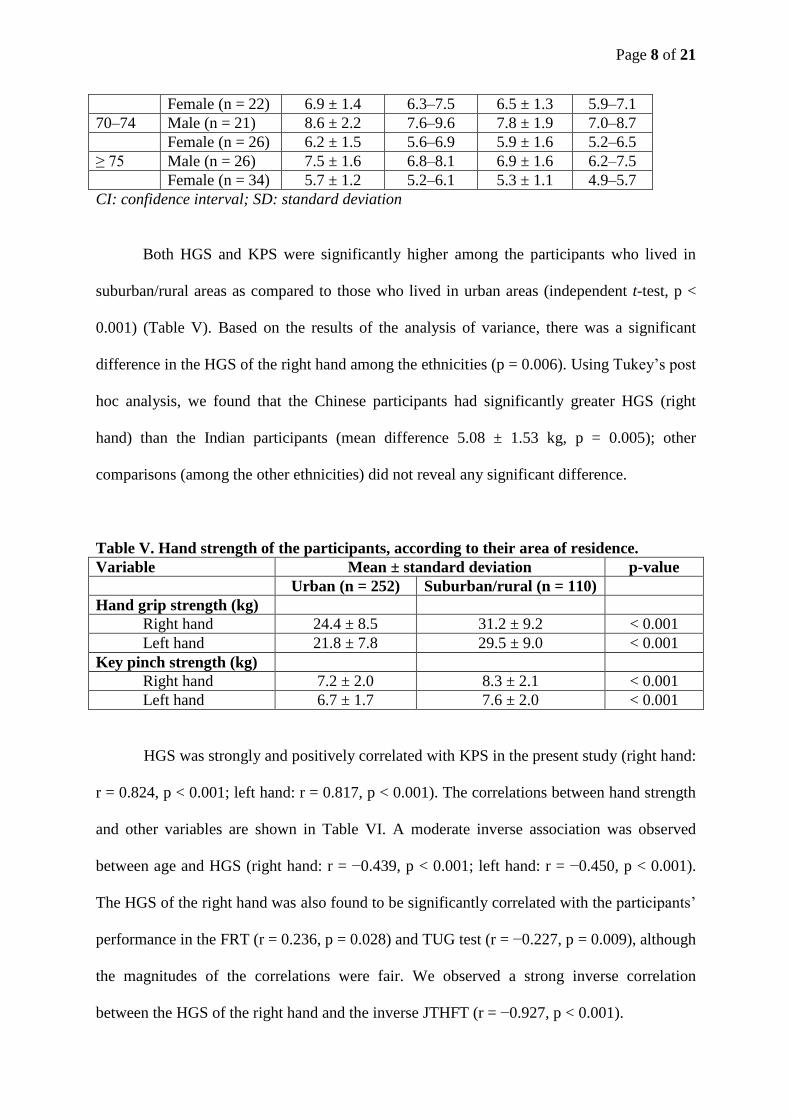
Both HGS and KPS were significantly higher among the participants who lived in
suburban/rural areas as compared to those who lived in urban areas (independent t-test, p <
0.001) (Table V). Based on the results of the analysis of variance, there was a significant
difference in the HGS of the right hand among the ethnicities (p = 0.006). Using Tukey’s post
hoc analysis, we found that the Chinese participants had significantly greater HGS (right
hand) than the Indian participants (mean difference 5.08 ± 1.53 kg, p = 0.005); other
comparisons (among the other ethnicities) did not reveal any significant difference.
Table V. Hand strength of the participants, according to their area of residence.
Variable Mean ± standard deviation p-value
Urban (n = 252) Suburban/rural (n = 110)
Hand grip strength (kg)
Right hand 24.4 ± 8.5 31.2 ± 9.2 < 0.001
Left hand 21.8 ± 7.8 29.5 ± 9.0 < 0.001
Key pinch strength (kg)
Right hand 7.2 ± 2.0 8.3 ± 2.1 < 0.001
Left hand 6.7 ± 1.7 7.6 ± 2.0 < 0.001
HGS was strongly and positively correlated with KPS in the present study (right hand:
r = 0.824, p < 0.001; left hand: r = 0.817, p < 0.001). The correlations between hand strength
and other variables are shown in Table VI. A moderate inverse association was observed
between age and HGS (right hand: r = −0.439, p < 0.001; left hand: r = −0.450, p < 0.001).
The HGS of the right hand was also found to be significantly correlated with the participants’
performance in the FRT (r = 0.236, p = 0.028) and TUG test (r = −0.227, p = 0.009), although
the magnitudes of the correlations were fair. We observed a strong inverse correlation
between the HGS of the right hand and the inverse JTHFT (r = −0.927, p < 0.001).
Page 9 of 21
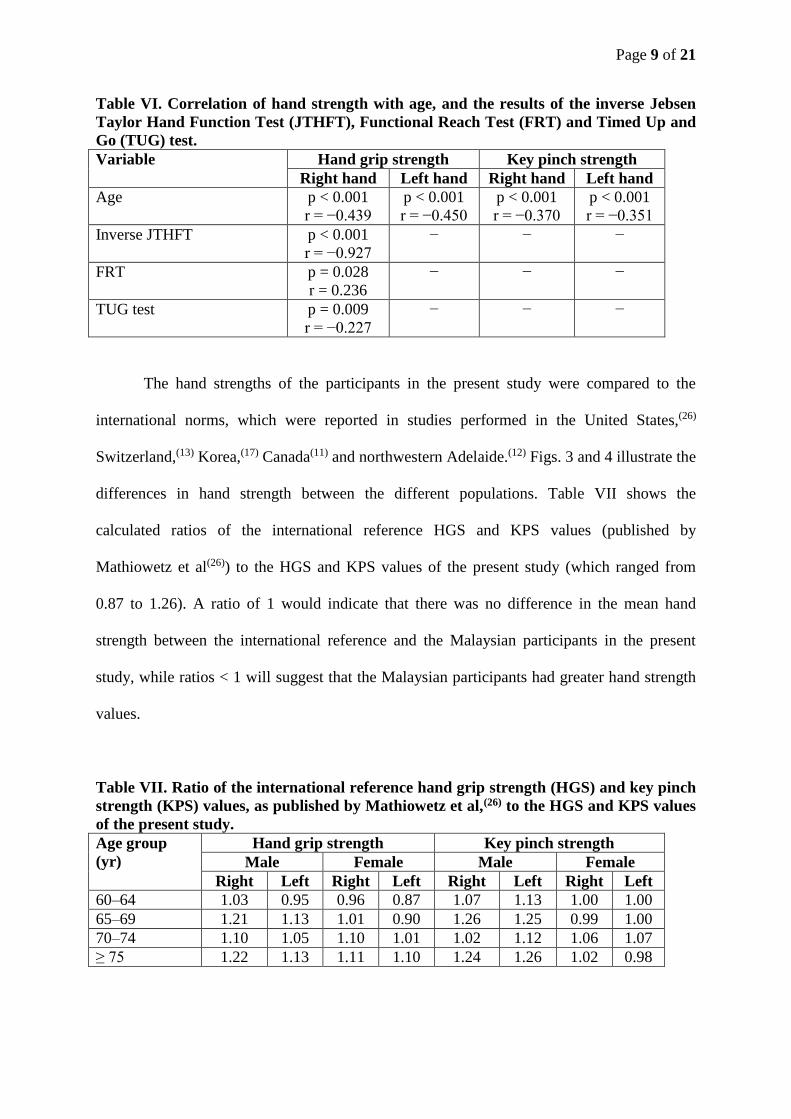
Table VI. Correlation of hand strength with age, and the results of the inverse Jebsen
Taylor Hand Function Test (JTHFT), Functional Reach Test (FRT) and Timed Up and
Go (TUG) test.
Variable Hand grip strength Key pinch strength
Right hand Left hand Right hand Left hand
Age
p < 0.001
r = −0.439
p < 0.001
r = −0.450
p < 0.001
r = −0.370
p < 0.001
r = −0.351
Inverse JTHFT p < 0.001
r = −0.927
− − −
FRT p = 0.028
r = 0.236
− − −
TUG test p = 0.009
r = −0.227
− − −
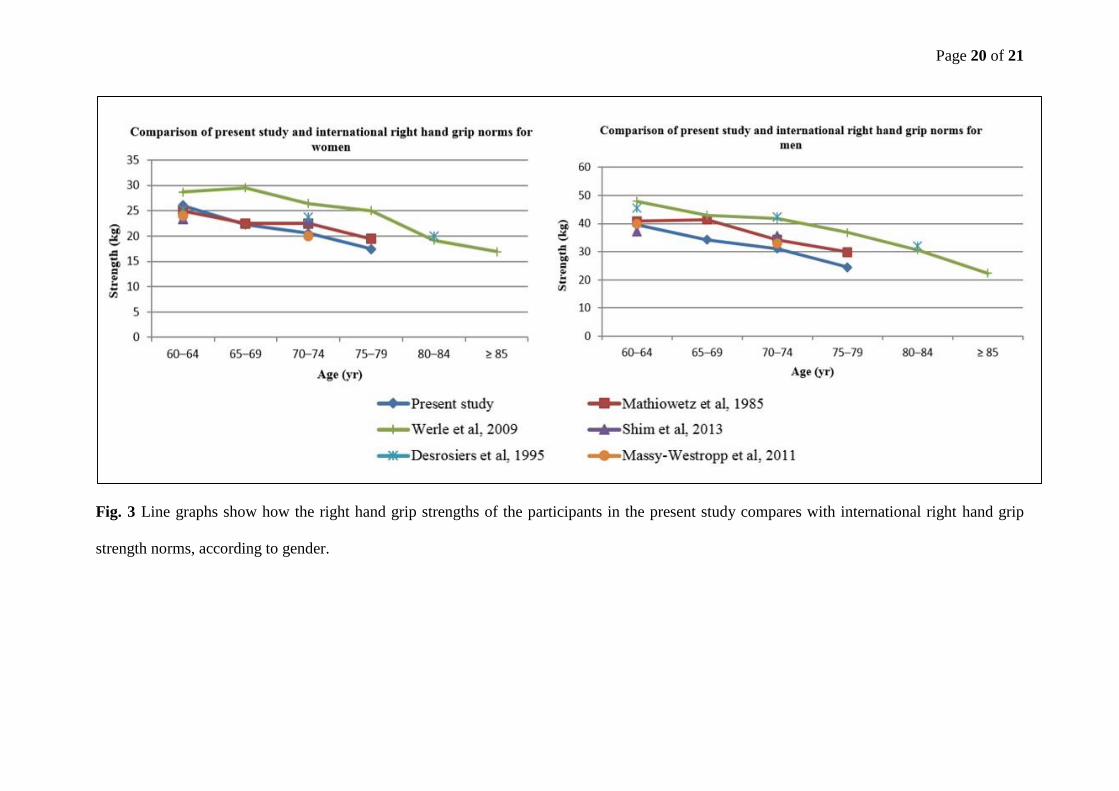
The hand strengths of the participants in the present study were compared to the
international norms, which were reported in studies performed in the United States,(26)
Switzerland,(13) Korea,(17) Canada(11) and northwestern Adelaide.(12) Figs. 3 and 4 illustrate the
differences in hand strength between the different populations. Table VII shows the
calculated ratios of the international reference HGS and KPS values (published by
Mathiowetz et al(26)) to the HGS and KPS values of the present study (which ranged from
0.87 to 1.26). A ratio of 1 would indicate that there was no difference in the mean hand
strength between the international reference and the Malaysian participants in the present
study, while ratios < 1 will suggest that the Malaysian participants had greater hand strength
values.
Table VII. Ratio of the international reference hand grip strength (HGS) and key pinch
strength (KPS) values, as published by Mathiowetz et al,(26) to the HGS and KPS values
of the present study.
Age group
(yr)
Hand grip strength Key pinch strength
Male Female Male Female
Right Left Right Left Right Left Right Left
60–64 1.03 0.95 0.96 0.87 1.07 1.13 1.00 1.00
65–69 1.21 1.13 1.01 0.90 1.26 1.25 0.99 1.00
70–74 1.10 1.05 1.10 1.01 1.02 1.12 1.06 1.07
≥ 75 1.22 1.13 1.11 1.10 1.24 1.26 1.02 0.98
Page 10 of 21
DISCUSSION
The present study aimed to address the lack of standardised hand strength norms in Malaysia,
by developing normative data for upper limb strength in Malaysian persons aged 60 years and
above. The values obtained in the study represent normal ranges and do not take into account
other factors that could have influenced hand strength, such as body weight and height,
occupation and comorbidities. As the presence of comorbidities increases markedly with
increasing age, it was not possible for us to only include individuals without any comorbidity.
Hypertension, hypercholesterolaemia, diabetes mellitus and osteoarthritis are conditions that
are highly prevalent in older populations. Recruitment of only individuals without these
medical conditions will not only be extremely challenging, it would also result in the data
collected being non-representative of normality in our older population.
In the present study, hand strength significantly declined with increasing age; it was
also significantly higher among the male participants. These findings were consistent with
previous studies and expected physiological variations.(11,13,14,17,20,26) However, a possible
influence to this trend may be due to the growing role of women in the development of
modern society, leading to major changes in the activity patterns of both genders. Hence,
future studies may need to be conducted to update these normative values.
Interestingly, we observed a significant difference in the HGS of participants
belonging to different ethnic groups in the present study. These differences have not been
explored previously, as previous studies did not involve multi-ethnic populations. The present
study was not powered to determine the potential contributory factors for HGS variation
among the different ethnic groups. Differences in ethnicity are associated with differences in
genetic makeup, as well as different cultural practices. Genetic makeup influences body
habitus and physical composition, while different cultural practices influence physical
activity, nutritional intake and occupational factors. However, as the Chinese, Malay and
Page 11 of 21
Indian ethnic groups are all of Asian descent, little variations in physical size and strength
were expected. The relationship between ethnicity and HGS therefore represents a complex
and interesting area of research that will need to be explored in the future. The unique ethnic
composition of the participants in the present study suggests that the normal ranges derived
from this study may have a much wider relevance than those previously published; this is
especially the case since 31% of older people in the world are from China and India.(27)
Differences in the hand strengths of persons living in urban areas versus persons
living in rural areas have not been evaluated and should be the subject of future research
studies. The finding that the HGS and KPS of the older rural population were greater than
those of older urban dwellers in Malaysia was in line with our expectations. A probable
explanation for this observation is that the main midlife occupations of persons living in rural
areas were manual tasks, such as farming and rubber tapping, while that of persons living in
urban areas tended to be sedentary occupations that are deskbound. Therefore, elderly
persons from rural areas appear to have a greater reserve of strength, as a result of the greater
occupational demands on their hands during midlife. Previous epidemiological studies have
highlighted major differences between the health-related indices of urban and rural
populations, with rural populations consistently faring worse in such health indicators.(28) The
urban-rural divide in health status in Malaysia has yet to be adequately addressed. The
changing demographics of Malaysia, due to the migration of the younger generation from
rural areas to urban areas, has led to a larger older population in rural areas. This is of
concern as it would result in an increase in the burden and cost of healthcare among the older
populations living in rural areas. However, if hand strength is considered a good marker of
frailty among older adults, it is possible that our findings of a stronger hand strength among
elderly persons from rural areas is reassuring.
Page 12 of 21
The FRT and TUG test are both well-established tests that are frequently used in
research as a marker of physical frailty, functional mobility and fall risk in older
individuals.(25,29) In the present study, the performance of right HGS was found to be
significantly correlated with the results of the FRT and TUG test. FRT, TUG test and HGS
measurement are all different parameters that can be used to assess elderly health status and
disability. The significant correlation between HGS and the results of these tests in the
present study support the role of HGS as a frailty indicator. The near-perfect correlation
between HGS and JTHFT (r = −0.927) validates HGS as a highly accurate marker of overall
hand function. This finding also indicates that HGS, which is a quick and easy test, can be
used to replace JTHFT, which is a far more complicated and time-consuming test, as a
measure of hand function.
When the hand strength values of the present study were compared with those that
were published by Mathiowetz et al,(26) the ratios obtained indicate that Malaysian women
aged 60–69 years are as strong as, if not stronger than, the corresponding population from
Mathiowetz et al’s study (ratios of 0.87–1.01), while Malaysian women aged 70 years and
above are nearly as strong as the corresponding population from Mathiowetz et al’s study
(ratios of 1.0–1.1). On the other hand, the older Malaysian men in the present study scored
slightly poorer than the corresponding population from Mathiowetz et al’s study, with ratios
of 0.95 to 1.10 in the 60–69 years age group, and ratios of 1.10–1.26 in those over 75 years.
In a study by Kamarul et al, which examined the HGS of younger Malaysians (age < 65
years), the authors found that the HGS of the corresponding population in Mathiowetz et al’s
study was up to 1.5 greater than that of their study cohort.(20) The better scores attained
among the older Malaysians in the present study may reflect the changing economic structure
of Malaysia, as the main occupation of older Malaysians include manual tasks such as
farming, rubber tapping and tin mining, whereas younger Malaysians tend to have more
Page 13 of 21
sedentary occupations in factories and offices, in keeping with the industrialisation of
Malaysia. However, Flood-Joy and Mathiowetz reported incorrect calibration of one of the
instruments used in the measurement of grip strength among the older participants(30) and this
may have compromised the outcome of the normal value obtained for the older people in
their study.
The present study was not without limitations. The participants were not a nationally
representative sample selected through a sampling frame. They were recruited from the
Klang Valley, Selangor, Malaysia, and Bahau, Negeri Sembilan, Malaysia, which may not be
representative of the whole country, as Malaysia consists of thirteen states and three federal
territories. Nonetheless, it was assumed that a broad range of socioeconomic groups was
recruited, as the participants were from rural, suburban and urban areas. Although a
nationally representative sample using a sampling frame would have been useful, it would
have been prohibitively expensive in the conduct of the study.
Another limitation was the ethnic distribution of the participants. The majority of our
participants were Chinese (67.7%), followed by Malays (19.3%) and Indians (11.6%). The
ethnic composition of the Malaysian population for these three ethnic groups, as of July 2010,
is as follows: Malays (60.3%), Chinese (22.9%) and Indians (7.1%).(31) While the ethnic
composition of the Malaysian elderly population (i.e. Malaysians over the age of 60 years) is
not readily available, the proportion of older Chinese and Indians are expected to be far
higher in the older Malaysian population, as the life expectancies for ethnic Chinese men and
women are 74.4 years and 78.9 years, respectively, while the life expectancies for ethnic
Malay men and women are 70.5 years and 75.3 years, respectively.(32) Projected figures in
1998 estimated that 14.4% of Chinese will be over the age of 60 years by 2020, as compared
to the 10.4% of Indians and the 7.9% of Malays expected to be over the age of 60 years by
2020.(33) The dwindling proportion of ethnic Chinese and Indians in our population is also
Page 14 of 21
influenced by declining birth rates and outward migration. Thus, the over-representation of
Chinese in the present study’s older population is consistent with the ageing demographics of
Malaysia.
The Baseline® pinch gauge used in the present study malfunctioned towards the end
of the data collection phase. This unforeseen issue resulted in fewer data on KPS collected (a
total of 246, instead of 362, data collected). Although this is not anticipated to have affected
the true values, this can only be verified though future studies. We suggest that further
research be conducted to update the population-specific hand strength norms in the future, as
Malaysia is a growing and developing country; that is, Malaysia may undergo significant
epidemiological changes in the future, which may result in changes in the normative data, and
thus, an impact on the applicability of the current normal ranges.
In conclusion, normative data on HGS and KPS among older Malaysians are
presented in this study. The hand strength norms obtained in this study were lower than the
international reference values, highlighting the importance of population-specific norms.
HGS appears to be a valid substitute for JTHFT in its ability to provide an overall measure of
hand function, and it was also found to correlate significantly with lower limb gait and
balance measures, as measured by the FRT and TUG test. We also found that HGS was
significantly different among the different ethnic groups and between the urban and rural
populations. Future studies should seek to determine the potentially modifiable risk factors
for reduced hand strength, and to explore the role of HGS as a triage, screening and/or
resource management tool in the healthcare setting.
ACKNOWLEDGEMENTS
The authors wish to thank the volunteers for their participation in this study and the Ageing
and Age-Associated Disorders Research Group for their contribution to the field work. This
Page 15 of 21
research was funded by a University Malaya Research Grant (RP-010-2012) and Post
Graduate Research Fund (No. P0045-2013).
REFERENCES
1. Arokiasamy JT. Malaysia's ageing population: challenges in the new millenium. Med J
Malaysia 1999; 54:429-32.
2. Fried LP, Tangen CM, Walston J, et al; Cardiovascular Health Study Collaborative
Research Group. Frailty in older adults: evidence for a phenotype. J Gerontol A Biol Sci
Med Sci 2001; 56:M146-56.
3. Christensen K, Doblhammer G, Rau R, Vaupel JW. Ageing populations: the challenges
ahead. Lancet 2009; 374:1196-208.
4. Giampaoli S, Ferrucci L, Cecchi F, et al. Hand-grip strength predicts incident disability in
non-disabled older men. Age Ageing 1999; 28:283-8.
5. Gale CR, Martyn CN, Cooper C, Sayer AA. Grip strength, body composition, and
mortality. Int J Epidemiol 2007; 36:228-35.
6. Rantanen T, Volpato S, Ferrucci L, et al. Handgrip strength and cause-specific and total
mortality in older disabled women: exploring the mechanism. J Am Geriatr Soc 2003;
51:636-41.
7. Sasaki H, Kasagi F, Yamada M, Fujita S. Grip strength predicts cause-specific mortality
in middle-aged and elderly persons. Am J Med 2007; 120:337-42.
8. Keevil V, Mazzuin Razali R, Chin AV, et al. Grip strength in a cohort of older medical
inpatients in Malaysia: a pilot study to describe the range, determinants and association
with length of hospital stay. Arch Gerontol Geriatr 2013; 56:155-9.
Page 16 of 21
9. Roberts HC, Syddall HE, Cooper C, Aihie Sayer A. Is grip strength associated with
length of stay in hospitalised older patients admitted for rehabilitation? Findings from the
Southampton grip strength study. Age Ageing 2012; 41:641-6.
10. Kellor M, Frost J, Silberberg N, Iversen I, Cummings R. Hand strength and dexterity. Am
J Occup Ther 1971; 25:77-83.
11. Desrosiers J, Bravo G, Hébert R, Dutil E. Normative data for grip strength of elderly men
and women. Am J Occup Ther 1995; 49:637-44.
12. Massy-Westropp NM, Gill TK, Taylor AW, Bohannon RW, Hill CL. Hand Grip
Strength: age and gender stratified normative data in a population-based study. BMC Res
Notes 2011; 4:127.
13. Werle S, Goldhahn J, Drerup S, et al. Age- and gender-specific normative data of grip
and pinch strength in a healthy adult Swiss population. J Hand Surg Eur Vol 2009; 34:76-
84.
14. Günther CM, Bürger A, Rickert M, Crispin A, Schulz CU. Grip strength in healthy
caucasian adults: reference values. J Hand Surg Am 2008; 33:558-65.
15. Härkönen R, Piirtomaa M, Alaranta H. Grip strength and hand position of the
dynamometer in 204 Finnish adults. J Hand Surg Br 1993; 18:129-32.
16. Mitsionis G, Pakos EE, Stafilas KS, et al. Normative data on hand grip strength in a
Greek adult population. Int Orthop 2009; 33:713-7.
17. Shim JH, Roh SY, Kim JS, et al. Normative measurements of grip and pinch strengths of
21st century korean population. Arch Plast Surg 2013; 40:52-6.
18. Chong CK, Tseng CH, Wong MK, Tai TY. Grip and pinch strength in Chinese adults and
their relationship with anthropometric factors. J Formos Med Assoc 1994; 93:616-21.
19. Pieterse S, Manandhar M, Ismail S. The association between nutritional status and
handgrip strength in older Rwandan refugees. Eur J Clin Nutr 2002; 56:933-9.
Page 17 of 21
20. Kamarul T, Ahmad TS, Loh WY. Hand grip strength in the adult Malaysian population. J
Orthop Surg (Hong Kong) 2006; 14:172-7.
21. Fess EE, Moran C. Clinical assessment recommendations. Indianapolis: American
Society of Hand Therapists Monograph, 1981.
22. Fess EE. The effects of Jamar dynamometer handle position and test protocol on normal
grip strength. J Hand Surg 1981; 7:308-9.
23. Jebsen RH, Taylor N, Trieschmann RB, Trotter MJ, Howard LA. An objective and
standardized test of hand function. Arch Phys Med Rehabil 1969; 50:311-9.
24. Duncan PW, Weiner DK, Chandler J, Studenski S. Functional reach: a new clinical
measure of balance. J Gerontol 1990; 45:M192-7.
25. Podsiadlo D, Richardson S. The timed "Up & Go": a test of basic functional mobility for
frail elderly persons. J Am Geriatr Soc 1991; 39:142-8.
26. Mathiowetz V, Kashman N, Volland G, et al. Grip and pinch strength: normative data for
adults. Arch Phys Med Rehabil 1985; 66:69-74.
27. World Health Organization. Global Health and Aging [online]. Available at:
http://www.who.int/ageing/publications/global_health.pdf. Accessed October 23, 2015.
28. Eberhardt MS, Pamuk ER. The importance of place of residence: examining health in
rural and nonrural areas. Am J Public Health 2004; 94:1682-6.
29. Weiner DK, Duncan PW, Chandler J, Studenski SA. Functional reach: a marker of
physical frailty. J Am Geriatr Soc 1992; 40:203-7.
30. Flood-Joy M, Mathiowetz V. Grip-strength measurement: a comparison of three Jamar
dynamometers. Occ Ther J Res 1987; 7:235-43.
31. Department of Statistics Malaysia. Population and Housing Census Malaysia 2010 –
Population Distribution and Basic Demographic Characteristic Report 2010. In:
Department of Statistics Malaysia, Official Portal [online]. Available at:
Page 18 of 21
http://www.statistics.gov.my/portal/index.php?option=com_content&view=article&id=12
15%3Apopulation-distribution-and-basic-demographic-characteristic-report-population-
and-housing-census-malaysia-2010-updated-2972011&catid=130%3Apopulation-
distribution-and-basic-demographic-characteristic-report-population-and-housing-census-
malaysia-2010&Itemid=154&lang=en. Accessed August 12, 2014.
32. Department of Statistics Malaysia. Abridges Life Tables, Malaysia 2008-2010. In:
Deprtment of Statistics Malaysia, Official Portal [online]. Available at:
http://www.statistics.gov.my/portal/images/stories/files/LatestReleases/abridged/Abridge
d_Life_Tables_2008-2010.pdf. Accessed August 30, 2014.
33. Ong FS, Phillips DR, Tengku-Aizan H. Ageing in Malaysia: Progress and prospects. In:
Fu TH, Hudges R, eds. Ageing in East asia: Challenges and policies for the twenty-first
century. London: Routledge, 2009: 138-60.
Page 19 of 21
FIGURES
Fig. 1 Photograph shows the recommended standardised position during hand grip strength
measurement.
Fig. 2 Photograph shows the position of the thumb and index finger for key pinch strength
measurement.
Page 20 of 21
Fig. 3 Line graphs show how the right hand grip strengths of the participants in the present study compares with international right hand grip
strength norms, according to gender.
Page 21 of 21
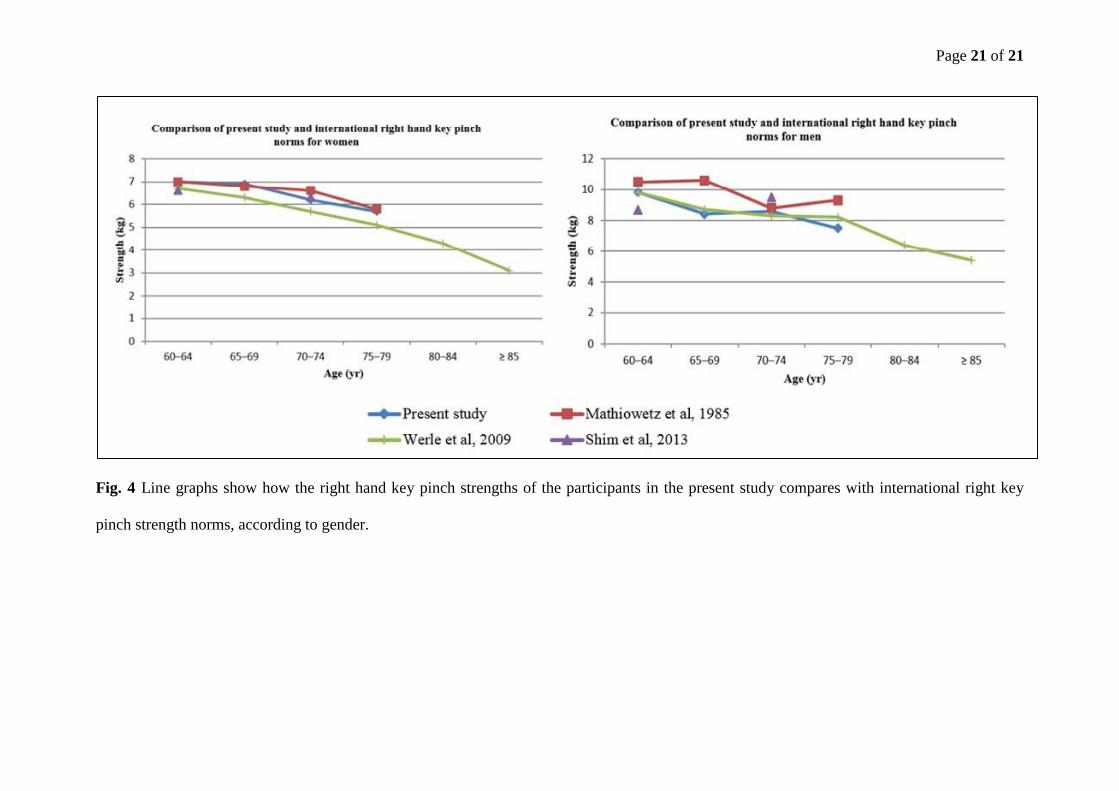
Fig. 4 Line graphs show how the right hand key pinch strengths of the participants in the present study compares with international right key
pinch strength norms, according to gender.