Embed Size (px)
Citation preview
0
Working Paper No. 267
Normalizing India Pakistan Trade
Nisha Taneja
Mishita Mehra
Prithvijit Mukherjee
Samridhi Bimal
Isha Dayal
September 2013
INDIAN COUNCIL FOR RESEARCH ON INTERNATIONAL ECONOMIC RELATIONS
Contents
Abstract ............................................................................................................................................ i
1. Introduction ............................................................................................................................. 1
2. Context of the Study ................................................................................................................ 3
3. Methodology ............................................................................................................................ 5
4. Trade Potential and Possibilities .............................................................................................. 6
4.1 Trends in Bilateral Trade.............................................................................................. 6
4.2 Trade Potential in Goods .............................................................................................. 7
4.3 Negative and Sensitive Sectors ................................................................................... 12
4.4 Trade Possibilities in Services .................................................................................... 16
5. Realizing Trade Potential ...................................................................................................... 17
5.1 Transport and Transit ................................................................................................. 18
5.2 Non-Tariff Barriers ..................................................................................................... 21
5.3 Informal Trade ............................................................................................................ 22
5.4 Visas ............................................................................................................................ 23
5.5 Foreign Direct Investment .......................................................................................... 24
5.6 Institutions Engaged in Trade Normalization............................................................. 25
6. Conclusion ............................................................................................................................. 26
References ..................................................................................................................................... 28
APPENDIX ................................................................................................................................... 31
i
Abstract
With the trade normalization process between India and Pakistan gathering momentum since
November 2011, new opportunities for enhancing bilateral trade have opened between the
two countries. This study estimates the trade potential between India and Pakistan, and
examines how this potential can be realized. Using the Trade Possibility Approach for all
items traded, followed by selecting only those items in which the countries have a Revealed
Comparative Advantage (RCA) to export, the trade potential between India and Pakistan is
estimated to lie between US$10.9 billion and US$19.8 billion.
Of the US$10.9 billion trade potential, India’s export potential accounts for US$7.9 billion
and import potential US$3 billion. With a large number of items belonging to the negative or
sensitive lists, the study estimates the trade potential accounted for by these items. Sector-
wise analysis depicts that bilateral trade shall receive a boost if the textile sector is liberalized
in both countries, with Pakistan liberalizing its automobile sector too. In the services sector,
trade possibilities have been identified in Information Technology (IT), Business Process
Outsourcing (BPO), health and entertainment services.
The study finds that this trade potential remains unrealized largely due to impediments in
transport and transit facilities, restrictive visa regime, continuation of large informal trade
flows, and presence of ‘perceived’ non-tariff barriers to trade between India and Pakistan. As
the Foreign Direct Investment (FDI) regime between the two countries is liberalized, the
study identifies sectors which hold potential for investments, and are likely to deepen the
trade linkages between India and Pakistan.
____________________
JEL Classification: F10, F13, F50, F53
Keywords: India-Pakistan, bilateral trade, trade normalization, trade potential, MFN, regional
integration
Author’s Email: [email protected]
___________________
Disclaimer:
Opinions and recommendations in the paper are exclusively of the author(s) and not of any
other individual or institution including ICRIER.
1
Normalizing India Pakistan Trade
Nisha Taneja, Mishita Mehra, Prithvijit Mukherjee, Samridhi Bimal, Isha Dayal
1. Introduction1
Contiguous countries around the world share a congenial trading environment, with
high values of bilateral trade being in line with the ‘Gravity Model’ theory of
international trade, owing to lower inter-country distances2. However, trade between
India and Pakistan has always been inextricably linked to the political relations the two
countries share, than being merely governed by economic factors. Following the
independence and partition in 1947, Indo-Pakistan trade fell drastically; and came to a
standstill for almost nine years in the aftermath of the war in 1965. A protocol on
resumption of trading relations was signed in 1974 on a list of mutually agreed items.
In 1996, India accorded Most Favored Nation (MFN) status to Pakistan thereby
offering Pakistan the same trading regime as it offers to any other country in the world.
Pakistan, on the other hand, continued to allow imports of a limited number of items
from India, collectively known as the positive list; although the number of items on the
list has increased gradually. The grant of MFN was linked to the resolution on the
Kashmir issue. Moreover, India stopped trade via the air and land routes between 2001
and 2004 following the attack on Indian parliament in December 2001. In 2013, for the
first time since 2004, cross border trade was altogether stopped following the incidence
of cross border firing; with trade resuming within a few days time. Restriction on trade
had been on several other counts as well, with the major ones being: a) a restrictive
maritime protocol until 2005 which allowed only Indian and Pakistani flagged vessels
to carry cargo between the two countries, and not permitting the same vessels to carry
consignments to a third country from the ports of either, b) presence of only one rail
route for cargo movement between the two countries; and c) Absence of road-based
trade route until 2005. This restrictive trading environment resulted in large informal
trade flows between India and Pakistan, with most of the trade taking place via third
country ports such as Dubai.
The process of trade normalization was set in motion in 2004 during the Commerce
Secretary level talks on Commercial and Economic Co-operation between India and
Pakistan. In this comprehensive dialogue, trade negotiations were to be discussed along
with a dialogue on several other issues. This was the first step towards delinking trade
negotiations from political issues. Since 2004, any major political event between India
and Pakistan has neither met with any major impact on trading relations nor an
1 We are grateful to our two anonymous referees; and Aradhna Aggarwal, Deb Kusum Das and Saikat
Sinha Roy for their comments at the Annual Conference on Normalising India-Pakistan Trade held in
March 2013. 2 USA and Canada; EU27; South East Asian countries (ASEAN members)
2
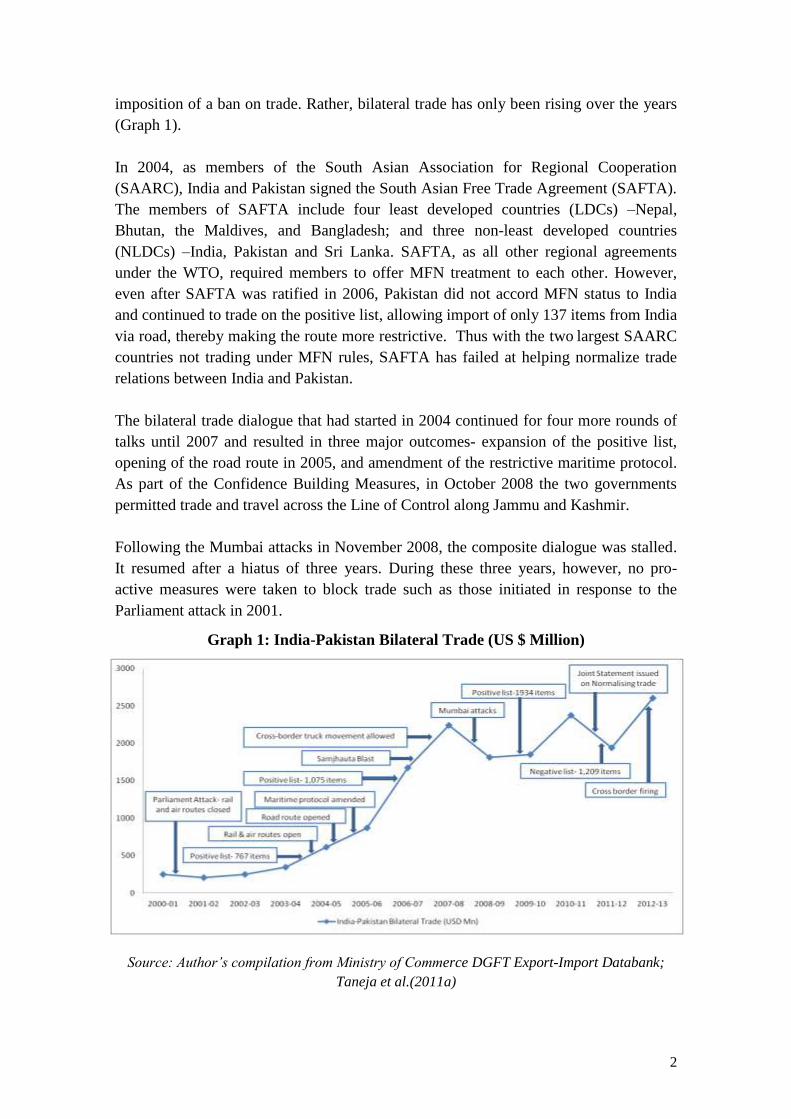
imposition of a ban on trade. Rather, bilateral trade has only been rising over the years
(Graph 1).
In 2004, as members of the South Asian Association for Regional Cooperation
(SAARC), India and Pakistan signed the South Asian Free Trade Agreement (SAFTA).
The members of SAFTA include four least developed countries (LDCs) –Nepal,
Bhutan, the Maldives, and Bangladesh; and three non-least developed countries
(NLDCs) –India, Pakistan and Sri Lanka. SAFTA, as all other regional agreements
under the WTO, required members to offer MFN treatment to each other. However,
even after SAFTA was ratified in 2006, Pakistan did not accord MFN status to India
and continued to trade on the positive list, allowing import of only 137 items from India
via road, thereby making the route more restrictive. Thus with the two largest SAARC
countries not trading under MFN rules, SAFTA has failed at helping normalize trade
relations between India and Pakistan.
The bilateral trade dialogue that had started in 2004 continued for four more rounds of
talks until 2007 and resulted in three major outcomes- expansion of the positive list,
opening of the road route in 2005, and amendment of the restrictive maritime protocol.
As part of the Confidence Building Measures, in October 2008 the two governments
permitted trade and travel across the Line of Control along Jammu and Kashmir.
Following the Mumbai attacks in November 2008, the composite dialogue was stalled.
It resumed after a hiatus of three years. During these three years, however, no pro-
active measures were taken to block trade such as those initiated in response to the
Parliament attack in 2001.
Graph 1: India-Pakistan Bilateral Trade (US $ Million)
Source: Author’s compilation from Ministry of Commerce DGFT Export-Import Databank;
Taneja et al.(2011a)
3
The fifth round of talks in April 2011 laid down the blueprint for normalizing trade
between India and Pakistan. Perhaps what set the tone for the talks was the recognition
of the necessity to promote bilateral trade to “build confidence, dispel
misunderstandings and allay misapprehensions”. While the agenda was very detailed
(covering inter alia the MFN issue, addressing non-tariff barriers, improving border
infrastructure, customs liaison, harmonization of customs procedures, trade in
electricity and petroleum products, co-operation in information technology, visas,
bilateral investments, and opening of bank branches) the two negotiating points
revolved around Pakistan granting MFN status to India and the latter addressing non-
tariff barriers faced by Pakistan in accessing India’s market.
The Joint Statement issued in November 2011 laid down the sequencing and timelines
for full phasing in of MFN status for India. In the first phase, Pakistan would graduate
from the positive list to a small negative list specifying banned rather than permitted
items. In the second stage, the negative list would be phased out; overall as well as for
the road route on which trade takes place for only a fraction of the items on the positive
list. These changes would usher in the full phasing in of MFN that forms an essential
part of the trade normalization process.
Adhering to the Joint Statement, in March 2012 Pakistan made a transition from the
positive list approach to a small negative list of 1,209 items. However, it continued to
restrict road-based trade by allowing only 137 items to be imported from India via road;
while India took a number of steps to address Non Tariff Barriers (NTB’s). Since then,
trade negotiations on MFN changed stance one more time. During the 7th
Round of
talks held in September 2012, India and Pakistan agreed to further deepen the
preferential arrangements under SAFTA with India offering concessions to Pakistan in
exchange for Pakistan granting MFN status to India. In a major step, India pruned its
sensitive list to 614 items. The current status as of July 2013 is that India would bring
down its SAFTA Sensitive List to 100 tariff lines (from the existing 614 items); with
Pakistan simultaneously granting MFN status to India, including the phasing out of
negative lists and removal of restrictions on items traded by road.
2. Context of the Study
Even though positive measures have been taken in the past, the series of credible steps
taken since November 2011 are likely to lead to a quantum jump in trade between India
and Pakistan. As the two countries move towards normalizing their bilateral trading
regimes, there will be new trading opportunities for both of them. It is important to
quantify the trade potential and identify sectors with the largest potential. The negative
and sensitive lists operational in Pakistan against India and the sensitive lists
maintained by India for Pakistan are indicative of the sectors in which the two countries
want to offer protection to domestic industries from each other’s imports; indicating the
corresponding gains to the protected exporters of both countries. The trade potential for
these sensitive items would indicate the extent to which possible losers and gainers in
4
different industries are being affected. While trade negotiations have focused largely on
the goods sector, there are trade possibilities in the service sector as well. Assessing
these possibilities would help to equip businessmen in India and Pakistan with relevant
information on service trade.
The extent to which trade potential can be realized between India and Pakistan would
depend on a number of factors. Identifying impediments to trade can help policymakers
take relevant measures. Cross border transportation at low costs can provide large gains
to traders on both sides. Identification of non-tariff barriers can also help improve
market access for both countries. To determine the extent to which trade potential can
be realized, it is also important to assess the impact of trade normalization process on
informal trade flows. Foreign Direct investments can help in deepening trade linkages
and in sustaining trade gains. India and Pakistan have for several years followed a very
strict visa regime restricting the movement of people across the border. It is important
to understand the nature of these restrictions, assess the steps taken so far and suggest
further improvements. More importantly, greater people-to-people contact will erase
misconceptions and help them engage fearlessly with each other. The success of trade
normalization process will also be determined by the role of institutions involved in this
process at the centre, state and border level, business and trade associations, non
government organizations and the media.
Against this backdrop our study focuses on the following key questions:
(I) What is the trade potential between India and Pakistan?
What is the total bilateral trade potential and the items having the largest
potential?
What is the trade potential of items on negative and sensitive lists and
which are the sectors with largest trade potential in these categories?
What are the items prone to competition on the negative and sensitive lists?
What are the trade possibilities in the services sector?
(II) How can the trade potential between India and Pakistan be realized?
What are the transport and transit impediments, and how can the
transaction costs of trading be reduced?
What are the non-tariff barriers and how can these be addressed?
What is the magnitude of informal trade and how can it be shifted to formal
channels?
What are the impediments related to visas?
How can investment flows deepen trade linkages?
What is the role of institutions in enhancing trade?
5
3. Methodology
The study makes use of “mixed methods”, based on secondary sources and primary
information collected through field surveys. Secondary sources include published
papers, data and government policies, agreements, regulations and protocols.
Secondary data on India’s trade with Pakistan has been collected from the Directorate
General of Foreign Trade (DGFT), Ministry of Commerce and the United Nations
International Trade Centre’s (UN ITC) World Integrated Trade Systems (WITS)
Database published by the World Bank. The data is used to examine trade trends and
assess trade potential between India and Pakistan which is the difference between the
minimum of the supplier’s global exports and receiver’s global imports minus the
existing trade between the supplier and receiver. Products having trade potential were
identified as those with (a) adequate demand in the receiving country, and (b) adequate
supply capabilities in the source country. Untapped trade potential for any commodity
is given by Min (SE, MI) - ET where SE, MI and ET are supplier’s global exports,
receiver’s global imports and existing trade between the supplier and the receiver.
The estimates of trade potential have to be treated with caution as they are merely
indicative of the untapped trade possibilities. The estimate of trade potential is the
maximum possible trade that two countries can have if they sourced from each other all
items which they sourced from the rest of the world. Though this can never be the case
as relative prices would play an important role, this exercise gives ballpark figures on
trade possibilities at a disaggregated level. The estimates also vary depending on the
year of reference. In this exercise, the calculations are based on trade data for 2011.
The methodology for calculating trade potential is then extended by computing
Revealed Comparative Advantage (RCA) for all items traded, such that India’s export
potential to Pakistan includes only those items in which India has a comparative
advantage to export to the world. Similarly, for estimating India’s import potential from
Pakistan, the products for which Pakistan does not have a revealed comparative
advantage vis-à-vis the world are eliminated. The RCA index is a ratio of the share of a
given product in a country’s exports relative to the product’s share in world exports
(Balassa, 1965). RCA is computed using the following formula:
RCAij = (Xij / XI) / (Xwj / XW)
Where, Xij represents country i’s export of commodity j, Xwj represents world exports
of commodity j, XI represents the total exports of country I, and XW represents total
world exports. RCA index has been computed by averaging item-wise RCA for the
years 2010 and 2011. An RCA index value of greater than unity implies that the
country is competitive in exporting the product.
The logic of using this approach is that countries are more likely to export only those
commodities in which they are globally competitive rather than items in which the
6
partner countries have demand and supply capabilities. The major problem highlighted
with such a measure of RCA is that its theoretical concept is based upon pre-trade
relative prices, in a world where markets function without distortions. It has to be noted
that there will always be a gap between a country’s comparative advantage inferred
from post trade observable data and its actual comparative advantage. However as
Balassa argues, comparative advantage can be revealed through examination of
country/commodity trade patterns, because actual exchanges reflect relative costs as
well as difference in non price factors (Balassa 1965). The results of both approaches
are reported, but the analysis on total trade potential, and potential in the negative and
sensitive lists is undertaken using the RCA approach.
To examine the sensitive and negative lists, the concept of RCA is extended to a ‘paired
RCA approach’. This concept is used to identify ‘vulnerable items’ defined as those
items in which a country is not globally competitive (RCA<1) but the partner country is
(RCA>1). These are termed ‘vulnerable’ as they are most likely to face competition
from exports of the competitive partner country. Countries may consider protecting
such items.
The secondary data analysis was supplemented with primary surveys conducted at
different points in time during 2005-2008 and in 2012 in India, Pakistan and Dubai.
Face to face interviews, focus group discussions, and stakeholder consultations were
held formally and informally using semi-structured open ended questionnaires with
importers, exporters, manufacturer- exporters, freight forwarders, clearing agents,
government officials at the state and centre levels, and academicians on various trade
related issues raised in this study.
4. Trade Potential and Possibilities
In this section we examine the current trade trends, assess trade potential for India and
Pakistan, examine the composition of the negative and sensitive lists, and assess the
extent of trade potential accounted for by these items. The protected sectors having the
highest trade potential are identified and implications of opening up these sectors have
been discussed. The sectors that are likely to face competition from imports once the
negative and sensitive lists are further liberalized have also been identified. Trade
possibilities and potential in the important service sectors have been examined as well.
4.1 Trends in Bilateral Trade
Bilateral trade between India and Pakistan increased by more than 9 times between the
years 2000 and 2011.3 Total trade between the two countries was US$ 1.97 billion in
2011, of which India’s exports to Pakistan were US$ 1.66 billion and imports US$ 313
million. Despite exporting only on the positive list, India has always had a trade surplus
3 Excluding mineral fuels
7
with Pakistan; with the trade balance as a proportion of its total trade with Pakistan
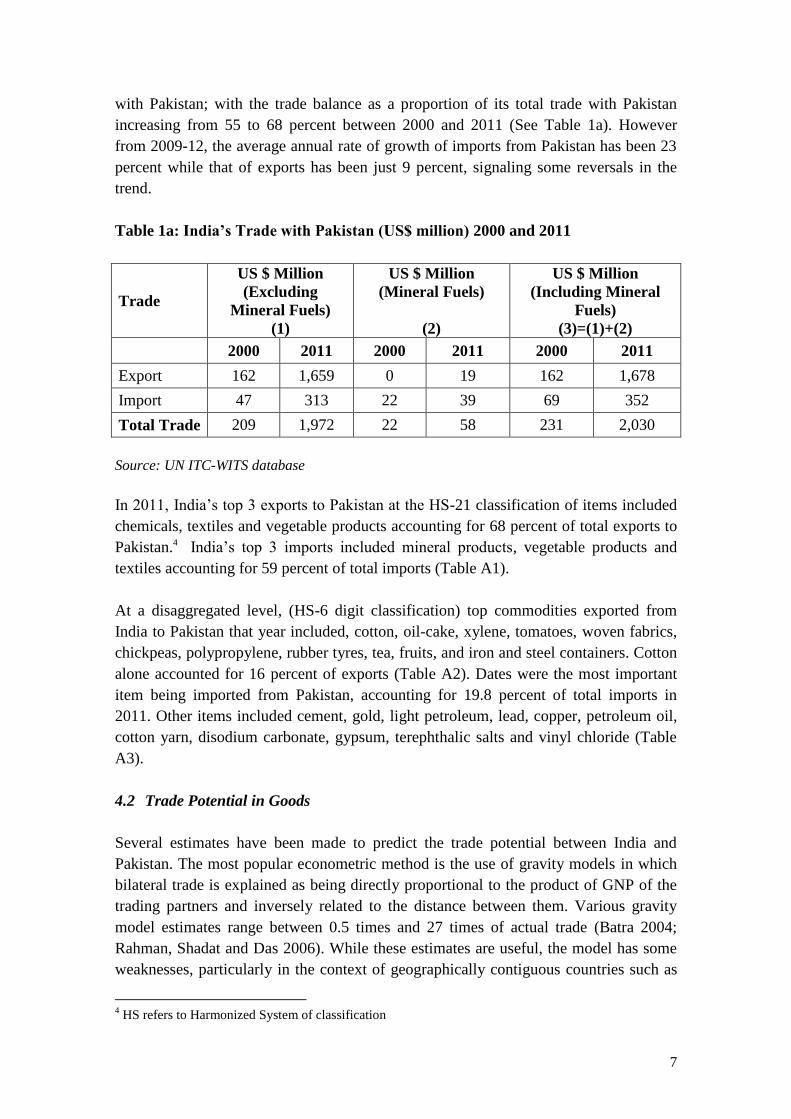
increasing from 55 to 68 percent between 2000 and 2011 (See Table 1a). However
from 2009-12, the average annual rate of growth of imports from Pakistan has been 23
percent while that of exports has been just 9 percent, signaling some reversals in the
trend.
Table 1a: India’s Trade with Pakistan (US$ million) 2000 and 2011
Trade
US $ Million
(Excluding
Mineral Fuels)
(1)
US $ Million
(Mineral Fuels)
(2)
US $ Million
(Including Mineral
Fuels)
(3)=(1)+(2)
2000 2011 2000 2011 2000 2011
Export 162 1,659 0 19 162 1,678
Import 47 313 22 39 69 352
Total Trade 209 1,972 22 58 231 2,030
Source: UN ITC-WITS database
In 2011, India’s top 3 exports to Pakistan at the HS-21 classification of items included
chemicals, textiles and vegetable products accounting for 68 percent of total exports to
Pakistan.4 India’s top 3 imports included mineral products, vegetable products and
textiles accounting for 59 percent of total imports (Table A1).
At a disaggregated level, (HS-6 digit classification) top commodities exported from
India to Pakistan that year included, cotton, oil-cake, xylene, tomatoes, woven fabrics,
chickpeas, polypropylene, rubber tyres, tea, fruits, and iron and steel containers. Cotton
alone accounted for 16 percent of exports (Table A2). Dates were the most important
item being imported from Pakistan, accounting for 19.8 percent of total imports in
2011. Other items included cement, gold, light petroleum, lead, copper, petroleum oil,
cotton yarn, disodium carbonate, gypsum, terephthalic salts and vinyl chloride (Table
A3).
4.2 Trade Potential in Goods
Several estimates have been made to predict the trade potential between India and
Pakistan. The most popular econometric method is the use of gravity models in which
bilateral trade is explained as being directly proportional to the product of GNP of the
trading partners and inversely related to the distance between them. Various gravity
model estimates range between 0.5 times and 27 times of actual trade (Batra 2004;
Rahman, Shadat and Das 2006). While these estimates are useful, the model has some
weaknesses, particularly in the context of geographically contiguous countries such as
4 HS refers to Harmonized System of classification
8
India and Pakistan, where despite lower inter-country distances, transport and other
transaction costs of trading are very high. Moreover, any econometric model would be
limited in its use when existing bilateral trade is limited to the positive list.
The Trade Possibility Approach is a simple, yet intuitive method which yields more
realistic results. Trade possibilities exist in items that two countries can import from
each other instead of importing from elsewhere in the world.
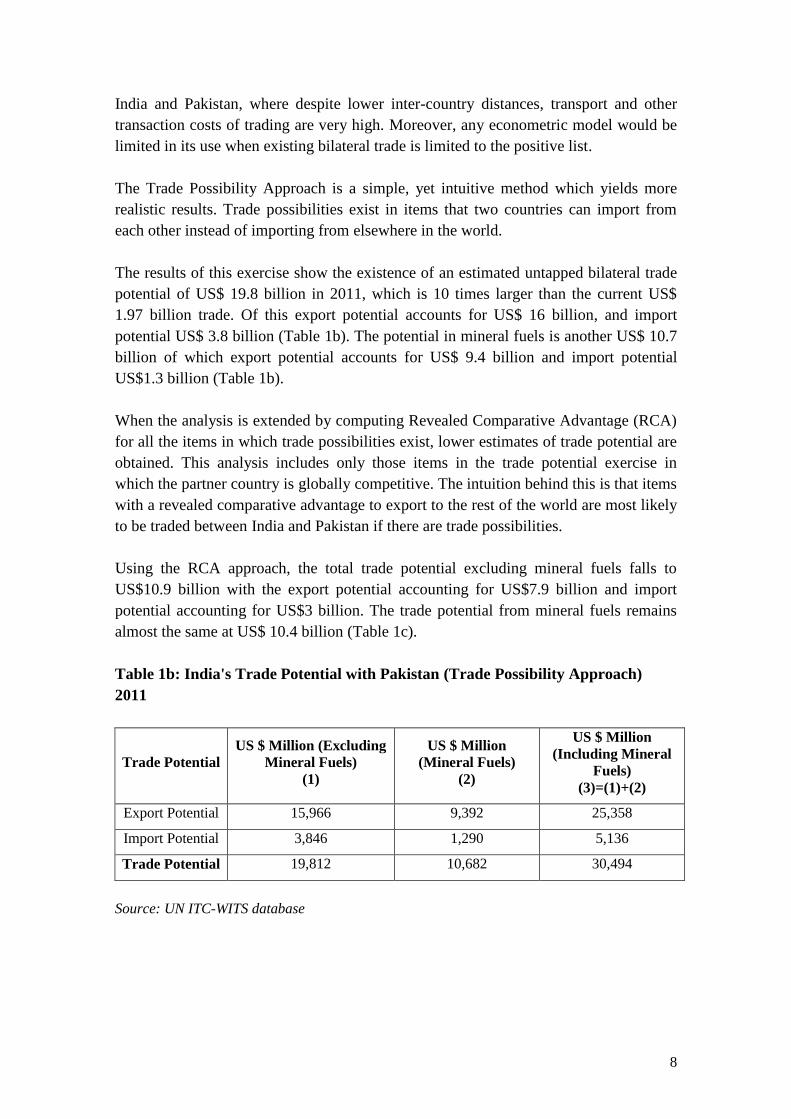
The results of this exercise show the existence of an estimated untapped bilateral trade
potential of US$ 19.8 billion in 2011, which is 10 times larger than the current US$
1.97 billion trade. Of this export potential accounts for US$ 16 billion, and import
potential US$ 3.8 billion (Table 1b). The potential in mineral fuels is another US$ 10.7
billion of which export potential accounts for US$ 9.4 billion and import potential
US$1.3 billion (Table 1b).
When the analysis is extended by computing Revealed Comparative Advantage (RCA)
for all the items in which trade possibilities exist, lower estimates of trade potential are
obtained. This analysis includes only those items in the trade potential exercise in
which the partner country is globally competitive. The intuition behind this is that items
with a revealed comparative advantage to export to the rest of the world are most likely
to be traded between India and Pakistan if there are trade possibilities.
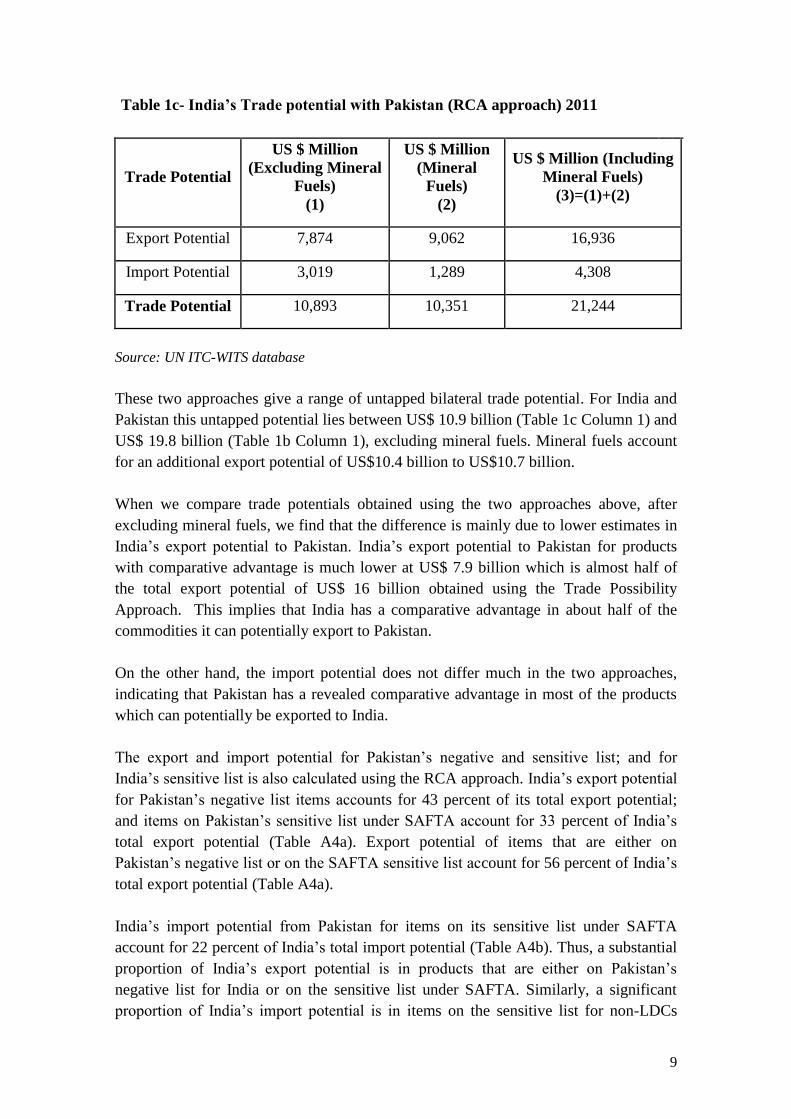
Using the RCA approach, the total trade potential excluding mineral fuels falls to
US$10.9 billion with the export potential accounting for US$7.9 billion and import
potential accounting for US$3 billion. The trade potential from mineral fuels remains
almost the same at US$ 10.4 billion (Table 1c).
Table 1b: India's Trade Potential with Pakistan (Trade Possibility Approach)
2011
Trade Potential
US $ Million (Excluding
Mineral Fuels)
(1)
US $ Million
(Mineral Fuels)
(2)
US $ Million
(Including Mineral
Fuels)
(3)=(1)+(2)
Export Potential
15,966 9,392 25,358
Import Potential
3,846 1,290 5,136
Trade Potential 19,812 10,682 30,494
Source: UN ITC-WITS database
9
Table 1c- India’s Trade potential with Pakistan (RCA approach) 2011
Trade Potential
US $ Million
(Excluding Mineral
Fuels)
(1)
US $ Million
(Mineral
Fuels)
(2)
US $ Million (Including
Mineral Fuels)
(3)=(1)+(2)
Export Potential 7,874 9,062 16,936
Import Potential 3,019 1,289 4,308
Trade Potential 10,893 10,351 21,244
Source: UN ITC-WITS database
These two approaches give a range of untapped bilateral trade potential. For India and
Pakistan this untapped potential lies between US$ 10.9 billion (Table 1c Column 1) and
US$ 19.8 billion (Table 1b Column 1), excluding mineral fuels. Mineral fuels account
for an additional export potential of US$10.4 billion to US$10.7 billion.
When we compare trade potentials obtained using the two approaches above, after
excluding mineral fuels, we find that the difference is mainly due to lower estimates in
India’s export potential to Pakistan. India’s export potential to Pakistan for products
with comparative advantage is much lower at US$ 7.9 billion which is almost half of
the total export potential of US$ 16 billion obtained using the Trade Possibility
Approach. This implies that India has a comparative advantage in about half of the
commodities it can potentially export to Pakistan.
On the other hand, the import potential does not differ much in the two approaches,
indicating that Pakistan has a revealed comparative advantage in most of the products
which can potentially be exported to India.
The export and import potential for Pakistan’s negative and sensitive list; and for
India’s sensitive list is also calculated using the RCA approach. India’s export potential
for Pakistan’s negative list items accounts for 43 percent of its total export potential;
and items on Pakistan’s sensitive list under SAFTA account for 33 percent of India’s
total export potential (Table A4a). Export potential of items that are either on
Pakistan’s negative list or on the SAFTA sensitive list account for 56 percent of India’s
total export potential (Table A4a).
India’s import potential from Pakistan for items on its sensitive list under SAFTA
account for 22 percent of India’s total import potential (Table A4b). Thus, a substantial
proportion of India’s export potential is in products that are either on Pakistan’s
negative list for India or on the sensitive list under SAFTA. Similarly, a significant
proportion of India’s import potential is in items on the sensitive list for non-LDCs
10
under SAFTA. Thus, even if trade is normalized, the two countries are likely to have
limited preferential access to each other’s markets.
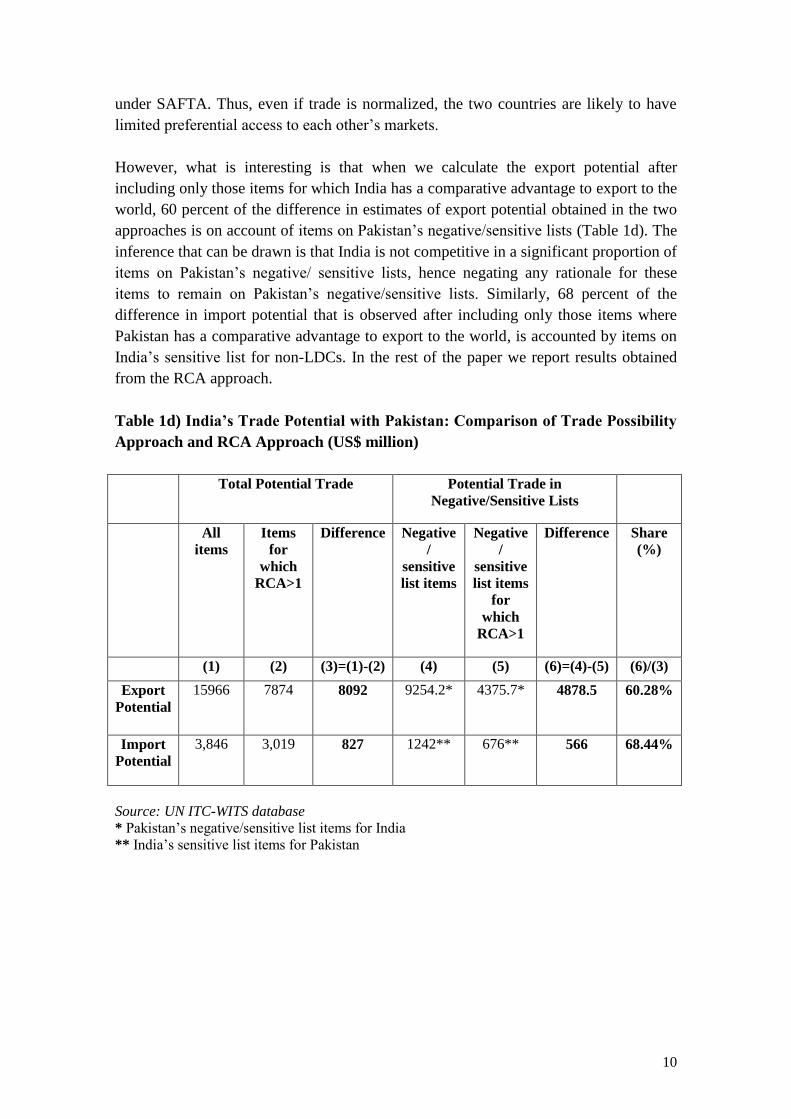
However, what is interesting is that when we calculate the export potential after
including only those items for which India has a comparative advantage to export to the
world, 60 percent of the difference in estimates of export potential obtained in the two
approaches is on account of items on Pakistan’s negative/sensitive lists (Table 1d). The
inference that can be drawn is that India is not competitive in a significant proportion of
items on Pakistan’s negative/ sensitive lists, hence negating any rationale for these
items to remain on Pakistan’s negative/sensitive lists. Similarly, 68 percent of the
difference in import potential that is observed after including only those items where
Pakistan has a comparative advantage to export to the world, is accounted by items on
India’s sensitive list for non-LDCs. In the rest of the paper we report results obtained
from the RCA approach.
Table 1d) India’s Trade Potential with Pakistan: Comparison of Trade Possibility
Approach and RCA Approach (US$ million)
Total Potential Trade Potential Trade in
Negative/Sensitive Lists
All
items
Items
for
which
RCA>1
Difference
Negative
/
sensitive
list items
Negative
/
sensitive
list items
for
which
RCA>1
Difference
Share
(%)
(1) (2) (3)=(1)-(2) (4) (5) (6)=(4)-(5) (6)/(3)
Export
Potential
15966 7874 8092 9254.2* 4375.7* 4878.5 60.28%
Import
Potential
3,846 3,019 827 1242** 676** 566 68.44%
Source: UN ITC-WITS database
* Pakistan’s negative/sensitive list items for India
** India’s sensitive list items for Pakistan
11
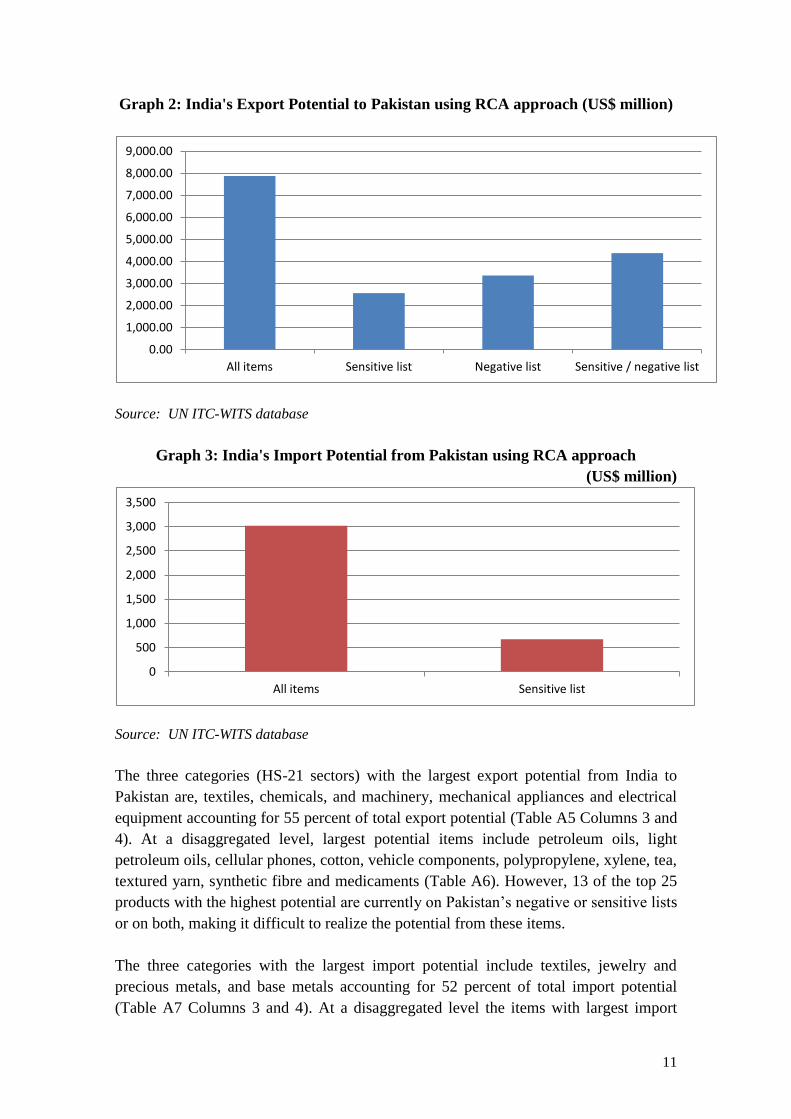
Graph 2: India's Export Potential to Pakistan using RCA approach (US$ million)
Source: UN ITC-WITS database
Graph 3: India's Import Potential from Pakistan using RCA approach
(US$ million)
Source: UN ITC-WITS database
The three categories (HS-21 sectors) with the largest export potential from India to
Pakistan are, textiles, chemicals, and machinery, mechanical appliances and electrical
equipment accounting for 55 percent of total export potential (Table A5 Columns 3 and
4). At a disaggregated level, largest potential items include petroleum oils, light
petroleum oils, cellular phones, cotton, vehicle components, polypropylene, xylene, tea,
textured yarn, synthetic fibre and medicaments (Table A6). However, 13 of the top 25
products with the highest potential are currently on Pakistan’s negative or sensitive lists
or on both, making it difficult to realize the potential from these items.
The three categories with the largest import potential include textiles, jewelry and
precious metals, and base metals accounting for 52 percent of total import potential
(Table A7 Columns 3 and 4). At a disaggregated level the items with largest import
0.00
1,000.00
2,000.00
3,000.00
4,000.00
5,000.00
6,000.00
7,000.00
8,000.00
9,000.00
All items Sensitive list Negative list Sensitive / negative list
0
500
1,000
1,500
2,000
2,500
3,000
3,500
All items Sensitive list
12
potential include petroleum oils, jewelry, medical instruments and appliances, cotton,
tubes and pipes of iron and steel, polyethylene , copper waste and scrap, structures and
parts of structures, terephthalic acid and its salts, and sports equipment (Table A8).
Again 6 out of 25 products with the highest import potential are on India’s sensitive list
for non-LDCs under SAFTA.
India has a huge export potential in mineral fuels largely accounted for by petroleum oil
and light petroleum oil. The potential for the former is US$ 7.7 billion and the latter is
US$ 1.3 billion (Table A6). India’s import potential from Pakistan in petroleum oils is
US$ 1.3 billion (Table A8). Although both countries have export potential in petroleum
oils, analysis at a more disaggregated 8 digit level reveals that Pakistan’s major
petroleum oil export is base oil while India’s comparative advantage is in high speed
diesel, aviation turbine fuel, fuel oil and lubricating oil.
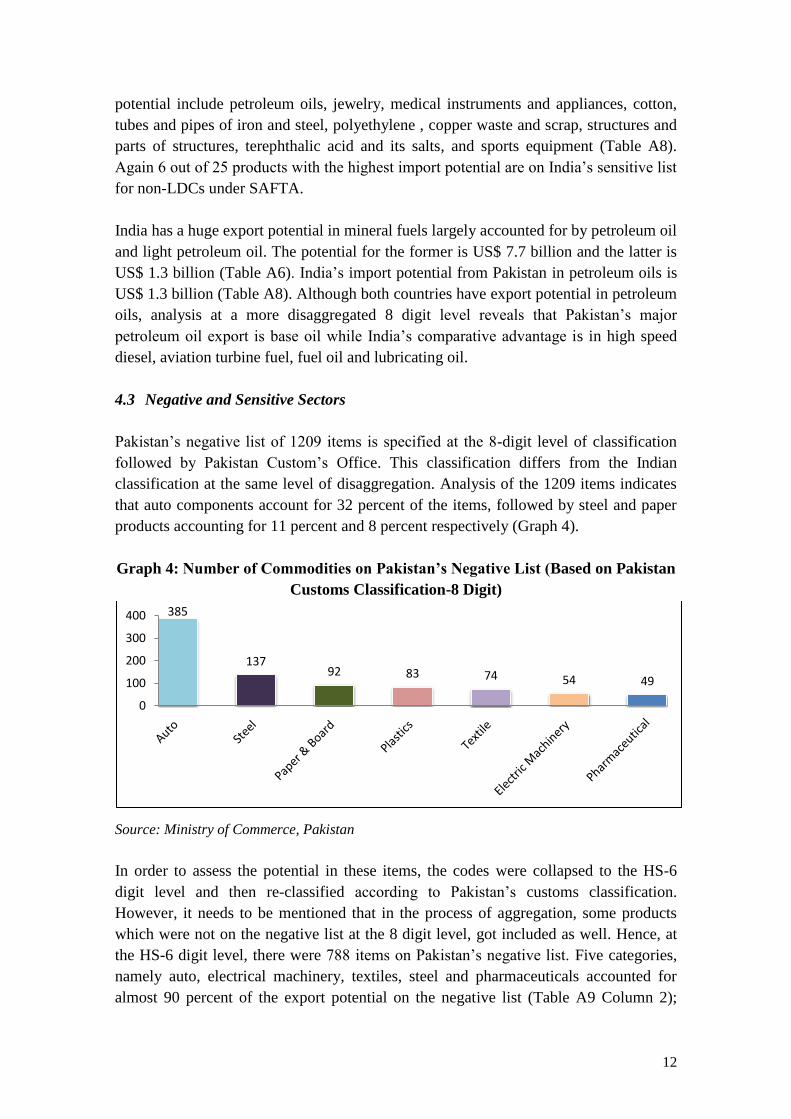
4.3 Negative and Sensitive Sectors
Pakistan’s negative list of 1209 items is specified at the 8-digit level of classification
followed by Pakistan Custom’s Office. This classification differs from the Indian
classification at the same level of disaggregation. Analysis of the 1209 items indicates
that auto components account for 32 percent of the items, followed by steel and paper
products accounting for 11 percent and 8 percent respectively (Graph 4).
Graph 4: Number of Commodities on Pakistan’s Negative List (Based on Pakistan
Customs Classification-8 Digit)
Source: Ministry of Commerce, Pakistan
In order to assess the potential in these items, the codes were collapsed to the HS-6
digit level and then re-classified according to Pakistan’s customs classification.
However, it needs to be mentioned that in the process of aggregation, some products
which were not on the negative list at the 8 digit level, got included as well. Hence, at
the HS-6 digit level, there were 788 items on Pakistan’s negative list. Five categories,
namely auto, electrical machinery, textiles, steel and pharmaceuticals accounted for
almost 90 percent of the export potential on the negative list (Table A9 Column 2);
385
137 92 83 74 54 49
0
100
200
300
400
13
within which, auto alone accounted for around 30 percent of the export potential on the
negative list. In addition, India’s export potential in items that are included in
Pakistan’s negative list is largest in automobiles (included largely in the category
vehicles, aircraft, vessels and transport) accounting for 12 percent of India’s total
export potential to Pakistan (Table A5 Column 6).
To identify specific commodities on Pakistan’s negative list that are ‘vulnerable’ to
competition from imports, paired RCA’s were computed for every item traded between
India and Pakistan. Vulnerable items identified through this exercise were those in
which India had RCA>1 but Pakistan had RCA<1 (Taneja et al. 2011). Thus in the
automobile sector which accounted for the highest export potential on the negative list,
out of a total of 167 items, only 35 were vulnerable as these were items in which India
is globally competitive but Pakistan is not (Table A9 Columns 3 and 5; Table A12).
Similarly in textiles, out of 74 items on the negative list, Pakistan is vulnerable only in
25, or 34 percent of the items (Table A9 Columns 3, 5 and 6).
India’s export potential in items that are included in Pakistan’s sensitive list under
SAFTA is largest in automobiles (included largely in the category vehicles, aircraft,
vessels and transport) accounting for 37 percent of export potential of sensitive list
items (Table A10 Column 2) and 12 percent of India’s total export potential (Table A5
Column 8). However, out of 70 items on the sensitive list in this category, Pakistan is
vulnerable in only 19 items (Table A10 Columns 3 and 5). In terms of number of items,
textiles sector was the largest accounting for 24 percent of total number of items on the
sensitive list (Table A10 Column 4). But these accounted for only 4 percent of India’s
export potential for items on Pakistan’s sensitive list under SAFTA (Table A10 Column
2). Moreover, of the total 224 textile items on the sensitive list, Pakistan is likely to
face competition in only 41, or 18 percent of the items (Table A10 Columns 3, 5, 6;
Table A13).
India’s sensitive list under SAFTA has the largest number of items in the textiles sector
which accounted for 30 percent of the total number of items on the sensitive list (Table
A11 Column 4); while accounting for 62 percent of India’s import potential for items
on the sensitive list (Table A11 Column 2 and 4), and 14 percent of India’s total import
potential from Pakistan (Table A7 Column 6). Further, out of a total of 182 textile
items on the sensitive list, India is vulnerable in only 45, or 25 percent of the items
(Table A11 Columns 3, 5 and 6; Table A14).
It can hence be inferred that while Pakistan considers its automobile sector most
susceptible to competition, India fears competition in the textile sector. However, the
tendency for both countries has been to protect several tariff lines in which neither
partner is competitive.
In Pakistan the automobile sector is highly protected. The automotive industry was set
up initially by Japanese, European and Korean manufacturers. These assemblers are
14
supported by the auto component manufacturers or vendors. Some of the assemblers
have joint ventures with the component manufacturers while others are independent.
During 1985-2006 the industry adopted a ‘Deletion Program’ which mandated a
compulsory localization of components over a period of time to provide protection to
the local vendor industry (USAID and Government of Pakistan 2007). In order to
comply with WTO on Trade and Investment, the Deletion Program was abandoned but
the sector continued to be protected by high tariffs. Pakistan currently imports
completely-knocked down-kits (CKDs) and semi-knocked down kits (SKDs) from
Japan, and parts from Thailand at higher prices than those from India. Opening of trade
with India will make cheaper parts available to the industry (Trade Development
Authority of Pakistan 2012). India’s automobile vendor industry had a similar protected
regime including an equivalent of Pakistan’s Deletion Program for the automobile
manufacturers. With continuous liberalization India has become a global R&D and
small-car manufacturing hub (India Brand Equity Fund (IBEF) 2012). Indian auto
component manufacturers on the other hand are moving up the value chain and
delivering complex products though largely for the domestic market (IBEF). The
Government’s Automotive Mission Plan (AMP) 2006-2016 visualizes India moving up
the value chain and entering into R&D, design and manufacture of automobiles and
auto components (National Manufacturing Competitiveness Council 2011). Pakistan
can learn from India’s experience of opening up the automobile and auto component
industry. Moreover, one of the major factors for the significant performance
improvement in Pakistan’s motor cycle industry is attributed to the opening up of
Pakistan’s market to imported Chinese components (Pursell et al. 2011). Thus there is a
case for Pakistan to further liberalize its auto sector. Currently, there is hardly any
direct trade in auto components between India and Pakistan and most of the trade is
routed via Dubai, according to the Automotive Component Manufacturers Association
of India.
On the other hand India’s textile and clothing sector has been one of the most protected
sectors in India. Until 2005, readymade garments were reserved for exclusive
manufacture by small scale firms; large firms were not permitted to manufacture these
items. To protect the domestic industry, textiles and readymade garments were also
subjected to high import duties and specific duties which were applied in quantitative
terms and not on ad-valorem basis. In fact some of the ad-valorem rates exceeded 300
percent (USTR 2012). In 2005, the readymade garment items were removed from the
reserved list thereby allowing large firms to enter into manufacturing. However, these
items continued to be on the sensitive lists of India’s free trade agreements even
thought the rationale for protecting the industry was no longer there (Taneja et al.
2011). It was only in 2008 that India removed 164 textile items from the sensitive list
for LDCs under SAFTA and offered duty free access. In 2011, all textile items were
allowed duty free access from LDCs. Sri Lanka was offered duty free access to 215
textile items under the India-Sri Lanka Free Trade Agreement in 2008. Similarly, a
complex system of subsidies and taxes oriented the mill sector (spinning and yarn)
powerfully towards the small-scale power-loom based weaving sector, which in turn
15
was oriented primarily towards domestic consumption (Tewari 2005). In 2011-12, the
mill sector accounted for only 5percent of the total cloth produced by the mill and
power loom sectors (Economic Survey, Government of India 2011-12). However, there
is a distinct difference in the fabric produced by the two sectors. While the mill sector
produces high quality and high-value fabric, the fabric produced by the power looms is
of low quality and commands a lower price (US International Trade Commission
2001). Pakistan on the other hand has a strong yarn and fabric manufacturing industry
with India fearing is that imports from Pakistan would hurt its small and medium scale
sector. Fabric imports from Pakistan are more likely to compete with the mill sector in
India rather than the power loom sector thus providing no justification for India to
protect the large firms from imports. Also, as noted above, India does not face much
threat by opening up the Indian market to Pakistan’s textile sector as only 25 percent of
the textile items on India’s sensitive list fall in the ‘vulnerable’ category.
However it is agriculture that is the main point of contention in the ongoing trade talks.
Even though farmers in Pakistan are raising concerns over unfair competition from
Indian imports of agricultural products while they enjoy various subsidies, the negative
list has very few agriculture items. India’s export potential in tobacco items which are
on negative list is less than 1 percent of the total import potential of items on the
negative list (Table A9 Column 2). All the remaining agricultural items have been
removed from the negative list. However, farmers fear that if the land route is opened
to agricultural imports, then they would not be able to compete with Indian products
(Bhutta 2012).
Pakistan has always been concerned that due to high subsidies, the prices of agricultural
commodities are lower in India and therefore opening up of trade would have a
negative impact on the domestic producers. While India does offer subsidies, its non-
product specific subsidies are below 10 percent of the value of agricultural output,
abiding by the WTO rules (Hoda and Gulati 2013).
Further, it needs to be noted that prior to 1996 even when trade between the two
countries was limited to a handful of items on the positive list, agriculture was part of
this positive list, as it was not only an important means of overcoming short-term
fluctuations but was also important for maintaining domestic price stability. At the time
when Pakistan’s positive list expanded to 1963 items, 156 agricultural commodities
formed a part of this list.
While Pakistan may have genuine concerns regarding any adverse impact on its
agriculture sector due to a surge in agricultural imports from India, the solution should
be to seek safeguards within the WTO system and under SAFTA, rather than imposing
a total ban on agricultural commodities from India.
16
4.4 Trade Possibilities in Services
There are additional trade possibilities in services sector which is becoming
increasingly important in the economies of India and Pakistan. In 2011-12, this sector
accounted for 59 percent of India’s GDP and 54 percent of Pakistan’s GDP. Three
sectors, where there is potential include information technology and Business Process
Outsourcing (BPO), health services, and entertainment services.
India’s IT and BPO sector revenues were US$ 87.6 billion in 2011-12. Software
exports in 2011-12 were US$69 billion compared to US$59 billion in 2010-11. Exports
dominate the industry and constitute about 78.4 percent of total industry revenue.
Indian IT service offerings have evolved from application development and
maintenance to emerge as full service players providing testing and infrastructure
services, consulting, and system integration (Economic Survey, Government of India
2011-12). The BPO sector which initially offered only low value services is now
characterized by greater breadth and depth of services. Although the IT industry in
Pakistan is in its infancy, it is growing at a fast pace. IT exports in 2011 were US$ 440
million, up from US$ 432 million in the previous year (Balance of Payment Statistics,
IMF). This is one of the potential areas which could be exploited as both countries are
competing in information and information services. India and Pakistan can establish
joint ventures. While Pakistan could provide professionals at lower wages, Indian
companies could help in procurement of international contracts (Husain 2011). Pakistan
is emerging as an exporter of specialized software services such as gaming and
animation, financial services and healthcare, which Indian companies could import.
The two countries could also gain if India sets training institutes in Pakistan, or if
professionals from Pakistan come to India to get professional training. The BPO
segment in Pakistan is also growing. Government incentives to the international
outsourcing community include 100 percent equity ownership, 100 percent repatriation
of capital and dividends, and income tax exemption for IT companies till 2016
(Pakistan Software Export Board). India could collaborate with the BPO firms in
Pakistan to offer more value added services in this segment.
Healthcare service is another area in which there are opportunities for both countries.
India has emerged as an important destination for provision of medical services due to
affordable cost of treatment and advancement in the field of medicines. Several
Pakistani patients have been visiting India for medical treatment like liver transplant,
open heart surgery and kidney transplant (Ahmad 2012). Other specialty treatment is
also being offered to Pakistani patients. For instance, the Mumbai Obstetric and
Gynecological Society is providing treatment for infertility to Pakistani couples (Mid-
Day 2012). Despite a relatively tight visa regime, the number of patients coming from
Pakistan to India is on the rise. According to a report, the Indian High Commission in
Islamabad issued 1,992 medical visas to Pakistani citizens during 2008-2010. In
addition, 2,917 visas were issued to medical attendants during the same period. There is
a vast scope for cooperation in the health sector. In February 2012, a group of Indian
17
and Pakistani doctors jointly performed a complicated liver transplant procedure in a
Lahore hospital for the first time thereby opening new avenues for co-operation in the
area of healthcare services (Times of India 2011).
There are trade possibilities in the entertainment industry as well. India and Pakistan
share a common language and culture, thus providing scope for trade and co-operation
in the film industry. India is the second largest producer of movies in the world, while
Pakistan produces very few movies. Pakistan had imposed a ban on screening of Indian
films in 1965 following the Indo-Pak war (Chi undated). The purpose of the ban was
largely to protect the domestic film industry. However, despite the ban the Pakistani
film industry has not done well (The Express Tribune 2012). The ban was lifted in
2008, but since then there has been uncertainty in the policy as several ad-hoc steps
have been taken to ban Indian movies on a case by case basis. Through the years, the
ban has been practically ineffective as the demand for Indian movies in Pakistan is met
through pirated DVDs and satellite cable broadcasts of Indian films.
There is an interest in India and Pakistan for each other’s music- both audio and visual.
There is also an interest in Pakistan to watch Indian television serials and in India to
watch Pakistani plays. However, Pakistani entertainment channels are not broadcasted
on Indian channels whereas several Indian channels are broadcasted in Pakistan.
The trade potential in the entertainment industry particularly in films, television and
music can be tapped by encouraging joint productions. Removing the ban on screening
movies would benefit both the countries. Exchanging broadcasting rights to telecast
each other’s programmes on television is yet another trade opportunity for India and
Pakistan.
5. Realizing Trade Potential
For trade potential to be realized, the two countries would have to undertake several
measures in a number of areas. It is important to examine the regulatory regimes
related to transport, non-tariff barriers, and visas; and assess how these regimes operate
in practice. Effectiveness of these policies will also determine the extent to which
informal trade flows will steer towards formal channels. The policies related to
liberalization of foreign direct investment also need to be examined as realization of
cross-border investment will lead to deeper trade linkages. It is also important to assess
the visa regime and the extent to which it is likely to get liberalized. The role of
institutions in supporting the trade liberalization process also needs to be assessed as
they would play a key role in helping realize the untapped trade potential between India
and Pakistan.
18
5.1 Transport and Transit
Most discussions and studies on the transport issue have focussed on the impediments
related to the land route. While the sea route has always been operational, it went
unnoticed due to the restrictive maritime protocol. This protocol allowed only Indian
and Pakistani flagships to carry cargo between India and Pakistan. This arrangement
restricted competition from foreign vessels, and therefore resulted in high sea freight
rates being charged by Indian and Pakistani vessels. The amendment of this protocol in
2005 brought sea trade between the two countries under global maritime arrangements,
leading to greater competition, and therefore, to a considerable reduction in costs for
sea-based trade between Mumbai and Karachi.
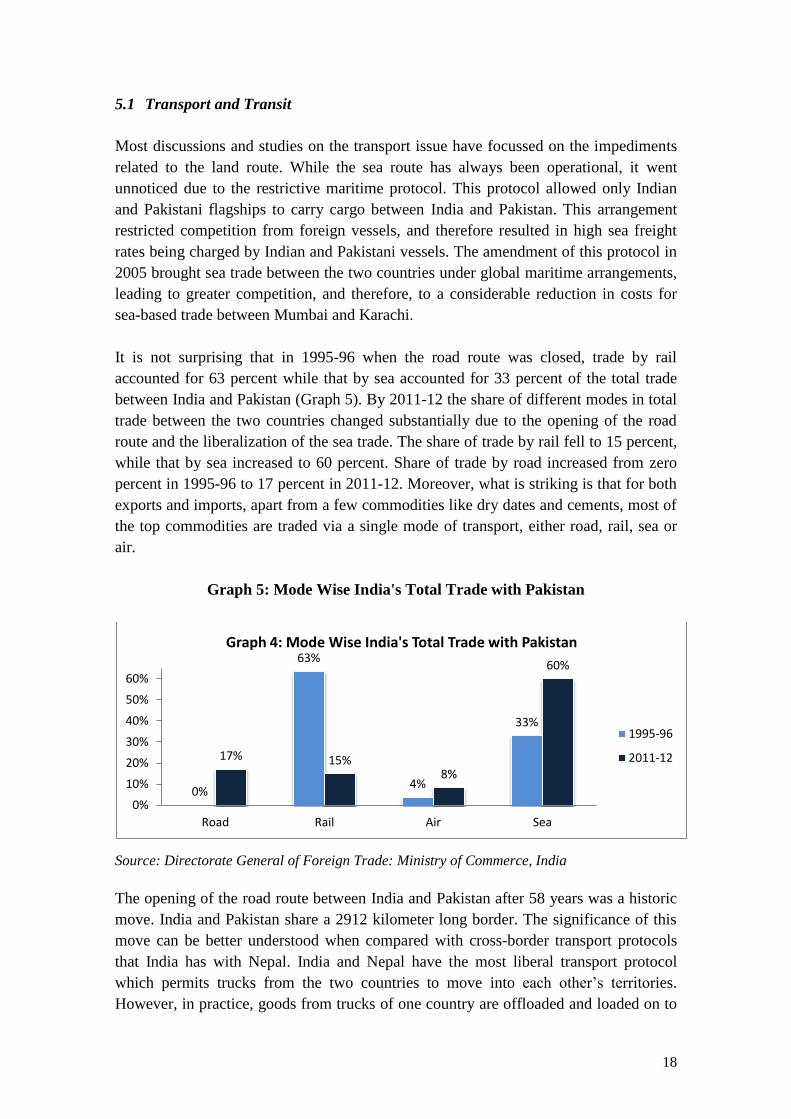
It is not surprising that in 1995-96 when the road route was closed, trade by rail
accounted for 63 percent while that by sea accounted for 33 percent of the total trade
between India and Pakistan (Graph 5). By 2011-12 the share of different modes in total
trade between the two countries changed substantially due to the opening of the road
route and the liberalization of the sea trade. The share of trade by rail fell to 15 percent,
while that by sea increased to 60 percent. Share of trade by road increased from zero
percent in 1995-96 to 17 percent in 2011-12. Moreover, what is striking is that for both
exports and imports, apart from a few commodities like dry dates and cements, most of
the top commodities are traded via a single mode of transport, either road, rail, sea or
air.
Graph 5: Mode Wise India's Total Trade with Pakistan
Source: Directorate General of Foreign Trade: Ministry of Commerce, India
The opening of the road route between India and Pakistan after 58 years was a historic
move. India and Pakistan share a 2912 kilometer long border. The significance of this
move can be better understood when compared with cross-border transport protocols
that India has with Nepal. India and Nepal have the most liberal transport protocol
which permits trucks from the two countries to move into each other’s territories.
However, in practice, goods from trucks of one country are offloaded and loaded on to
0%
63%
4%
33%
17% 15% 8%
60%
0%
10%
20%
30%
40%
50%
60%
Road Rail Air Sea
Graph 4: Mode Wise India's Total Trade with Pakistan
1995-96
2011-12
19
the other country’s trucks at the border. This is because when trucks move from one
country to the other, the local mafia extorts money from the foreign trucks. Thus,
transshipment continues to occur because these informal payments are higher than the
cost of transshipment. Hence there is a need to strengthen institutions at the border for
effective implementation of policies. On the other hand, the opening up of the road
route between India and Pakistan has met with relatively little opposition. Indeed, the
institutional framework supporting trade between the two countries is strong enough to
counter lobbyists and interest groups that may have resisted such a change. This raises
immense hopes for successful implementation of further trade-facilitating measures at
the land border between India and Pakistan.
Amritsar and Lahore are the two major cities on either side of the border separated by a
distance of only 54 kilometers. Hence, the transport costs for goods moved via land
route between northern India and northern Pakistan could be substantially lower than
the sea route. Recognizing the importance of the land route, India opened an Integrated
Check Post (ICP) at Attari in April 2012, with new facilities including a trade gate that
would house all trade activities under one unit including warehousing and other
facilities. Timings for trade were increased to 12 hours every day for all days of the
week. While the ICP is operational, the two most important facilities that are underway
include automated systems for electronic filing of customs documents through the
Electronic Data Interchange (EDI) facility and installation of truck scanners. This is a
marked change from the past, when there was only one gate for trade and for
passengers, trade timings were limited to only 7 hours daily, and no warehousing
facilities were offered.5
In a short span of just six months – between April and October 2012, the warehouse has
reached full capacity.6 This in turn limits the entry of trucks from across the border.
The question is whether these facilities will be able to bear additional cargo load which
is likely to occur for two reasons- Pakistan’s move to normalize trade on the road route
by allowing all items to be imported from India via road, instead of the existing list of
only 137 items; and a likely shift in trade from the sea to road route due to lower
transaction costs in the latter. The ICP, when conceived by the Indian government
clearly did not envisage such a paradigm change in trade between the two countries.
The trade would increase further if the two governments agreed to move containerized
cargo by road. Allowing these trucks to move in each other’s territory is yet another
measure that would reduce transaction costs further. The two governments are also
considering opening up of new road routes. The option of opening the Munabhao-
Khokhrapar road route was discussed in the seventh round of talks between the two
governments.
5Interviews with traders and officials in Amritsar in 2012
6Ibid
20
The rail route was the dominant land-transport mode for India-Pakistan trade for
several years. The rail route’s relative importance over the sea and road route has
declined as it continues to be limited in its reach. Goods transported by the goods train,
often referred to as “interchange train”, or by parcel wagons; are attached to the
Samjhauta Express passenger train which runs on a biweekly basis carrying 6 to 10
parcel wagons. Since the capacity of Samjhauta Express is limited, most of the rail
cargo is carried by the interchange train. Earlier studies have pointed out that the
existence of only one rail route through the Attari/Wagah border, poor quality of rolling
stock and restriction on the type of wagons are some of the problems that traders faced
(Taneja 2006). Also, traders in Kolkata, located in eastern India, find it difficult to trade
through the Attari/Wagah land border because of lack of information on how to trade
by the rail route. Therefore, they send consignments by sea to Colombo, which are then
transshipped to Karachi (Taneja 2007).
Since 2007, there has been a deterioration in interchange train services. Goods by the
interchange train move only between Amritsar and Lahore through the Attari rail
station, with just the Pakistani wagons plying on this route, unlike earlier when Indian
wagons also plied on the rail route. Cargo for export either comes in Indian wagons
upto Amritsar where it is unloaded and then loaded onto Pakistani wagons; or it is
loaded on trucks to be sent through Wagah. Transshipment of cargo from Indian to
Pakistani wagons or onto trucks adds considerable time and cost to transporting goods.
Even though infrastructure has improved with the ICP, these facilities do not extend to
rail cargo movement. The railway line is about three kilometers away from the ICP.
The agenda for improving rail transport remains largely unaddressed. While the 7th
round of talks agreed to increasing the number of interchanges to 3-4 in a day and
allowing high capacity wagons to ply, the discussions so far have only covered the
immediate needs of facilitating rail transport.
The ongoing bilateral dialogue between India and Pakistan has so far not addressed the
issue of transit. India has not allowed Pakistan to access Nepal, Bangladesh, and
Bhutan through its territory. Similarly, Pakistan has not given any transit rights to India
to access Afghanistan for its exports. However, Pakistan offered transit rights to
Afghanistan’s exports through its territory to reach the Indian market in 1948. In July
2010, Afghanistan and Pakistan signed an amended transit trade agreement, the
Afghanistan-Pakistan Transit-Trade Agreement (APTTA), which provides for an
increased number of transport routes available to trucks from Afghanistan and Pakistan.
However, the APTTA does not allow India’s exports to Afghanistan through Pakistan
via the land route. In order to increase their gains from the trade normalization process,
India and Pakistan must put this transit issue on their dialogue agenda. This would also
have huge implications for reviving the Afghan economy. Afghanistan can gain little
through trade given its limited export capability but it can take advantage of its
geographical location by converting into a logistic hub and offering a whole range of
logistic services that could help transport goods between South and Central Asia. It
21
follows that India should also allow transit facility to Pakistani goods for accessing the
Nepal and Bangladesh markets.
There is need to develop a long term vision and plan for road and rail cargo movement
by the land route. Limiting the opening of the land route to just the land border is not
enough. Freight costs are often determined by the freight trade balance between two
countries. Since India has a trade surplus with Pakistan, India’s cargo trucks/wagons
moving back from Pakistan will not be fully loaded, with empty wagons adding
considerably to transaction costs. However, if the trucks/wagons are allowed cross-
border movement and multimodal-transportation is permitted, cargo balancing could be
achieved by linking the sea ports of Mumbai and Karachi through the land route, with
the sea ports largely connecting the rest of the world. Similarly transit through Pakistan
can link Indian sea ports with Afghanistan and to rest of Central Asia through Pakistan.
5.2 Non-Tariff Barriers
For many years Pakistani government has expressed that their businessmen face non-
tariff barriers in accessing the Indian market (Taneja 2007, Taneja et al. 2008 and
2011a). On this issue, it was recognized by both countries during the talks that there
were no Pakistan-specific barriers but a general lack of awareness amongst Pakistani
businessmen on the regulatory regimes in India. In a study conducted in 2008 for the
Task Force on Non Tariff Measures (NTMs) it was found that while these NTMs were
not discriminatory, the procedures relating to product standards were cumbersome,
some regulations lacked transparency, and there were problems related to recognition
of standards. The two governments however felt that it was important to address the
perceived barriers as well. In September 2011, the Indian government arranged
interactive sessions between the Indian regulators and Pakistani businessmen in New
Delhi to help increase awareness amongst the latter on India’s regulatory policies. Such
a session was subsequently held in Pakistan in January 2012.
This government-to-business interaction is an innovative and effective method of
addressing information gaps on the regulatory environment of India and Pakistan.
Recently, the Trade Development Authority of Pakistan supported experts to undertake
a study that identified potential products for exports to India, including tariff and non-
tariff barriers that Pakistani businessmen faced. The findings of the study were
subsequently disseminated across ten cities in Pakistan to inform the businesses on
India’s regulatory regimes. Some of the reported barriers included over valuation of
goods, tedious packaging and labeling requirements, access to limited number of ports
for some products, lack of testing facilities at ports, inadequate infrastructure,
mishandling of goods, and theft of cargo at ports. Businesses were also educated on the
use of WTO compliant trade defense instruments and how they could be used to restrict
imports which could hurt the domestic industry. Such a government supported
awareness initiative, if done on a sustained basis every few years, could have a long
term impact on dispelling notions and misconceptions of perceived barriers amongst
22
businessmen willing to access the Indian market. It shall also help in raising awareness
on genuine non-tariff barriers, and equipping businesses to deal with expanded imports
if they hurt their domestic industry.
In another initiative to address non-tariff barriers, Governments of India and Pakistan
signed three agreements in September 2012; including a customs cooperation
agreement to help avoid arbitrary stoppage of goods at each other's ports, a bilateral
cooperation agreement on mutual recognition between ‘Pakistan Standard and Quality
Control Authority (PSQCA)’ and ‘Bureau of Indian Standards (BIS)’; and an
agreement on redressal of trade grievances between Pakistan and India. Non-tariff
barriers of a different nature were identified in some studies (Taneja 2006, 2007). It
was found that Pakistani consignments were subjected to excessive checks- usually due
to security concerns causing harassment to genuine traders. Marketing and labeling
issues relating to the perceived ‘image’ of Pakistani goods was also pointed out in
recent studies. For instance, the label on Pakistani bed linen was changed to European
and Indian labels for sale in the Indian market (Trade Development Authority of
Pakistan 2012). Holding exhibitions, such as the Pakistan Mega Lifestyle Exhibition
held in Delhi in April 2012 and the Made in Pakistan Expo held in August 2012 in
Mumbai, could aid acceptance of Pakistani goods in India. In September 2012, the
Pakistan Fashion Design Council7 opened an outlet in an up-market shopping complex
in New Delhi. Such steps will certainly raise awareness among Indian consumers about
Pakistani products.
Indian products too face a labeling issue, with their Pakistani counterparts advising on
dropping the ‘Made in India’ label to accentuate sales in Pakistan.8 However, newer
products such as sweets and snacks, manufactured by a large Indian firm, have made a
successful entry in the Pakistani market under the Indian label.9
Though measures to mitigate NTB’s have been undertaken, addressing them is not a
one-time effort. India and Pakistan need to identify, deal with, and address new NTB’s
on a continuous basis, as and when they are raised.
5.3 Informal Trade
The restrictive trade environment, has led to large informal trade flows between India
and Pakistan, estimated to range from US$ 250 million to US$ 3 billion. The most
detailed study on Indo-Pakistan informal trade estimated its value at around US$ 545
million in 2005 (Khan et al. 2007). Of this, Pakistan’s imports from India are estimated
to be around US$ 535 million and exports to India US$ 10.4 million. The main import
items from India, via informal channels, are cloth, tires, pharmaceuticals, textile
7 A leading design store which brings together more than 60 designers from all over Pakistan
8Interviews with manufacturers who are trying to enter the Pakistani market after their products were
included in the positive list. 9Interview with an exporter of packaged sweets and snacks to Pakistan under the Indian label.
23
machinery, cosmetics, livestock and medicines; accounting for roughly 80 percent of
total informal import value. Pakistan’s informal exports mainly consist of textiles;
accounting for approximately 90 percent of the total informal trade.
It is interesting to note the modalities of India-Pakistan informal trade, with most of the
trade flowing via third country. Khan estimates trade via Mumbai-Dubai- Karachi
route to be around 88 percent of total informal trade, and the remaining as cross border
informal trade through the Amritsar-Lahore and Sind-Rajasthan border routes.
However, almost 51 percent of informal trade taking place via Dubai does not reach
Karachi directly as goods are transshipped from India to Dubai from where they are
shipped to Bandar Abbas in Iran and then moved further via land across Afghanistan, to
finally reach Pakistan. Only about 18 percent of informal trade takes place through the
sea route from India to Karachi via Dubai.
While these estimates are dated, they provide useful insights into the functioning of
informal trade markets. It is reasonable to assume that individuals trading through the
informal channels have devised parallel institutional mechanisms for contract
enforcement and dispute settlement. Also, the smooth functioning of such markets
shows that traders have developed efficient mechanisms for obtaining information on
quantities and commodities to be traded and mitigating risks that might arise in the
unofficial transacting environment (Taneja 2004).
The move towards trade normalization and a parallel reduction in tariffs and non-tariff
barriers would certainly lower informal trade flows between India and Pakistan.10
Trade
through Dubai is likely to decrease sooner if there are active channels of information
that would bring buyers and suppliers on either side together in order to conduct trade
directly with each other rather than through third parties. Elimination of the negative
list would also allow export of many items that had to be routed via Dubai and other
informal channels of trade. Until all such measures are fully implemented, informal and
formal trade between India and Pakistan are likely to co-exist.
5.4 Visas
A lot needs to be done in simplifying the visa regime between India and Pakistan.
Grant of city-specific visa, the requirement of police reporting on arrival and before
departure, the restriction on going beyond the port of entry, and delays in getting a
visa have limited market access for aspiring traders (Taneja et al. 2011a).
Consulates in both countries have exercised tremendous discretionary power in
granting visas and waiving visa requirements along with allowing some traders to be
exempted from scrutiny by the Ministry of Home Affairs in India and Ministry of
Interior Affairs in Pakistan. They have also allowed extended period of stay, exempted
10
Interviews with traders in Dubai in 2012
24
traders from police reporting, and removed restrictions on the number of cities that can
be visited. Selected traders who are beneficiaries of such largesse can make repeated
visits and enhance their Pakistan specific trade information; which remains inaccessible
for other aspiring traders due to restricted market access, lack of transparency, market
imperfections, and information asymmetries. However, Indian officials argue that, for
the sake of security, rigorous screening of visas is essential. While it is true that no
compromise can be made on national security issues, it needs to be recognized that
genuine traders often become victims of a strict visa regime.
The new visa agreement was signed between India and Pakistan in September 2012.
The agreement introduces measures to ease travel of tourists, pilgrims, elderly and
children to facilitate people-to-people contact between the two countries. The business
visa has also been made more liberal, allowing one year multiple entry visas for upto 10
places with exemption from police reporting for those reporting a turnover of at least
Rs. 30 million or equivalent in Pakistani Currency.11
The new visa regime is a step forward towards easing the channel for information
exchange on trade-related matters between India and Pakistan. As a next step the
countries could consider the use of electronic systems that would assist in having
adequate and effective security systems in place while at the same time allowing
genuine traders to trade across borders.
5.5 Foreign Direct Investment
Investment flows play an important role in deepening trade linkages, and raising market
access between the countries involved. For several years India did not permit FDI
inflows from Pakistan. In a move to normalize economic ties between the two
countries, in August 2012 the Department of Industrial Policy and Promotion (DIPP)
India announced changes in the Consolidated FDI Policy to allow investment from
Pakistani firms and individuals in all sectors- except defense, space and atomic energy-
through government route. Following this, India recently removed Pakistan from the
negative list under the Foreign Exchange Management Act (FEMA), paving the way
for investment from Pakistan. The FEMA regulations have also been amended to allow
Indians to invest in Pakistan.
In 2011, Pakistan’s total outward FDI flows were only US $62 million. While country
and sector-wise break-up of FDI outflows from Pakistan is not available, data from
Board of Investment in Bangladesh indicates that Pakistan has invested in textile firms
there. Pakistan has also invested in Sri Lanka in the food processing and construction
sectors (Vaqar 2012). In the Indian context, the possible sectors attracting FDI could be
textiles and cement (Mishra 2012). A bilateral investment treaty between India and
11
For those businessmen whose turnover is Pakistani Rs. 3 million or equivalent, a one year visa
allowing visit to five places, for upto four entries, will be permitted.
25
Pakistan in near future will help boost both the safety of investments and investor
confidence (Taneja and Bimal 2012). Considering that due to inhibitions the business
interest may not be forthcoming immediately, an interesting solution offered by
businessmen has been to set up joint ventures between India and Pakistan without
physically locating in each other’s countries. Investment ventures set up in this manner
could pave the way for raising investor confidence in the future. During the course of
our industry consultations, sectors with potential for investment were identified to be
agriculture, fertilizer, drip irrigation, tissue culture, seeds, herbal extracts,
biotechnology, mining and mining equipment, dairy and livestock, tourism and tourism
infrastructure, textile machinery, heavy engineering and earthmoving machinery, and
entertainment12
.
5.6 Institutions Engaged in Trade Normalization
Trade normalization efforts have been driven at multiple levels on sides of India and
Pakistan. All bilateral talks are spearheaded by the Ministry of External Affairs. Other
important government departments involved are the Ministry of Commerce and the
Ministry of Home Affairs. The former is leading the trade negotiating agenda while the
latter has the primary responsibility of maintaining security. In India, two key
functions performed by the Home Ministry in the context of trade include issuance of
visas and border management. As part of its border management functions, Land Ports
Authority of India (LPAI) was set up in April 2012 to provide cohesive management of
cross-border movement of people and goods. On the side of Pakistan, the road port is
managed by the National Logistics Cell, which falls under the purview of the Ministry
of Defence.
With respect to their bilateral visa regime, the Ministry of Home Affairs in India and
Pakistan have taken progressive steps. The bureaucracy in India, arranged in vertical
and hierarchical levels, seems to have accepted the pace of change set in motion by the
trade normalization process. Even though, the issue of cross border terrorism often
appears in bilateral talks, so far there has been no attempt to link it to the trade agenda.
The Indian and Pakistani military forces are also not seen as adversaries in the trade
normalisation process. The involvement of NGO’s too is quite limited.
The business communities in both countries have been actively engaged in pursuing the
trade liberalization agenda through the Chambers of Commerce for several years. In
India, the Federation of Indian Chambers of Commerce and Industry (FICCI), the
Confederation of Indian Industry (CII), the Associate Chambers of Commerce
(ASSOCHAM), and the Punjab, Haryana and Delhi Chambers of Commerce and
Industry (PHDCCI) have taken the initiative to facilitate cross border interactions
between business delegations and communities to assess trade possibilities. Since the
12
Summary Of Proceedings, Regional Chambers of Commerce Roundtable, Lahore January 10, 2013
26
initiation of the trade normalization process, such cross-border interactions have
increased manifolds.
Academic discourse in India has largely focused on the political issues between India
and Pakistan to have implications on trade normalization between the two countries.
Until recently, the print and visual media too were engaged largely in ‘negative’
reporting as there was a tendency to report conflict rather than any peace initiatives
undertaken by the two sides. Even the proposed grant of MFN status did not make
headlines in any of the major news dailies. There is however, an evident shift towards
positive reporting in the media on peace initiatives and trade co-operation which can
have a huge impact on the perceptions of civil society towards relations shared by India
and Pakistan.
6. Conclusion
The trade normalization process will unleash trade opportunities for both India and
Pakistan. Even though the automobile sector in Pakistan and the textile sector in India
have resisted trade liberalization, there is no rationale for holding back the process
which shall inevitably benefit both the countries.
India and Pakistan need to work together in several areas to be able to realize the
untapped trade potential. So far only incremental steps are being considered by the two
governments to improve cross-border movement of goods. A comprehensive and
integrated international land transport policy needs to be put in place not only to
provide rail and road services connecting the two countries but also linking sea ports
through land borders to enable connectivity with the rest of the world as well.
India should continue to lower its non-tariff barriers as part of its ongoing reform
process. In addition, a more concerted effort needs to be made to facilitate businessmen
in overcoming their apprehensions about entering each other’s markets and selling their
products along with their country labels across the border fearlessly. The unprecedented
number of exhibitions and fairs held in India and Pakistan, displaying each other’s
products, has been met by an overwhelming response from consumers; providing
support for such efforts to continue.
While the removal of restrictions on FDI flows has opened up new investment
opportunities, businessmen from India and Pakistan are reluctant to invest due to fear of
a possible disruptive political event. Investors also fear becoming easy targets for those
who oppose their presence. Businessmen willing to invest could enter into joint
ventures without physically locating in each other’s territory, as the first step to entry,
till legal systems safeguard investments and there is improvement in investors’
confidence.
27
For a liberal visa regime to be in place, electronic ‘smart systems’ should be used to
screen visa applications and track physical movement of people, while avoiding undue
harassment to genuine traders. Telecommunication channels also need to be opened up
to foster people-to-people contact and reduce business costs. The existing
communication system between India and Pakistan does not permit travelers to use
their mobile phones in the other’s country. Buying local SIM (Subscriber Identity
Module) cards too is not an easy option, involving a lot of paper work for those
travelling. As a result, visitors and businessmen have developed informal mechanisms
of procuring local SIM-cards through friends and relatives. The issue of improving
telecommunication between the two countries was raised in the 7th
round of talks and is
expected to be a part of the trade normalization process.
India and Pakistan need to constantly engage with one another to understand each
other’s regulatory regimes. As new businessmen enter into trading relations, it is
important to have forums that bring buyers and sellers together. Guaranteed payments
are essential for building new and lasting business partnerships, for which banking
channels would need to be improved. An innovative dispute resolution system should
also be put in place. For many years, Dubai has provided as a facilitator for trade and
guaranteed payments between India and Pakistan. Thus, a third country wherein India
and Pakistan share mutual trust could provide for an effective dispute resolution
mechanism. Moreover, it is important for the business communities to create multilevel
channels of communication which can reduce misconceptions, bridge information gaps,
and generate a significant change in the business environment of the two countries. All
such holistic measures could help in realizing the untapped trade potential between
India and Pakistan.
28
References:
Ahmad, M. (2012), “Vast scope for health sector cooperation”, The News International,
May 7.
Balassa, Bela (1965), ”Trade Liberalization and Revealed Comparative Advantage,
"Manchester School of Economic and Social Studies, 33, 99-123
Batra, A. (2004), “India’s Global Trade Potential: The Gravity Model Approach”,
Working Paper No. 151, ICRIER.
Bhutta, Zafar (2012) “Duty free imports: Farmers fear they will lose in the import deal
with India”, The Express Tribune, November 16
Chi, Jacquelyn (undated), “Pakistan’s Film Industry: An Analysis of the 1965 Ban on
Indian Films”, Culture and Communication Consulting, Retrieved from
Gary Pursell et. al. (2011), “Pakistan’s Trade Policies: Future Directions”, Working
Paper 11/0361, IGC, London
Government of India (2011-12), “Economic Survey”, Ministry of Finance
Hoda, A. and Gulati, A. (2013), “India’s Agricultural Trade Policy and Sustainable
Development Goals”
Husain, I. (2011), “Prospects and Challenges for Increasing India-Pakistan Trade”,
Atlantic Council
India Brand Equity Fund (2012), “India’s Automobile Sector”, Retrieved from
http://www.ibef.org.
India Brand Equity Fund, “Indian Manufacturing: Profit Potential and Opportunities
across the Value Chain”, Retrieved from http://www.ibef.org.
Khan, Rafi S., Yusuf M., Bohkari S., and Aziz S. (2007),”Quantifying Informal Trade
between Pakistan and India”, In Naqvi Zareen Fatima and Philip Schuler, eds.
‘The Challenges and Potential of Pakistan India Trade’
Mid-Day (2012), “Pakistani Children Could Soon be 'Made in Mumbai”, April 11.
Mishra, A.R. (2012), “Pakistan Cement Maker Lucky Eyes Plant in India” Livemint,
November 22. Retrieved from
http://www.livemint.com/Industry/nWMpF7XeDeUrnSuN8778NL/Pakistan-cement-maker-
Lucky-eyes-plant-in-India.html
29
National Manufacturing Competitiveness Council (2011), “Methodology for
Measuring the Logistics Cost For Major Manufacturing Exports and Assessing
its Impact on their Competitiveness”
Pakistan Software Export Board (Undated), “About us”, Retrieved from
http://www.pseb.org.pk/about-us.html
Rahman, M., Shadat, W.B., and Das, N.C. (2006), “Trade Potential in SAFTA: An
Application of Augmented Gravity Model”, Paper 61. Dhaka: Centre for Policy
Dialogue
Taneja, N. (2004), “Informal Trade in the SAARC Region: Implications for FTAs”,
Economic and Political Weekly, December 18.
Taneja, N. (2006), “India Pakistan Trade”, Working Paper No. 182, Indian Council for
research on International Economic Relations, New Delhi
Taneja, N. (2007), “Trade Possibilities and Non-tariff Barriers to Indo-Pak Trade”,
Working Paper No. 200, Indian Council for research on International Economic
Relations, New Delhi
Taneja, N., Rastogi, R. and Rai S. (2008), “Examining NTMs/PTMs by India in the
context of SAFTA”, Report prepared for the Ministry of Commerce,
Government of India
Taneja N., Ray S., Kaushal N., Chowdhury D.R. (2011), “Enhancing Intra-SAARC
Trade: Pruning India’s Sensitive List under SAFTA”, Working Paper No. 255,
ICRIER, New Delhi.
Taneja, N., Prakash, S., Kalita, P. (2011a), “Issues in India-Pakistan Trade
Negotiations”, Economic and Political Weekly, Vol. XLVI, No. 30, July
Taneja N. and Bimal S. (2012), “FDI- a major milestone”, The Hindu Business Line,
August 22
Tewari, M (2005), “Post-MFA adjustments in India’s Textile and Apparel Industry:
Emerging Issues and Trends”, Working Paper No. 167, ICRIER.
The Express Tribune (2012), “Should Indian films be banned in Pakistan”, July 25.
Retrieved from http://tribune.com.pk/story/412954/should-indian-films-be-
banned-in-pakistan/
30
Times of India (2011), “India, Pakistan doctors perform joint liver transplant in
Lahore”, February 11.
Trade Development Authority of Pakistan (2012) “Normalization of Trade with
India: Opportunities and Challenges for Pakistan”
U.S. International Trade Commission (2001), “India’s Textile and Apparel Industry:
Growth Potential and Trade and Investment Opportunities”, Publication 3401
USAID and Government of Pakistan (2007), “Policy Analysis on Competitive
Advantage of Automotive Vendor Industry in Pakistan,” May, Islamabad.
USTR (2012), Foreign Trade Barriers, India. Retrieved from
http://www.ustr.gov/sites/default/files/India_0.pdf
Vaqar, A. (2012), “Pakistan’s FDI in India: Potential and Prospects”, India Pakistan
Trade Newsletter, October. Retrieved from
http://indiapakistantrade.org/data/ICRIER%20India%20Pakistan%20Newsletter
%20for%20web%20upload.pdf
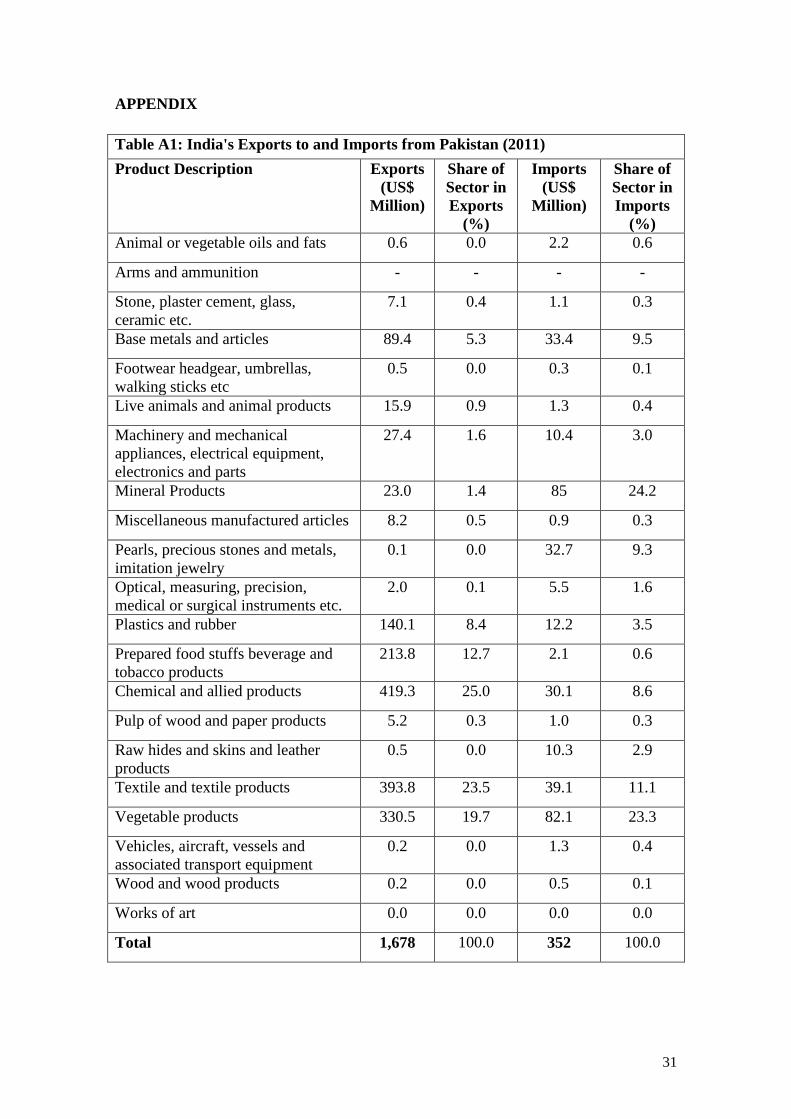
31
APPENDIX
Table A1: India's Exports to and Imports from Pakistan (2011)
Product Description Exports
(US$
Million)
Share of
Sector in
Exports
(%)
Imports
(US$
Million)
Share of
Sector in
Imports
(%)
Animal or vegetable oils and fats 0.6 0.0 2.2 0.6
Arms and ammunition - - - -
Stone, plaster cement, glass,
ceramic etc.
7.1 0.4 1.1 0.3
Base metals and articles 89.4 5.3 33.4 9.5
Footwear headgear, umbrellas,
walking sticks etc
0.5 0.0 0.3 0.1
Live animals and animal products 15.9 0.9 1.3 0.4
Machinery and mechanical
appliances, electrical equipment,
electronics and parts
27.4 1.6 10.4 3.0
Mineral Products 23.0 1.4 85 24.2
Miscellaneous manufactured articles 8.2 0.5 0.9 0.3
Pearls, precious stones and metals,
imitation jewelry
0.1 0.0 32.7 9.3
Optical, measuring, precision,
medical or surgical instruments etc.
2.0 0.1 5.5 1.6
Plastics and rubber 140.1 8.4 12.2 3.5
Prepared food stuffs beverage and
tobacco products
213.8 12.7 2.1 0.6
Chemical and allied products 419.3 25.0 30.1 8.6
Pulp of wood and paper products 5.2 0.3 1.0 0.3
Raw hides and skins and leather
products
0.5 0.0 10.3 2.9
Textile and textile products 393.8 23.5 39.1 11.1
Vegetable products 330.5 19.7 82.1 23.3
Vehicles, aircraft, vessels and
associated transport equipment
0.2 0.0 1.3 0.4
Wood and wood products 0.2 0.0 0.5 0.1
Works of art 0.0 0.0 0.0 0.0
Total 1,678 100.0 352 100.0
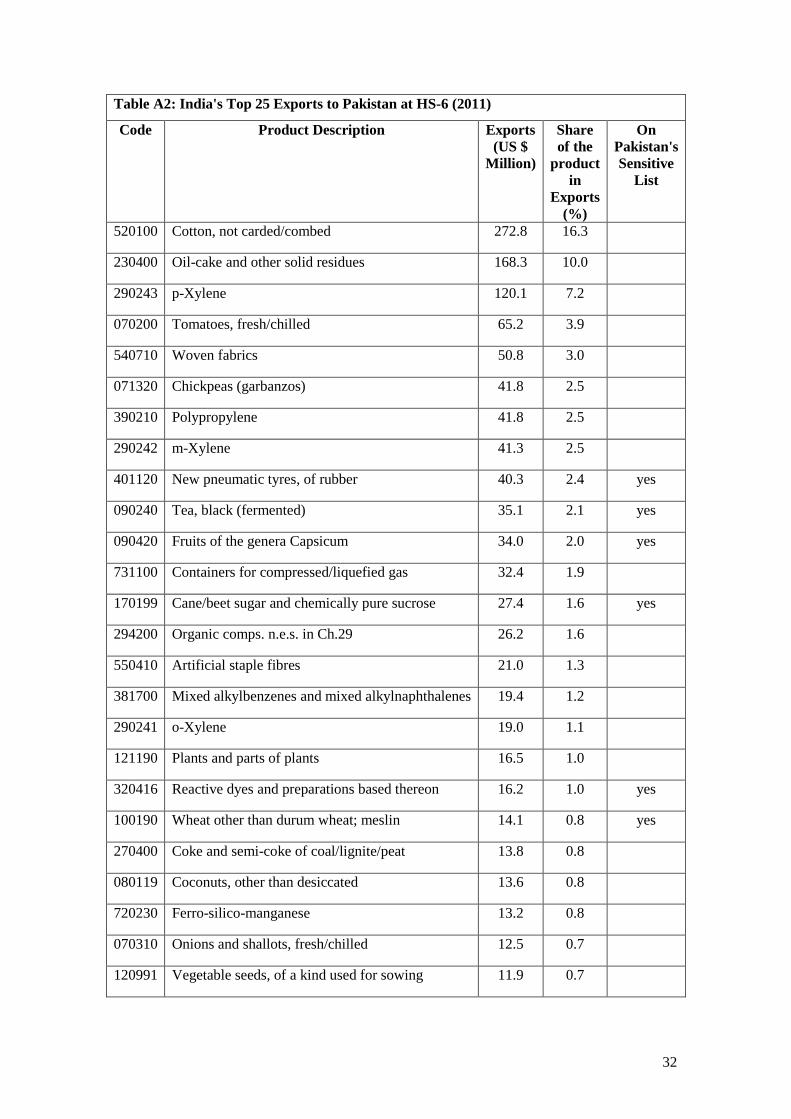
32
Table A2: India's Top 25 Exports to Pakistan at HS-6 (2011)
Code Product Description Exports
(US $
Million)
Share
of the
product
in
Exports
(%)
On
Pakistan's
Sensitive
List
520100 Cotton, not carded/combed 272.8 16.3
230400 Oil-cake and other solid residues 168.3 10.0
290243 p-Xylene 120.1 7.2
070200 Tomatoes, fresh/chilled 65.2 3.9
540710 Woven fabrics 50.8 3.0
071320 Chickpeas (garbanzos) 41.8 2.5
390210 Polypropylene 41.8 2.5
290242 m-Xylene 41.3 2.5
401120 New pneumatic tyres, of rubber 40.3 2.4 yes
090240 Tea, black (fermented) 35.1 2.1 yes
090420 Fruits of the genera Capsicum 34.0 2.0 yes
731100 Containers for compressed/liquefied gas 32.4 1.9
170199 Cane/beet sugar and chemically pure sucrose 27.4 1.6 yes
294200 Organic comps. n.e.s. in Ch.29 26.2 1.6
550410 Artificial staple fibres 21.0 1.3
381700 Mixed alkylbenzenes and mixed alkylnaphthalenes 19.4 1.2
290241 o-Xylene 19.0 1.1
121190 Plants and parts of plants 16.5 1.0
320416 Reactive dyes and preparations based thereon 16.2 1.0 yes
100190 Wheat other than durum wheat; meslin 14.1 0.8 yes
270400 Coke and semi-coke of coal/lignite/peat 13.8 0.8
080119 Coconuts, other than desiccated 13.6 0.8
720230 Ferro-silico-manganese 13.2 0.8
070310 Onions and shallots, fresh/chilled 12.5 0.7
120991 Vegetable seeds, of a kind used for sowing 11.9 0.7
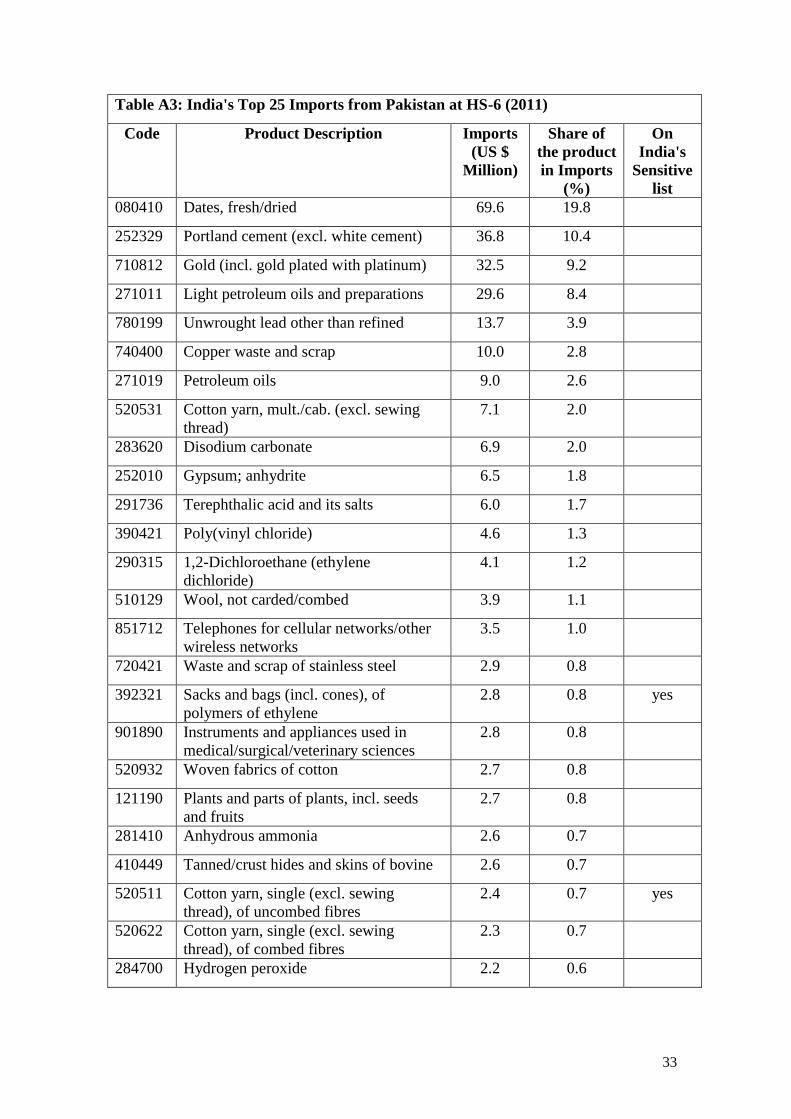
33
Table A3: India's Top 25 Imports from Pakistan at HS-6 (2011)
Code Product Description Imports
(US $
Million)
Share of
the product
in Imports
(%)
On
India's
Sensitive
list
080410 Dates, fresh/dried 69.6 19.8
252329 Portland cement (excl. white cement) 36.8 10.4
710812 Gold (incl. gold plated with platinum) 32.5 9.2
271011 Light petroleum oils and preparations 29.6 8.4
780199 Unwrought lead other than refined 13.7 3.9
740400 Copper waste and scrap 10.0 2.8
271019 Petroleum oils 9.0 2.6
520531 Cotton yarn, mult./cab. (excl. sewing
thread)
7.1 2.0
283620 Disodium carbonate 6.9 2.0
252010 Gypsum; anhydrite 6.5 1.8
291736 Terephthalic acid and its salts 6.0 1.7
390421 Poly(vinyl chloride) 4.6 1.3
290315 1,2-Dichloroethane (ethylene
dichloride)
4.1 1.2
510129 Wool, not carded/combed 3.9 1.1
851712 Telephones for cellular networks/other
wireless networks
3.5 1.0
720421 Waste and scrap of stainless steel 2.9 0.8
392321 Sacks and bags (incl. cones), of
polymers of ethylene
2.8 0.8 yes
901890 Instruments and appliances used in
medical/surgical/veterinary sciences
2.8 0.8
520932 Woven fabrics of cotton 2.7 0.8
121190 Plants and parts of plants, incl. seeds
and fruits
2.7 0.8
281410 Anhydrous ammonia 2.6 0.7
410449 Tanned/crust hides and skins of bovine 2.6 0.7
520511 Cotton yarn, single (excl. sewing
thread), of uncombed fibres
2.4 0.7 yes
520622 Cotton yarn, single (excl. sewing
thread), of combed fibres
2.3 0.7
284700 Hydrogen peroxide 2.2 0.6
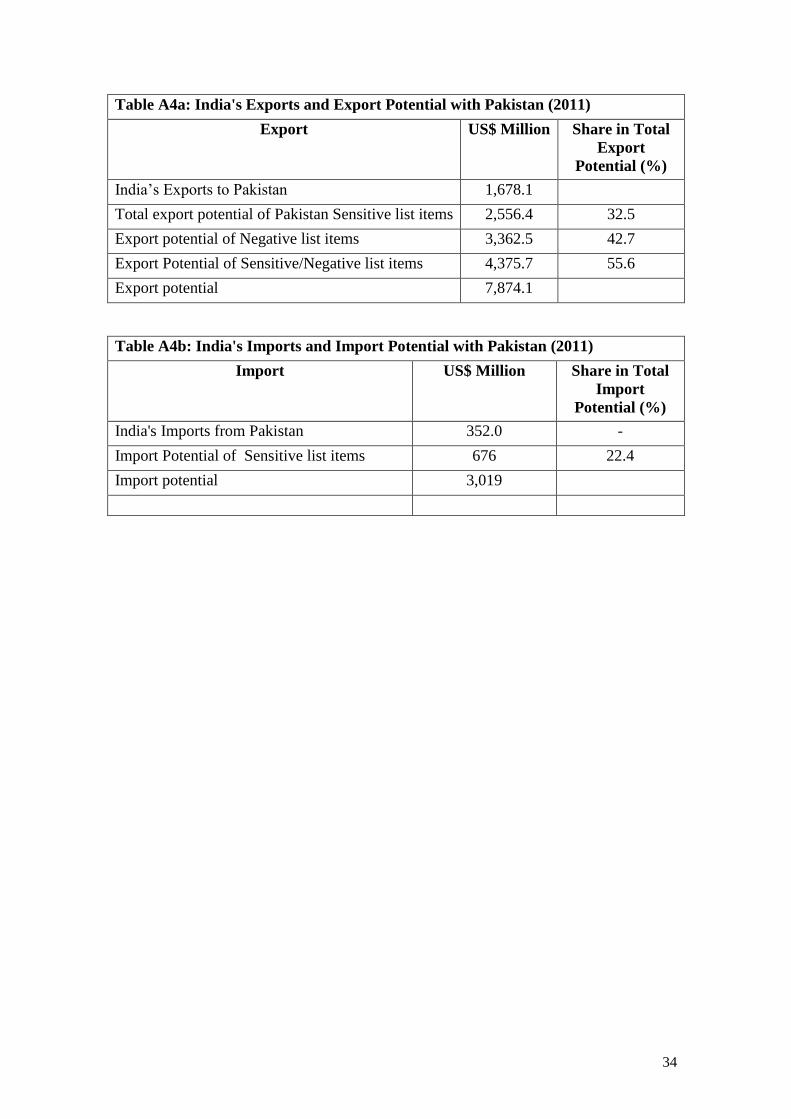
34
Table A4a: India's Exports and Export Potential with Pakistan (2011)
Export US$ Million Share in Total
Export
Potential (%)
India’s Exports to Pakistan 1,678.1
Total export potential of Pakistan Sensitive list items 2,556.4 32.5
Export potential of Negative list items 3,362.5 42.7
Export Potential of Sensitive/Negative list items 4,375.7 55.6
Export potential 7,874.1
Table A4b: India's Imports and Import Potential with Pakistan (2011)
Import US$ Million Share in Total
Import
Potential (%)
India's Imports from Pakistan 352.0 -
Import Potential of Sensitive list items 676 22.4
Import potential 3,019
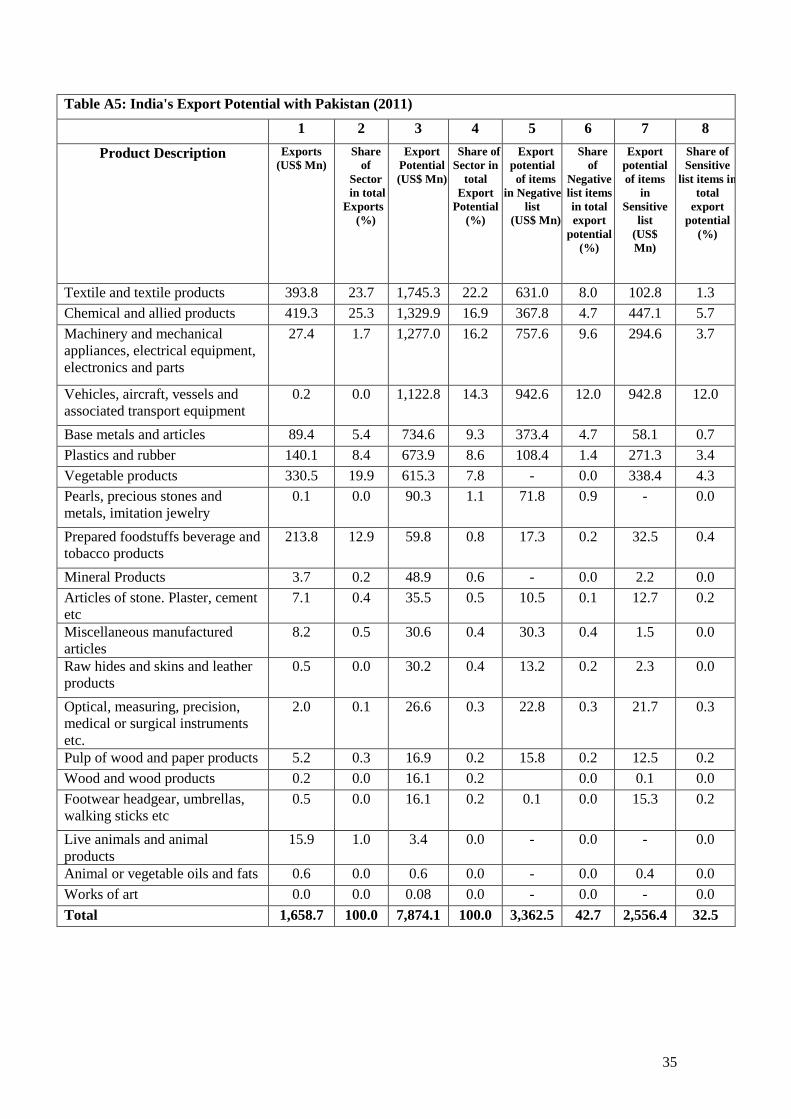
35
Table A5: India's Export Potential with Pakistan (2011)
1 2 3 4 5 6 7 8
Product Description Exports
(US$ Mn)
Share
of
Sector
in total
Exports
(%)
Export
Potential
(US$ Mn)
Share of
Sector in
total
Export
Potential
(%)
Export
potential
of items
in Negative
list
(US$ Mn)
Share
of
Negative
list items
in total
export
potential
(%)
Export
potential
of items
in
Sensitive
list
(US$
Mn)
Share of
Sensitive
list items in
total
export
potential
(%)
Textile and textile products 393.8 23.7 1,745.3 22.2 631.0 8.0 102.8 1.3
Chemical and allied products 419.3 25.3 1,329.9 16.9 367.8 4.7 447.1 5.7
Machinery and mechanical
appliances, electrical equipment,
electronics and parts
27.4 1.7 1,277.0 16.2 757.6 9.6 294.6 3.7
Vehicles, aircraft, vessels and
associated transport equipment
0.2 0.0 1,122.8 14.3 942.6 12.0 942.8 12.0
Base metals and articles 89.4 5.4 734.6 9.3 373.4 4.7 58.1 0.7
Plastics and rubber 140.1 8.4 673.9 8.6 108.4 1.4 271.3 3.4
Vegetable products 330.5 19.9 615.3 7.8 - 0.0 338.4 4.3
Pearls, precious stones and
metals, imitation jewelry
0.1 0.0 90.3 1.1 71.8 0.9 - 0.0
Prepared foodstuffs beverage and
tobacco products
213.8 12.9 59.8 0.8 17.3 0.2 32.5 0.4
Mineral Products 3.7 0.2 48.9 0.6 - 0.0 2.2 0.0
Articles of stone. Plaster, cement
etc
7.1 0.4 35.5 0.5 10.5 0.1 12.7 0.2
Miscellaneous manufactured
articles
8.2 0.5 30.6 0.4 30.3 0.4 1.5 0.0
Raw hides and skins and leather
products
0.5 0.0 30.2 0.4 13.2 0.2 2.3 0.0
Optical, measuring, precision,
medical or surgical instruments
etc.
2.0 0.1 26.6 0.3 22.8 0.3 21.7 0.3
Pulp of wood and paper products 5.2 0.3 16.9 0.2 15.8 0.2 12.5 0.2
Wood and wood products 0.2 0.0 16.1 0.2 0.0 0.1 0.0
Footwear headgear, umbrellas,
walking sticks etc
0.5 0.0 16.1 0.2 0.1 0.0 15.3 0.2
Live animals and animal
products
15.9 1.0 3.4 0.0 - 0.0 - 0.0
Animal or vegetable oils and fats 0.6 0.0 0.6 0.0 - 0.0 0.4 0.0
Works of art 0.0 0.0 0.08 0.0 - 0.0 - 0.0
Total 1,658.7 100.0 7,874.1 100.0 3,362.5 42.7 2,556.4 32.5
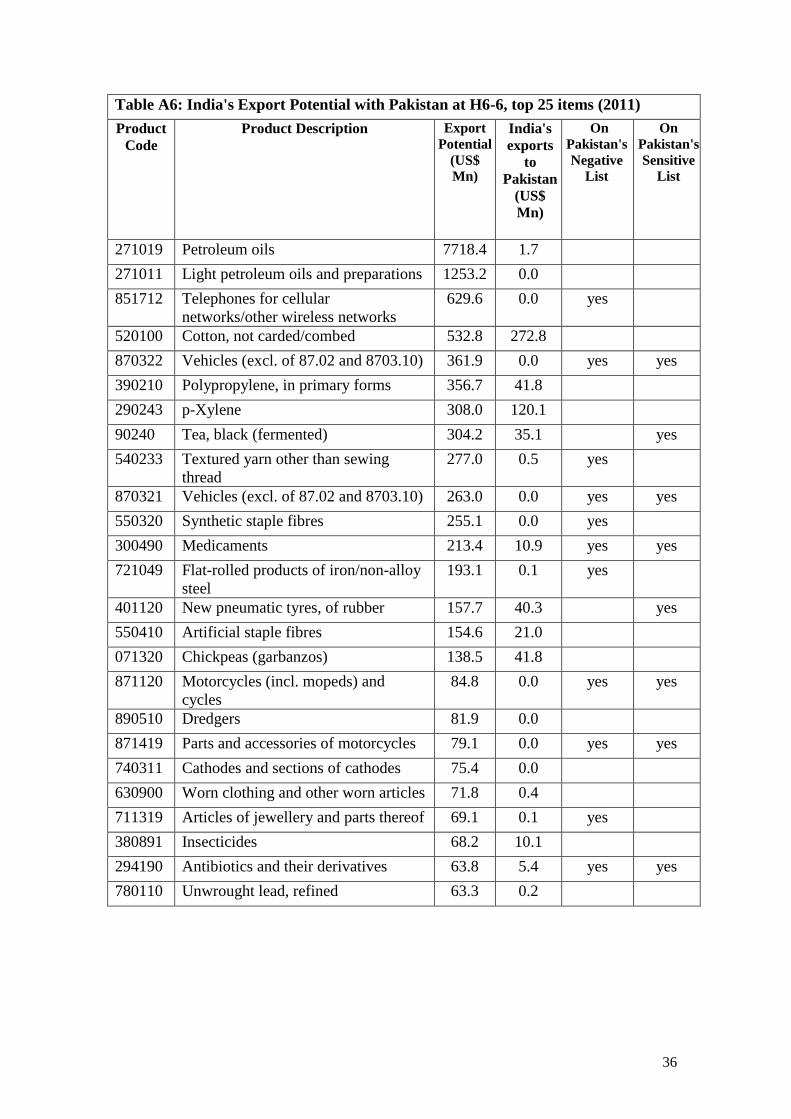
36
Table A6: India's Export Potential with Pakistan at H6-6, top 25 items (2011)
Product
Code
Product Description Export
Potential
(US$
Mn)
India's
exports
to
Pakistan
(US$
Mn)
On
Pakistan's
Negative
List
On
Pakistan's
Sensitive
List
271019 Petroleum oils 7718.4 1.7
271011 Light petroleum oils and preparations 1253.2 0.0
851712 Telephones for cellular
networks/other wireless networks
629.6 0.0 yes
520100 Cotton, not carded/combed 532.8 272.8
870322 Vehicles (excl. of 87.02 and 8703.10) 361.9 0.0 yes yes
390210 Polypropylene, in primary forms 356.7 41.8
290243 p-Xylene 308.0 120.1
90240 Tea, black (fermented) 304.2 35.1 yes
540233 Textured yarn other than sewing
thread
277.0 0.5 yes
870321 Vehicles (excl. of 87.02 and 8703.10) 263.0 0.0 yes yes
550320 Synthetic staple fibres 255.1 0.0 yes
300490 Medicaments 213.4 10.9 yes yes
721049 Flat-rolled products of iron/non-alloy
steel
193.1 0.1 yes
401120 New pneumatic tyres, of rubber 157.7 40.3 yes
550410 Artificial staple fibres 154.6 21.0
071320 Chickpeas (garbanzos) 138.5 41.8
871120 Motorcycles (incl. mopeds) and
cycles
84.8 0.0 yes yes
890510 Dredgers 81.9 0.0
871419 Parts and accessories of motorcycles 79.1 0.0 yes yes
740311 Cathodes and sections of cathodes 75.4 0.0
630900 Worn clothing and other worn articles 71.8 0.4
711319 Articles of jewellery and parts thereof 69.1 0.1 yes
380891 Insecticides 68.2 10.1
294190 Antibiotics and their derivatives 63.8 5.4 yes yes
780110 Unwrought lead, refined 63.3 0.2
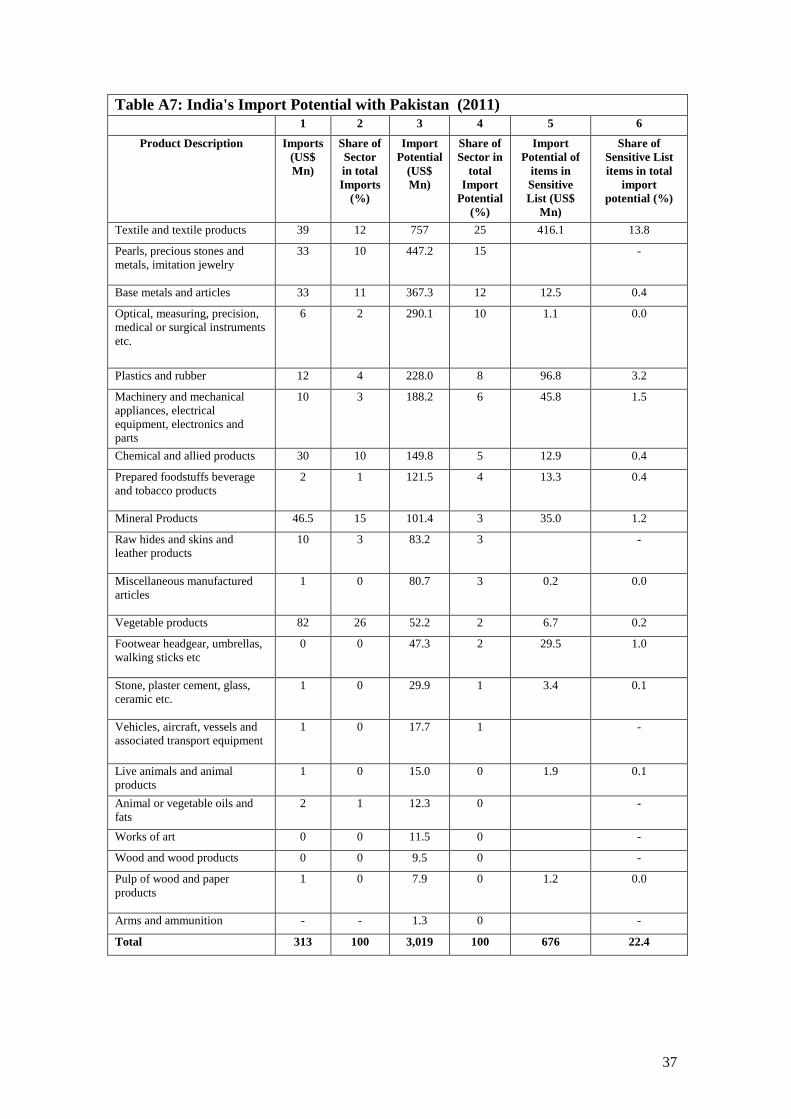
37
Table A7: India's Import Potential with Pakistan (2011) 1 2 3 4 5 6
Product Description Imports
(US$
Mn)
Share of
Sector
in total
Imports
(%)
Import
Potential
(US$
Mn)
Share of
Sector in
total
Import
Potential
(%)
Import
Potential of
items in
Sensitive
List (US$
Mn)
Share of
Sensitive List
items in total
import
potential (%)
Textile and textile products 39 12 757 25 416.1 13.8
Pearls, precious stones and
metals, imitation jewelry
33 10 447.2 15 -
Base metals and articles 33 11 367.3 12 12.5 0.4
Optical, measuring, precision,
medical or surgical instruments
etc.
6 2 290.1 10 1.1 0.0
Plastics and rubber 12 4 228.0 8 96.8 3.2
Machinery and mechanical
appliances, electrical
equipment, electronics and
parts
10 3 188.2 6 45.8 1.5
Chemical and allied products 30 10 149.8 5 12.9 0.4
Prepared foodstuffs beverage
and tobacco products
2 1 121.5 4 13.3 0.4
Mineral Products 46.5 15 101.4 3 35.0 1.2
Raw hides and skins and
leather products
10 3 83.2 3 -
Miscellaneous manufactured
articles
1 0 80.7 3 0.2 0.0
Vegetable products 82 26 52.2 2 6.7 0.2
Footwear headgear, umbrellas,
walking sticks etc
0 0 47.3 2 29.5 1.0
Stone, plaster cement, glass,
ceramic etc.
1 0 29.9 1 3.4 0.1
Vehicles, aircraft, vessels and
associated transport equipment
1 0 17.7 1 -
Live animals and animal
products
1 0 15.0 0 1.9 0.1
Animal or vegetable oils and
fats
2 1 12.3 0 -
Works of art 0 0 11.5 0 -
Wood and wood products 0 0 9.5 0 -
Pulp of wood and paper
products
1 0 7.9 0 1.2 0.0
Arms and ammunition - - 1.3 0 -
Total 313 100 3,019 100 676 22.4
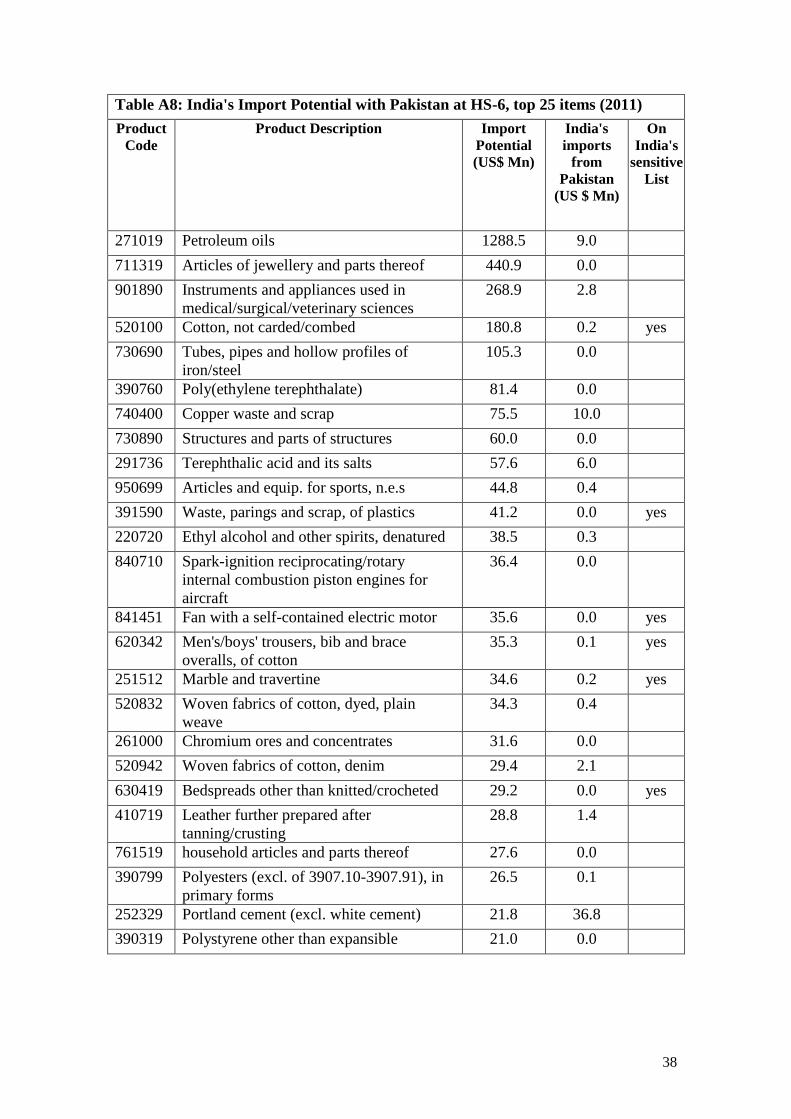
38
Table A8: India's Import Potential with Pakistan at HS-6, top 25 items (2011)
Product
Code
Product Description Import
Potential
(US$ Mn)
India's
imports
from
Pakistan
(US $ Mn)
On
India's
sensitive
List
271019 Petroleum oils 1288.5 9.0
711319 Articles of jewellery and parts thereof 440.9 0.0
901890 Instruments and appliances used in
medical/surgical/veterinary sciences
268.9 2.8
520100 Cotton, not carded/combed 180.8 0.2 yes
730690 Tubes, pipes and hollow profiles of
iron/steel
105.3 0.0
390760 Poly(ethylene terephthalate) 81.4 0.0
740400 Copper waste and scrap 75.5 10.0
730890 Structures and parts of structures 60.0 0.0
291736 Terephthalic acid and its salts 57.6 6.0
950699 Articles and equip. for sports, n.e.s 44.8 0.4
391590 Waste, parings and scrap, of plastics 41.2 0.0 yes
220720 Ethyl alcohol and other spirits, denatured 38.5 0.3
840710 Spark-ignition reciprocating/rotary
internal combustion piston engines for
aircraft
36.4 0.0
841451 Fan with a self-contained electric motor 35.6 0.0 yes
620342 Men's/boys' trousers, bib and brace
overalls, of cotton
35.3 0.1 yes
251512 Marble and travertine 34.6 0.2 yes
520832 Woven fabrics of cotton, dyed, plain
weave
34.3 0.4
261000 Chromium ores and concentrates 31.6 0.0
520942 Woven fabrics of cotton, denim 29.4 2.1
630419 Bedspreads other than knitted/crocheted 29.2 0.0 yes
410719 Leather further prepared after
tanning/crusting
28.8 1.4
761519 household articles and parts thereof 27.6 0.0
390799 Polyesters (excl. of 3907.10-3907.91), in
primary forms
26.5 0.1
252329 Portland cement (excl. white cement) 21.8 36.8
390319 Polystyrene other than expansible 21.0 0.0
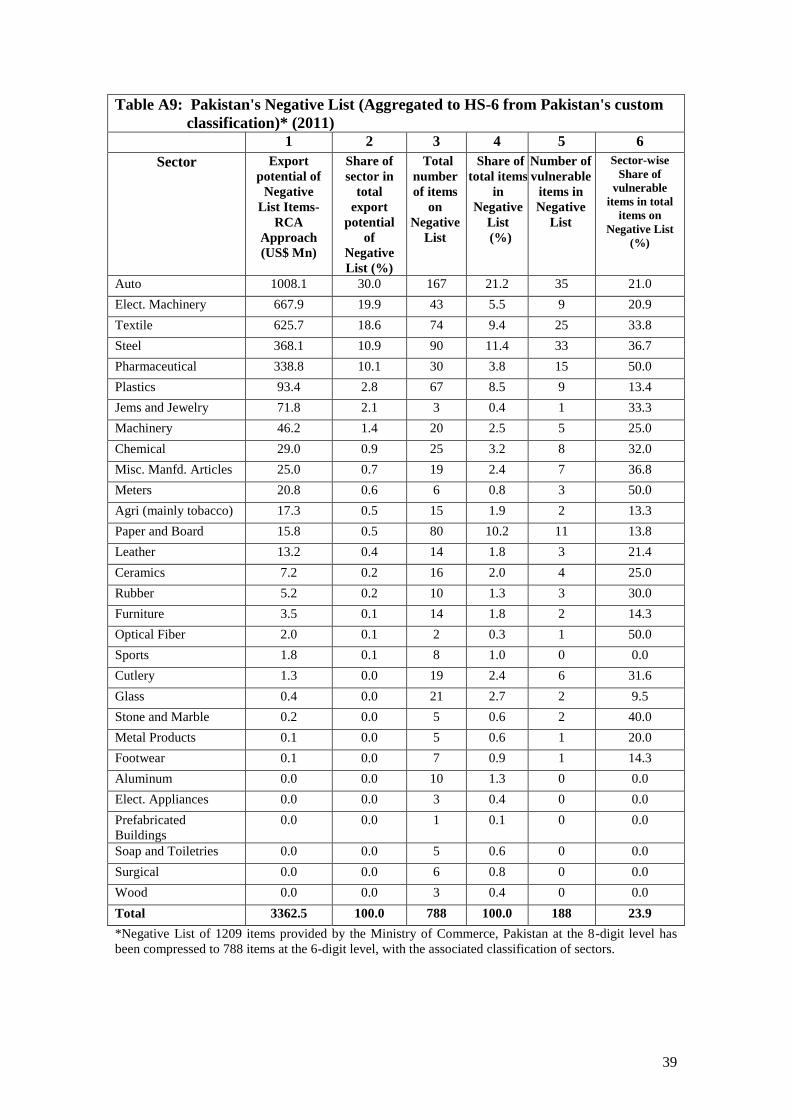
39
Table A9: Pakistan's Negative List (Aggregated to HS-6 from Pakistan's custom
classification)* (2011)
1 2 3 4 5 6
Sector Export
potential of
Negative
List Items-
RCA
Approach
(US$ Mn)
Share of
sector in
total
export
potential
of
Negative
List (%)
Total
number
of items
on
Negative
List
Share of
total items
in
Negative
List
(%)
Number of
vulnerable
items in
Negative
List
Sector-wise
Share of
vulnerable
items in total
items on
Negative List
(%)
Auto 1008.1 30.0 167 21.2 35 21.0
Elect. Machinery 667.9 19.9 43 5.5 9 20.9
Textile 625.7 18.6 74 9.4 25 33.8
Steel 368.1 10.9 90 11.4 33 36.7
Pharmaceutical 338.8 10.1 30 3.8 15 50.0
Plastics 93.4 2.8 67 8.5 9 13.4
Jems and Jewelry 71.8 2.1 3 0.4 1 33.3
Machinery 46.2 1.4 20 2.5 5 25.0
Chemical 29.0 0.9 25 3.2 8 32.0
Misc. Manfd. Articles 25.0 0.7 19 2.4 7 36.8
Meters 20.8 0.6 6 0.8 3 50.0
Agri (mainly tobacco) 17.3 0.5 15 1.9 2 13.3
Paper and Board 15.8 0.5 80 10.2 11 13.8
Leather 13.2 0.4 14 1.8 3 21.4
Ceramics 7.2 0.2 16 2.0 4 25.0
Rubber 5.2 0.2 10 1.3 3 30.0
Furniture 3.5 0.1 14 1.8 2 14.3
Optical Fiber 2.0 0.1 2 0.3 1 50.0
Sports 1.8 0.1 8 1.0 0 0.0
Cutlery 1.3 0.0 19 2.4 6 31.6
Glass 0.4 0.0 21 2.7 2 9.5
Stone and Marble 0.2 0.0 5 0.6 2 40.0
Metal Products 0.1 0.0 5 0.6 1 20.0
Footwear 0.1 0.0 7 0.9 1 14.3
Aluminum 0.0 0.0 10 1.3 0 0.0
Elect. Appliances 0.0 0.0 3 0.4 0 0.0
Prefabricated
Buildings
0.0 0.0 1 0.1 0 0.0
Soap and Toiletries 0.0 0.0 5 0.6 0 0.0
Surgical 0.0 0.0 6 0.8 0 0.0
Wood 0.0 0.0 3 0.4 0 0.0
Total 3362.5 100.0 788 100.0 188 23.9
*Negative List of 1209 items provided by the Ministry of Commerce, Pakistan at the 8-digit level has
been compressed to 788 items at the 6-digit level, with the associated classification of sectors.
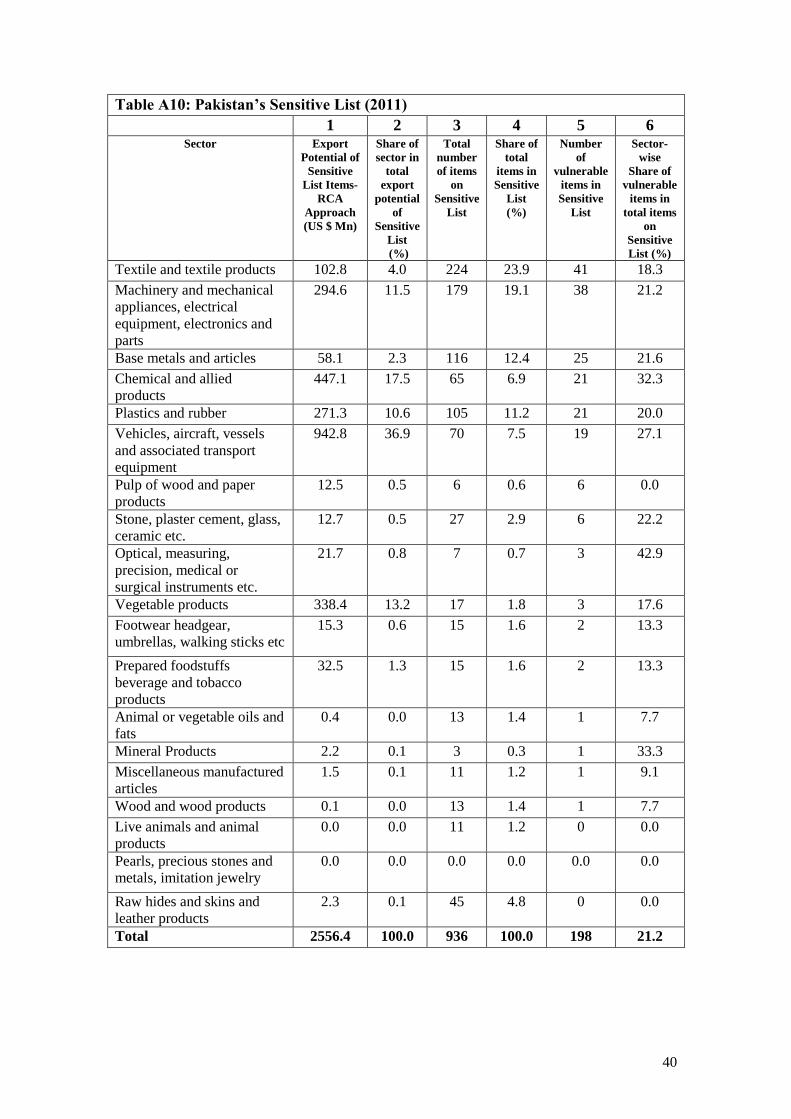
40
Table A10: Pakistan’s Sensitive List (2011)
1 2 3 4 5 6 Sector Export
Potential of
Sensitive
List Items-
RCA
Approach
(US $ Mn)
Share of
sector in
total
export
potential
of
Sensitive
List
(%)
Total
number
of items
on
Sensitive
List
Share of
total
items in
Sensitive
List
(%)
Number
of
vulnerable
items in
Sensitive
List
Sector-
wise
Share of
vulnerable
items in
total items
on
Sensitive
List (%)
Textile and textile products 102.8 4.0 224 23.9 41 18.3
Machinery and mechanical
appliances, electrical
equipment, electronics and
parts
294.6 11.5 179 19.1 38 21.2
Base metals and articles 58.1 2.3 116 12.4 25 21.6
Chemical and allied
products
447.1 17.5 65 6.9 21 32.3
Plastics and rubber 271.3 10.6 105 11.2 21 20.0
Vehicles, aircraft, vessels
and associated transport
equipment
942.8 36.9 70 7.5 19 27.1
Pulp of wood and paper
products
12.5 0.5 6 0.6 6 0.0
Stone, plaster cement, glass,
ceramic etc.
12.7 0.5 27 2.9 6 22.2
Optical, measuring,
precision, medical or
surgical instruments etc.
21.7 0.8 7 0.7 3 42.9
Vegetable products 338.4 13.2 17 1.8 3 17.6
Footwear headgear,
umbrellas, walking sticks etc
15.3 0.6 15 1.6 2 13.3
Prepared foodstuffs
beverage and tobacco
products
32.5 1.3 15 1.6 2 13.3
Animal or vegetable oils and
fats
0.4 0.0 13 1.4 1 7.7
Mineral Products 2.2 0.1 3 0.3 1 33.3
Miscellaneous manufactured
articles
1.5 0.1 11 1.2 1 9.1
Wood and wood products 0.1 0.0 13 1.4 1 7.7
Live animals and animal
products
0.0 0.0 11 1.2 0 0.0
Pearls, precious stones and
metals, imitation jewelry
0.0 0.0 0.0 0.0 0.0 0.0
Raw hides and skins and
leather products
2.3 0.1 45 4.8 0 0.0
Total 2556.4 100.0 936 100.0 198 21.2
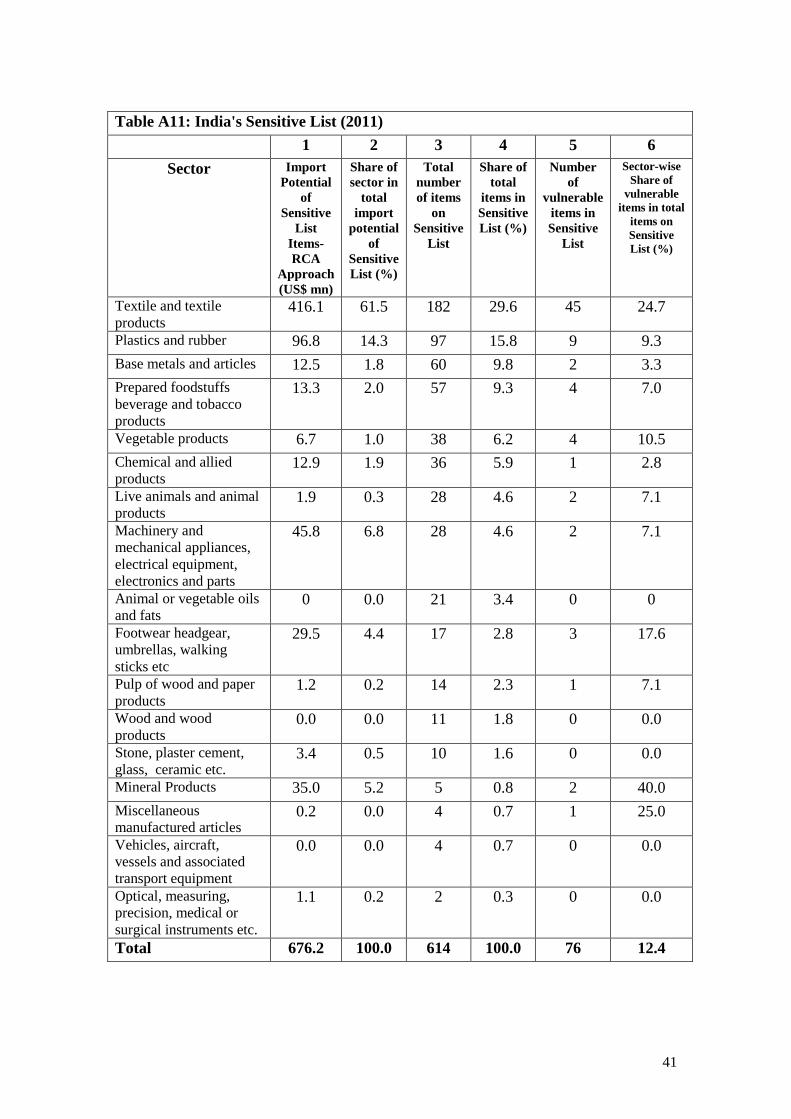
41
Table A11: India's Sensitive List (2011)
1 2 3 4 5 6
Sector Import
Potential
of
Sensitive
List
Items-
RCA
Approach
(US$ mn)
Share of
sector in
total
import
potential
of
Sensitive
List (%)
Total
number
of items
on
Sensitive
List
Share of
total
items in
Sensitive
List (%)
Number
of
vulnerable
items in
Sensitive
List
Sector-wise
Share of
vulnerable
items in total
items on
Sensitive
List (%)
Textile and textile
products 416.1 61.5 182 29.6 45 24.7
Plastics and rubber 96.8 14.3 97 15.8 9 9.3
Base metals and articles 12.5 1.8 60 9.8 2 3.3
Prepared foodstuffs
beverage and tobacco
products
13.3 2.0 57 9.3 4 7.0
Vegetable products 6.7 1.0 38 6.2 4 10.5
Chemical and allied
products 12.9 1.9 36 5.9 1 2.8
Live animals and animal
products 1.9 0.3 28 4.6 2 7.1
Machinery and
mechanical appliances,
electrical equipment,
electronics and parts
45.8 6.8 28 4.6 2 7.1
Animal or vegetable oils
and fats 0 0.0 21 3.4 0 0
Footwear headgear,
umbrellas, walking
sticks etc
29.5 4.4 17 2.8 3 17.6
Pulp of wood and paper
products 1.2 0.2 14 2.3 1 7.1
Wood and wood
products 0.0 0.0 11 1.8 0 0.0
Stone, plaster cement,
glass, ceramic etc. 3.4 0.5 10 1.6 0 0.0
Mineral Products 35.0 5.2 5 0.8 2 40.0
Miscellaneous
manufactured articles 0.2 0.0 4 0.7 1 25.0
Vehicles, aircraft,
vessels and associated
transport equipment
0.0 0.0 4 0.7 0 0.0
Optical, measuring,
precision, medical or
surgical instruments etc.
1.1 0.2 2 0.3 0 0.0
Total 676.2 100.0 614 100.0 76 12.4
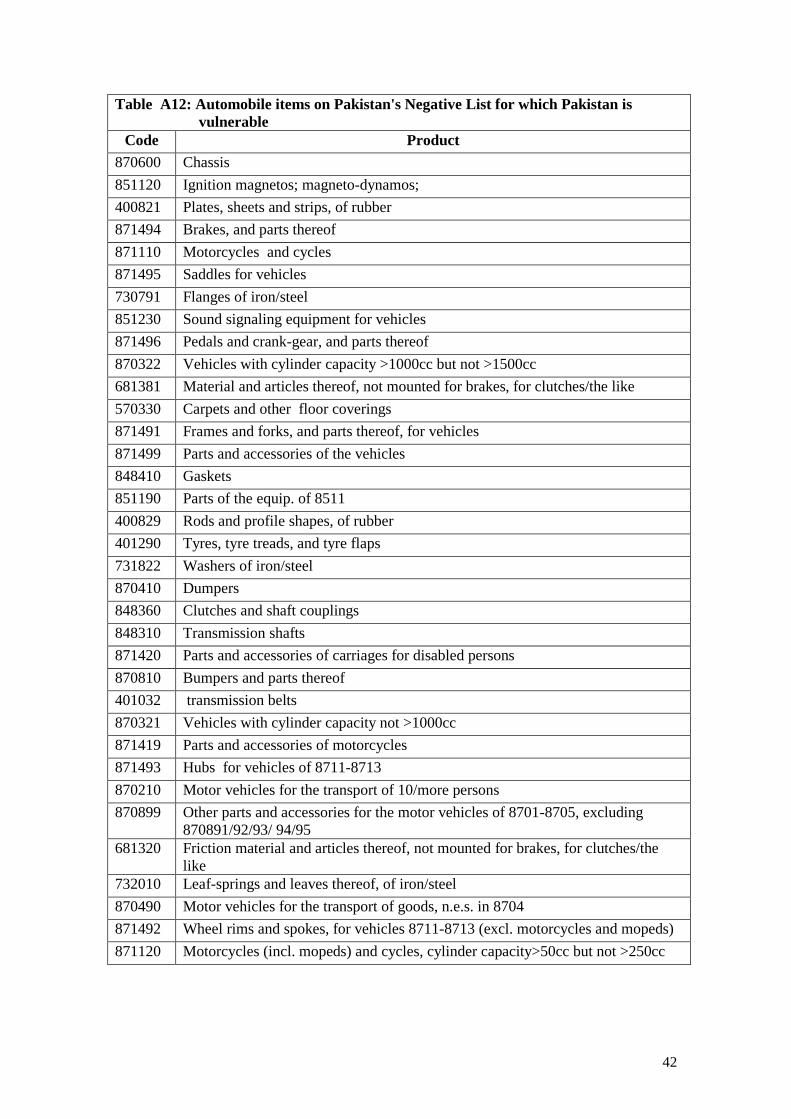
42
Table A12: Automobile items on Pakistan's Negative List for which Pakistan is
vulnerable
Code Product
870600 Chassis
851120 Ignition magnetos; magneto-dynamos;
400821 Plates, sheets and strips, of rubber
871494 Brakes, and parts thereof
871110 Motorcycles and cycles
871495 Saddles for vehicles
730791 Flanges of iron/steel
851230 Sound signaling equipment for vehicles
871496 Pedals and crank-gear, and parts thereof
870322 Vehicles with cylinder capacity >1000cc but not >1500cc
681381 Material and articles thereof, not mounted for brakes, for clutches/the like
570330 Carpets and other floor coverings
871491 Frames and forks, and parts thereof, for vehicles
871499 Parts and accessories of the vehicles
848410 Gaskets
851190 Parts of the equip. of 8511
400829 Rods and profile shapes, of rubber
401290 Tyres, tyre treads, and tyre flaps
731822 Washers of iron/steel
870410 Dumpers
848360 Clutches and shaft couplings
848310 Transmission shafts
871420 Parts and accessories of carriages for disabled persons
870810 Bumpers and parts thereof
401032 transmission belts
870321 Vehicles with cylinder capacity not >1000cc
871419 Parts and accessories of motorcycles
871493 Hubs for vehicles of 8711-8713
870210 Motor vehicles for the transport of 10/more persons
870899 Other parts and accessories for the motor vehicles of 8701-8705, excluding
870891/92/93/ 94/95
681320 Friction material and articles thereof, not mounted for brakes, for clutches/the
like
732010 Leaf-springs and leaves thereof, of iron/steel
870490 Motor vehicles for the transport of goods, n.e.s. in 8704
871492 Wheel rims and spokes, for vehicles 8711-8713 (excl. motorcycles and mopeds)
871120 Motorcycles (incl. mopeds) and cycles, cylinder capacity>50cc but not >250cc
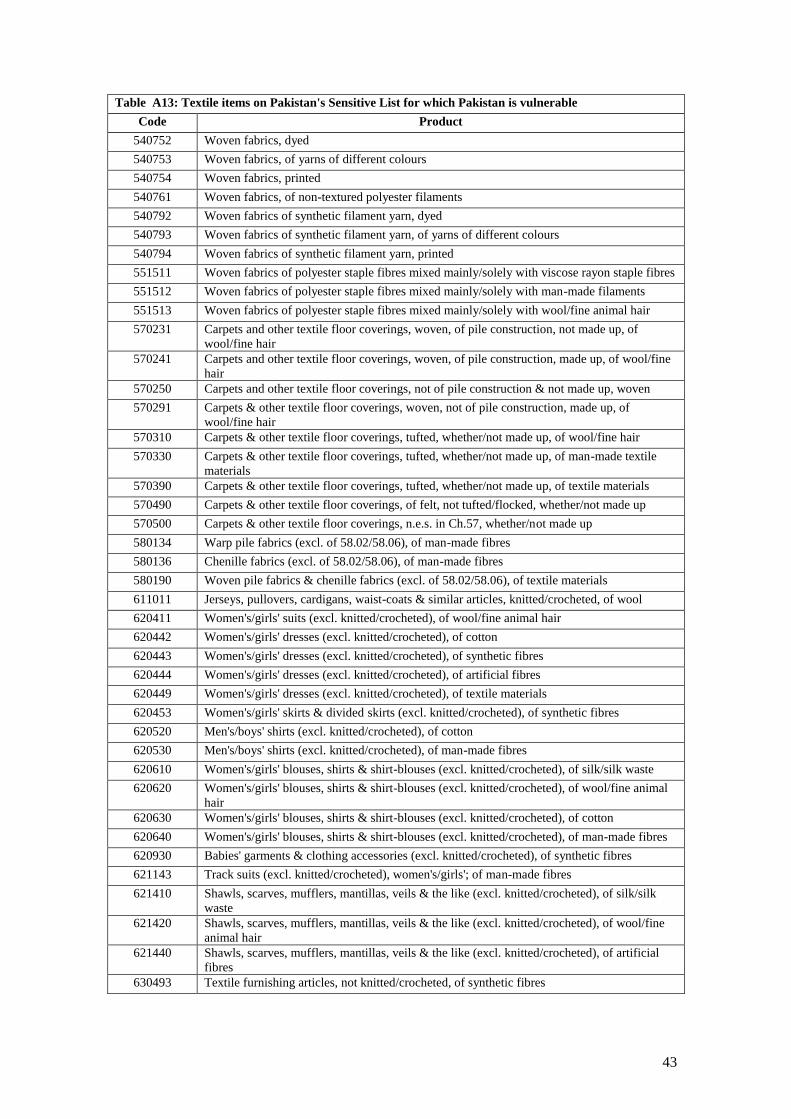
43
Table A13: Textile items on Pakistan's Sensitive List for which Pakistan is vulnerable
Code Product
540752 Woven fabrics, dyed
540753 Woven fabrics, of yarns of different colours
540754 Woven fabrics, printed
540761 Woven fabrics, of non-textured polyester filaments
540792 Woven fabrics of synthetic filament yarn, dyed
540793 Woven fabrics of synthetic filament yarn, of yarns of different colours
540794 Woven fabrics of synthetic filament yarn, printed
551511 Woven fabrics of polyester staple fibres mixed mainly/solely with viscose rayon staple fibres
551512 Woven fabrics of polyester staple fibres mixed mainly/solely with man-made filaments
551513 Woven fabrics of polyester staple fibres mixed mainly/solely with wool/fine animal hair
570231 Carpets and other textile floor coverings, woven, of pile construction, not made up, of
wool/fine hair
570241 Carpets and other textile floor coverings, woven, of pile construction, made up, of wool/fine
hair
570250 Carpets and other textile floor coverings, not of pile construction & not made up, woven
570291 Carpets & other textile floor coverings, woven, not of pile construction, made up, of
wool/fine hair
570310 Carpets & other textile floor coverings, tufted, whether/not made up, of wool/fine hair
570330 Carpets & other textile floor coverings, tufted, whether/not made up, of man-made textile
materials
570390 Carpets & other textile floor coverings, tufted, whether/not made up, of textile materials
570490 Carpets & other textile floor coverings, of felt, not tufted/flocked, whether/not made up
570500 Carpets & other textile floor coverings, n.e.s. in Ch.57, whether/not made up
580134 Warp pile fabrics (excl. of 58.02/58.06), of man-made fibres
580136 Chenille fabrics (excl. of 58.02/58.06), of man-made fibres
580190 Woven pile fabrics & chenille fabrics (excl. of 58.02/58.06), of textile materials
611011 Jerseys, pullovers, cardigans, waist-coats & similar articles, knitted/crocheted, of wool
620411 Women's/girls' suits (excl. knitted/crocheted), of wool/fine animal hair
620442 Women's/girls' dresses (excl. knitted/crocheted), of cotton
620443 Women's/girls' dresses (excl. knitted/crocheted), of synthetic fibres
620444 Women's/girls' dresses (excl. knitted/crocheted), of artificial fibres
620449 Women's/girls' dresses (excl. knitted/crocheted), of textile materials
620453 Women's/girls' skirts & divided skirts (excl. knitted/crocheted), of synthetic fibres
620520 Men's/boys' shirts (excl. knitted/crocheted), of cotton
620530 Men's/boys' shirts (excl. knitted/crocheted), of man-made fibres
620610 Women's/girls' blouses, shirts & shirt-blouses (excl. knitted/crocheted), of silk/silk waste
620620 Women's/girls' blouses, shirts & shirt-blouses (excl. knitted/crocheted), of wool/fine animal
hair
620630 Women's/girls' blouses, shirts & shirt-blouses (excl. knitted/crocheted), of cotton
620640 Women's/girls' blouses, shirts & shirt-blouses (excl. knitted/crocheted), of man-made fibres
620930 Babies' garments & clothing accessories (excl. knitted/crocheted), of synthetic fibres
621143 Track suits (excl. knitted/crocheted), women's/girls'; of man-made fibres
621410 Shawls, scarves, mufflers, mantillas, veils & the like (excl. knitted/crocheted), of silk/silk
waste
621420 Shawls, scarves, mufflers, mantillas, veils & the like (excl. knitted/crocheted), of wool/fine
animal hair
621440 Shawls, scarves, mufflers, mantillas, veils & the like (excl. knitted/crocheted), of artificial
fibres
630493 Textile furnishing articles, not knitted/crocheted, of synthetic fibres
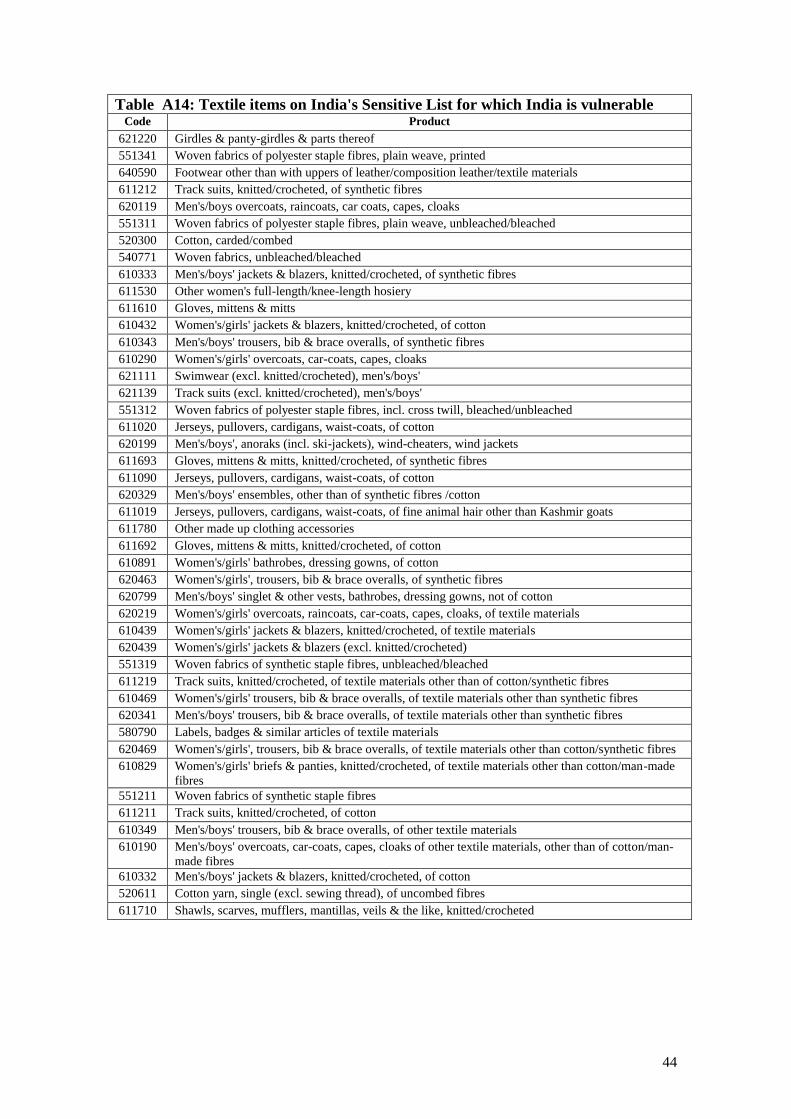
44
Table A14: Textile items on India's Sensitive List for which India is vulnerable Code Product
621220 Girdles & panty-girdles & parts thereof
551341 Woven fabrics of polyester staple fibres, plain weave, printed
640590 Footwear other than with uppers of leather/composition leather/textile materials
611212 Track suits, knitted/crocheted, of synthetic fibres
620119 Men's/boys overcoats, raincoats, car coats, capes, cloaks
551311 Woven fabrics of polyester staple fibres, plain weave, unbleached/bleached
520300 Cotton, carded/combed
540771 Woven fabrics, unbleached/bleached
610333 Men's/boys' jackets & blazers, knitted/crocheted, of synthetic fibres
611530 Other women's full-length/knee-length hosiery
611610 Gloves, mittens & mitts
610432 Women's/girls' jackets & blazers, knitted/crocheted, of cotton
610343 Men's/boys' trousers, bib & brace overalls, of synthetic fibres
610290 Women's/girls' overcoats, car-coats, capes, cloaks
621111 Swimwear (excl. knitted/crocheted), men's/boys'
621139 Track suits (excl. knitted/crocheted), men's/boys'
551312 Woven fabrics of polyester staple fibres, incl. cross twill, bleached/unbleached
611020 Jerseys, pullovers, cardigans, waist-coats, of cotton
620199 Men's/boys', anoraks (incl. ski-jackets), wind-cheaters, wind jackets
611693 Gloves, mittens & mitts, knitted/crocheted, of synthetic fibres
611090 Jerseys, pullovers, cardigans, waist-coats, of cotton
620329 Men's/boys' ensembles, other than of synthetic fibres /cotton
611019 Jerseys, pullovers, cardigans, waist-coats, of fine animal hair other than Kashmir goats
611780 Other made up clothing accessories
611692 Gloves, mittens & mitts, knitted/crocheted, of cotton
610891 Women's/girls' bathrobes, dressing gowns, of cotton
620463 Women's/girls', trousers, bib & brace overalls, of synthetic fibres
620799 Men's/boys' singlet & other vests, bathrobes, dressing gowns, not of cotton
620219 Women's/girls' overcoats, raincoats, car-coats, capes, cloaks, of textile materials
610439 Women's/girls' jackets & blazers, knitted/crocheted, of textile materials
620439 Women's/girls' jackets & blazers (excl. knitted/crocheted)
551319 Woven fabrics of synthetic staple fibres, unbleached/bleached
611219 Track suits, knitted/crocheted, of textile materials other than of cotton/synthetic fibres
610469 Women's/girls' trousers, bib & brace overalls, of textile materials other than synthetic fibres
620341 Men's/boys' trousers, bib & brace overalls, of textile materials other than synthetic fibres
580790 Labels, badges & similar articles of textile materials
620469 Women's/girls', trousers, bib & brace overalls, of textile materials other than cotton/synthetic fibres
610829 Women's/girls' briefs & panties, knitted/crocheted, of textile materials other than cotton/man-made
fibres
551211 Woven fabrics of synthetic staple fibres
611211 Track suits, knitted/crocheted, of cotton
610349 Men's/boys' trousers, bib & brace overalls, of other textile materials
610190 Men's/boys' overcoats, car-coats, capes, cloaks of other textile materials, other than of cotton/man-
made fibres
610332 Men's/boys' jackets & blazers, knitted/crocheted, of cotton
520611 Cotton yarn, single (excl. sewing thread), of uncombed fibres
611710 Shawls, scarves, mufflers, mantillas, veils & the like, knitted/crocheted
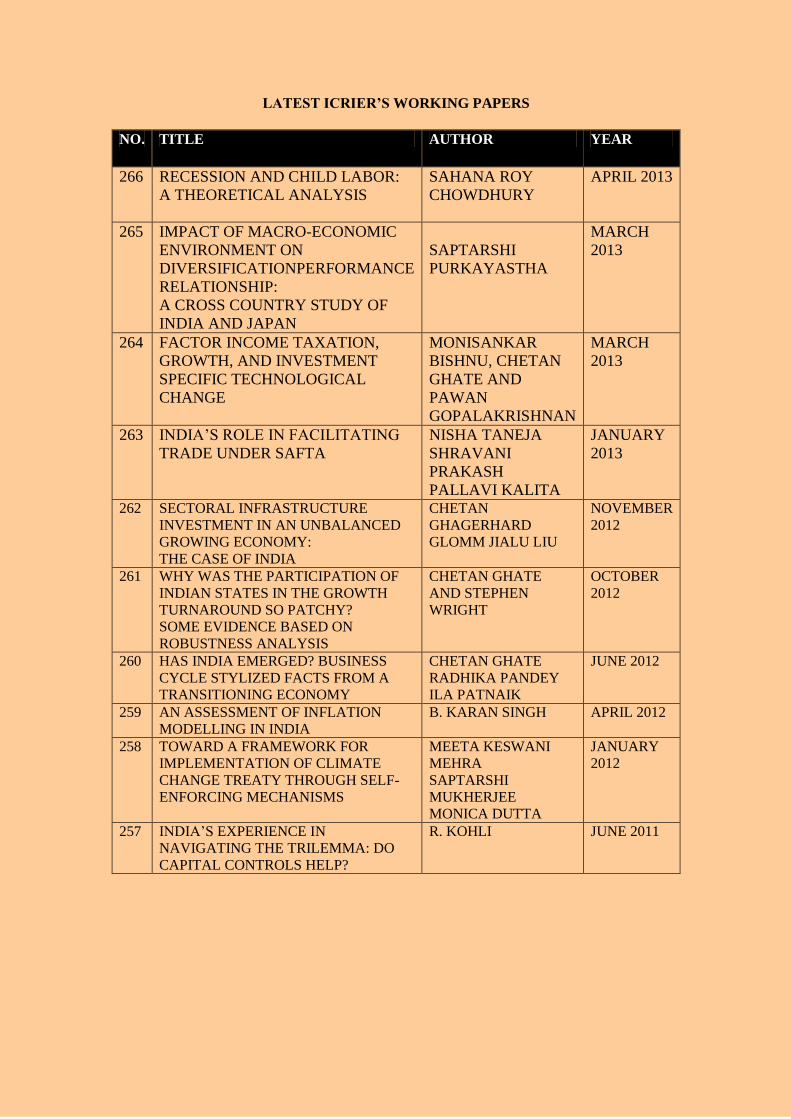
45
LATEST ICRIER’S WORKING PAPERS
NO. TITLE AUTHOR YEAR
266 RECESSION AND CHILD LABOR:
A THEORETICAL ANALYSIS
SAHANA ROY
CHOWDHURY
APRIL 2013
265 IMPACT OF MACRO-ECONOMIC
ENVIRONMENT ON
DIVERSIFICATIONPERFORMANCE
RELATIONSHIP:
A CROSS COUNTRY STUDY OF
INDIA AND JAPAN
SAPTARSHI
PURKAYASTHA
MARCH
2013
264 FACTOR INCOME TAXATION,
GROWTH, AND INVESTMENT
SPECIFIC TECHNOLOGICAL
CHANGE
MONISANKAR
BISHNU, CHETAN
GHATE AND
PAWAN
GOPALAKRISHNAN
MARCH
2013
263 INDIA’S ROLE IN FACILITATING
TRADE UNDER SAFTA
NISHA TANEJA
SHRAVANI
PRAKASH
PALLAVI KALITA
JANUARY
2013
262 SECTORAL INFRASTRUCTURE
INVESTMENT IN AN UNBALANCED
GROWING ECONOMY:
THE CASE OF INDIA
CHETAN
GHAGERHARD
GLOMM JIALU LIU
NOVEMBER
2012
261 WHY WAS THE PARTICIPATION OF
INDIAN STATES IN THE GROWTH
TURNAROUND SO PATCHY?
SOME EVIDENCE BASED ON
ROBUSTNESS ANALYSIS
CHETAN GHATE
AND STEPHEN
WRIGHT
OCTOBER
2012
260 HAS INDIA EMERGED? BUSINESS
CYCLE STYLIZED FACTS FROM A
TRANSITIONING ECONOMY
CHETAN GHATE
RADHIKA PANDEY
ILA PATNAIK
JUNE 2012
259 AN ASSESSMENT OF INFLATION
MODELLING IN INDIA
B. KARAN SINGH APRIL 2012
258 TOWARD A FRAMEWORK FOR
IMPLEMENTATION OF CLIMATE
CHANGE TREATY THROUGH SELF-
ENFORCING MECHANISMS
MEETA KESWANI
MEHRA
SAPTARSHI
MUKHERJEE
MONICA DUTTA
JANUARY
2012
257 INDIA’S EXPERIENCE IN
NAVIGATING THE TRILEMMA: DO
CAPITAL CONTROLS HELP?
R. KOHLI JUNE 2011
46
About ICRIER
Established in August 1981, ICRIER is an autonomous, policy-oriented, not-for-profit,
economic policy think tank. ICRIER's main focus is to enhance the knowledge content
of policy making by undertaking analytical research that is targeted at informing India's
policy makers and also at improving the interface with the global economy. ICRIER's
office is located in the institutional complex of India Habitat Centre, New Delhi.
ICRIER's Board of Governors includes leading academicians, policymakers, and
representatives from the private sector. Dr. Isher Ahluwalia is ICRIER's chairperson.
Dr. Rajat Kathuria is Director and Chief Executive.
ICRIER conducts thematic research in the following seven thrust areas:
Macro-economic Management in an Open Economy
Trade, Openness, Restructuring and Competitiveness
Financial Sector Liberalisation and Regulation
WTO-related Issues
Regional Economic Co-operation with Focus on South Asia
Strategic Aspects of India's International Economic Relations
Environment and Climate Change
To effectively disseminate research findings, ICRIER organises workshops, seminars
and conferences to bring together academicians, policymakers, representatives from
industry and media to create a more informed understanding on issues of major policy
interest. ICRIER routinely invites distinguished scholars and policymakers from around
the world to deliver public lectures and give seminars on economic themes of interest to
contemporary India.


![Graph Normalizing Flows · 2.2 Normalizing Flows Normalizing flows (NFs) [22, 3, 4] are a class of generative models that use invertible mappings to transform an observed vector](https://img.pdfslide.us/doc/110x75/5f37164f015bfa67bd3ee458/graph-normalizing-flows-22-normalizing-flows-normalizing-iows-nfs-22-3-4.jpg)