Embed Size (px)
Citation preview

1
NORMA Group SEFirst Quarter Results 2018
Maintal, May 9, 2018
2
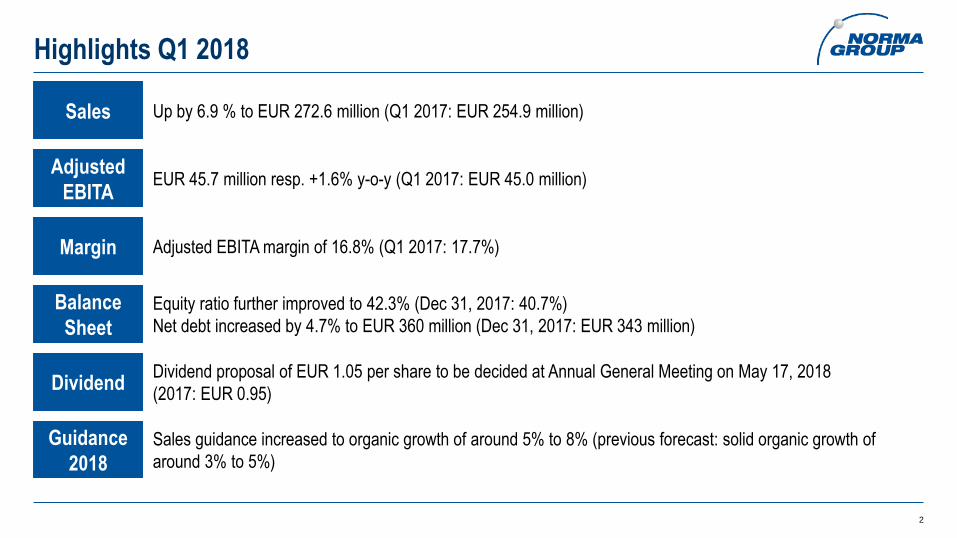
Highlights Q1 2018
Guidance
2018
Sales guidance increased to organic growth of around 5% to 8% (previous forecast: solid organic growth of
around 3% to 5%)
DividendDividend proposal of EUR 1.05 per share to be decided at Annual General Meeting on May 17, 2018
(2017: EUR 0.95)
Balance
Sheet
Equity ratio further improved to 42.3% (Dec 31, 2017: 40.7%)
Net debt increased by 4.7% to EUR 360 million (Dec 31, 2017: EUR 343 million)
Adjusted
EBITAEUR 45.7 million resp. +1.6% y-o-y (Q1 2017: EUR 45.0 million)
Sales Up by 6.9 % to EUR 272.6 million (Q1 2017: EUR 254.9 million)
Margin Adjusted EBITA margin of 16.8% (Q1 2017: 17.7%)

3
Strong Organic Growth in Q1 2018
Sales Development in EUR million
Sales 2017 2018 Change Change in % Thereof
organic
Thereof
acquisitions
Thereof
currency
Q1 254.9 272.6 17.7 6.9% 13.6% 1.0% -7.7%
• Strong organic growth of 13.6% mainly due to an increase of the global production output of the passenger/commercial
vehicle markets as well as a very good development of the water management business in the US
• Acquisitive growth of 1.0% or EUR 2.5 million from Fengfan in Q1 2018
• Currency changes in Q1 2018 led to sales decrease of 7.7% mainly resulting from the strong Euro vs. US-Dollar

4
Sales by Region and by Way-to-Market
• Favorable organic growth in Asia-Pacific as well as acquisitive growth from Fengfan led to increased 12% sales ratio in the
region
• Negative currency effects especially in Americas counters the positive organic growth and leads to stable 39% of sales
• Strong growth in EJT shifts sales contribution by 3 percentage points to 67%
Q1 2018 (Q1 2017) sales breakdown by region Q1 2018 (Q1 2017) sales breakdown by way-to-market
33%(36%)
67%(64%)
Distribution Services
Engineered Joining Technology
49%(50%)39%
(39%)
12%(11%)
EMEA Americas Asia-Pacific

5
Acquisition of Kimplas Piping Systems Ltd.
M&A Signing of Kimplas Piping Systems Ltd. India in April 2018
Business
Model
Leading Indian manufacturer of joining technology made of thermoplastic materials
Based in Nashik, India with own production site
HistorySince 1996 the company has been developing and manufacturing injection-molded parts used to ensure safe
and leakage free supply of drinking water and gas to rural and urban households and provide filtered water for
micro irrigation systems.
Sales Sales of around EUR 21 million in financial year 2018 (Apr 1, 2017 – Mar 31, 2018)
Consoli-
dationFirst time consolidation into NORMA Group after closing in mid-2018
Financing Transaction to be financed with credit facilities
Margin In the range of NORMA Group’s margin

6
Profitability Development
EUR million
85.4102.7 105.4 112.6
121.5
39.2 42.1 39.3 35.6 40.1 43.8 38.7 34.945.0 46.6 42.7 40.1 45.7
17.4% 17.7% 17.4% 17.7% 17.5% 17.7% 18.1% 18.0%
16.4%17.7%
18.5%17.9%
16.2%
17.7% 17.7% 17.5%
15.8%16.8%
20.2% 20.1% 20.0% 20.3 19.9% 20.1% 20.4% 20.4%
18.9%20.0%
20.8% 20.4%
18.9%20.1% 20.0% 20.0%
18.5%19.1%
0%
5%
10%
15%
20%
0
20
40
60
80
100
120
140
160
FY10 FY11 FY12 FY13 FY14 Q1/15 Q2/15 Q3/15 Q4/15 Q1/16 Q2/16 Q3/16 Q4/16 Q1/17 Q2/17 Q3/17 Q4/17 Q1/18
adjusted EBITA adjusted EBITA margin adjusted EBITDA margin
FY 2015:
17.6%FY 2016:
17.6%FY 2017:
17.2%

7
Adjusted EBITA Mainly Impacted by Raw Material Prices
• Material costs ratio up by 30 basis points and gross profit down by 150 basis points mainly due to higher alloy surcharges, force majeure on thermoplastic materials and uncertainties regarding a possible trade dispute.
• Personnel expenses ratio lowered by 20 basis points mainly due to less core work force increase compared to sales growth.
• Improved adjusted other OPEX at 12.1% due to higher business activity.
• Decrease of adjusted EBITA margin to 16.8% mainly due to higher raw material prices.
(Adjusted) Material Costs (in EUR million and % of sales)
(Adjusted) Gross Profit (in EUR million and % of sales)
Adjusted EBITA (in EUR million and % of sales)
Adjusted Other OPEX(in EUR million and % of sales)
Personnel Expenses (in EUR million and % of sales)
107.8 116.1
42.3% 42.6%
0%
25%
50%
0
100
200
Q1 2017 Q1 2018
69.4 73.6
27.2% 27.0%
0%
20%
40%
60%
0
100
200
Q1 2017 Q1 2018
31.6 32.9
12.4% 12.1%
0%
10%
20%
0
100
200
Q1 2017 Q1 2018
45.0 45.7
17.7% 16.8%
0%
10%
20%
0,0
150,0
Q1 2017 Q1 2018
152.2 158.7
59.7% 58.2%
0%
25%
50%
75%
0
100
200
Q1 2017 Q1 2018
8
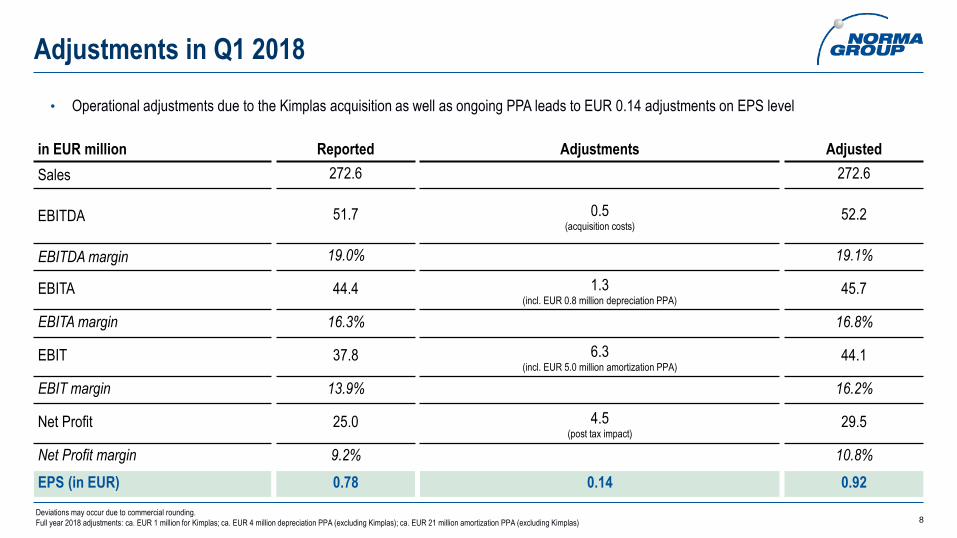
Adjustments in Q1 2018
in EUR million Reported Adjustments Adjusted
Sales 272.6 272.6
EBITDA 51.7 0.5(acquisition costs)
52.2
EBITDA margin 19.0% 19.1%
EBITA 44.4 1.3(incl. EUR 0.8 million depreciation PPA)
45.7
EBITA margin 16.3% 16.8%
EBIT 37.8 6.3(incl. EUR 5.0 million amortization PPA)
44.1
EBIT margin 13.9% 16.2%
Net Profit 25.0 4.5(post tax impact)
29.5
Net Profit margin 9.2% 10.8%
EPS (in EUR) 0.78 0.14 0.92
• Operational adjustments due to the Kimplas acquisition as well as ongoing PPA leads to EUR 0.14 adjustments on EPS level
Deviations may occur due to commercial rounding.
Full year 2018 adjustments: ca. EUR 1 million for Kimplas; ca. EUR 4 million depreciation PPA (excluding Kimplas); ca. EUR 21 million amortization PPA (excluding Kimplas)

9
Strong EPS Development in Q1 2018
Adjusted EPS
0.85 0.92
0,0
1,0
2,0
Q1 2017 Q1 2018
EUR
Reported EPS
EUR
0.70 0.78
0,0
1,0
2,0
Q1 2017 Q1 2018
27.1 29.5 22.5 25.0Net Income in
EUR million

10
Net Debt and Financing
Net Debt (in EUR million)
-155 -135
498495
-200
0
200
400
600
Dec 31, 2017 Mar 31, 2018Cash Debt
360343 Dec 31, 2017 Mar 31, 2018
Equity Ratio (equity / balance sheet
total)40.7% 42.3%
Dec 31, 2017 Mar 31, 2018
Leverage* (Net debt / adjusted LTM
EBITDA)1.7 x 1.8 x
Gearing (Net debt / equity) 0.6 x 0.7 x
* 2017 EBITDA includes full year EBITDA from Fengfan
Equity Ratio
Debt Ratios
• Net debt at EUR 360 million, an increase of 4.7% mainly due to higher business activity and the according working capital outflow• Equity ratio increased to 42.3% (Dec 31, 2017: 40.7%) due to the strong net profit • Slightly increased leverage at 1.8x (Net debt / adjusted LTM EBITDA)

11
Net Operating Cash Flow 2018
Net Operating Cash Flow
in EUR million Q1 2017 Q1 2018 Variance
Adjusted EBITDA 51.3 52.2 +1.8%
Δ ± Working capital -38.1 -55.5 +45.7%
Net operating cash flow before investments from operating business 13.2 -3.3 n/a
Δ ± Investments from operating business -8.7 -10.5 +20.8%
Net operating cash flow 4.5 -13.8 n/a
• Working capital outflow due to excellent growth leads to a decrease of net operating cash flow before investments by EUR 16.5 million to a total
of EUR -3.3 million
• Q1 2018 CAPEX spending at EUR 10.5 million mainly for manufacturing facilities in Germany, Serbia, UK, France, China, the US and Mexico

12
Outlook 2018 – Company Guidance
Sales Organic growth of around 5% to 8%, additionally around EUR 5 million from acquisitions
Adjusted EBITA
MarginSustainable at the same level as in previous years of more than 17.0%
Dividend Approx. 30% to 35% of adjusted net profit of the Group

13
AppendixStrategy

14
NORMA Group’s Key Facts
Specific customer requirements driven by megatrends
NORMAFLUID ®
42%
NORMACLAMP ®
34%
NORMACONNECT ®
32%
Delivers to more than
10,000 customers in 100 countries
Offers more than 40,000 innovative
joining solutions in three product
categories: Clamp, Connect, Fluid
Employees > 7,600 worldwide
Operates a global network of
more than 27 manufacturing
facilitiesNumerous sales and distribution
sites across Europe, the
Americas and Asia-Pacific
Global market and technology
leader in joining and fluid
handling technology
Sales of about
EUR 1,017 million in 2017

15
Emission reduction
Weightreduction
Assemblytime reduction
Leakagereduction
Productportfolio
Productavailability
Proven Business Model Addressing Key Megatrends
Specific customer requirements driven by megatrends
• Continuous new developments on a
global level in order to fulfill fleet
consumption regulations and cope with
increased awareness in public perception
• Ongoing trend in many industries
especially addressed by NORMA
Fluid products
• Easy to assemble NORMA Group
products help lowering production costs
for customers
• Safe sealing products minimize warranty
costs for customers through leak free
joints
• Comprehensive customized
product portfolio: One-Stop-
Shopping in general distribution
and water management
• Superior service level through worldwide
presence and regional sales hubs
NORMAFLUID ®
44%
NORMACLAMP ®
33%
NORMACONNECT ®
23%

16
• Environmental awareness continues to drive tightening emission regulations globally, including in emerging markets• Low-emission alternatives require significantly higher joining technology content at a substantially increased complexity compared to existing/past
technologies
Tighter Emission Regulations Drive Increased Joining Technology Content
Note: Chart shows emission regulation roadmap for passenger vehiclesSource: Integer Research, DieselNet, ACEA, NORMA Group
Euro 4
Euro 4
Euro 4
Euro 4
Euro 5
Euro 5
Euro 5
Euro 5
EPA ‘07
Euro 5
Euro 6
Euro 6
Euro 6
Euro 6
EPA Tier 3 - Clean Air Act
Euro 6
Euro 7
Euro 7
China
India
Russia
Brazil
NAFTA
Europe
2010 2012 2014 2016 2018 2020 2022 2024
Today

17
EU legislation required CO2 fleet average limits
Fleet Efficiency Europe: Innovation Rate must Double
• Low emitting cars (below 50 g/km CO2) counted as 1.5 vehicles in 2015• During second stage from 2020 onwards low-emitting cars will be counted as 2 (1.67) in 2020 (2021)
158.7 g/km 130 g/km 95 g/km
[95%]
[100%]
Reduction of 27% during 6 years
(5.1% p.a.)
triggers high efforts in emission reduction across
Europe
Reduction from
2007 to 2015
only 18% in 8
years (2.5% p.a.)
2007 2015 2020 2021 2025 2030
~ 81 g/km* 67 g/km*
* European Commission legislative proposal from November 8, 2017
Emission reduction of
15% resp. 30% until 2025 resp. 2030
(3.9% p.a.) compared with 2021 targets*

18
Innovation Rates*
* Chart shows emission regulation roadmap for passenger vehicles adapted to the consumption of gasoline engines (Source: European Commission, ICCT, NORMA Group)** Fuel economic data is normalized as g CO2/km in accordance with the NEDC
131 g/km
183 g/km
Global Comparison of Fuel Economy
Region Target
year
1
Target
year
2
Duration
in years
Fleet
Goal Year 1
Fleet
Goal Year 2
Change CAGR
under
national lawsconverted**
under
national lawsconverted**
EU 2015 2021 6 130 g/km 130 g/km 95 g/km 95 g/km -27% -5.1%
USA 2016 2025 9 37.8 mpg 139 g/km 56.2 mpg 88 g/km -37% -5.0%
China 2015 2020 5 6.9 l/100km 161 g/km 5.0 l/100km 117 g/km -27% -6.2%
Japan 2015 2020 5 16.8 km/l 139 g/km 20.3 km/l 115 g/km -17% -3.7%
India 2016 2021 5 130 g/km 130 g/km 113 g/km 113 g/km -13% -2.8%

19
History of Excellence
1972
2011
2007
2013
2008
2010
2012
2006
2011
2014
Foundation
NORMA China
Acquisition
Breeze, USA
Foundation
NORMA China II
Foundation
NORMA Japan
Foundation
NORMA Mexico
Foundation
NORMA India
Foundation
NORMA Korea
Foundation
NORMA Malaysia
Foundation
NORMA Turkey
Foundation
NORMA Russia
Merger ABA and Rasmussen to
NORMA Group
Acquisition
J-V shares, India
Acquisition
Five Star, USA
Acquisition National
Diversified Sales, USA
MDAX listingAcquisition
Davydick & Co, Australia
Acquisition
Craig Assembly, USA
Acquisition
R.G. Ray, USA
Acquisition Connectors
Verbindungstechnik, Switzerland
Acquisition Nordic
Metalblok, Italy
Acquisition Chien
Jin Plastic, Malaysia
Acquisition Groen
Bevestigingsmaterialen, Netherlands
Opening Sales &
Competence Center, Brazil
Acquisition
J-V shares, Spain
Foundation
NORMA Thailand
IPO
Foundation
NORMA Serbia
SDAX listing
Acquisition Variant,
Poland
Acquisition Guyco,
Australia
Foundation
NORMA Brazil
2016Acquisition
Autoline Business, France
2017
2018
Acquisition
Lifial, Portugal
Acquisition
Fengfan, China
Acquisition
Kimplas, India

20
NORMA Group well on Track for Coming E-Mobility Developments
NORMA Group will benefit from a graduated hybridization
Growth perspec-
tives
Battery Thermal Management
Coolant Systems
Power Electronics and Motors Cooling
HVAC / Heat Pump Systems
Content per engine type
Today‘s development
Future Growth
BEV
Hy-brid
ICE Closing the gap with new
product development
Content
Past
100% BEV
Hy-brid
ICE
*Source: LMC
ICE, Hybrid & EV development*
0
50
100
2016 2017 2018 2019 2020 2021 2022 2023 2024
ICE Hybrid BEV
Production volume in million

21
• Exhaust system and combustion engine parts being replaced with new business opportunities for thermal management and other components
Future Developments in Content per Vehicle
Internal Combustion Engine (Gasoline & Diesel)
Engine
Exhaust
system
Other
application
areas
Cooling
system
Battery Electric Vehicle Hybrid Gasoline
• Additional products e.g. for thermal management
Engine
Exhaust
system
Other
application
areas
Cooling
system &
battery
thermal
management
New BusinessNew Business
Thermal
management
battery
engine
Other
application
areas
Thermal
management
other
components
& HVAC
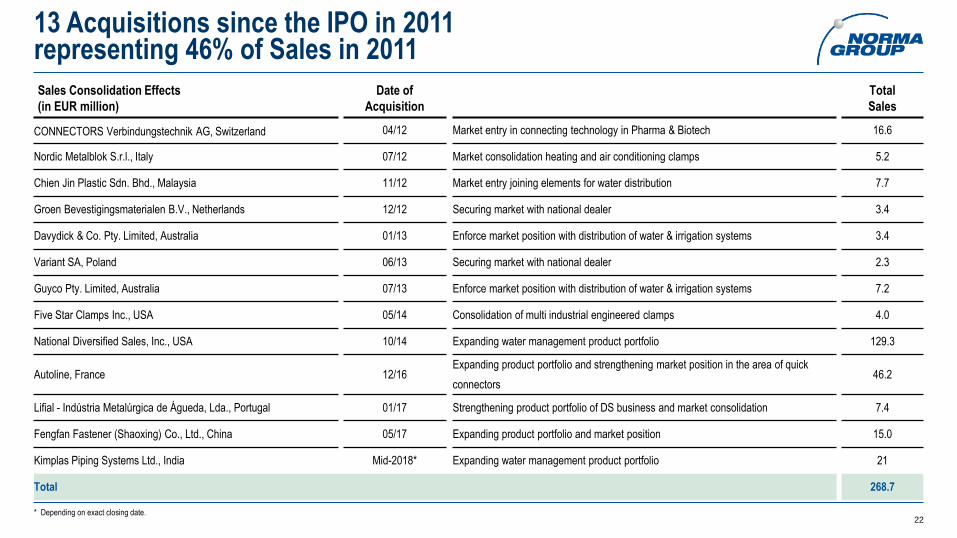
22* Depending on exact closing date.
13 Acquisitions since the IPO in 2011 representing 46% of Sales in 2011
Sales Consolidation Effects
(in EUR million)
Date of
Acquisition
Total
Sales
CONNECTORS Verbindungstechnik AG, Switzerland 04/12 Market entry in connecting technology in Pharma & Biotech 16.6
Nordic Metalblok S.r.l., Italy 07/12 Market consolidation heating and air conditioning clamps 5.2
Chien Jin Plastic Sdn. Bhd., Malaysia 11/12 Market entry joining elements for water distribution 7.7
Groen Bevestigingsmaterialen B.V., Netherlands 12/12 Securing market with national dealer 3.4
Davydick & Co. Pty. Limited, Australia 01/13 Enforce market position with distribution of water & irrigation systems 3.4
Variant SA, Poland 06/13 Securing market with national dealer 2.3
Guyco Pty. Limited, Australia 07/13 Enforce market position with distribution of water & irrigation systems 7.2
Five Star Clamps Inc., USA 05/14 Consolidation of multi industrial engineered clamps 4.0
National Diversified Sales, Inc., USA 10/14 Expanding water management product portfolio 129.3
Autoline, France 12/16Expanding product portfolio and strengthening market position in the area of quick
connectors46.2
Lifial - Indústria Metalúrgica de Águeda, Lda., Portugal 01/17 Strengthening product portfolio of DS business and market consolidation 7.4
Fengfan Fastener (Shaoxing) Co., Ltd., China 05/17 Expanding product portfolio and market position 15.0
Kimplas Piping Systems Ltd., India Mid-2018* Expanding water management product portfolio 21
Total 268.7

23
Acquisition of the Autoline business from Parker Hannifin
M&A Acquisition of all assets of the Autoline business from Parker Hannifin in November 2016
Business
Model
Global supplier of quick connectors for all types of automotive fluid line applications
Based in Guichen, France, with production sites in France, Mexico and China
HistoryFor more than 20 years the company has been designing, manufacturing and marketing quick connectors for
fuel lines, cooling lines, vapor lines, braking assistance lines and SCR (Selective Catalytic Reduction) circuit
lines
Sales Sales of around EUR 40 million in financial year 2016 (Jul 1, 2015 – Jun 30, 2016)
Consoli-
dationFirst time consolidation into NORMA Group starting December 2016
Financing Transaction was financed with credit facilities
Margin In the range of NORMA Group’s margin

24
Acquisition of Lifial
M&A Acquisition of Lifial – Indústria Metalúrgica de Águeda, Lda. (‘Lifial’), Portugal, in January 2017
Business
Model
Manufacturer of metal clamps for the use in industry and agriculture (distribution business)
Based in Águeda, Portugal
HistoryFor more than 28 years the company has been manufacturing heavy duty clamps, pipe supporting clamps, and
U-bolt clamps for mounting antennas and solar modules and has been selling them to customers in Europe and
North Africa
SalesSales of around EUR 8 million in financial year 2015
(thereof approx. EUR 1 million sales directly with NORMA Group)
Margin In the range of NORMA Group’s margin
Consoli-
dationFirst time consolidation into NORMA Group starting January 2017
Adjustments No operational adjustments planned from acquisition

25
Acquisition of Fengfan
M&A Acquisition of 80% of Fengfan Fastener (Shaoxing) Co., Ltd. (‘Fengfan’), China
Business
Model
Manufacturer of joining products made of stainless steel, nylon and specialty materials
Based in Shaoxing City, China
HistoryFounded in 1988, the company has been manufacturing cable ties, fastening elements and specially coated,
fire-resistant textiles and has been selling them to customers in the shipbuilding and heavy industries as well as
to manufacturers of transport vehicles mainly in China
Sales Sales of around EUR 15 million in financial year 2016
Margin In the range of NORMA Group’s margin
Consoli-
dationFirst time consolidation into NORMA Group in May 2017
Adjustments No operational adjustments planned from acquisition

26
Efficient Landscape
Irrigationca. 27%
Flow Managementand Others ca. 18%
Stormwater Managementca. 55%
NDS Provides Full Breadth of Water Management Solutions
Broad diversification in terms of application areas and products
Large target markets for all NDS application areas nationwide and international
International expansion with mid-term focus

27
68%
32%
Wholesale Retail
NDS Has Deep and Longstanding Customer Relationships
Headquarter
Manufacturing Site
Warehouse
Over 7,500 customer locations Nation-wide presence
• More than 4,300 products
• Over 7,500 customer locations (retail and wholesale customers)
• Two production sites (CA), six warehouses in the US, more than 500 employees
• Overnight shipment for wholesale orders
• 98% on-time delivery
Highly differentiated distribution and service model

28
Balanced Industry Mix with Two Strong Ways to Market*
* Sales FY 2017 (2016 in brackets)
18%(19%)
19% (21%)
21%(26%)
10% (5%)
32%(29%)
DS37% (40%)
EJT63% (60%)
thereof
commercial vehicle OEM
thereof industrial
supplier
thereof water
management
thereof general
distribution products
thereof passenger
vehicle OEM

29
Historic Growth Track Record
Historic Revenue Development in EUR million
277
121 138 150 174 182 198 207 229 242
385458
330
490
581605 636
695
890 895
1,017
1997 1998 1999 2000 2001 2002 2003 2004 2005 2006 2007 2008 2009 2010 2011 2012 2013 2014 2015 2016 2017
1997 to 2017: 20 years of a successful growth story

30
1,017
306
65 64 60 36 30 24 21
0
200
400
600
800
1000
NORMAGroup
Oetiker IdealTridon
Caillau Müpro TJBC VossIndustries
Mikalor Straub
• NORMA Group expects to grow even faster than its end-markets
Convincing Growth Prospects
Clear global market leader in Clamp / Connect Excellent growth outlook across EJT market
Additional growth for Joining
Technology market above
market growth
Passenger vehicles add. 2- 4%
Commercial vehicles add. 2- 4%
Agricultural equipment add. 2- 4%
Construction equipment add. 2- 4%
Engines add. 2- 4%
White goods same level
Water management add. 2- 4%
Clamp (ca. 33%) / Connect (ca. 23%)
Fluidca.
44%
ca.
56%
DE CH US DEFR USCN CHES
Sales in EUR million (year)*
* NORMA Group sales 2017 / Others: latest publicly available data

31
Basis for premium pricing
Premium Pricing through Technology and Innovation Leadership in Mission-Critical Components
Mission-criticality: Small relative costs – high impact
ca. EUR 224content per vehicle
in total
< 0.1%content per vehicle
ca. EUR 350,000costs an average
harvester
High switching costs for customers
Market leadership Technology Quality Innovation Tailor-made solutions
ca. EUR 23in the engine
ca. EUR 24in the cooling system
ca. EUR 82in the exhaust system
ca. EUR 95in other application areas

32
• More than 40,000 products, manufactured in 27 locations and sold to more than 10,000 customers in 100 countries
• Top 5 customers account only for around 14% of 2017 sales
Enhanced Stability through Broad Diversification Across Products, End-Markets and Regions
Examples of NORMA Group’s key end markets
Passenger vehicles
Construction /
infrastructure / water
management
Commercial vehiclesEngines Construction equipment
Agricultural equipment Shipbuilding White goods Pharma & BiotechWholesalers & technical
distributors

33
Good Balance in the Two Distinct Ways-to-Market
Unique business model with two distinct
ways-to-market• Significant economies of
scale in production• Resident engineers with close contact to international
EJT customers• No. 1 national and
international DS service level and DS product portfolio
Innovation and product solution partner
for customers, focused on engineering
expertise with high value-add
High quality, branded and standardized
joining products provided at competitive
prices to broad range of customers
• High quality, standardized joining
technology products
• No. 1 product portfolio & service level
• B2C
• Customized, engineered solutions
• 913 patents and utility models
• B2B
Engineered Joining Technology (EJT)ca. 63% of 2017 sales
Distribution Services (DS)ca. 37% of 2017 sales

34
A world without NORMA Group Customer impact
• Reputation loss
• Image loss
Loss of end-customers
• Warranty costs
• Non-compliance with legal requirements/regulations
NORMA Group Provides Mission-Critical Products and Solutions with Clear Added-Value
35
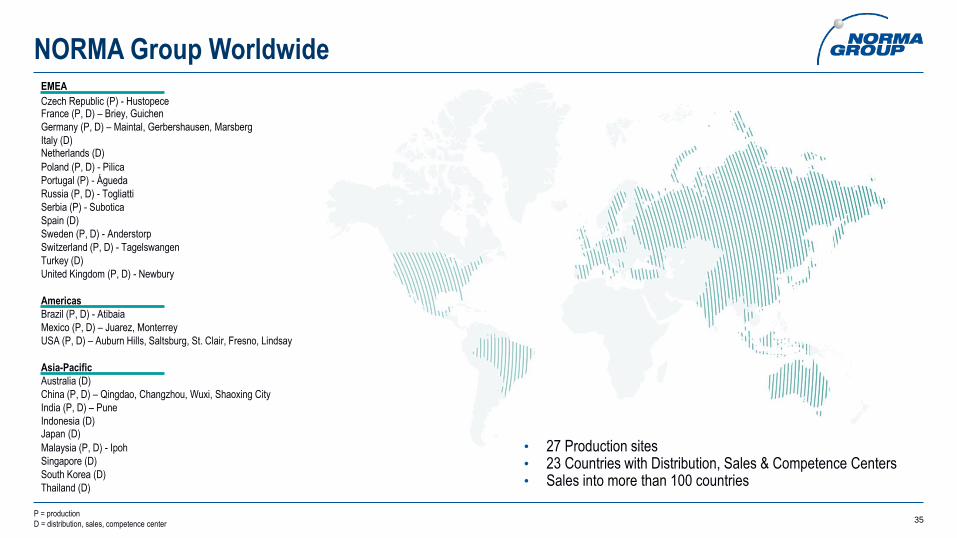
NORMA Group Worldwide
P = production
D = distribution, sales, competence center
• 27 Production sites• 23 Countries with Distribution, Sales & Competence Centers• Sales into more than 100 countries
EMEA
Czech Republic (P) - HustopeceFrance (P, D) – Briey, Guichen
Germany (P, D) – Maintal, Gerbershausen, Marsberg
Italy (D)Netherlands (D)
Poland (P, D) - Pilica
Portugal (P) - Águeda
Russia (P, D) - Togliatti
Serbia (P) - Subotica
Spain (D)
Sweden (P, D) - Anderstorp
Switzerland (P, D) - Tagelswangen
Turkey (D)
United Kingdom (P, D) - Newbury
Americas
Brazil (P, D) - Atibaia
Mexico (P, D) – Juarez, Monterrey
USA (P, D) – Auburn Hills, Saltsburg, St. Clair, Fresno, Lindsay
Asia-Pacific
Australia (D)
China (P, D) – Qingdao, Changzhou, Wuxi, Shaoxing City
India (P, D) – Pune
Indonesia (D)Japan (D)
Malaysia (P, D) - Ipoh
Singapore (D)
South Korea (D)
Thailand (D)

36
NORMA Group – Key Investment Highlights
1
2
3
4
6
Market leader in attractive engineering niche markets
Strong development and growth opportunities in e-mobility and water management
Enhanced stability through broad diversification across products, end markets and regions
Engineered products with premium pricing through technology and innovation leadership in mission-critical
components
Significant growth and value creation opportunity through synergistic acquisitions
5 Strong global distribution network with one-stop-shopping service to specialized dealers, wholesalers and distributors
7 Proven track record of operational excellence

37
Highlights 2017 – Strategy
M&ASuccessful acquisition of Lifial, Portugal, who has been manufacturing metal clamps for 28 years for use in
industry and agriculture
M&ASuccessful acquisition of Fengfan, China, who has been manufacturing joining products made of stainless steel,
nylon and specialty materials
E-MobilityIncreased business volume and development contracts with customers for electric and hybrid passenger cars
and trucks
CR
RoadmapLaunch of new CR Roadmap for the period until 2020 with defined targets for the next three years

38
Outlook 2018 – Strategy
1
2
3
5 Continue proven track record of operational excellence
4 Continue dialogue with potential M&A targets in various industries and regions
Continue to develop product and service solutions for
Expanding water business
Continue to explore business opportunities particularly in Asia-Pacific to expand regional business and further
improve profitability

39
Management Board of NORMA Group SE
• Chief Financial Officer (CFO) of NORMA Group SE
since July 2015
Responsibilities: Finance, Controlling, Investor Relations,
Treasury&Insurances, IT, Legal and M&A, Risk Management, Compliance,
Internal Audit, Compliance, Corporate Responsibility
Professional background
• 2010 – 2015: Managing Director / CFO, FTE automotive Group
• 2006 – 2009: Member of the Management Board, Veritas AG
• 2003 – 2006: CFO, Aesculap AG (B. Braun Melsungen Group)
• Previous: Various international management positions, thereof 3 years in Brazil
Studies / professional education
• Master’s degree in business economics at the Justus-Liebig-University of Gießen
• PhD in Economics at the Justus-Liebig-University of Gießen
• Chief Executive Officer (CEO) of NORMA Group SE
since January 1, 2018
Responsibilities: Business Development, Group Com-
munications, Sales, Product Development, Marketing,
Personnel, Production, Purchasing, Supply Chain Manage-
ment, Operational Global Excellence, Quality
Professional background
• 2011 – 2017: Board Member Business Development at NORMA Group SE
• 2014 – 2016: President Asia-Pacific at NORMA Group
• 2010 – 2011: Managing Director of the Business Unit Business Development at
NORMA Group GmbH
• 1995 – 2009: Various management positions at NORMA Group and its predecessor
companies
• 1997 – 1998: Management position at Rasmussen Group in the US
• 1991 – 1995: Development Engineer at Rasmussen GmbH
Studies/professional education
• Master’s degree in Mechanical Engineering from the Technical University of Central
Hessen • Third Management Board Member (COO) to be appointed
Dr. Michael SchneiderBernd Kleinhens

40
AppendixFull Year Results 2017

41
Highlights 2017 – Financials (I)
Sales Sales of EUR 1,017.1 million (2016: EUR 894.9 million) leads to growth of 13.7%
Adjusted
EBITAAdjusted EBITA of EUR 174.5 million (2016: EUR 157.5 million)
Margin Adjusted EBITA margin at 17.2% (2016: 17.6%); 8th year of sustainable margin higher than 17.0%
Tax rate US tax reform leads to a positive one-off non-cash tax effect of EUR 33.9 million in 2017
EPSStrong adjusted EPS of EUR 3.29 (2016: EUR 2.96)
Reported EPS including US tax effect improved by 58.0% to EUR 3.76 (2016: EUR 2.38)

42
Highlights 2017 – Financials (II)
* Net debt excluding derivative financial liabilities of EUR 1.4 million (2016: EUR 2.2 million)
Guidance
2018
Solid organic growth of around 3% to 5%, plus around EUR 5 million from acquisitions
Sustainable adjusted EBITA margin on the level of the last years of above 17.0%
DividendDividend proposal to the AGM of EUR 1.05 per share – increase of 10.5% compared to previous year
31.9% or EUR 33.5 million of adjusted net income of EUR 105.0 million
Net Operating
Cash Flow
Lower net operating cash flow of EUR 132.9 million (2016: EUR 148.5 million) due to temporarily higher growth
related working capital needs
Net Debt*Net debt* decreased to EUR 343.4 million (2016: EUR 392.0 million) including the acquisitions financing and
dividend payment
EquityStrong balance sheet with an equity ratio of 40.7% (2016: 36.2%) despite dividend and acquisition payments
including positive US tax effect
Leverage Net debt* / adj. EBITDA leverage decreased to 1.7x (2016: 2.1x)

43
48%(48%)40%
(43%)
12%(9%)
EMEA
Americas
APAC
381.6 411.3
0
250
500
2016 2017
81.3 119.90
250
500
2016 2017
432.0485.9
0
250
500
2016 2017
• EMEA: Solid growth in EJT includes favorable OEM business while DS sales were also positive – this led in total to a growth of +12.5% including negative currency effects and consolidation of Autoline and Lifial.
• Americas: Strong increase in EJT sales due to recovery of commercial vehicle, agricultural and construction machinery while DS showed a slight growth. Negative currency effects and the consolidation of Autoline led to a growth of +7.8%.
• Asia-Pacific: Strong organic growth in the region includes strong growth in EJT as well as in DS. Negative currency effects and the consolidation of Autolineand Fengfan led to a total growth of 47.6% for the region.
Sales by Region
Regional Split (in % actual vs. (prev. year))
Sales EMEA (in EUR million)
Sales Asia-Pacific (in EUR million)
Sales Americas (in EUR million)
+12.5%
+47.6%
+7.8%

44
Sales of EUR 1,017.1 million with Solid Organic Growth of 8.6%
Sales Development in EUR million
Sales 2016 2017 Change Change in % Thereof
organic
Thereof
acquisitions
Thereof
currency
Q1 226.6 254.9 28.3 12.5% 4.6% 6.5% 1.4%
Q2 236.2 264.1 27.9 11.8% 4.9% 5.9% 1.0%
Q3 216.6 244.4 27.8 12.8% 8.6% 7.3% -3.1%
Q4 215.5 253.6 38.2 17.7% 16.8% 5.9% -5.0%
FY 894.9 1,017.1 122.2 13.7% 8.6% 6.4% -1.4%
• Solid organic growth of 8.6% mainly due to an increase of the global production output of the passenger and commercial
vehicle markets as well as new customer and contract wins which led to a high demand for joining products in all regions
• Acquisitive growth of 6.4% from Autoline, Lifial and Fengfan in 2017
• Currency changes in 2017 led to sales decrease of 1.4%
45
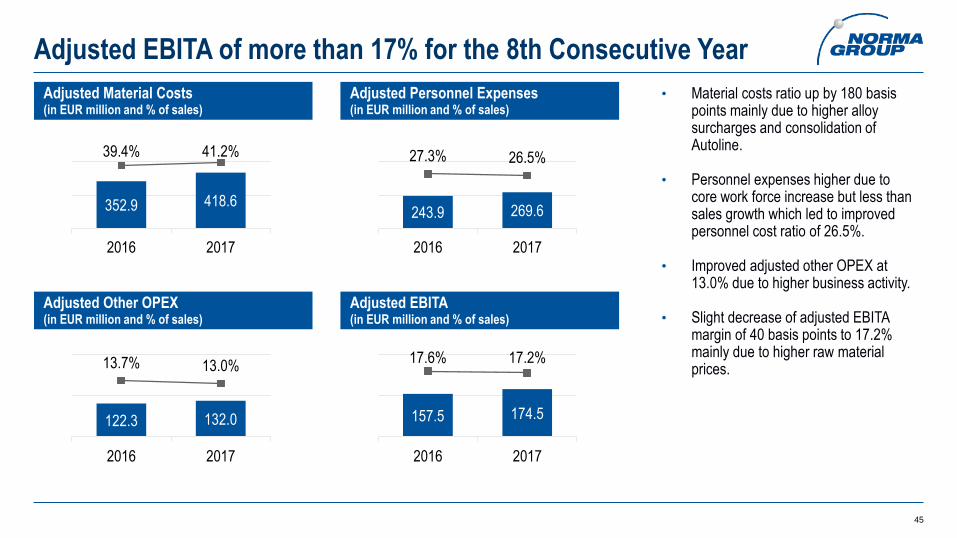
Adjusted EBITA of more than 17% for the 8th Consecutive Year
• Material costs ratio up by 180 basis points mainly due to higher alloy surcharges and consolidation of Autoline.
• Personnel expenses higher due to core work force increase but less than sales growth which led to improved personnel cost ratio of 26.5%.
• Improved adjusted other OPEX at 13.0% due to higher business activity.
• Slight decrease of adjusted EBITA margin of 40 basis points to 17.2% mainly due to higher raw material prices.
Adjusted Material Costs (in EUR million and % of sales)
Adjusted Personnel Expenses (in EUR million and % of sales)
Adjusted EBITA (in EUR million and % of sales)
Adjusted Other OPEX(in EUR million and % of sales)
352.9 418.6
39.4% 41.2%
0%
25%
50%
0
250
500
2016 2017
243.9 269.6
27.3% 26.5%
0%
20%
40%
0
250
500
2016 2017
122.3 132.0
13.7% 13.0%
0%
10%
20%
0
150
300
2016 2017
157.5 174.5
17.6% 17.2%
0%
10%
20%
0
150
300
2016 2017

46
Operational Adjustments on EBITA level
in EUR million 2010 2011 2012 2013 2014 2015 2016 2017
Reported EBITA 64.9 84.7 105.2 112.1 113.3 150.5 150.4 166.8
+ Restructuring costs 1.3 1.8 0 0 0 0 0 0
+ Non-recurring/non-period-related items 15.5* 14.8* 0 0 6.9 3.6 4.8 3.5
+ Other group and normalized items 0.7 0.2 0 0 0 0 0 0
+ PPA depreciation 3.0 1.2 0.2 0.5 1.3 2.2 2.3 4.2
Adjusted EBITA 85.4 102.7 105.4 112.6 121.5 156.3 157.5 174.5
* mostly IPO related costs
• Operational adjustments from the Autoline, Lifial and Fengfan acquisitions in 2017 of EUR 3.5 million

47
Operational Adjustments 2017
in EUR million Reported Adjustments Adjusted
Sales 1,017.1 1,017.1
EBITDA 196.33.5
(incl. EUR 2.9 million integration costs & EUR 1.1 million inventory-step-ups & EUR -0.5
million reimbursement of transaction taxes)
199.7
EBITDA margin 19.3% 19.6%
EBITA 166.8 7.7(incl. EUR 4.2 million depreciation PPA)
174.5
EBITA margin 16.4% 17.2%
EBIT 137.8 28.2(incl. EUR 20.5 million amortization PPA)
166.0
EBIT margin 13.5% 16.3%
Net Profit 119.8 -14.8(incl. EUR -33.9 million US tax effect & EUR -9.1 million post tax impact)
105.0
Net Profit margin 11.8% 10.3%
EPS (in EUR) 3.76 -0.47 3.29
• Operational adjustments on EBITDA level due to the recent acquisitions • Higher reported EPS of EUR 3.76 compared to adjusted EPS of EUR 3.29 due to positive one-off non-cash US tax effect of EUR 1.06 per share• Tax effect overcompensated operational and PPA adjustments and led to a total EPS effect of EUR -0.47
* Deviations may occur due to commercial rounding.

48
Outlook on Adjustments 2018 – 2019
in EUR million FY 2017 FY 2018* FY 2019*
EBITDA level
3.5(incl. EUR 2.9 million integration costs & EUR 1.1 million
inventory-step-ups & EUR -0.5 million reimbursement of
transaction taxes)
0 0
EBITA level7.7
(incl. EUR 4.2 million depreciation PPA)
ca. 4
(depreciation PPA)
ca. 3
(depreciation PPA)
EBIT level28.2
(incl. EUR 20.5 million amortization PPA)
ca. 25
(incl. ca. EUR 21 million amortization PPA)
ca. 22
(incl. ca. EUR 19 million amortization PPA)
Net Profit-14.8
(incl. EUR -33.9 million US tax effect & EUR -9.1million
post tax impact)
ca. 18 ca. 16
EPS (in EUR) -0.47 ca. 0.57 ca. 0.50
* depending on foreign exchange rates
49
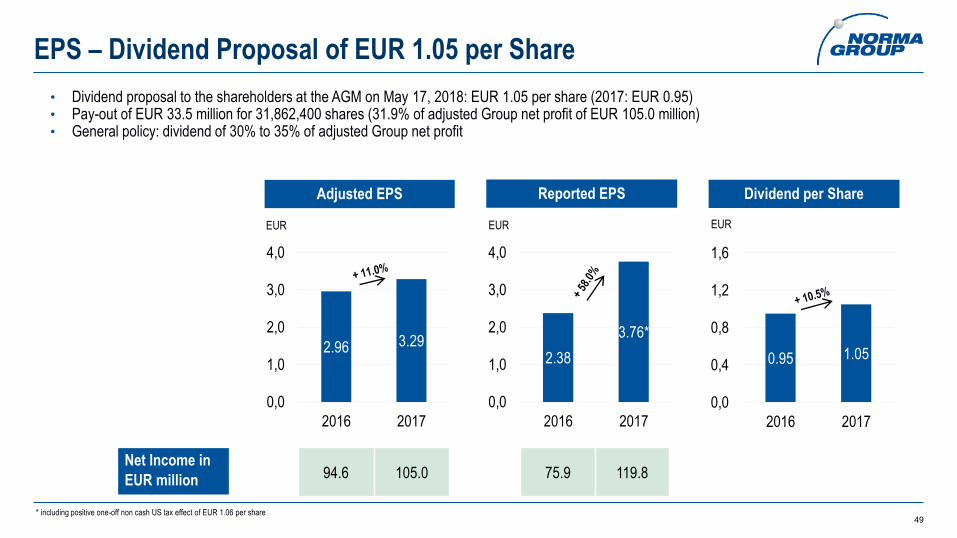
EPS – Dividend Proposal of EUR 1.05 per Share
• Dividend proposal to the shareholders at the AGM on May 17, 2018: EUR 1.05 per share (2017: EUR 0.95)• Pay-out of EUR 33.5 million for 31,862,400 shares (31.9% of adjusted Group net profit of EUR 105.0 million)• General policy: dividend of 30% to 35% of adjusted Group net profit
Adjusted EPS
2.96 3.29
0,0
1,0
2,0
3,0
4,0
2016 2017
EUR
Reported EPS
EUR
2.38
3.76*
0,0
1,0
2,0
3,0
4,0
2016 2017
Dividend per Share
EUR
0.95 1.05
0,0
0,4
0,8
1,2
1,6
2016 2017
94.6 105.0 75.9 119.8Net Income in
EUR million
* including positive one-off non cash US tax effect of EUR 1.06 per share

50
Profit & Loss (adjusted & reported)
in EUR million Adjusted Reported
2016 2017 2016 2017
Sales 894.9 1,017.1 894.9 1,017.1
Gross profit 545.6 601.3 544.9 600.2
EBITDA 179.4 199.7 174.6 196.3
in % of sales 20.0 19.6 19.5 19.3
EBITA 157.5 174.5 150.4 166.8
in % of sales 17.6 17.2 16.8 16.4
EBIT 147.7 166.0 120.0 137.8
in % of sales 16.5 16.3 13.4 13.5
Financial result -14.6 -16.1 -14.6 -16.1
Profit before tax 133.0 149.9 105.4 121.7
Taxes -38.5 -44.9 -29.5 -1.9
in % of Profit before tax 28.9 30.0 28.0 1.6
Net profit 94.6 105.0 75.9 119.8
51
-46 -41 -38 -59 -81 -101 -120 -146
65 67 74 80 115 130 140 15170 81 79 90
108123 124
153
18.1% 18.3% 18.5%17.4%
18.1%*17.1%
16.1% 15.6%
0%
5%
10%
15%
20%
-200
-100
0
100
200
300
400
2010 2011 2012 2013 2014 2015 2016 2017
Trade accounts payable Inventories Trade receivables Trade working capital
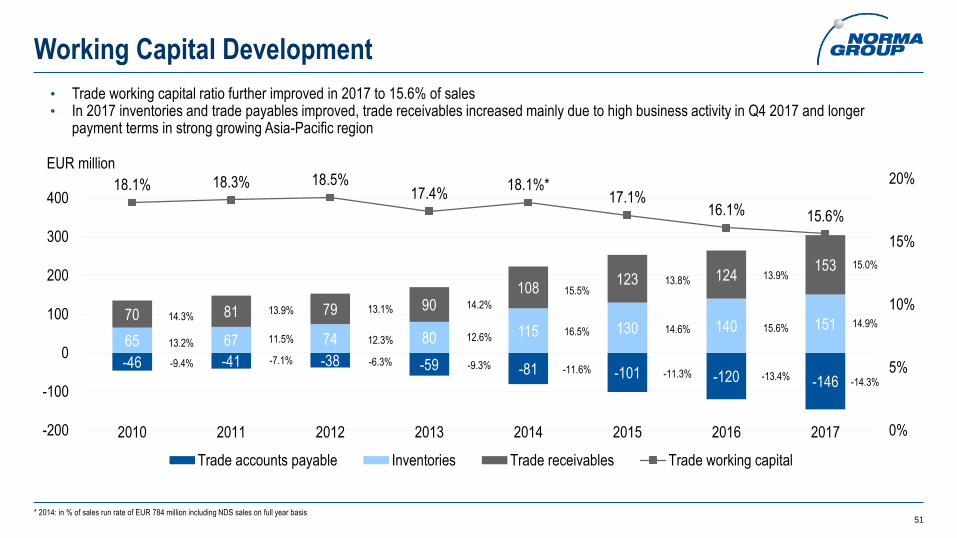
Working Capital Development
• Trade working capital ratio further improved in 2017 to 15.6% of sales• In 2017 inventories and trade payables improved, trade receivables increased mainly due to high business activity in Q4 2017 and longer
payment terms in strong growing Asia-Pacific region
EUR million
* 2014: in % of sales run rate of EUR 784 million including NDS sales on full year basis
13.9%
11.5%
-7.1%
13.2%
14.3%
-9.4% -6.3%
12.3%
13.1%
-9.3%
12.6%
14.2%
-11.6%
16.5%
15.5%
-11.3%
14.6%
13.8%
-13.4%
15.6%
13.9%
-14.3%
14.9%
15.0%

52
484 534
120
-30-40*
0
100
200
300
400
500
600
Equity 2016 Profit Dividend Others* Equity 2017
Equity Ratio on Strong Level of 40.7%
• Equity increased by EUR 50 million with strong profit of EUR 120 million• Equity ratio increased despite currency changes and dividend payment due to a strong business activity including positive US tax effect
36.2%
* mainly exchange differences on translation of foreign operations of EUR -36 million
EUR million
40.7%
Balance
Sheet Total
(in EUR million)
1,338 1,312

53
Net Debt and Financing
Net Debt* (in EUR million)
-166 -155
558498
-200
0
200
400
600
Dec 31, 2016 Dec 31, 2017Cash Debt
343392
Leverage** Dec 31, 2016 Dec 31, 2017
(Net debt* / adjusted LTM EBITDA) 2.1 x 1.7 x
Gearing Dec 31, 2016 Dec 31, 2017
(Net debt* / equity) 0.8 x 0.6 x
* excl. derivative financial liabilities of EUR 1.4 million (Dec 31, 2016: EUR 2.2 million); Leverage incl. derivatives: 1.7x (Dec 31, 2016: 2.1x); Gearing incl. derivatives: 0.6x (Dec 31, 2016: 0.8x)
** 2017 EBITDA includes full year EBITDA from Fengfan

54
Solid Maturity Profile
Maturity Profile (in EUR million) – Financial Instruments
5 5 5 5 6526 29 21
103
33 45
6341
42
2018 2019 2020 2021 2022 2023 2024 2025 2026
Promissory Note 3Promissory Note 2Promissory Note 1Bank Borrowings
Maturity Profile (in EUR million) – Currencies
27 29 30 50 14 51 45 424
79
4
51
51 11
2018 2019 2020 2021 2022 2023 2024 2025 2026
USDEUR

55
in EUR million Dec 31, 2016 Dec 31, 2017
Assets
Non-current assets
Goodwill / Other intangible assets /
Property, plant & equipment865.5 817.6
Other non-financial assets / Derivative
financial assets /
Deferred- and income tax assets
9.5 7.9
Total non-current assets 875.0 825.5
Current assets
Inventories 139.9 151.2
Other non-financial / other
financial / derivative financial / income
tax assets
33.0 27.3
Trade and other receivables 124.2 152.7
Cash and cash equivalents 165.6 155.3
Total current assets 462.7 486.6
Total assets 1,337.7 1,312.0
in EUR million Dec 31, 2016 Dec 31, 2017
Equity and liabilities
Equity
Total equity 483.6 534.3
Non-current and current
liabilities
Retirement benefit obligations / Provisions 30.9 30.9
Borrowings and
other financial liabilities557.6 498.8
Other non-financial liabilities 31.8 32.3
Tax liabilities and
derivative financial liabilities114.2 69.9
Trade payables 119.6 145.7
Total liabilities 854.1 777.7
Total equity and liabilities 1,337.7 1,312.0
Solid Development of Balance Sheet

56
Solid Net Operating Cash Flow in 2017
Net Operating Cash Flow
in EUR million 2011 2012 2013 2014 2015 2016 2017 Variance
Adjusted EBITDA 117.0 120.8 129.3 138.4 177.5 179.4 199.7 +11.4%
Δ ± Working capital -19.5 -9.8 +5.1 +10.4 -0.6 +17.0 -19.1 n/a
Net operating cash flow before investments
from operating business97.5 111.0 134.4 148.8 176.9 196.4 180.6 -8.0%
Δ ± Investments from operating business -30.7 -30.0 -30.5 -39.6 -42.2 -47.9 -47.7 -0.3%
Net operating cash flow 66.8 81.0 103.9 109.2 134.7 148.5 132.9 -10.5%
• Despite favorable adjusted EBITDA, net operating cash flow before investments decreased by EUR 15.8 million to a total of EUR 180.6 million in
2017 due to outflow of working capital to temporarily support the excellent growth in 2017
• 2017 CAPEX spending at EUR 47.7 million mainly for manufacturing facilities in the US, Mexico, Poland, Serbia, Germany, UK and China
• Net operating cash flow of EUR 132.9 million ensures dividend payment and gives flexibility for further acquisitions

57
64 39 85 103 105 113 121156 158 175
14.1%11.7%
17.4% 17.7% 17.4% 17.7% 17.5% 17.6% 17.6% 17.2%
0%
5%
10%
15%
20%
0
100
200
300
400
2008 2009 2010 2011 2012 2013 2014 2015 2016 2017
129 111 124 144 156 169 188234 244
270
28.2%
33.6%
25.3% 24.7% 25.9% 26.7% 27.1% 26.3% 27.3% 26.5%
0%
10%
20%
30%
40%
0
100
200
300
400
2008 2009 2010 2011 2012 2013 2014 2015 2016 2017
251182
275323 344 371 406
533 546601
54.9% 55.3% 56.0% 55.5% 57.0% 58.4% 58.4% 59.9% 61.0% 59.1%
0%
20%
40%
60%
0
200
400
600
800
2008 2009 2010 2011 2012 2013 2014 2015 2016 2017
Continuation of Growth Track and Sustainable Margin in 2017
Revenue (in EUR million)
Adjusted EBITA (in EUR million)
of sales
Gross Profit (in EUR million)
of sales
Personnel Expenses (in EUR million)
458330
490581 605 636 695
890 8951,017
0
300
600
900
1200
2008 2009 2010 2011 2012 2013 2014 2015 2016 2017
58
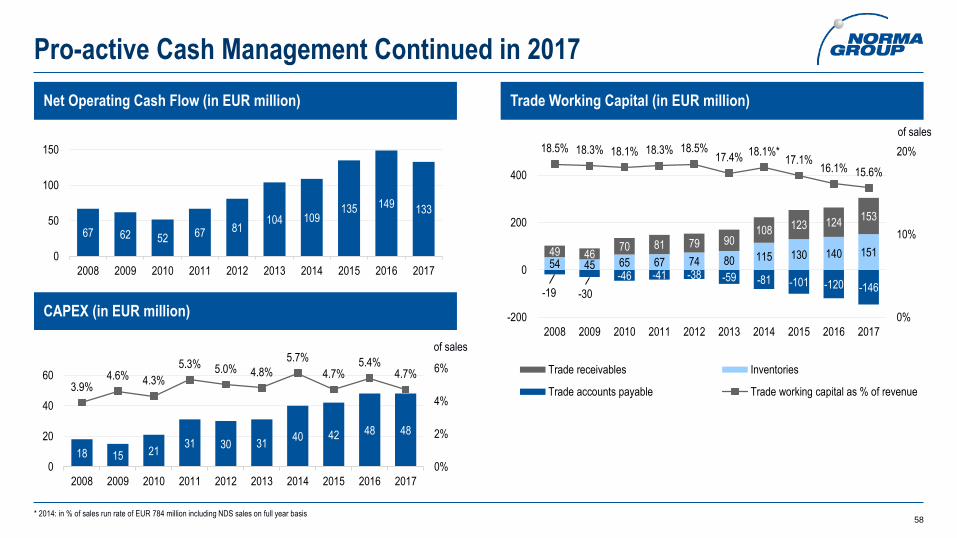
Pro-active Cash Management Continued in 2017
* 2014: in % of sales run rate of EUR 784 million including NDS sales on full year basis
-19 -30
-46 -41 -38 -59 -81 -101 -120 -146
54 45 65 67 74 80 115 130 140 15149 4670 81 79 90
108 123 124153
18.5% 18.3% 18.1% 18.3% 18.5%17.4%
18.1%*17.1%
16.1% 15.6%
0%
10%
20%
-200
0
200
400
2008 2009 2010 2011 2012 2013 2014 2015 2016 2017
Trade receivables Inventories
Trade accounts payable Trade working capital as % of revenue
Net Operating Cash Flow (in EUR million)
of sales
Trade Working Capital (in EUR million)
CAPEX (in EUR million)
67 62 52 67 81104 109
135 149133
0
50
100
150
2008 2009 2010 2011 2012 2013 2014 2015 2016 2017
18 15 2131 30 31
40 42 48 48
3.9%4.6% 4.3%
5.3% 5.0% 4.8%
5.7%
4.7%5.4%
4.7%
0%
2%
4%
6%
0
20
40
60
2008 2009 2010 2011 2012 2013 2014 2015 2016 2017
of sales

59
Identified Institutional Shareholders*
Milestones and Current Shareholder Structure
24%
27%19%
5%
13%12%
Germany United Kingdom USA Nordic France Rest of World
Free Float as of April 30, 2018 includes
Allianz Global Investors GmbH, Germany 10.00% Impax Asset Management Group Plc, UK 3.31%
Ameriprise Financial Inc., USA 5.57% The Capital Group Companies, USA 3.05%
AXA S.A., France 4.98% NORMA Group Management* 0.90%
BNP Paribas Asset Management S.A., France 4.91%
* as of March 31, 2018
Milestones and Free Float Changes
IPO with ca. 36% free
floatSDAX listing
100% freefloat
MDAX listing
Apr 2011 Since Jan
2013
Jun 2011 Mar 2013

60
Index-based Share Price Performance compared with MDAX & DAX
-10%
0%
10%
20%
30%
40%
50%
Mar-17 May-17 Jul-17 Sep-17 Nov-17 Jan-18
NOEJ DAX MDAX

61
Event Date
Annual General Meeting in Frankfurt / Main May 17, 2018
Publication Interim Results Q2 2018 August 1, 2018
Publication Interim Results Q3 2018 November 7, 2018
Contact
Andreas Troesch
Vice President Investor Relations
Phone: +49 6181 6102-741
Fax: +49 6181 6102-7641
E-mail: [email protected]
Internet: https://investors.normagroup.com/
Contact & Event Calendar

62
Disclaimer
This presentation contains certain future-oriented statements. Future-oriented statements include all statements which do not relate to historical facts and
events and contain future-oriented expressions such as ‘believe,’ ‘estimate,’ ‘assume,’ ‘expect,’ ‘forecast,’ ‘intend,’ ‘could’ or ‘should’ or expressions of a
similar kind. Such future-oriented statements are subject to risks and uncertainties since they relate to future events and are based on the company’s
current assumptions, which may not in the future take place or be fulfilled as expected.
The company points out that such future-oriented statements provide no guarantee for the future and that actual events including the financial position
and profitability of NORMA Group SE and developments in the economic and regulatory fundamentals may vary substantially (particularly on the down
side) from those explicitly or implicitly assumed or described in these statements.
Even if the actual results for NORMA Group SE, including its financial position and profitability and the economic and regulatory fundamentals, are in
accordance with such future-oriented statements in this presentation, no guarantee can be given that this will continue to be the case in the future.
Non audited data is based on management information systems and/or publicly available information. Both sources of data are for illustrative purposes
only.