Embed Size (px)
Citation preview

Full Year Results 2016
Maintal, March 22, 2017
NORMA Group SE

Page 2
M&ASuccessful acquisition of the global quick connector business from Autoline with locations in France,
China and Mexico
M&ASuccessful acquisition of Lifial, Portugal, who has been manufacturing metal clamps for 28 years for
use in industry and agriculture
CR Roadmap Set up of binding environmental targets for all global production sites
NDSContinuing cross selling of Distribution Service parts into sales channels of NDS within the US and
shipping NDS parts to Australia and Europe
R&DExpansion of test laboratories in all regions to validate new products and develop plastic materials for
Fluid systems

Page 3
Sales Sales of EUR 894.9 million (2015: EUR 889.6 million) leads to growth of 0.6%
Adjusted EBITA Adjusted EBITA of EUR 157.5 million (2015: EUR 156.3 million)
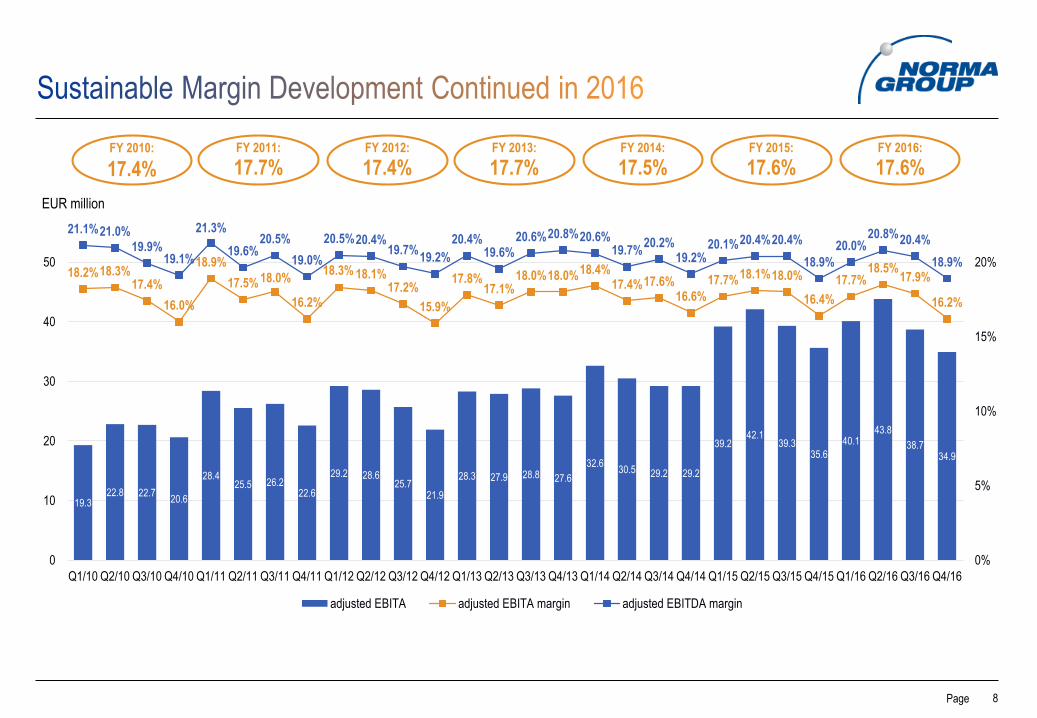
Margin Adjusted EBITA margin stable at 17.6% (2015: 17.6%); 7th year of sustainable margin higher than 17.0%
Adjusted
Tax rate
Improved adjusted tax rate at 28.9% (2015: 32.1%) mainly due to granted tax credits, an optimization of
US tax setup and lower US sales
EPSStrong adjusted EPS of EUR 2.96 (2015: EUR 2.78)
Reported EPS including acquisition related costs improved to EUR 2.38 (2015: EUR 2.31)

Page 4* Net debt excluding derivative financial liabilities of EUR 2.2 million (2015: EUR 3.4 million)
Guidance
2017
Moderate organic growth of around 1% to 3%, plus around EUR 45 million from acquisitions
Sustainable adjusted EBITA margin on the level of the last years of above 17.0%
DividendDividend proposal to the AGM of EUR 0.95 per share – increase of 5.6% compared to previous year
32.0% or EUR 30.3 million of adjusted net income of EUR 94.6 million
Net Operating
Cash FlowStrong increase of net operating cash flow to EUR 148.5 million (2015: EUR 134.7 million)
Net Debt*Net debt* increased moderately to EUR 392.0 million (2015: EUR 357.5 million) despite the Autoline
acquisition and dividend payment
EquityStrong balance sheet with an equity ratio of 36.2% (2015: 36.8%) despite dividend payment and higher
balance sheet total due to the Autoline acquisition
LeverageNet debt* / adj. EBITDA leverage of 2.1x (2015: 2.0x) increased only slightly despite acquisition
financing and dividend payment

Page 5
395.3 381.6
0
250
500
2015 2016
78.2 81.30
250
500
2015 2016
416.0 432.0
0
250
500
2015 2016
48%(47%)43%
(44%)
9%(9%)
EMEA
Americas
APAC
EMEA: Solid growth in EJT includes favorable automotive business while DS sales were slightly negative – this led in total to a growth of +3.8% including negative currency effects and start of consolidation of Autoline.
Americas: Strong decline in EJT sales due to downturn of commercial vehicle, agricultural and construction machinery while DS showed a solid growth led by excellent NDS business.
Asia-Pacific: Solid organic growth in the region includes strong growth in EJT and a slightly negative business in DS. Negative currency effects and the start of consolidation of Autoline led to a total growth of 3.9% for the region.
Regional Split in % actual vs. (prev. year) Sales EMEA in EUR million
Sales Asia-Pacific in EUR millionSales Americas in EUR million
+3.8%
+3.9%
-3.5%
12% by
destination

Page 6
Sales Development in EUR million
Sales 2015 2016 Change Change in % Thereof
organic
Thereof
acquisitions
Thereof
currency
Q1 221.5 226.6 5.1 2.3% 2.4% 0.0% -0.1%
Q2 232.8 236.2 3.4 1.4% 3.3% 0.0% -1.9%
Q3 218.3 216.6 -1.7 -0.7% -0.1% 0.0% -0.6%
Q4 217.0 215.5 -1.5 -0.7% -2.3% 1.6% 0.0%
FY 889.6 894.9 5.3 0.6% 0.9% 0.4% -0.7%
Organic growth slowed down during the year mainly due to lower than expected US commercial vehicles, agricultural
and construction machinery sector including aftermarket
Autoline has been consolidated since December 2016 and contributed 0.4% of growth in 2016
Only minor currency changes in 2016 led to sales decrease of 0.7%

Page 7
Historic Revenue Development in EUR million
277
121 138 150 174 182 198 207 229 242
385
458
330
490
581605
636695
890 895
1997 1998 1999 2000 2001 2002 2003 2004 2005 2006 2007 2008 2009 2010 2011 2012 2013 2014 2015 2016
1997 to 2016: 20 years of a successful growth story
Page 8
EUR million
19.322.8 22.7
20.6
28.425.5 26.2
22.6
29.2 28.625.7
21.9
28.3 27.9 28.8 27.6
32.630.5 29.2 29.2
39.242.1
39.335.6
40.143.8
38.734.9
18.2%18.3%17.4%
16.0%
18.9%
17.5% 18.0%
16.2%
18.3% 18.1%17.2%
15.9%
17.8%17.1%
18.0%18.0%18.4%17.4%17.6%
16.6%
17.7%18.1%18.0%
16.4%
17.7%18.5%
17.9%
16.2%
21.1%21.0%19.9%
19.1%
21.3%
19.6%20.5%
19.0%
20.5%20.4%19.7%
19.2%
20.4%19.6%
20.6%20.8%20.6%19.7%
20.2%19.2%
20.1%20.4%20.4%
18.9%
20.0%20.8%20.4%
18.9%
0%
5%
10%
15%
20%
0
10
20
30
40
50
Q1/10 Q2/10 Q3/10 Q4/10 Q1/11 Q2/11 Q3/11 Q4/11 Q1/12 Q2/12 Q3/12 Q4/12 Q1/13 Q2/13 Q3/13 Q4/13 Q1/14 Q2/14 Q3/14 Q4/14 Q1/15 Q2/15 Q3/15 Q4/15 Q1/16 Q2/16 Q3/16 Q4/16
adjusted EBITA adjusted EBITA margin adjusted EBITDA margin
FY 2010:
17.4%FY 2012:
17.4%FY 2011:
17.7%FY 2013:
17.7%FY 2014:
17.5%FY 2015:
17.6%FY 2016:
17.6%

Page 9
M&A Acquisition of Lifial – Indústria Metalúrgica de Águeda, Lda. (‘Lifial’), Portugal, in January 2017
Business
Model
Manufacturer of metal clamps for the use in industry and agriculture (distribution business)
Based in Águeda, Portugal
History
For more than 28 years the company has been manufacturing heavy duty clamps, pipe supporting
clamps, and U-bolt clamps for mounting antennas and solar modules and has been selling them to
customers in Europe and North Africa
SalesSales of around EUR 8 million in financial year 2015
(thereof approx. EUR 1 million sales directly with NORMA Group)
Margin In the range of NORMA Group’s margin
Consolidation First time consolidation into NORMA Group starting January 2017
Adjustments No operational adjustments planned from acquisition
Page 10
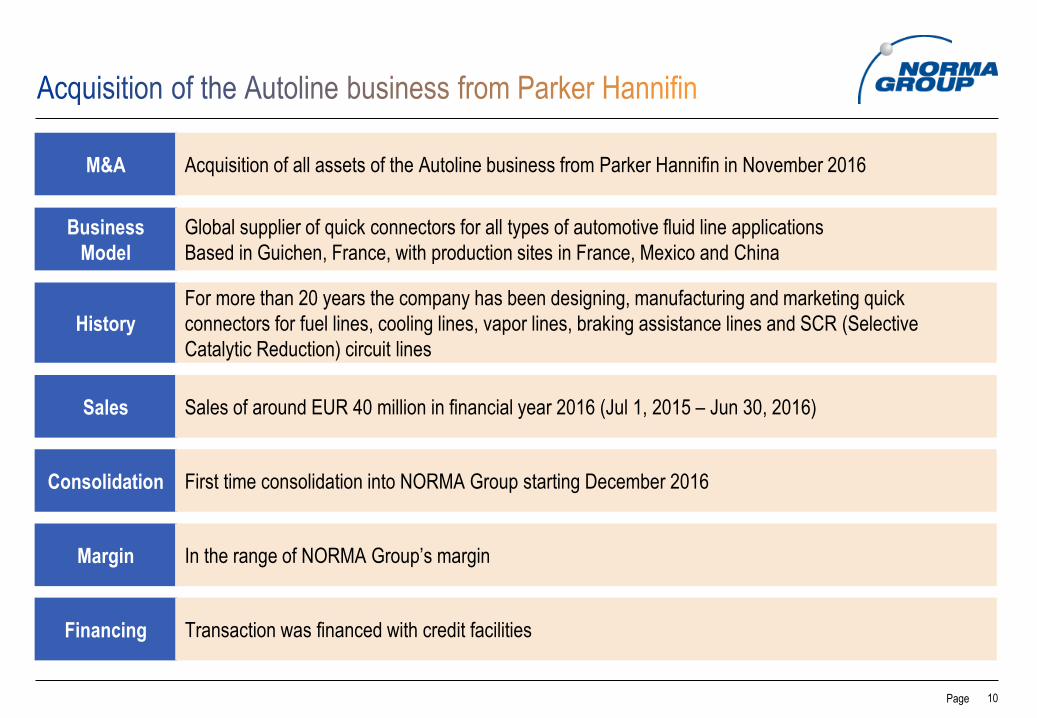
M&A Acquisition of all assets of the Autoline business from Parker Hannifin in November 2016
Business
Model
Global supplier of quick connectors for all types of automotive fluid line applications
Based in Guichen, France, with production sites in France, Mexico and China
History
For more than 20 years the company has been designing, manufacturing and marketing quick
connectors for fuel lines, cooling lines, vapor lines, braking assistance lines and SCR (Selective
Catalytic Reduction) circuit lines
Sales Sales of around EUR 40 million in financial year 2016 (Jul 1, 2015 – Jun 30, 2016)
Consolidation First time consolidation into NORMA Group starting December 2016
Financing Transaction was financed with credit facilities
Margin In the range of NORMA Group’s margin

Page 11* External Sales
Sales Consolidation Effects in EUR million
Date of
Acquisition
Total
Sales
CONNECTORS Verbindungstechnik AG, Switzerland 04/12 Market entry in connecting technology in Pharma & Biotech 16.6
Nordic Metalblok S.r.l., Italy 07/12 Market consolidation heating and air conditioning clamps 5.2
Chien Jin Plastic Sdn. Bhd., Malaysia 11/12 Market entry joining elements for water distribution 7.7
Groen Bevestigingsmaterialen B.V., Netherlands* 12/12 Securing market with national dealer 3.4
Davydick & Co. Pty. Limited, Australia 01/13 Enforce market position with distribution of water & irrigation systems 3.4
Variant SA, Poland* 06/13 Securing market with national dealer 2.3
Guyco Pty. Limited, Australia 07/13 Enforce market position with distribution of water & irrigation systems 7.2
Five Star Clamps Inc., USA 05/14 Consolidation of multi industrial engineered clamps 4.0
National Diversified Sales, Inc., USA 10/14 Expanding water management product portfolio 129.3
Autoline, France 12/16Expanding product portfolio and strengthening market position in the area of
quick connectors~ 40.0
Lifial* - Indústria Metalúrgica de Águeda, Lda.,
Portugal01/17 Strengthening product portfolio of DS business and market consolidation ~ 7.0
Total ~ 226.1

Page 12* FY 2016 (2015 in brackets)
19%(19%)
21% (20%)
26%(27%)
5% (8%)
29%(26%)
DS40% (39%)
EJT60% (61%)
thereof
commercial vehicle OEM
thereof industrial
supplier
thereof water
management
thereof general distribution
products
thereof passenger
vehicle OEM

Page 13
Favorable material costs in combination with improvements from the Global Excellence Program led to a better material cost ratio
Higher personnel expenses ratio mainly due to weak commercial vehicle, agricultural and construction machinery business in the US and investments into Asia-Pacific
Stable adjusted other OPEX at 13.7%
Adjusted Material Costs (in EUR million and % of sales) Adjusted Personnel Expenses (in EUR million and % of sales)
Adjusted EBITA (in EUR million and % of sales)Adjusted Other OPEX (in EUR million and % of sales)
362.9 352.9
40.8% 39.4%
0%
25%
50%
0
250
500
2015 2016
234.1 243.9
26.3% 27.3%
0%
20%
40%
0
250
500
2015 2016
121.5 122.3
13.7% 13.7%
0%
10%
20%
0
100
200
2015 2016
156.3 157.5
17.6% 17.6%
0%
10%
20%
0
100
200
2015 2016

Page 14
in EUR million 2010 2011 2012 2013 2014 2015 2016
Reported EBITA 64.9 84.7 105.2 112.1 113.3 150.5 150.4
+ Restructuring costs 1.3 1.8 0 0 0 0 0
+ Non-recurring/non-period-related items* 15.5 14.8 0 0 6.9 3.6 4.8
+ Other group and normalized items 0.7 0.2 0 0 0 0 0
+ PPA depreciation 3.0 1.2 0.2 0.5 1.3 2.2 2.3
Adjusted EBITA 85.4 102.7 105.4 112.6 121.5 156.3 157.5
* mostly IPO related costs in 2010/2011 and NDS in 2014/2015 as well as for Autoline in 2016
Operational adjustments after the Autoline acquisition in 2016 EUR 4.8 million costs related to Autoline in 2016 Further operational adjustments planned in 2017 for Autoline and for ongoing PPA adjustments

Page 15
in EUR million Reported Adjustments Adjusted
Sales 894.9 894.9
EBITDA 174.64.8
(incl. EUR 1.7 million transfer taxes; EUR 2.1 million acquisition costs;
EUR 0.4 million integration costs & EUR 0.6 million inventory-step-ups)
179.4
EBITDA margin 19.5% 20.0%
EBITA 150.47.1
(incl. EUR 2.3 million depreciation PPA)157.5
EBITA margin 16.8% 17.6%
EBIT 120.027.7
(incl. EUR 20.6 million amortization PPA)147.7
EBIT margin 13.4% 16.5%
Net Profit 75.918.7
(Post Tax Impact)94.6
Net Profit margin 8.5% 10.6%
EPS (in EUR) 2.38 0.58 2.96
Operational adjustments on EBITDA level due to the acquisition of Autoline EUR 0.58 adjustments on EPS level

Page 16
in EUR million FY 2016 FY 2017* FY 2018*
EBITDA level 4.8ca. 4
(integration costs and inventory-step-ups for
Autoline)0
EBITA level7.1
(incl. EUR 2.3 million depreciation PPA)ca. 8
(incl. ca. EUR 4 million depreciation PPA)ca. 2
(depreciation PPA)
EBIT level27.7
(incl. EUR 20.6 million amortization PPA)ca. 29
(incl. ca. EUR 21 million amortization PPA)ca. 23
(incl. ca. EUR 21 million amortization PPA)
Net Profit 18.7 ca. 19 ca. 16
EPS (in EUR) 0.58 ca. 0.61 ca. 0.49
* depending on USD / EUR exchange rate
Page 17
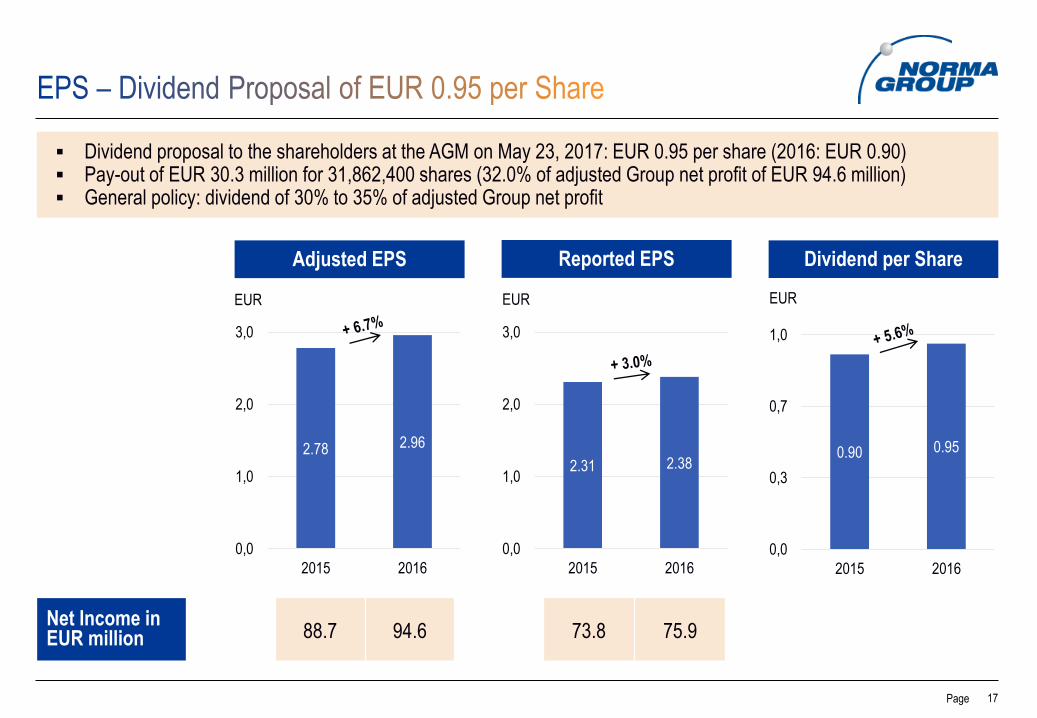
Dividend proposal to the shareholders at the AGM on May 23, 2017: EUR 0.95 per share (2016: EUR 0.90) Pay-out of EUR 30.3 million for 31,862,400 shares (32.0% of adjusted Group net profit of EUR 94.6 million) General policy: dividend of 30% to 35% of adjusted Group net profit
Adjusted EPS
2.78 2.96
0,0
1,0
2,0
3,0
2015 2016
EUR
Reported EPS
EUR
2.31 2.38
0,0
1,0
2,0
3,0
2015 2016
Dividend per Share
EUR
0.90 0.95
0,0
0,3
0,7
1,0
2015 2016
88.7 94.6 73.8 75.9Net Income inEUR million
Page 18
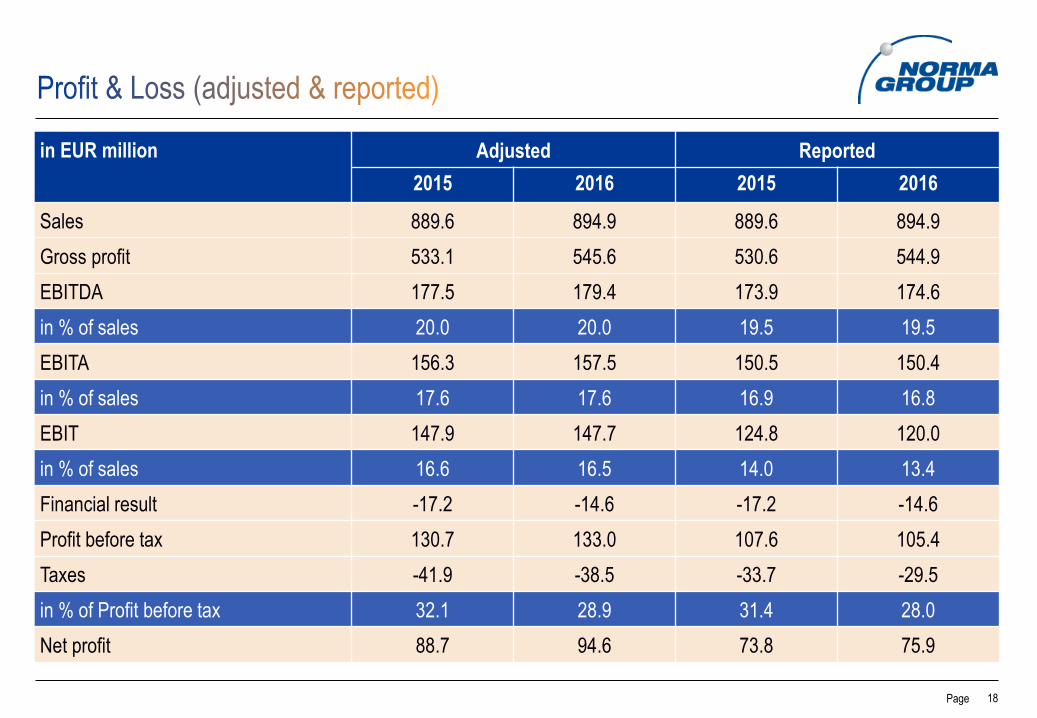
in EUR million Adjusted Reported
2015 2016 2015 2016
Sales 889.6 894.9 889.6 894.9
Gross profit 533.1 545.6 530.6 544.9
EBITDA 177.5 179.4 173.9 174.6
in % of sales 20.0 20.0 19.5 19.5
EBITA 156.3 157.5 150.5 150.4
in % of sales 17.6 17.6 16.9 16.8
EBIT 147.9 147.7 124.8 120.0
in % of sales 16.6 16.5 14.0 13.4
Financial result -17.2 -14.6 -17.2 -14.6
Profit before tax 130.7 133.0 107.6 105.4
Taxes -41.9 -38.5 -33.7 -29.5
in % of Profit before tax 32.1 28.9 31.4 28.0
Net profit 88.7 94.6 73.8 75.9
Page 19
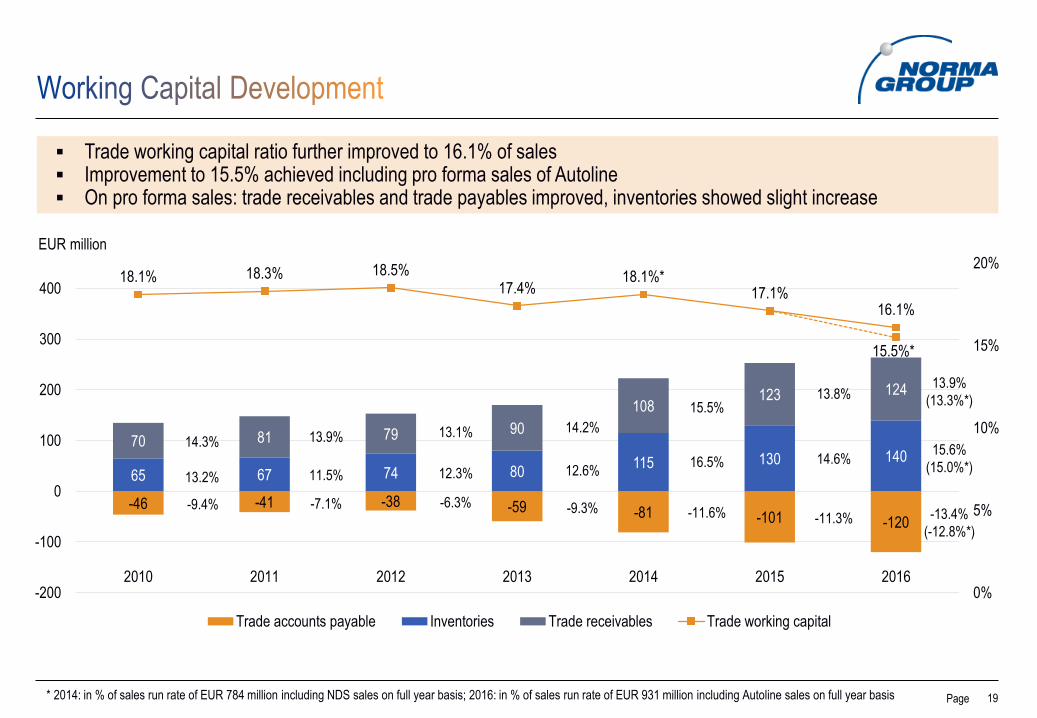
Trade working capital ratio further improved to 16.1% of sales Improvement to 15.5% achieved including pro forma sales of Autoline On pro forma sales: trade receivables and trade payables improved, inventories showed slight increase
EUR million
* 2014: in % of sales run rate of EUR 784 million including NDS sales on full year basis; 2016: in % of sales run rate of EUR 931 million including Autoline sales on full year basis
-46 -41 -38 -59 -81 -101 -120
65 67 74 80115 130 140
70 81 79 90
108123 124
18.1% 18.3% 18.5%17.4%
18.1%*17.1%
16.1%
15.5%*
0%
5%
10%
15%
20%
-200
-100
0
100
200
300
400
2010 2011 2012 2013 2014 2015 2016
Trade accounts payable Inventories Trade receivables Trade working capital
13.9%
11.5%
-7.1%
13.2%
14.3%
-9.4% -6.3%
12.3%
13.1%
-9.3%
12.6%
14.2%
-11.6%
16.5%
15.5%
-11.3%
14.6%
13.8%
-13.4%
(-12.8%*)
15.6%
(15.0%*)
13.9%
(13.3%*)
Page 20
430484
76-29
7*
0
100
200
300
400
500
600
Equity 2015 Profit Dividend Others* Equity 2016
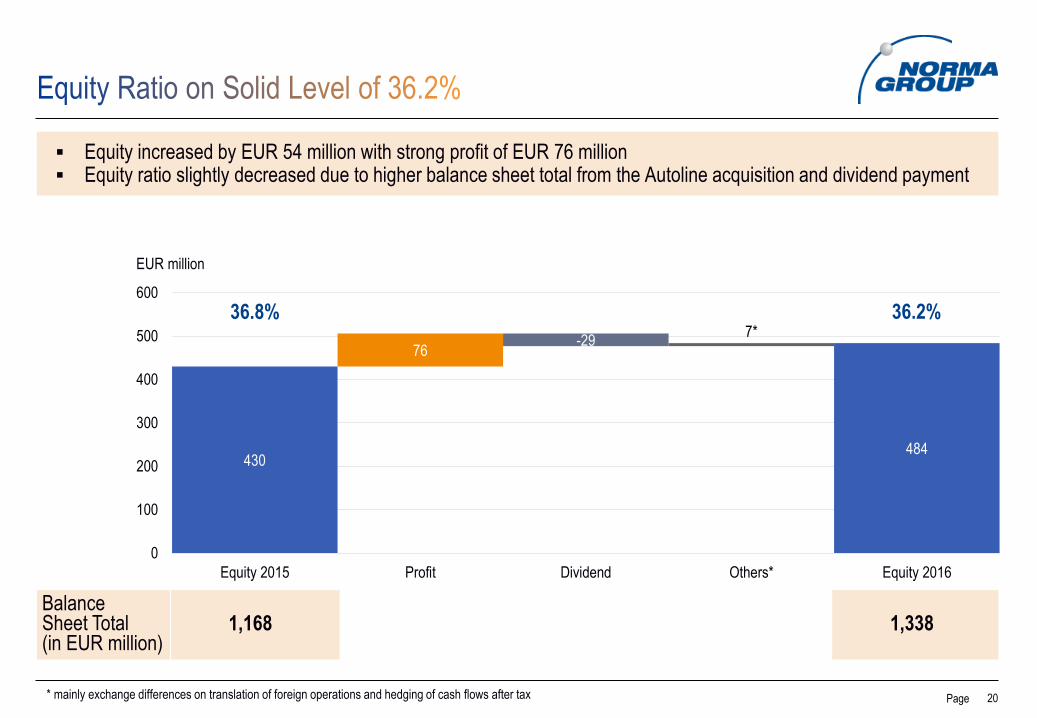
Equity increased by EUR 54 million with strong profit of EUR 76 million Equity ratio slightly decreased due to higher balance sheet total from the Autoline acquisition and dividend payment
36.8%
* mainly exchange differences on translation of foreign operations and hedging of cash flows after tax
EUR million
36.2%
Balance Sheet Total (in EUR million)
1,168 1,338

Page 21
Net Debt* (in EUR million)
-100-166
458 558
-200
0
200
400
600
Dec 31, 2015 Dec 31, 2016
Cash Debt
392358
Leverage** Dec 31, 2015 Dec 31, 2016
(Net debt* / adjusted LTM EBITDA) 2.0 x 2.1 x
Gearing Dec 31, 2015 Dec 31, 2016
(Net debt* / equity) 0.8 x 0.8 x
* excl. derivative financial liabilities of EUR 2.2 million (Dec 31, 2015: EUR 3.4 million); Leverage incl. derivatives: 2.1x (Dec 31, 2015: 2.0x); Gearing incl. derivatives: 0.8x (Dec 31, 2015: 0.8x)
** 2016 EBITDA includes full year EBITDA from Autoline

Page 22
Maturity Profile (in EUR million) – Financial Instruments
* Extension possibility until 2022
5 5 5 578*
26 2921
35
113
36
45
67
43
42
2017 2018 2019 2020 2021 2022 2023 2024 2025 2026
Promissory Note 3
Promissory Note 2
Promissory Note 1
Bank Borrowings
Maturity Profile (in EUR million) – Currencies
16 27 28 3064 52 45 42
244
90
4
117
12
2017 2018 2019 2020 2021 2022 2023 2024 2025 2026
USD
EUR
Page 23
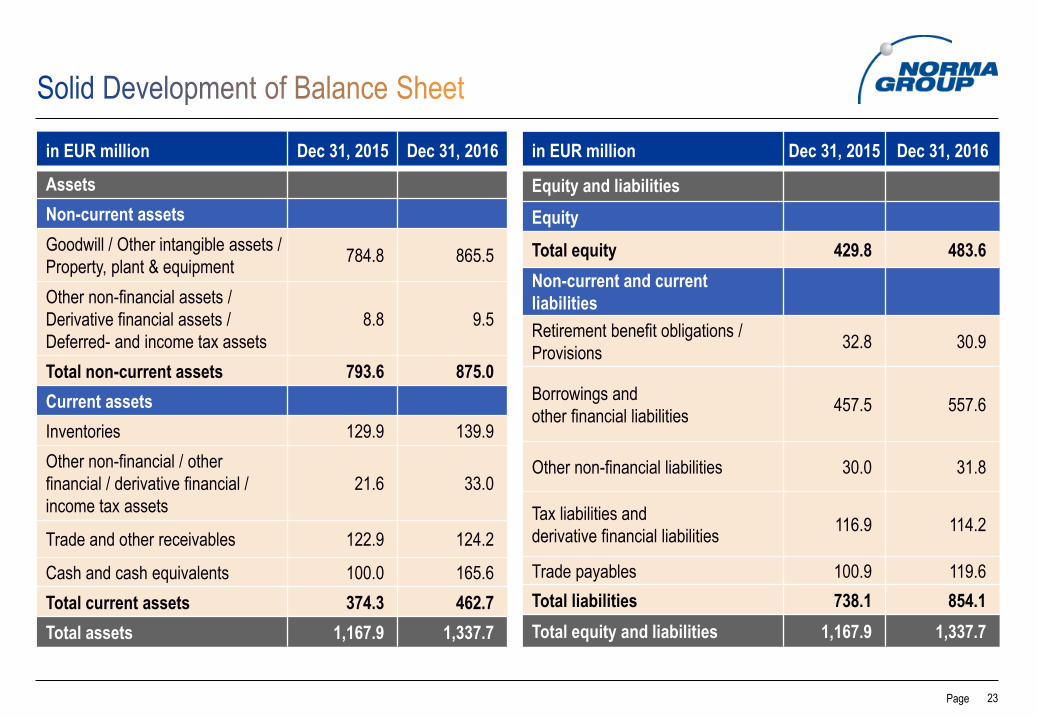
in EUR million Dec 31, 2015 Dec 31, 2016
Assets
Non-current assets
Goodwill / Other intangible assets /
Property, plant & equipment784.8 865.5
Other non-financial assets /
Derivative financial assets /
Deferred- and income tax assets
8.8 9.5
Total non-current assets 793.6 875.0
Current assets
Inventories 129.9 139.9
Other non-financial / other
financial / derivative financial /
income tax assets
21.6 33.0
Trade and other receivables 122.9 124.2
Cash and cash equivalents 100.0 165.6
Total current assets 374.3 462.7
Total assets 1,167.9 1,337.7
in EUR million Dec 31, 2015 Dec 31, 2016
Equity and liabilities
Equity
Total equity 429.8 483.6
Non-current and current
liabilities
Retirement benefit obligations /
Provisions32.8 30.9
Borrowings and
other financial liabilities457.5 557.6
Other non-financial liabilities 30.0 31.8
Tax liabilities and
derivative financial liabilities116.9 114.2
Trade payables 100.9 119.6
Total liabilities 738.1 854.1
Total equity and liabilities 1,167.9 1,337.7

Page 24
Net Operating Cash Flow
in EUR million 2011 2012 2013 2014 2015 2016 Variance
Adjusted EBITDA 117.0 120.8 129.3 138.4 177.5 179.4 +1.1%
Δ ± Working capital -19.5 -9.8 +5.1 +10.4 -0.6 +17.0 n/a
Net operating cash flow before
investments from operating
business
97.5 111.0 134.4 148.8 176.9 196.4 +11.1%
Δ ± Investments from operatingbusiness -30.7 -30.0 -30.5 -39.6 -42.2 -47.9 +13.6%
Net operating cash flow 66.8 81.0 103.9 109.2 134.7 148.5 +10.3%
Net operating cash flow before investments increased by EUR 19.6 million to a total of EUR 196.4 million in 2016
mainly due to a better working capital management
2016 CAPEX spending at EUR 47.9 million mainly for manufacturing facilities in Germany, Serbia, Poland, China
and the US
Record cash flow of EUR 148.5 million or +10.3% compared to 2015 ensures dividend payment and gives flexibility
for further acquisitions

Page 25
1
2
3
5
6
Integration of recently acquired companies Autoline and Lifial
Continue dialogue with potential M&A targets in various industries and regions
4 Expanding water business in the US as well as continuous cross-selling within the US and globally
Continue international expansion
Continue to explore business opportunities in APAC to expand regional business and further improve profitability
Further ramp up of second China plant to enable further expansion into domestic and APAC markets
Page 26
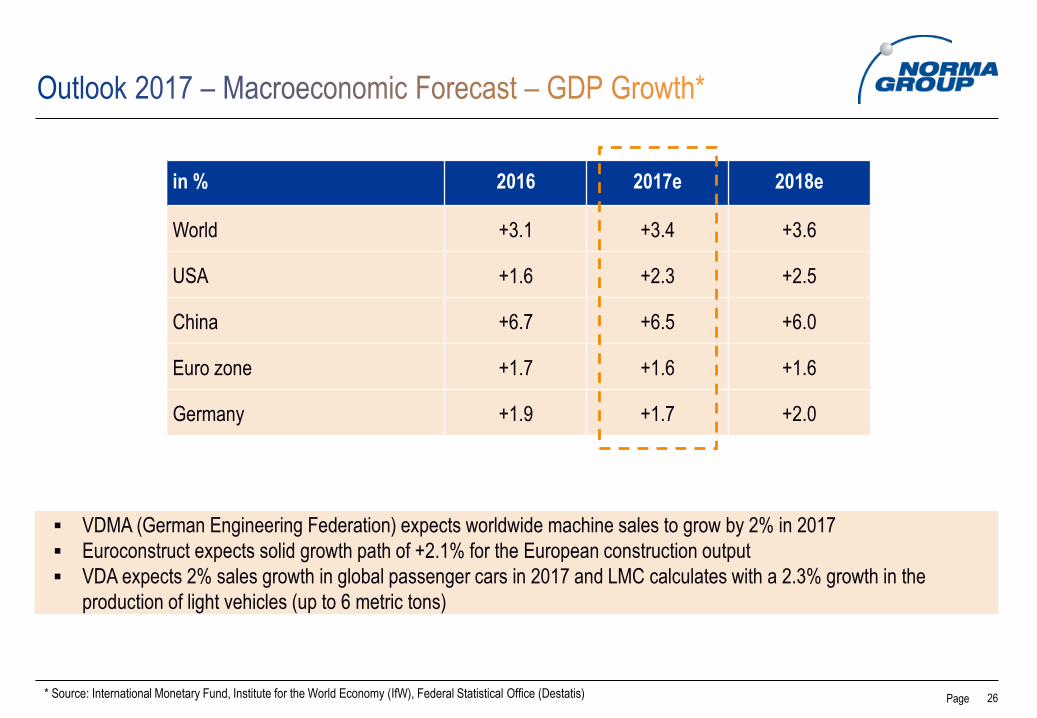
in % 2016 2017e 2018e
World +3.1 +3.4 +3.6
USA +1.6 +2.3 +2.5
China +6.7 +6.5 +6.0
Euro zone +1.7 +1.6 +1.6
Germany +1.9 +1.7 +2.0
VDMA (German Engineering Federation) expects worldwide machine sales to grow by 2% in 2017
Euroconstruct expects solid growth path of +2.1% for the European construction output
VDA expects 2% sales growth in global passenger cars in 2017 and LMC calculates with a 2.3% growth in the
production of light vehicles (up to 6 metric tons)
* Source: International Monetary Fund, Institute for the World Economy (IfW), Federal Statistical Office (Destatis)

Page 27
Sales Moderate organic growth of around 1% to 3%, additionally around EUR 45 million from acquisitions
Adjusted EBITA
marginSustainable at the same level as in previous years of more than 17.0%
Adjusted
Material Cost
ratio
Roughly at the same level as in previous years
Adjusted
Personnel Cost
ratio
Roughly at the same level as in previous years
Financial result Up to EUR -13 million
Adjusted Tax
rateAround 31% to 33%
Adjusted EPS Moderate increase
Page 28
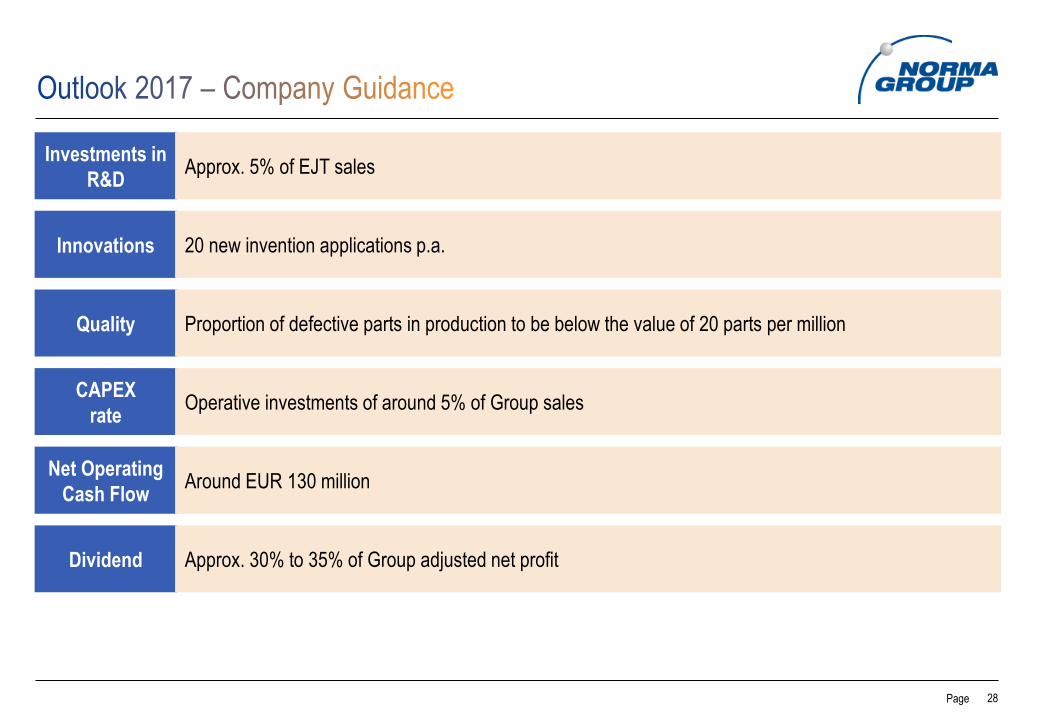
Investments in
R&DApprox. 5% of EJT sales
CAPEX
rateOperative investments of around 5% of Group sales
Net Operating
Cash FlowAround EUR 130 million
Dividend Approx. 30% to 35% of Group adjusted net profit
Innovations 20 new invention applications p.a.
Quality Proportion of defective parts in production to be below the value of 20 parts per million

Page 29
1
2
3
4
6
Market leader in attractive engineering niche markets with long term growth prospects
Enhanced stability through broad diversification across products, end markets and regions
Engineered products with premium pricing through technology and innovation leadership
in mission-critical components
Strong global distribution network with one-stop-shopping service to specialized dealers, wholesalers and
distributors
Proven track record of operational excellence
5 Significant growth and value creation opportunity through synergistic acquisitions
Page 3030
Appendix
Page 31
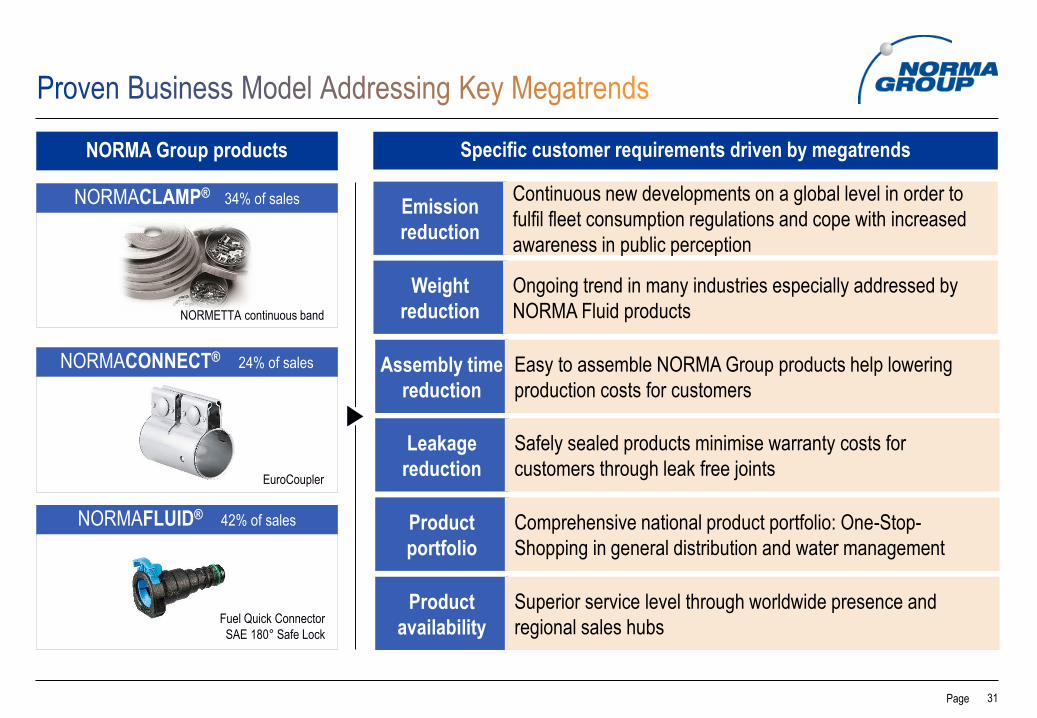
Specific customer requirements driven by megatrends
Emission
reduction
Continuous new developments on a global level in order to
fulfil fleet consumption regulations and cope with increased
awareness in public perception
Weight
reduction
Ongoing trend in many industries especially addressed by
NORMA Fluid products
Assembly time
reduction
Easy to assemble NORMA Group products help lowering
production costs for customers
Leakage
reduction
Safely sealed products minimise warranty costs for
customers through leak free joints
Product
portfolio
Comprehensive national product portfolio: One-Stop-
Shopping in general distribution and water management
Product
availability
Superior service level through worldwide presence and
regional sales hubs
NORMA Group products
NORMAFLUID® 42% of sales
NORMACLAMP® 34% of sales
NORMACONNECT® 24% of sales
EuroCoupler
NORMETTA continuous band
Fuel Quick Connector
SAE 180° Safe Lock

Page 32
Environmental awareness continues to drive tightening emission regulations globally, including in emerging markets Low-emission alternatives require significantly higher joining technology content at a substantially increased
complexity compared to existing/past technologies
Note: Chart shows emission regulation roadmap for passenger vehiclesSource: Integer Research, DieselNet, ACEA, NORMA Group
Euro 1
Euro 1
Euro 1
Euro 1
EPA ‘00
Euro 2
Euro 2
Euro 2
Euro 2
Euro 3
Euro 3
Euro 3
Euro 3
Euro 3
Euro 4
Euro 4
Euro 4
Euro 4
EPA ‘04
Euro 4
Euro 5
Euro 5
Euro 5
EPA ‘07
Euro 5
Euro 6
Euro 6
EPA ‘10
Euro 6
Post Tier 3 (phase-in)
China
India
Russia
Brazil
NAFTA
Europe
2000 2002 2004 2006 2008 2010 2012 2014 2016 2018 2020
Today

Page 33
EU legislation required CO2 fleet average limits
Low emitting cars (below 50 g/km CO2) counted as 1.5 vehicles in 2015 During second stage from 2020 onwards low-emitting cars will be counted as 2 (1.67) in 2020 (2021)
158.7 g/km
~ 6.8 l/100km*
130 g/km
~ 5.6 l/100km*
95 g/km
~ 4.1 l/100km*
[95%] [100%]
Reduction of 27% during 6 years
(5.1% p.a.)
triggers high efforts in emission reduction across
Europe
Reduction from
2007 to 2015
only 18% in 8
years (2.5% p.a.)
2007 2015 2020 2021
* Chart shows emission regulation roadmap for passenger vehicles adapted to the consumption of gasoline engines (Source: European Commission)
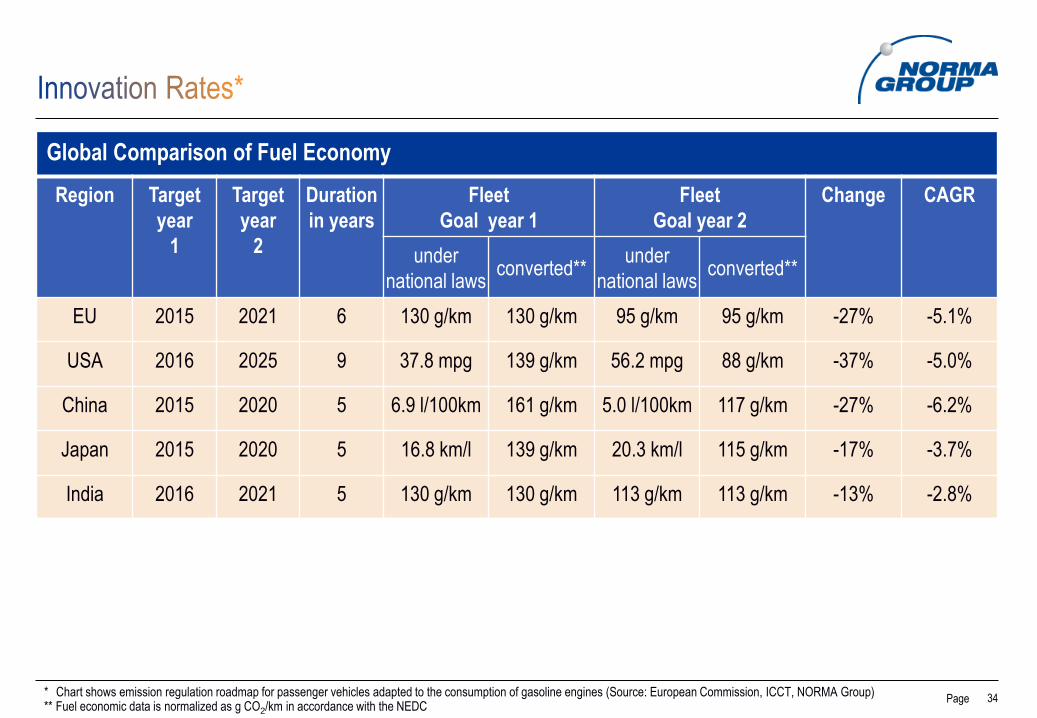
Page 34* Chart shows emission regulation roadmap for passenger vehicles adapted to the consumption of gasoline engines (Source: European Commission, ICCT, NORMA Group)** Fuel economic data is normalized as g CO2/km in accordance with the NEDC
131 g/km
183 g/km
Global Comparison of Fuel Economy
Region Target
year
1
Target
year
2
Duration
in years
Fleet
Goal year 1
Fleet
Goal year 2
Change CAGR
under
national lawsconverted**
under
national lawsconverted**
EU 2015 2021 6 130 g/km 130 g/km 95 g/km 95 g/km -27% -5.1%
USA 2016 2025 9 37.8 mpg 139 g/km 56.2 mpg 88 g/km -37% -5.0%
China 2015 2020 5 6.9 l/100km 161 g/km 5.0 l/100km 117 g/km -27% -6.2%
Japan 2015 2020 5 16.8 km/l 139 g/km 20.3 km/l 115 g/km -17% -3.7%
India 2016 2021 5 130 g/km 130 g/km 113 g/km 113 g/km -13% -2.8%

Page 35
895
306
65 64 60 36 30 24 21
0
200
400
600
800
1000
NORMAGroup(2016)
Oetiker(2015)
IdealTridon(2012)
Caillau(2014)
Müpro*(2014)
TJBC(2013)
VossIndustries
(2012)
Mikalor(2014)
Straub(2011)
NORMA Group expects to grow even faster than its end-markets
Clear global market leader in Clamp / Connect Excellent growth outlook across EJT market
Additional growth for
Joining Technology market
above market growth
Passenger vehicles add. 2- 4%
Commercial vehicles add. 2- 4%
Agricultural equipment add. 2- 4%
Construction equipment add. 2- 4%
Engines add. 2- 4%
White goods same level
Water management add. 2- 4%
Clamp (ca. 34%) / Connect (ca. 24%)
Fluidca.
42%
ca.
58%
DE CH US DEFR USCN CHES
Sales in EUR million (year)
* Sales based on filing from Secura Industriebeteiligungen, which owns 100% of Müpro
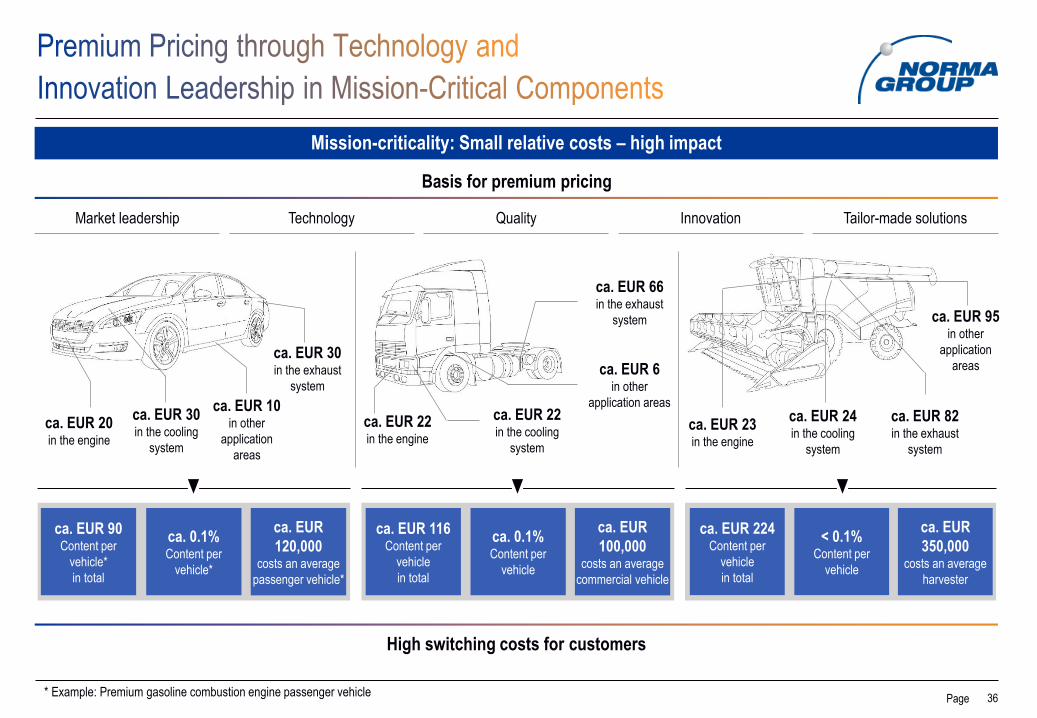
Page 36
Basis for premium pricing
Mission-criticality: Small relative costs – high impact
ca. EUR 22in the cooling
system
ca. EUR 22in the engine
ca. EUR 66in the exhaust
system
ca. EUR 6in other
application areas
ca. EUR 224Content per
vehicle
in total
< 0.1%Content per
vehicle
ca. EUR
350,000costs an average
harvester
ca. EUR 116Content per
vehicle
in total
ca. 0.1%Content per
vehicle
ca. EUR
100,000costs an average
commercial vehicle
High switching costs for customers
Market leadership Technology Quality Innovation Tailor-made solutions
ca. EUR 23in the engine
ca. EUR 24in the cooling
system
ca. EUR 82in the exhaust
system
ca. EUR 95in other
application
areas
ca. EUR 20in the engine
ca. EUR 30in the exhaust
system
ca. EUR 10in other
application
areas
ca. EUR 30in the cooling
system
ca. EUR 90Content per
vehicle*
in total
ca. 0.1%Content per
vehicle*
ca. EUR
120,000costs an average
passenger vehicle*
* Example: Premium gasoline combustion engine passenger vehicle

Page 37
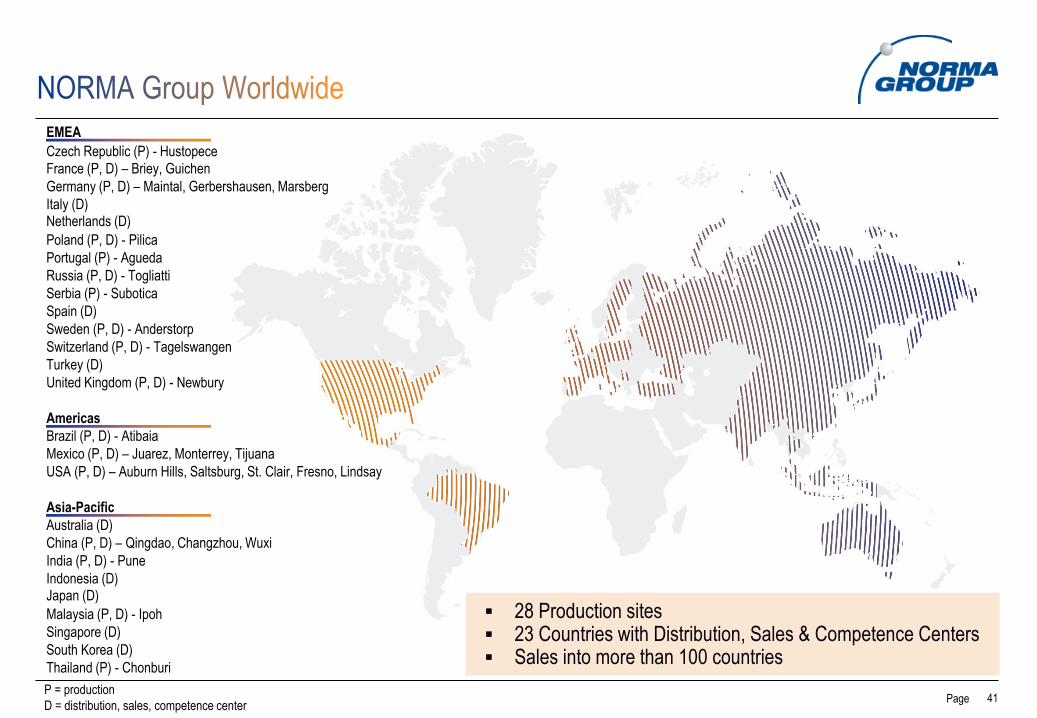
More than 35,000 products, manufactured in 28 locations and sold to more than 10,000 customers in 100 countries
Top 5 customers account only for around 14% of 2016 sales
Examples of NORMA Group’s key end markets
Passenger vehiclesConstruction / infrastructure
/ water managementCommercial vehiclesEngines Construction equipment
Agricultural equipment Shipbuilding White goods Pharma & BiotechWholesalers & technical
distributors
Page 38
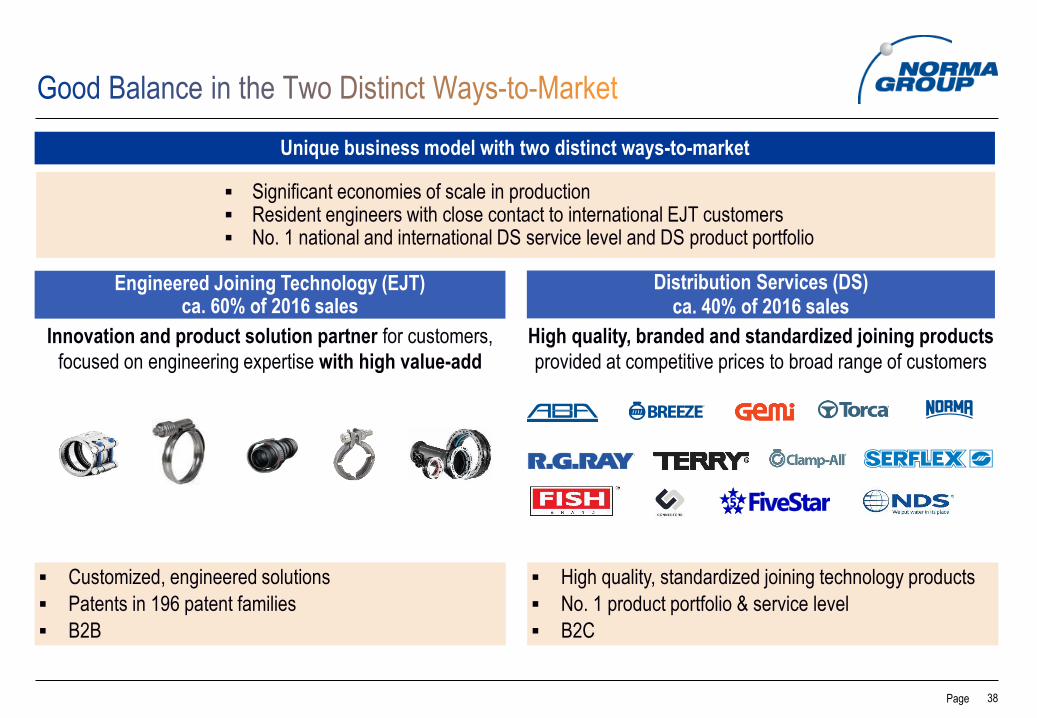
Unique business model with two distinct ways-to-market
Innovation and product solution partner for customers,
focused on engineering expertise with high value-add
Engineered Joining Technology (EJT)ca. 60% of 2016 sales
Distribution Services (DS)ca. 40% of 2016 sales
High quality, branded and standardized joining products
provided at competitive prices to broad range of customers
High quality, standardized joining technology products
No. 1 product portfolio & service level
B2C
Customized, engineered solutions
Patents in 196 patent families
B2B
Significant economies of scale in production Resident engineers with close contact to international EJT customers No. 1 national and international DS service level and DS product portfolio

Page 39
A world without NORMA Group Customer impact
Reputation loss
Image loss
Loss of end-customers
Warranty costs
Non-compliance with legal requirements/regulations

Page 40
1972
2011
2007
2013
2008
2010
2012
2006
2011
2014
Foundation
NORMA China
Acquisition
Breeze, USA
Foundation
NORMA China II
Foundation
NORMA Japan
Foundation
NORMA Mexico
Foundation
NORMA India
Foundation
NORMA Korea
Foundation
NORMA Malaysia
Foundation
NORMA Turkey
Foundation
NORMA Russia
Merger ABA and Rasmussen to
NORMA Group
Acquisition
J-V shares, India
Acquisition
Five Star, USA
Acquisition National
Diversified Sales, USA
MDAX listingAcquisition
Davydick & Co, Australia
Acquisition
Craig Assembly, USA
Acquisition
R.G. Ray, USA
Acquisition Connectors
Verbindungstechnik, Switzerland
Acquisition Nordic
Metalblok, Italy
Acquisition Chien Jin
Plastic, Malaysia
Acquisition Groen
Bevestigingsmaterialen, Netherlands
Opening Sales &
Competence Center, Brazil
Acquisition
J-V shares, SpainFoundation
NORMA Thailand
IPO
Foundation
NORMA Serbia
SDAX listing
Acquisition Variant,
Poland
Acquisition Guyco,
Australia
Foundation
NORMA Brazil
2016Acquisition
Autoline Business, France
2017Acquisition
Lifial, Portugal
Page 41P = production
D = distribution, sales, competence center
28 Production sites 23 Countries with Distribution, Sales & Competence Centers Sales into more than 100 countries
EMEA
Czech Republic (P) - Hustopece
France (P, D) – Briey, Guichen
Germany (P, D) – Maintal, Gerbershausen, Marsberg
Italy (D)Netherlands (D)
Poland (P, D) - Pilica
Portugal (P) - Agueda
Russia (P, D) - Togliatti
Serbia (P) - Subotica
Spain (D)
Sweden (P, D) - Anderstorp
Switzerland (P, D) - Tagelswangen
Turkey (D)
United Kingdom (P, D) - Newbury
Americas
Brazil (P, D) - Atibaia
Mexico (P, D) – Juarez, Monterrey, Tijuana
USA (P, D) – Auburn Hills, Saltsburg, St. Clair, Fresno, Lindsay
Asia-Pacific
Australia (D)
China (P, D) – Qingdao, Changzhou, Wuxi
India (P, D) - Pune
Indonesia (D)Japan (D)
Malaysia (P, D) - Ipoh
Singapore (D)
South Korea (D)
Thailand (P) - Chonburi
Page 42
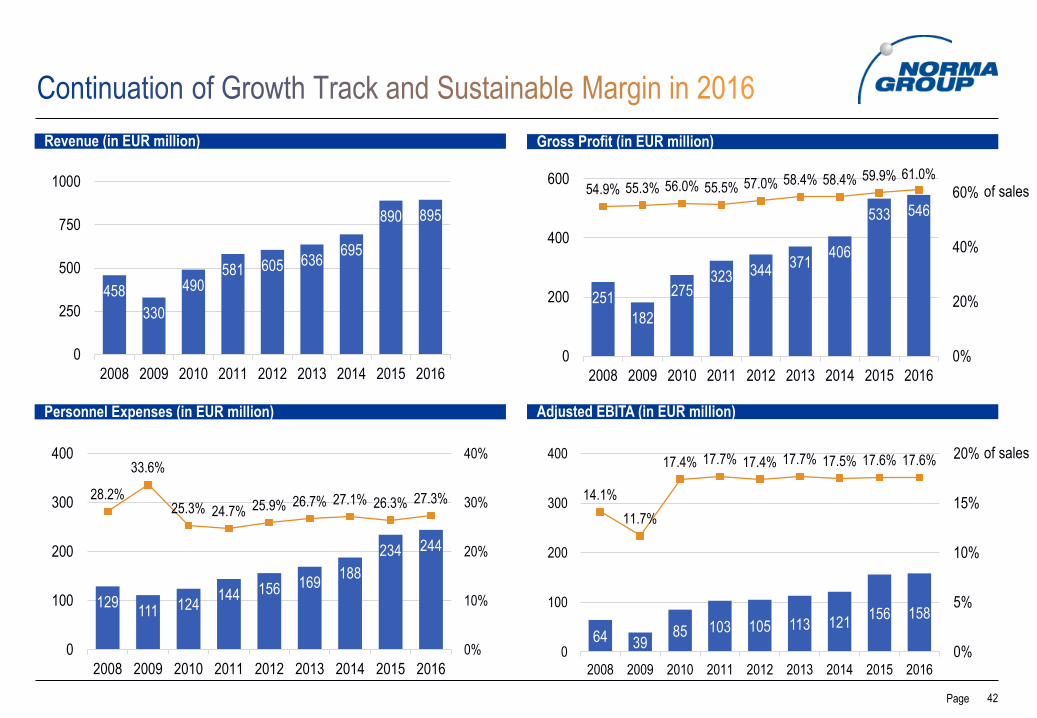
64 3985 103 105 113 121
156 158
14.1%
11.7%
17.4% 17.7% 17.4% 17.7% 17.5% 17.6% 17.6%
0%
5%
10%
15%
20%
0
100
200
300
400
2008 2009 2010 2011 2012 2013 2014 2015 2016
129111 124
144 156 169188
234 244
28.2%
33.6%
25.3% 24.7% 25.9% 26.7% 27.1% 26.3% 27.3%
0%
10%
20%
30%
40%
0
100
200
300
400
2008 2009 2010 2011 2012 2013 2014 2015 2016
251
182
275323 344
371406
533 546
54.9% 55.3% 56.0% 55.5% 57.0% 58.4% 58.4% 59.9% 61.0%
0%
20%
40%
60%
0
200
400
600
2008 2009 2010 2011 2012 2013 2014 2015 2016
Revenue (in EUR million)
Adjusted EBITA (in EUR million)
of sales
Gross Profit (in EUR million)
of sales
Personnel Expenses (in EUR million)
458
330
490581 605 636
695
890 895
0
250
500
750
1000
2008 2009 2010 2011 2012 2013 2014 2015 2016
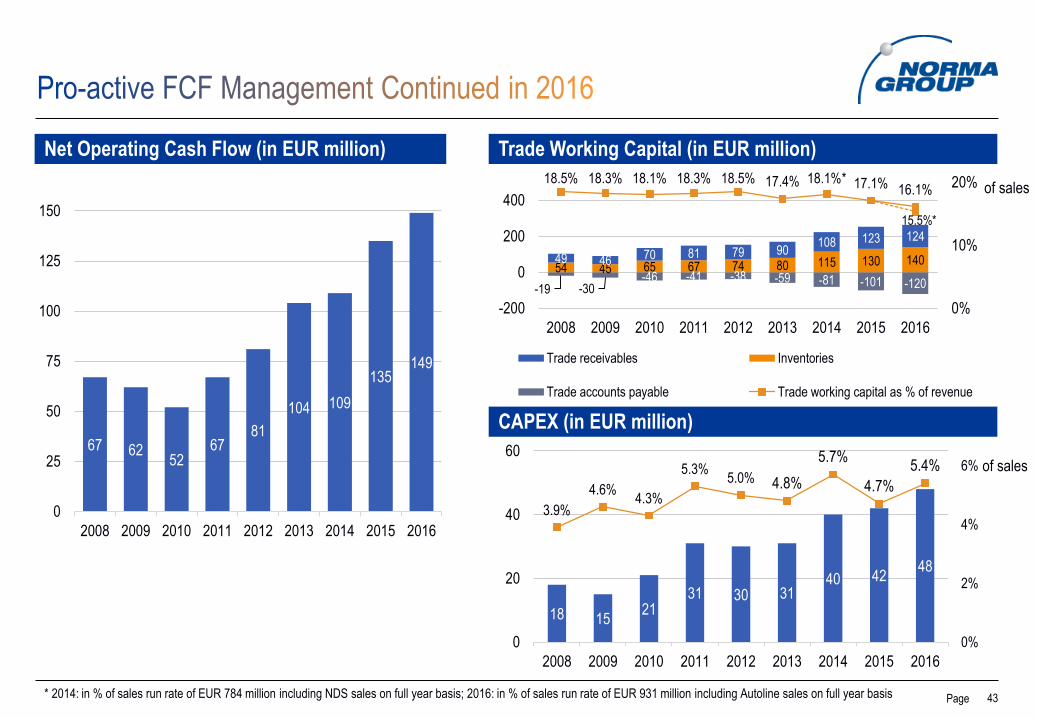
Page 43* 2014: in % of sales run rate of EUR 784 million including NDS sales on full year basis; 2016: in % of sales run rate of EUR 931 million including Autoline sales on full year basis
-19 -30-46 -41 -38 -59 -81 -101 -120
54 45 65 67 74 80 115 130 14049 46 70 81 79 90108 123 124
18.5% 18.3% 18.1% 18.3% 18.5% 17.4% 18.1%* 17.1% 16.1%
15.5%*
0%
10%
20%
-200
0
200
400
2008 2009 2010 2011 2012 2013 2014 2015 2016
Trade receivables Inventories
Trade accounts payable Trade working capital as % of revenue
Net Operating Cash Flow (in EUR million)
of sales
Trade Working Capital (in EUR million)
CAPEX (in EUR million)67 62
5267
81
104 109
135149
0
25
50
75
100
125
150
2008 2009 2010 2011 2012 2013 2014 2015 2016
18 1521
31 30 3140 42
48
3.9%
4.6%4.3%
5.3%5.0% 4.8%
5.7%
4.7%
5.4%
0%
2%
4%
6%
0
20
40
60
2008 2009 2010 2011 2012 2013 2014 2015 2016
of sales

Page 44
Identified Institutional Shareholders*
17%
24%18%
6%
21%
14%
Germany United Kingdom USA
Nordic France Rest of World
Free Float per March 9, 2017 includes
Ameriprise, USA 5.57% T. Rowe Price, USA 3.11%
Allianz Global Investors, Germany 5.02% Impax Asset Management, UK 3.08%
AXA, France 5.02% The Capital Group Companies, USA 3.05%
BNP Paribas Investment Partners, France 4.91% NORMA Group Management* 2.29%
Mondrian, UK 4.85%
* as of December 31, 2016
Milestones and Free float Changes
IPO with ca. 36% free floatApr 2011
SDAX listingJun 2011
MDAX listingMar 2013
100% free floatSince
Jan 2013
Page 45
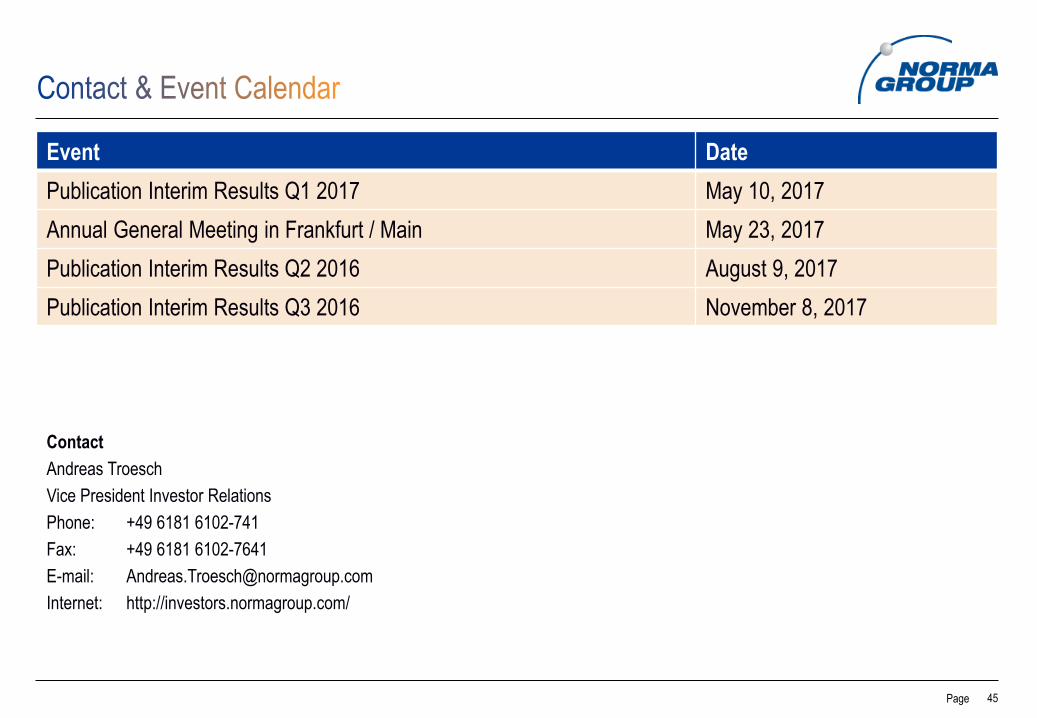
Event Date
Publication Interim Results Q1 2017 May 10, 2017
Annual General Meeting in Frankfurt / Main May 23, 2017
Publication Interim Results Q2 2016 August 9, 2017
Publication Interim Results Q3 2016 November 8, 2017
Contact
Andreas Troesch
Vice President Investor Relations
Phone: +49 6181 6102-741
Fax: +49 6181 6102-7641
E-mail: [email protected]
Internet: http://investors.normagroup.com/

Page 46
This presentation contains certain future-oriented statements. Future-oriented statements include all statements which do
not relate to historical facts and events and contain future-oriented expressions such as ‘believe,’ ‘estimate,’ ‘assume,’
‘expect,’ ‘forecast,’ ‘intend,’ ‘could’ or ‘should’ or expressions of a similar kind. Such future-oriented statements are subject
to risks and uncertainties since they relate to future events and are based on the company’s current assumptions, which
may not in the future take place or be fulfilled as expected.
The company points out that such future-oriented statements provide no guarantee for the future and that actual events
including the financial position and profitability of NORMA Group SE and developments in the economic and regulatory
fundamentals may vary substantially (particularly on the down side) from those explicitly or implicitly assumed or described
in these statements.
Even if the actual results for NORMA Group SE, including its financial position and profitability and the economic and
regulatory fundamentals, are in accordance with such future-oriented statements in this presentation, no guarantee can be
given that this will continue to be the case in the future.
Non audited data is based on management information systems and/or publicly available information. Both sources of data
are for illustrative purposes only.