Embed Size (px)
Citation preview

1
2013 ARIA Annual Meeting 1
Organizational Structure and Insurers’ Risk Taking:Evidence from the Life Insurance Industry in Japan
Noriyoshi Yanase, Ph.D (Tokyo Keizai University, Japan)
2013 ARIA Annual Meeting 2
1. Introduction

2
2013 ARIA Annual Meeting 3
Motivation
• Insurance company’s risk taking behavior has an impact on Stockholders Policyholders Employees Regulators …
• Many papers: Organizational Structures and Managerial Activities Alchian/Demsetz (1972), Jensen/Meckling (1976), Mayers/Smith
(1981, 1986), Fama/Jensen (1983), Huang et.al, (2011) …..
• Few papers have dealt with the relation between organizational structures and the insurer’s risk taking. Lamm-Tennant/Starks (1993), Lee/Mayers/Smith (1997), Ho/Lai/Lee
(2013)
2013 ARIA Annual Meeting 4
Purpose
• This study aims to examine the effects of organizational structures on an insurer’s risk taking,
Using data from Japanese life insurers for fiscal years between 1983 and 2007,
Including “ex”-deregulation period (1983-1995) and “post”-deregulation period (1996-2007)
Examining if the deregulation has an effect on the relation between organizational structures and an insurer’s risk taking behavior.

3
2013 ARIA Annual Meeting 5
Why Japan? Why Insurance?– 2 streams of research
• To examine the relation between organizational structures and a company’ risk taking,
• Insurance companies in Japan have two interesting features:
1. Keiretsu vs. Independent <--- (Japanese Firms) Hoshi/Kashyap/Scharfstein (1991), Prowse (1992),
Weinstein/Yafeh (1998) …2. Mutual vs. Stock<--- (Insurance Firms) Mayers/Smith (1981, 1986), Lamm-Tennant/Starks (1993) …
• We integrate two streams of research related to the organizational structures.
6
Related Studies – Risk Taking (Insurance)
• Lamm-Tennant/Starks (1993) --- J. of Business First article that directly investigates the risk taking behavior of the
U.S. P/L insurance industry in terms of Underwriting Risks They use the standard deviation of loss ratio as risk measures which is
a book-value measure because mutual companies do not have market value risk measure.
• Lee/Mayers/Smith (1997) --- JFE Examining P/L insurance company’s risk-taking in the U.S market in
terms of changing of an asset portfolio, or Investment Risks They find that the shift to riskier assets, mainly stocks, following fund
enactment occurs only for stock insurers.
• Ho/Lai/Lee (2012) --- JRI Examining the impact of organizational structure and board
composition on risk taking in the U.S. property casualty insurance industry.
They find that mutual insurers have lower total risk, underwriting risk, and investment risk than stock insurers.
2013 ARIA Annual Meeting

4
2013 ARIA Annual Meeting 7
Related Studies – Keiretsu (Business Group)
• Recently, diversified “business groups” around the world is receiving increasing attention in the financial economics literatures. Khanna/Yafeh (2005, 2007) --- J. of Business He et.al., (2013) --- J. of Corporate Finance
• The prominent role played by business groups has been discussed in a string of literatures on the Japanese bank-centered corporate groups, known as the “keiretsu”.
• The “keiretsu” is a good testing ground for discussing the relation between organizational structures and company’s risk taking behavior.
2013 ARIA Annual Meeting 8
Findings
1. First, keiretsu life insurers have lower investment (underwriting) risk than independent life insurers in the post-deregulation period.
2. Second, keiretsu life insurers hold more stocks in their asset portfolios than independent life insurers.
3. Third, mutual life insurers take a lower investment risk than stock life insurers in the post-deregulation period.
Overall, the evidence of ex-deregulation period versus post-deregulation period implies that regulation has an impact on risk taking behavior in terms of organizational structures.

5
2013 ARIA Annual Meeting 9
2. Background
2013 ARIA Annual Meeting 10
Japanese Insurance Market
Second Largest Market
Coexistence of Mutual and Stock
Keiretsu-affiliated Insurers
Single Regulation
1
2
3
4
Deregulation5

6
2013 ARIA Annual Meeting 11
(1) Second largest market
(Source) “WORLD INSURANCE IN 2011 SHOWS NON-LIFE INSURANCE PREMIUMS CONTINUED TO GROW IN 2011 DESPITE AN OVERALL DECLINE IN PREMIUMS,” Sigma 3/2012, Swiss Re.(Note) Life premium volume in USD in 2011
Share of the world market was
20% in 2011
2013 ARIA Annual Meeting 12
(2) Coexistence of Mutual and Stock

7
2013 ARIA Annual Meeting 13
(3) Keiretsu
(Main)Bank
Firm A(business)
Firm B(Insurer)
Firm D(business)
Firm C(business)
10%
15%
20%10%
Horizontal conglomerates
Cross- share holdings
2013 ARIA Annual Meeting 1414
(3) Keiretsu (cont.)
• “Keiretsu” is a special type of organizational structure in Japanese industries (incl. insurance).
• Past researches have shown that the unique organization structure (corporate groupings) in Japan known as the “keiretsu” have relatively … Low bankruptcy costs (e.g., Nakatani, 1984) Low agency conflicts (e.g., Hoshi/Kashyap/Scharfstein, 1990, JFE) Low information asymmetry (e.g., Hoshi/Kashyap/Scharfstein, 1991, QJE) Low effective taxes (e.g., Gramlich/Limpaphayom/Rhee, 2004, JAE)
• Some of JP life Insurance companies belong to the “keirestu”.
8
2013 ARIA Annual Meeting 1515
(4) Single regulation
• Japanese life insurance industry is regulated by single insurance business law, the authorities, and tax code, while in U.S. the insurance is sold in different states and regulated
by the law of various states.
The results are reliable.
2013 ARIA Annual Meeting 1616
(5) Deregulation
• The regulation of the post-war life insurance industry was characterized by the so-called convoy system until the mid-1990s. By utilizing the convoy system, after the war, the government tried
to revitalize existing companies by limiting competition and forbidding new entries into the market, thus sheltering the industry.
• The Japanese government initiated a sweeping relaxation of regulations from the mid-1990s. In 1995, the insurance business law of Japan was drastically amended for the first time in 56 years. One of the primary purposes of the new law, which went into effect
in April 1996, is to promote competition among insurers .
• Differential managerial activities (e.g., risk taking) cannot (can) be observed in the ex (post) deregulation period.

9
2013 ARIA Annual Meeting 17
3. Hypothesis Development
2013 ARIA Annual Meeting 18
Keiretsu vs. Independent
Mitsubishi 三菱 Sumitomo 住友Mitsui 三井 Yasuda 安田

10
2013 ARIA Annual Meeting 19
Keiretsu Effects
• In general, shareholders can increase their wealth by taking more risk because of the limited liability provision.
• On the other hand, there is less incentive for shareholders to expropriate wealth from other stakeholders (policyholders, bondholders, and so on) in Keiretsu insurance companies.
• In other word, shareholders of Keiretsu affiliate insurance companies do not take too much risk at the expense of other stakeholders.
Why?
2013 ARIA Annual Meeting 20
Aspect of Policyholder
KeiretsuInsuranceCompany
Other keiretsumemberCompany
Purchasing insurance products
Policyholders
Holding much stocks

11
2013 ARIA Annual Meeting 21
Aspect of Owner
KeiretsuInsuranceCompany
Other keiretsumemberCompany
Holding much stocks
Underwriting (1) Subordinated bond(2) Mutual insurance fund (Mutual form)(3) Stocks (Stock form)
Owner
2013 ARIA Annual Meeting 22
Aspect of Owner
Keiretsu-affiliateInsuranceCompany
Keiretsu-affiliateCompany
Owner
Keiretsu-affiliateCompany
Keiretsu-affiliateCompany
Policyholder
Keiretsu Affiliation
=
The link between owner and policyholder in the ‘Keiretsu’ could cause the ‘Keiretsu’ affiliated insurance companies taking less risks than independent insurance companies.

12
2013 ARIA Annual Meeting 23
• “Keiretsu” life insurers tend to take less risk than independent insurers.
Keiretsu vs. Independent
Managers
Stockholder Policyholders
Not take much risk !
Take much risk at the expense of policyholders !
KeiretsuIndependent
Hypothesis #1
KeiretsuInsurer
KeiretsuMember
Firm
Large shareholder (Royal shareholder)
Underwrite equity funds, subordinate bonds of the insurerPurchase insurance from the insurer in return
2013 ARIA Annual Meeting24
Robustness: Stock holdings (H3)
• A keiretsu life insurer usually is a large shareholder (royal shareholder) of its keiretsu member firms and provide stability for the member firms.
• The member firms underwrite equity funds, subordinate bonds of the insurer, and purchase insurance from the insurer in return.
• “Keiretsu” life insurers hold more stocks in their asset portfolios than independent life insurers do.
Hypothesis #2

13
2013 ARIA Annual Meeting 25
Stock vs. Mutual
2013 ARIA Annual Meeting 26
Stock Insurers
Managers Shareholders
Policyholders(Debt holders)
Too much risk taking
• Shareholders (and Managers) could take too much risk at the expense of policyholders (debt holders).
Principal of Limited Liability
Potential conflict

14
2013 ARIA Annual Meeting 27
Mutual Insurers
Managers Owners
Policyholders
Less risk taking (than in the case of stock insurers)
• Mutual life insurance companies take less risk because potential conflict between owners and policyholders are eliminated in mutual company.
=
No potential conflict
Agency cost is reduced because there is no incentive for shareholders to expropriate wealth from policyholders (Lamm-Tennant and Starks,1993).
2013 ARIA Annual Meeting 28
• Mutual life insurers take less risk than stock insurers.
Mutual vs. Stock
Managers
Stockholder Policyholders
Not take much risk !
Take much risk at the expense of policyholders !
MutualStock
Hypothesis #3

15
2013 ARIA Annual Meeting 29
4. Data and Methodology
2013 ARIA Annual Meeting30
Data
• Source: Statistics of Life Insurance Business in Japan [SLBJ]
(FY1983 edition-FY2007 edition), edited by Insurance research Institute (Tokyo, Japan). All data is set up by manual entry.
• Sample:The sample consists of all existing licensed life insurance
“companies” with complete records during FY1983-FY2007 (for 25years). Including both public and private companies Insurers which do business as a branch operation by a foreign insurers
(e.g., ALICO Japan, AFLAC, et.al) are excluded from the sample.
When insurers were involved in M&A deals, we have to identify the new insurers after the deals for an analysis in panel data set. In this study, we identify (legal) surviving insurers as the new insurers.
16
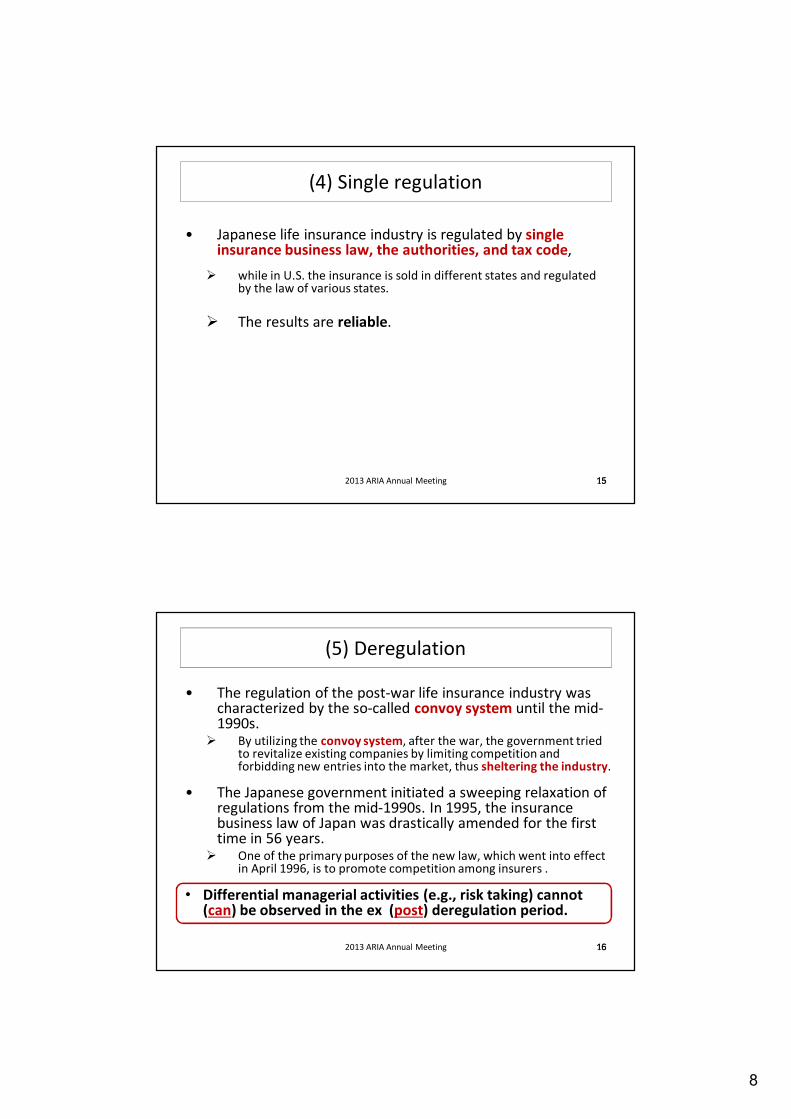
Scope of the sample
• There are mutual-type organizations similar to a mutual-type insurance company, called cooperative insurers.
– Since there are many differences between insurance companies and the cooperative insurers in terms of disclosure requirements, capital requirements, and so on, the cooperative insurers are not generally classified as part of the insurance industry.
• This study uses just the data of mutual-type licensed insurance companies in Japan and does not include the data of the cooperative insurers because consistent data are not available for both organizations, which is a limitation of our analysis.
2013 ARIA Annual Meeting 31
2013 ARIA Annual Meeting 32
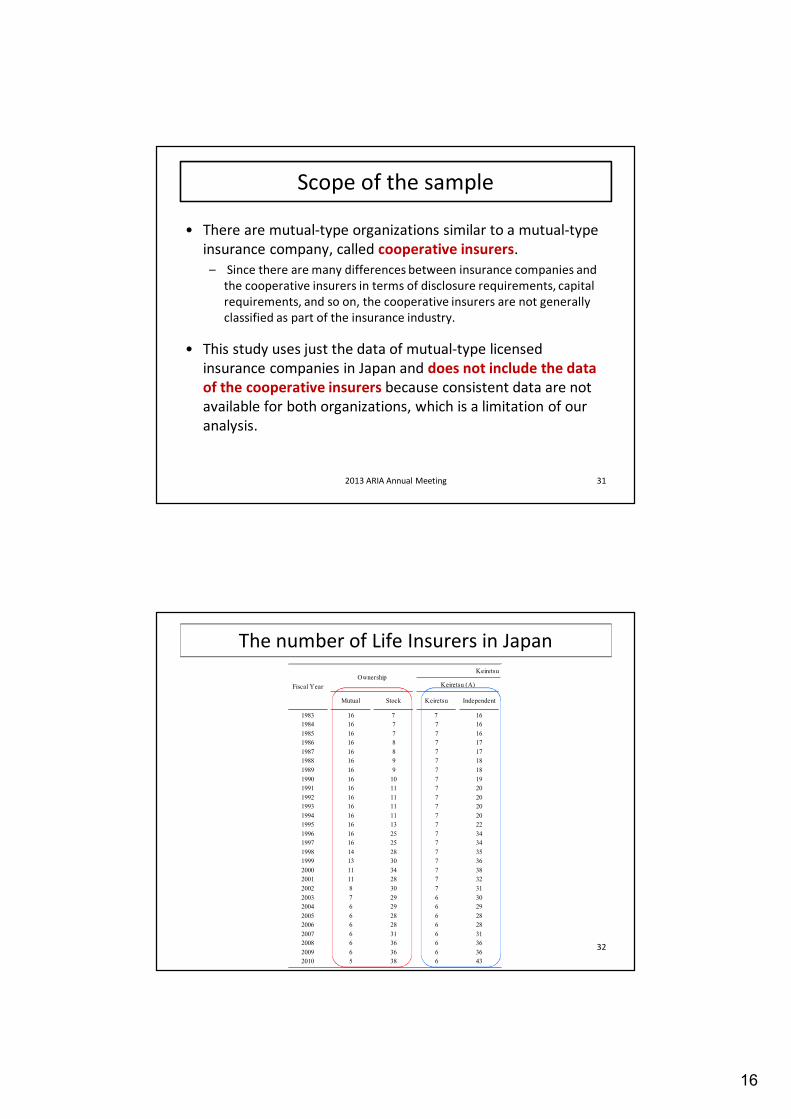
The number of Life Insurers in Japan
Mutual Stock Keiretsu Independent
1983 16 7 7 161984 16 7 7 161985 16 7 7 161986 16 8 7 171987 16 8 7 171988 16 9 7 181989 16 9 7 181990 16 10 7 191991 16 11 7 201992 16 11 7 201993 16 11 7 201994 16 11 7 201995 16 13 7 221996 16 25 7 341997 16 25 7 341998 14 28 7 351999 13 30 7 362000 11 34 7 382001 11 28 7 322002 8 30 7 312003 7 29 6 302004 6 29 6 292005 6 28 6 282006 6 28 6 282007 6 31 6 312008 6 36 6 362009 6 36 6 362010 5 38 6 43
OwnershipKeiretsu affiliation
Keiretsu (A)Fiscal Year
17
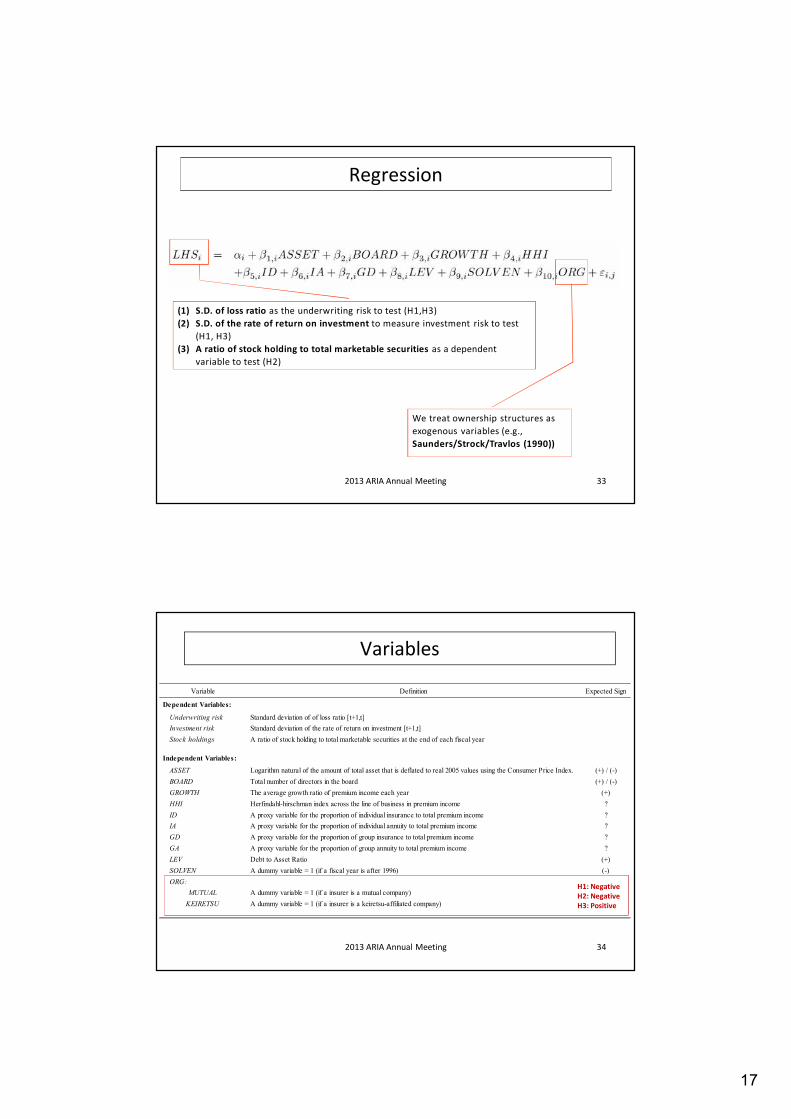
2013 ARIA Annual Meeting 33
We treat ownership structures as exogenous variables (e.g., Saunders/Strock/Travlos (1990))
(1) S.D. of loss ratio as the underwriting risk to test (H1,H3)(2) S.D. of the rate of return on investment to measure investment risk to test
(H1, H3)(3) A ratio of stock holding to total marketable securities as a dependent
variable to test (H2)
Regression
2013 ARIA Annual Meeting 34
Variables
Variable Definition Expected Sign
Dependent Variables:
Underwriting risk Standard deviation of of loss ratio [t+1,t]Investment risk Standard deviation of the rate of return on investment [t+1,t]Stock holdings A ratio of stock holding to total marketable securities at the end of each fiscal year
Independent Variables:
ASSET Logarithm natural of the amount of total asset that is deflated to real 2005 values using the Consumer Price Index. (+) / (-)BOARD Total number of directors in the board (+) / (-)GROWTH The average growth ratio of premium income each year (+)HHI Herfindahl-hirschman index across the line of business in premium income ?ID A proxy variable for the proportion of individual insurance to total premium income ?IA A proxy variable for the proportion of individual annuity to total premium income ?GD A proxy variable for the proportion of group insurance to total premium income ?GA A proxy variable for the proportion of group annuity to total premium income ?LEV Debt to Asset Ratio (+)SOLVEN A dummy variable = 1 (if a fiscal year is after 1996) (-)ORG:
MUTUAL A dummy variable = 1 (if a insurer is a mutual company) (-)KEIRETSU A dummy variable = 1 (if a insurer is a keiretsu-affiliated company) (-)
H1: NegativeH2: NegativeH3: Positive

18
2013 ARIA Annual Meeting 35
Empirical Results
Keiretsu (A) vs. Independent
2013 ARIA Annual Meeting 36
0.048 0.232 -0.117 -0.019 -0.033 -0.000
[0.246] [1.918] * [-0.372] [-2.678] *** [-2.723] *** [-0.020]
-0.013 -0.069 -0.008 -0.002 0.003 -0.006
[-0.365] [-2.865] *** [-0.135] [-1.099] [1.100] [-2.958] ***
0.002 -0.001 0.007 0.000 0.000 0.000
[2.070] ** [-1.716] * [3.543] *** [1.657] * [0.478] [1.632]
-0.027 -0.026 -0.032 0.001 0.004 0.000
[-1.712] * [-1.361] [-1.530] [1.448] [2.108] ** [0.412]
-0.725 0.025 -0.717 -0.028 -0.027 -0.026[-8.170] *** [0.193] [-6.079] *** [-6.934] *** [-2.087] ** [-6.667] ***
-0.751 0.041 -0.744 -0.028 -0.023 -0.026
[-8.462] *** [0.324] [-6.304] *** [-6.911] *** [-1.820] * [-6.710] ***
-0.786 -0.067 -0.707 -0.032 -0.028 -0.028
[-6.646] *** [-0.515] [-4.071] *** [-6.448] *** [-2.194] ** [-5.011] ***
-0.715 0.055 -0.691 -0.025 -0.020 -0.024
[-8.117] *** [0.438] [-5.949] *** [-6.405] *** [-1.629] [-6.252] ***
-0.018 -0.042 0.016 0.001 0.001 0.001
[-1.129] [-3.357] *** [0.662] [2.406] ** [0.427] [1.752] *
0.283 -0.111
[0.312] [-2.501] **
-2.124 -0.421 -2.354 -0.019 0.005 -0.054
[-2.723] *** [-1.762] * [-2.295] ** [-1.169] [0.216] [-1.982] **
Number of observation
R-squared 0.139 0.248 0.191 0.275 0.245 0.258
Post-Degulation
402413 727
(1983-1995) (1996-2007)
325325
(2)
KEIRETSU
Ex-Deregulation
738
(1983-2007)Whole Period
Variables
(1983-2007) (1983-1995)
(1)
Underwriting Risk
(3)
(1996-2007)
SOLVEN
HHI
ID (Individual Death)
IA (Individual Annuity)
ASSET
BOARD
GROWTH
GD (Group Death)
LEV (Debt to Equity)
GA (Group Annuity)
Investment Risk
Ex-Deregulation Post-Degulation
(5) (6)(4)
Whole P eriod
The coefficient on KEIRETSU in column (6) is negative (-0.054) and significant at the 5% level, while that in column (4) is not significant.
These results suggest that the keiretsu effect on investment risk is also strongly driven by the results of the post-deregulation period.
The coefficient on KEIRETSU in column (3) is negative (-2.354) and significant at the 1% level, while that in column (2) is not strong significant.
These results suggest that the keiretsu effect on underwriting risk is strongly driven by the results of the post-deregulation period.

19
Stock holdings
2013 ARIA Annual Meeting 37
0.902 -1.058 -0.057
[1.805] * [-1.060] [-0.100]
0.093 0.490 0.061[1.063] [2.885] *** [0.666]
0.003 0.006 -0.006
[1.425] [2.078] ** [-2.303] **
0.042 -0.003 0.015
[1.047] [-0.031] [0.419]
0.172 -0.435 0.242
[0.815] [-0.627] [1.421]
0.140 -0.413 0.276[0.661] [-0.600] [1.613]
0.680 -0.448 1.275[2.385] ** [-0.611] [4.711] ***
0.408* -0.213 0.588
[1.928] * [-0.307] [3.359] ***
0.049 0.281 -0.049
[1.253] [4.438] *** [-1.267]
-14.012
[-6.535] ***
11.599 8.132 14.546
[5.323] *** [1.907] * [6.710] ***
Number of observation
R-squared 0.620 0.310 0.482
Whole Period Ex-Deregulation
(1)
Keiretsu (A)
Variables
(1983-2007) (1983-1995)
751
KEIRETSU
ASSET
BOARD
LEV (Debt to Asset)
GA (Group Annuity)
HHI
ID (Individual Death)
IA (Individual Annuity)
325 426
(2) (3)
(1996-2007)Post-Degulation
SOLVEN
GROWTH
GD (Group Death)
The coefficient on KEIRETSU in column (3) is positive (14.546) and significant at the 1% level, while that in column (2) is not strong significant.
These results implies that keiretsu-affiliated companies tend to hold more stocks especially in the post-deregulation period.
Mutual vs. Stock
2013 ARIA Annual Meeting 38
-0.079 0.215 -0.245 -0.015 -0.037 0.001[-0.393] [1.627] [-0.778] [-2.007] ** [-2.831] *** [0.150]
-0.011 -0.067 -0.013 -0.002 0.003 -0.005[-0.301] [-2.757] *** [-0.224] [-1.145] [1.208] [-2.733] ***
0.002 -0.001 0.007 0.000 0.000 0.000[2.090] ** [-1.691] * [3.498] *** [1.511] [0.525] [1.390]
-0.025 -0.029 -0.030 0.001 0.004 0.000[-1.591] [-1.480] [-1.424] [1.167] [2.224] ** [0.341]
-0.731 0.042 -0.726 -0.028 -0.029 -0.027[-8.181] *** [0.319] [-6.114] *** [-6.910] *** [-2.200] ** [-6.867] ***
-0.752 0.058 -0.750 -0.028 -0.025 -0.027[-8.422] *** [0.455] [-6.314] *** [-6.905] *** [-1.932] * [-6.909] ***
-0.795 -0.058 -0.739 -0.033 -0.029 -0.030[-6.699] *** [-0.441] [-4.251] *** [-6.666] *** [-2.259] ** [-5.488] ***
-0.731 0.068 -0.706 -0.025 -0.022 -0.023
[-8.237] *** [0.534] [-6.025] ** [-6.257] *** [-1.749] * [-6.165] ***
-0.013 -0.041 0.023 0.001 0.001 0.001
[-0.795] [-3.194] *** [0.966] [2.085] ** [0.559] [1.796] *
0.389 -0.125
[0.418] [-2.810] ***
-0.261 -0.225 -0.496 -0.051 0.026 -0.096[-0.395] [-0.691] [-0.531] [-2.576] *** [0.810] [-3.533] ***
Number of observation
R-squared 0.151 0.242 0.198 0.281 0.247 0.282
325 413 727
(2) (3) (4)
(1996-2007) (1983-2007)Post-Degulation
738
Whole Period
(5) (6)
GA (Group Annuity)
325 402
Variables
(1983-2007) (1983-1995)
(1)
MUTUAL
ASSET
BOARD
GROWTH
GD (Group Death)
SOLVEN
HHI
ID (Individual Death)
IA (Individual Annuity)
Underwriting Risk Investment Risk
Ex-Deregulation Post-Degulation
LEV (Debt to Asset)
Whole Period Ex-Deregulation(1983-1995) (1996-2007)
The coefficient on MUTUAL in column (4) is negative (-0.051) and significant at the 1% level, implying that mutual insurers take less investment risk than stock insurers do as a whole.
The coefficient on MUTUAL in column (6) is negative (-0.096) and significant at the 1% level, while that in column (4) is insignificant.
This suggests that the negative effect of MUTUAL on insurers’ investment risk is strongly contingent upon the results of the post-deregulation period.
20
2013 ARIA Annual Meeting 39
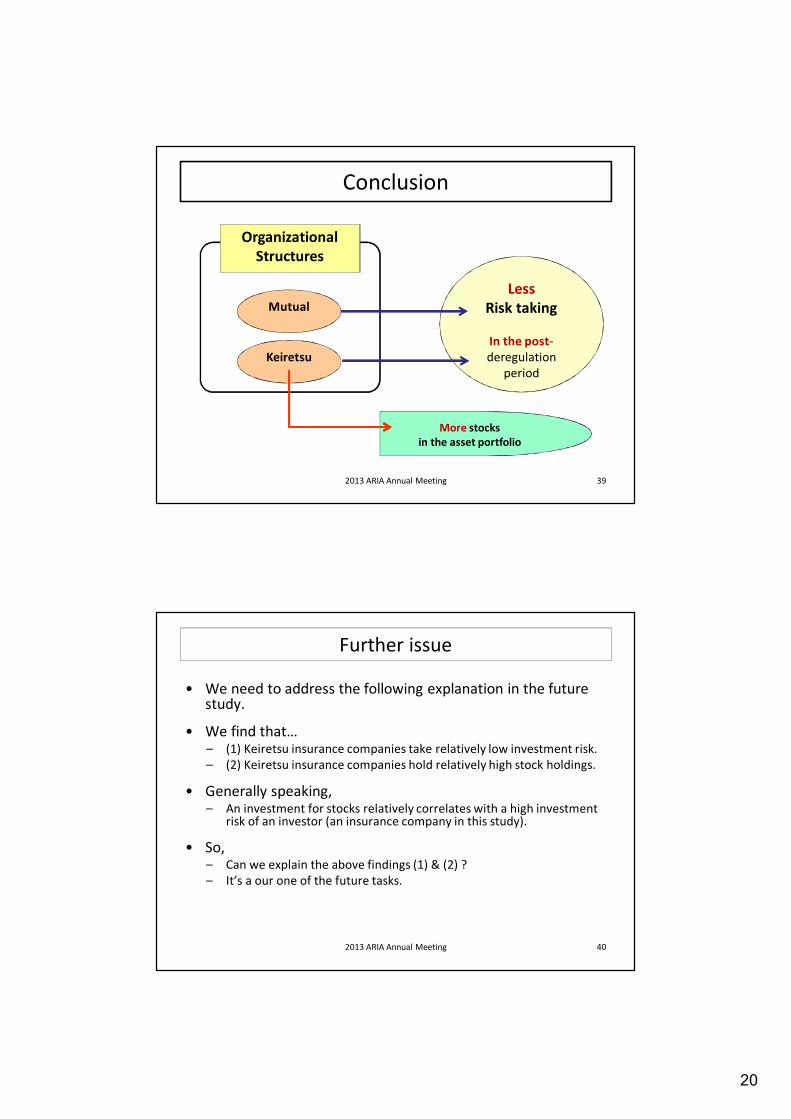
Conclusion
OrganizationalStructures
LessRisk taking
In the post-deregulation
period
Mutual
Keiretsu
More stocks in the asset portfolio
2013 ARIA Annual Meeting 40
Further issue
• We need to address the following explanation in the future study.
• We find that…– (1) Keiretsu insurance companies take relatively low investment risk.– (2) Keiretsu insurance companies hold relatively high stock holdings.
• Generally speaking, – An investment for stocks relatively correlates with a high investment
risk of an investor (an insurance company in this study).
• So,– Can we explain the above findings (1) & (2) ?– It’s a our one of the future tasks.

21
2013 ARIA Annual Meeting 41
Thank you !
Welcome your comments!
Noriyoshi YANASE, Ph.D.(Tokyo Keizai Univ., JAPAN)
RESPONSE TO THE COMMENTS
2013 ARIA Annual Meeting 42

22
Suggestions
• Motivation / Contribution– What does the analysis of stock vs. mutual risk taking add to the
literature?• Lamm-Tennant and Starks (1993)• Lee, Mayers, & Smith (1997)
– The keiretsu insurer structure is similar to the alliance governance. This may provide additional and possibly stronger motivation for your hypothesis 2 and provide you a broader audience
• Yes, I know that the analysis of stock vs. mutual risk taking has no additional contribution except using out of the sample Japanese data. Absolutely, I agree with you. So, I try to more strengthen the analysis of the “keiretsu effect” rather than “mutual effect”.
Suggestions
• Organization– Shorten the introduction by 1-2 pages– Move the description of the keiretsu organization into one
subsection and provide details and cites– Greater description of the empirical methods in the paper
• Type of regression analysis• Diagnostics
• Yes, I’ll make clear the description of the keiretsu organization, and strengthen description of the empirical methods in the paper for readers.

23
Suggestions
• Empirical (1)– Inclusion of the four life insurance segments creates a
linear dependence
• Actually, there are other segments but the four segments in the data book, including health, disability, and so on. Also, I checked the correlation matrix among the 4 variables, but I am little concern about a perfect linear dependence.
• However, for robustness, I will check the results dropping one or two insurance segment variables in the regression.
Suggestions
• Empirical (2)– Hausman test – You state that individual effects are
correlated with explanatory variables. Shouldn’t this indicate a need for a fixed effects model?
• Sorry about my sentence in the footnote(22) is confusing. Yes, your mention is absolutely right. But, actually, my regression results come from the random effects model. Thank you, I will make clear in the sentence for the methodology.
24
Suggestions
• Empirical (3)– Define the leverage variable. What are debt and equity in
this case?
• Definition of the leverage variable is very simple in this study. Due to the disclosure problem, I can consistentlyget the amount of total liabilities and the total asset in book value. So, I just calculated the leverage as (total liabilities) over (total asset minus total liabilities).
Suggestions
• Empirical (4)– Are the stock holdings of life insurers regulatory limited? Is
there a risk based capital requirement? How does this influence hyp. 3?
• Before the deregulation age, the Insurance Business Law (IBL) had regulations for insurers’ asset allocation, therefore, the stock holdings were in effective limited.
• In the deregulation period, on the one hand, the regulations of insurers’ asset allocation have been loosened. On the other hand, the solvency margin regulation, a kind of a risk based capital requirement, introduced to the industry. That’s why I need to control the solvency margin regulation, and so this study conducts a dummy variable for implementation of the solvency regulation.
• Of course, for more robustness, I try to conduct an additional regression using a control variable for a ratio of solvency margin of each firm.