Embed Size (px)
Citation preview

The Nexus between Labor Diversity
and Firm's Innovation
Pierpaolo Parrotta, Dario Pozzoli and Mariola Pytlikova
NORFACE MIGRATION Discussion Paper No. 2011-5
www.norface-migration.org

The Nexus between Labor Diversity andFirm's Innovation∗
Pierpaolo Parrotta†, Dario Pozzoli‡and Mariola Pytlikova§
January 6, 2011
Abstract
In this paper we investigate the nexus between �rm labor diversity and in-
novation using a linked employer-employee data from Denmark. Speci�cally,
exploiting information retrieved from the comprehensive database and imple-
menting a proper instrumental variable strategy, we are able to identify the
contribution of workers diversity in cultural background, skills and demographic
characteristics to valuable �rm's innovation activity. The latter is measured
by: (1) the �rm's propensity to apply for a patent, (2) the number of patent
applications (intensive margin) and (3) the �rm's ability to patent in di�erent
technological areas (extensive margin). We �nd that skill and ethnic diversity
plays an important role in propelling �rm's innovation outcomes. Conversely,
the e�ect of demographic diversity typically vanishes once detailed �rm-speci�c
characteristics are included as control variables.
JEL Classi�cation: C23, J24, L20.
Keywords: Labor diversity, patenting activity, extensive and intensive margins.
∗We thank Guglielmo Barone, Tor Eriksson, Michael Rosholm, and Måns Soderbom (al-phabetical order) for helpful suggestions. In addition, we appreciate comments from partic-ipants at seminars organized by the Copenhagen Business School, University of Bergamo,Aarhus School of Business, University of Lausanne, and from participants at the followingconferences: ESPE 2010, The 5th Nordic Summer Institute in Labor Economics, The 2010Ratio Young Scientist Colloquium, ESEM 2010, CAED/COST 2010 in London and the 2010International Symposium on Contemporary Labor Economics at WISE, Xiamen. MariolaPytlikova gratefully acknowledges funding from the NORFACE Migration Programme �Mi-gration: Integration, Impact and Interaction�. The usual disclaimer applies.†Aarhus School of Business and Social Sciences, Aarhus University.‡Aarhus School of Business and Social Sciences, Aarhus University.§Corresponding author. Aarhus School of Business and Social Sciences, Aarhus Uni-
versity. Department of Economics, Hermodsvej 22, DK, 8230 Aabyhoj, Denmark. E-mail:[email protected]
1

1 Introduction
Many developed and developing countries have experienced several changes
in the workforce composition which has lead to an increased heterogeneity of
the labor force in terms of age, gender, skills and ethnicity. This is partly the
result of policies adopted to counteract the problem of population aging, anti-
discrimination measures, immigration and the worldwide globalization process
(Pedersen, Pytlikova and Smith, 2008). From the demand side, we observe
increasing diversity across many workplaces and we often hear about the im-
portance of further internationalization and demographic diversi�cation. The
promotion of diversity is often perceived as a chance to improve learning and
knowledge management capabilities and then enhance �rm productivity (Par-
rotta, Pozzoli and Pytlikova, 2010). Besides, workforce diversity is believed to
be an important source of innovation. For instance, in a relatively recent sur-
vey conducted by the European Commission, a large number of respondents
identi�ed innovation as a key bene�t of having diversity policies and practices
(European Commission, 2005). If this is the case, �rms could bene�t from the
growing diverse cultural backgrounds, demographic, and knowledge bases of the
workforces. Moreover, since there is a widespread consensus that innovation
is crucial for sustainable growth and economic development (the new growth
theory), knowing the link between workforce diversity and innovation seems to
be essential for policy makers.
There are numerous, predominantly management studies focusing on the
relationship between labor diversity and �rm's innovation. In the literature
a paradox has been recognized: whereas labor diversity can be a source of
creativity and therefore foster innovation activity, a high degree of heterogene-
ity among workers may induce misunderstanding, con�icts and uncooperative
behaviors within workplaces and in this way hinder innovation (Basset-Jones,
2
2005). There is no general agreement on which e�ect may prevail. However, the
paradox weakens if we distinguish between cognitive and demographic diver-
sity. Speci�cally, di�erences in skills, education and more broadly in knowledge
among employees seem to be bene�cial rather than detrimental (Hong and Page,
2001 and 2004; Lazear, 1999). According to Lazear (1999), positive e�ects may
prevail as long as workers' information sets are not overlapping but relevant
to one another. Ambiguity instead persists for diversity in ethnic and demo-
graphic characteristics of employees. On the one hand, people of di�erent cul-
tural backgrounds, age and gender may provide diverse perspectives, valuable
ideas, problem-solving abilities, and in this way facilitate the achievement of
optimal creative solutions and therefore stimulate innovations (Watson, Kumar
and Michaelsen, 1993; Drach-Zahavy and Somech, 2001; Hong and Page, 2001
and 2004). People of di�erent ethnic backgrounds may also possess knowledge
about global markets and customers tastes (Osborne, 2000; Berliant and Fujita,
2008) and di�erent ways of searching for solutions to problems, i.e. heuris-
tics, and therefore they are more likely to come up with innovative solutions
than ethnically homogenous teams of workers (Hong and Page, 2004). On the
other hand, such heterogeneities might create communication barriers, reduce
the workforce cohesion and prevent cooperative participation in research ac-
tivities, bringing high costs of �cross-cultural dealing� (Williams and O'Reilly,
1998; Zajac, Golden and Shortell, 1991; Lazear, 1999). Thus, it is still unclear
whether more ethnically and demographically heterogeneous �rms outperform
the relatively more homogeneous ones with respect to innovation.
The empirical literature exploring the relationship between labor diversity
and �rm's innovation consists mainly of business case studies that often look at
work-team compositions (Horwitz and Horwitz, 2007; and Harrison and Klein,
2007) or even focus on diversity in top management teams only (Bantel and
3
Jackson, 1989; Knight, Pearce, Smith, Olian, Sims, Smith and Flood, 1999;
Pitcher and Smith, 2001)1. That may be imputed to di�erences in research
aims and approaches, but also to the lack of more comprehensive employer-
employee data, which provide a notable amount of information on the labor
force composition at the �rm level. To the best of our knowledge, the evidence
using more comprehensive data is virtually non-existent2.
In this paper, we investigate the nexus between labor diversity and innova-
tion using a rich register-based linked employer-employee dataset (LEED) from
Denmark for the years 1995-2003. Regarding measures of innovation, we fol-
low previous literature and make use of information on patents to proxy for
innovation (Griliches, 1990; Bloom and Van Reenen, 2002). Speci�cally, we
use the following three measures: (1) �rm's propensity to apply for a patent,
(2) the number of patents introduced each year and (3) technological areas in
which the �rm has realized them. We investigate the e�ect of labor diversity on
�rm innovation by looking at three dimensions of employee diversity: cultural
background, skills/education and demographics. Further, we deal with several
problems that previous literature studying the impact of workforce diversity
on innovation did not address properly. Most importantly, it might be that
�rms are aware of the importance of labor diversity and leverage it to improve
1There exists also some literature on the e�ects of diversity - typically ethnic labor diversity- on innovation using aggregate regional or industry data, for instance Kelley and Helper(1999), Feldman and Audretsch (1999), Anderson, Quigley and Wilhelmsson (2005), Niebuhr(2010); Kerr and Lincoln (2010).
2Since we began working on the paper, we became aware of two recent studies usingmore comprehensive data to analyze labor composition and innovation. The �rst work byØstergaard, Timmermarns and Kristinsson (2009) analyzes a cross-section of 1648 �rms inDenmark to evaluate the e�ect of diversity in gender, age, ethnicity and education on �rm'spropensity to innovate. They �nd evidence of (a) positive e�ects of diversity in education andgender, (b) no signi�cant e�ects of ethnic diversity and (c) negative e�ects of age diversity on�rm's innovation. The second study by Söllner (2010) examines how occupational diversity,considered as a proxy of human capital heterogeneity, a�ects the �rm's likelihood to introducea product innovation. Controlling for age and tenure diversity among other covariates, he �ndsthat �occupational diversity is positively related to the propensity to innovate�. However,both studies present some limitations, among others they neglect the problem of possibleendogeneity of the relationship between diversity and innovation, which we properly addressin the present article.
4
their performances; then the relationship under investigation may be a�ected by
simultaneity or endogeneity. To address these concerns, we implement an instru-
mental variable (IV) strategy based on levels of workforce diversity computed
for each commuting area, where a �rm is located, as an instrument for the �rm
labor diversity. Further, as broadly documented by industrial and knowledge
economics literature, �rms are characterized by a di�erent propensity to inno-
vate. Thus, there exist unobserved and observed �rm-speci�c heterogeneity that
should be taken into account to evaluate the e�ect of any labor diversity dimen-
sion on �rm's innovation outcome. Following Blundell, Gri�th and Van Reenen
(1995), we account for past �rms' success in innovation and use pre-sample infor-
mation as an observable proxy for unobservable permanent �rm characteristics.
Finally, we control for the potential role of the external knowledge in favoring
�rms' patenting activity and compute knowledge spillovers indicators based on
geographical and technological distances between �rms.
Implementing alternative estimation techniques, we �nd an evidence of the
key role of the skill diversity in promoting �rm's innovation as measured by the
probability to innovate, the number of patent applications and patent grants.
Diversity in cultural background has a positive and signi�cant in�uence, too.
E�ects of diversity in demographics turn to be mostly insigni�cant when shares
of male and di�erently aged employees are included as controls. Our results
show that �rms with more diverse workforce in terms of skills/education are
more likely to patent in more than one technological �eld. Finally, we �nd that
the bene�cial e�ect of skill and ethnic diversity on innovation materializes for
the white-collar occupations only, and not for the blue-collar occupations. These
results support the hypothesis that diverse workers tend to have a wider pool
of di�erent experiences, knowledge bases and heuristics boosting their problem-
solving capacities and creativity, which in turn facilitate innovations. In this
5
regard, our �ndings are consistent with the theoretical frameworks proposed by
Hong and Page (2001 and 2004) and Berliant and Fujita (2008). Hence, our re-
sults suggest �rms to focus on recruitment strategies that explicitly account for
heterogeneity in skills and ethnicity. This article may also provide some sugges-
tions to public authorities in terms of innovation policies. Given that innovation
is considered as one of the most important components for the long-term eco-
nomic growth (new growth theory), hence investigating the determinants of the
innovation process may also lead to the identi�cation of the sources of a sustain-
able growth. In this regard, public institutions and policy makers could invest
resources to promote skill and ethnic diversity within workplaces and in such a
way increase the innovation, and ultimately the economic growth.
The structure of the paper is as follows: section 2 brie�y describes the data,
section 3 provides details on the empirical strategy, sections 4 and 5 explain
all the results of our empirical analyses and section 6 o�ers some concluding
remarks.
2 Data
2.1 Data sources
The data set we use for our analysis is obtained by merging three di�erent
data sources from Denmark. The �rst one is the `Integrated Database for Labor
Market Research' (IDA), which is a register-based LEED managed by Statistics
Denmark, a Danish governmental institute responsible for creating statistics
on the Danish society and economy. IDA contains a broad set of information
on individuals and �rms for years 1980-2006. In particular, we are interested
in gender, age, nationality, education, occupation and place of work, but also
whether a �rm is (partially or totally) foreign-owned and a multi-establishment.
6
The second data source is a register of �rms' business accounts (REGNSKAB)
that provides information on a number of �nancial items, which we need in order
to construct values of �rms' capital stock, information on whether a �rm is an
exporter and the 3-digit industry, in which the �rm operates. This database is
also maintained by the Statistics Denmark and reports data for the period 1995-
2006.3 In REGNSKAB it is possible to identify partially and totally imputed
values, which we exclude from our �nal data set in order to avoid any bias in
the estimates. The last data source is a collection of patent applications sent
to the European Patent O�ce (EPO) by Danish �rms.4 It covers a period of
26 years (1978-2003) and allows us to account for 2822 applicants and 2244
granted �rms.5 We disregard those industries where there were no patenting
�rms during the period covered in our empirical analysis.6 We also exclude
enterprises with less than 10 employees from our sample to allow all investigated
�rms potentially to reach the highest degree of (ethnic) diversity at least when
an aggregated speci�cation is used. Thus, our �nal data set contains information
on approximately 14,000 �rms per year over a period of 9 years (1995-2003).
2.2 Diversity measures
The workforce diversity (heterogeneity) measures used in this article are
3Part of the statistics in REGNSKAB refers to selected �rms for direct surveying: all �rmswith more than 50 employees or pro�ts higher than a given threshold. The rest is recordedin accordance with a strati�ed sample strategy. The surveyed �rms can choose whether tosubmit their annual accounts and other speci�cations or to �ll out a questionnaire. In orderto facilitate responding, questions are formulated in the same way as required in the Danishannual accounts legislation.
4The access to these data has been made possible thanks to the Center for Economic andBusiness Research (CEBR), an independent research center a�liated with the CopenhagenBusiness School (CBS).
5More details concerning the construction and composition of the data set can be found inKaiser, Kongsted and Rønde (2008).
6
Speci�cally, we drop the following industries: agriculture, �shing and quarrying; electricity,gas and water supply; sale and repair of motor vehicles; hotels and restaurants; transports;and public services.
7
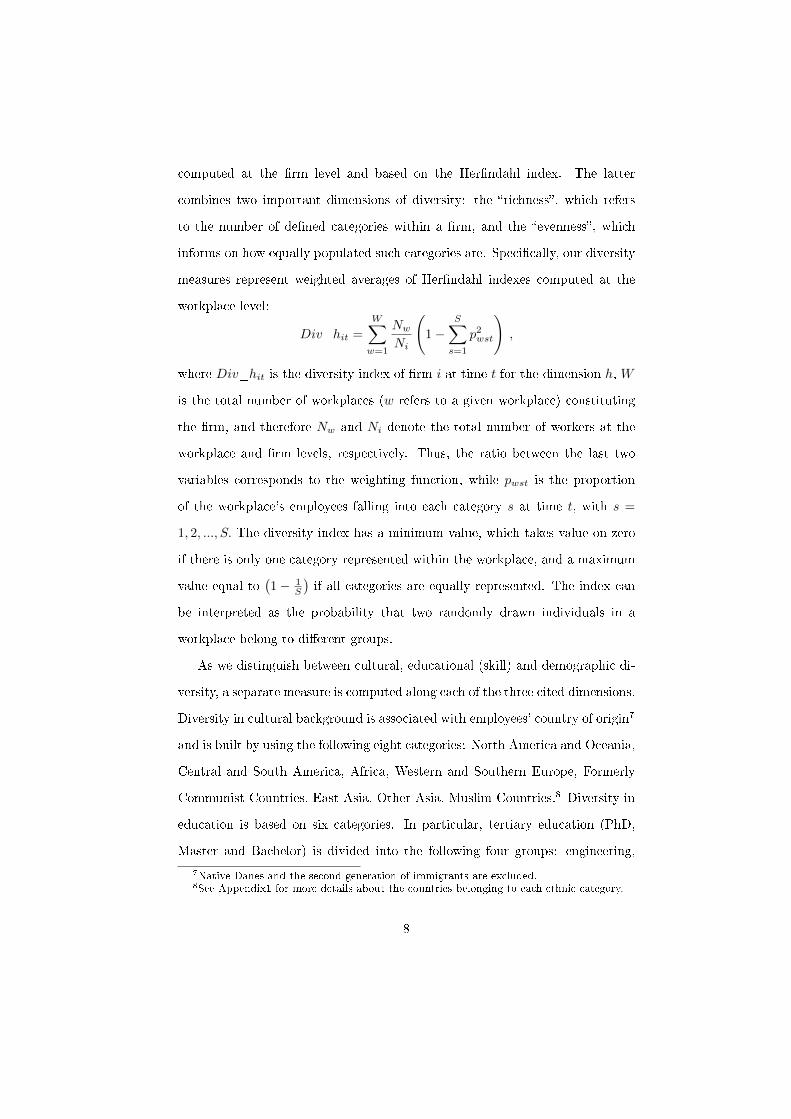
computed at the �rm level and based on the Her�ndahl index. The latter
combines two important dimensions of diversity: the �richness�, which refers
to the number of de�ned categories within a �rm, and the �evenness�, which
informs on how equally populated such categories are. Speci�cally, our diversity
measures represent weighted averages of Her�ndahl indexes computed at the
workplace level:
Div_hit =
W∑w=1
NwNi
(1−
S∑s=1
p2wst
),
where Div_hit is the diversity index of �rm i at time t for the dimension h, W
is the total number of workplaces (w refers to a given workplace) constituting
the �rm, and therefore Nw and Ni denote the total number of workers at the
workplace and �rm levels, respectively. Thus, the ratio between the last two
variables corresponds to the weighting function, while pwst is the proportion
of the workplace's employees falling into each category s at time t, with s =
1, 2, ..., S. The diversity index has a minimum value, which takes value on zero
if there is only one category represented within the workplace, and a maximum
value equal to(1− 1
S
)if all categories are equally represented. The index can
be interpreted as the probability that two randomly drawn individuals in a
workplace belong to di�erent groups.
As we distinguish between cultural, educational (skill) and demographic di-
versity, a separate measure is computed along each of the three cited dimensions.
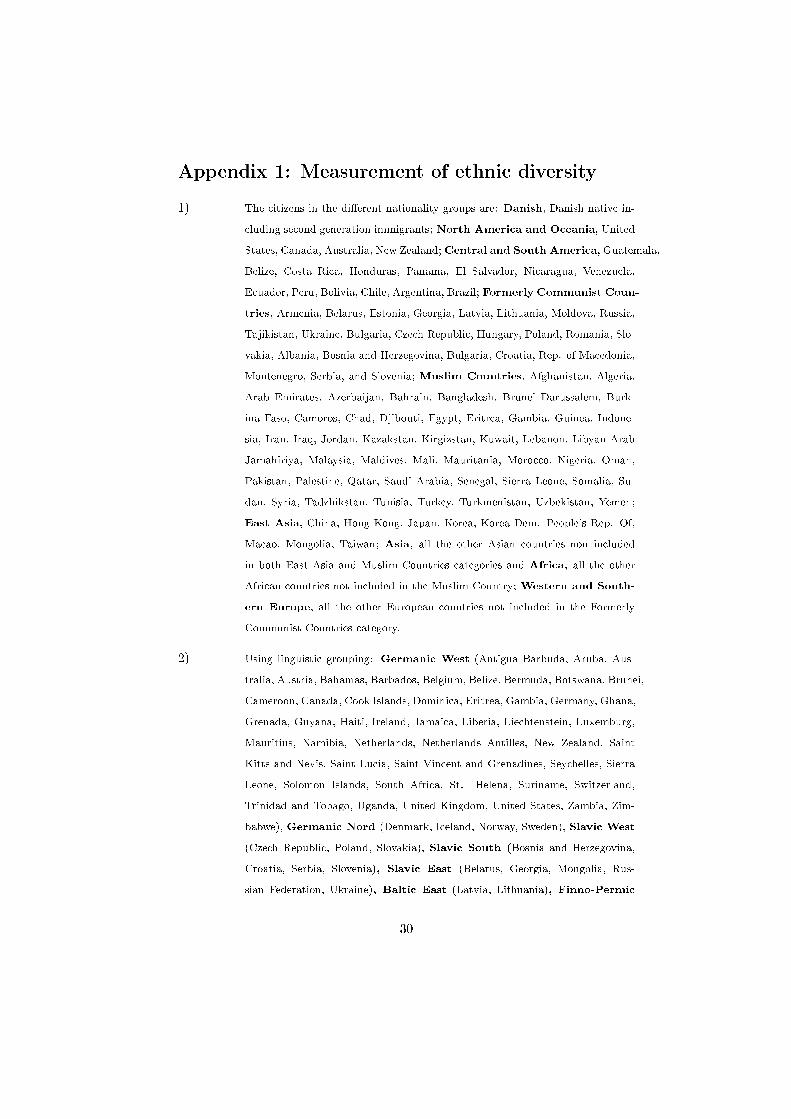
Diversity in cultural background is associated with employees' country of origin7
and is built by using the following eight categories: North America and Oceania,
Central and South America, Africa, Western and Southern Europe, Formerly
Communist Countries, East Asia, Other Asia, Muslim Countries.8 Diversity in
education is based on six categories. In particular, tertiary education (PhD,
Master and Bachelor) is divided into the following four groups: engineering,
7Native Danes and the second generation of immigrants are excluded.8See Appendix1 for more details about the countries belonging to each ethnic category.
8

humanities, natural sciences and social sciences. The other two categories are
represented by secondary and compulsory education. Eight categories instead
refer to the demographic diversity, which is computed by combining gender
and four age dichotomous indicators associated with quartiles of the overall age
distribution.
However, given that the overall categorization might be somehow arbitrary,
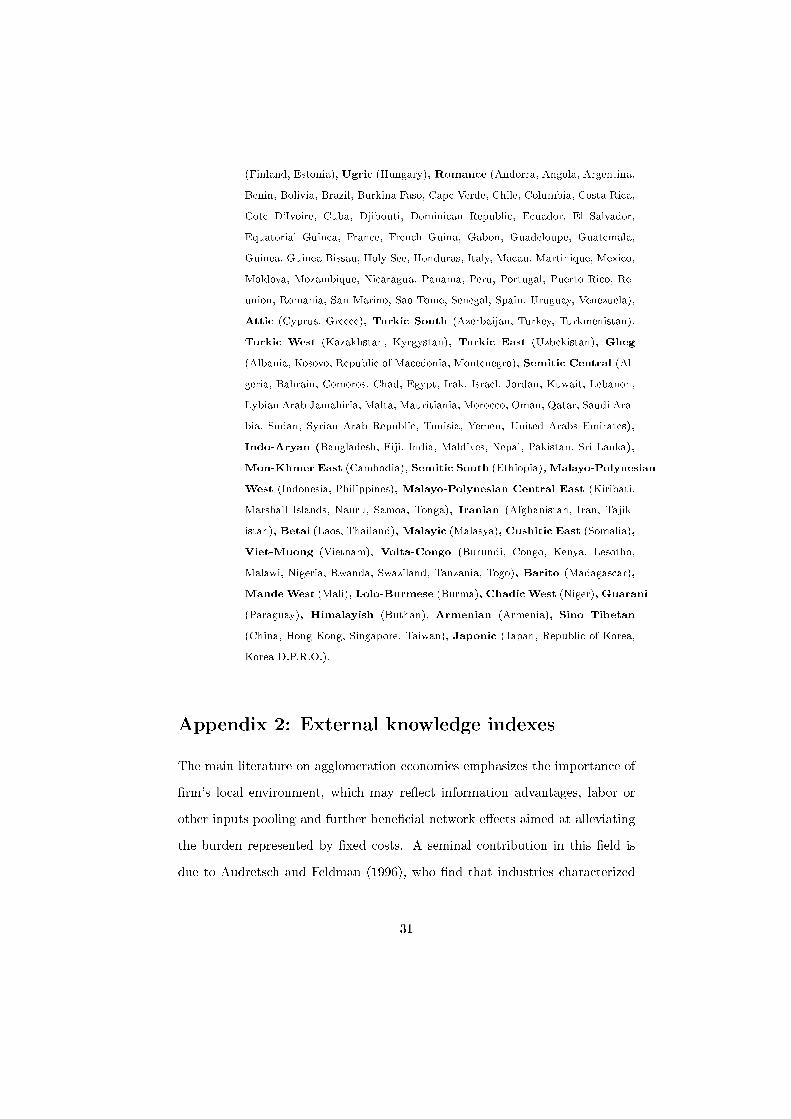
we decide to use a more disaggregated one, too. The alternative cultural back-
ground diversity is based on linguistic classi�cation.9 Speci�cally, we group
foreign employees together by family of languages, to which the language spo-
ken in their home country belongs. Using the third linguistic tree level language
classi�cation drawn from Ethnologue, we end up having 40 linguistic groups.10
Further, our disaggregated diversity indexes in education and demographics are
based on eight and ten categories, respectively. Di�erently from the former
classi�cation, the secondary education is split into 3 sub-groups: high school,
business high school and vocational education. Demographic diversity is com-
puted by combining gender and �ve age dichotomous indicators associated with
quintiles of the overall age distribution.
2.3 Descriptive statistics
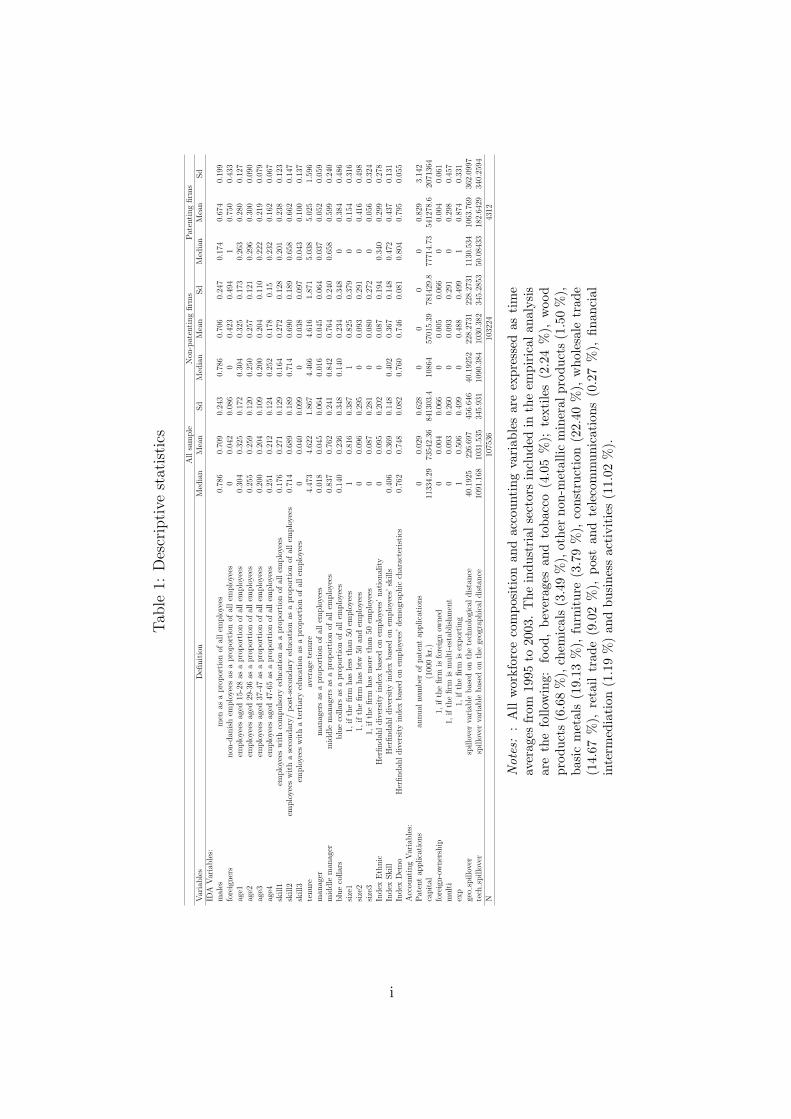
Table 1 reports some descriptive statistics (median, mean and standard de-
viation) of the variables used in our empirical analysis. The �rm population
is divided into two groups based on whether a �rm applied for at least one
patent (patenting �rm) or did not. Patenting �rms are characterized by notably
9Previous literature argues that linguistic distance serves as a good proxy for culturaldistance (Guiso, Sapienza and Zingales, 2009; Adsera and Pytlikova, 2010).
10The linguistic classi�cation is more detailed than the grouping by nationality. Speci�-cally, we group countries (their major o�cial language spoken by the majority in a particularcountry) by the third linguistic tree level, e.g. Germanic West vs. Germanic North vs. Ro-mance languages. The information on languages is drawn from the encyclopedia of languages�Ethnologue: Languages of the World�, see the Appendix section for more details about thelist of countries and the linguistic groups included.
9
higher values of capital and labor inputs: the average capital stock is almost
9.5 times the value of the non-patenting �rms. The latter are more likely to be
single-establishment companies and markedly less export-oriented: on average
the share of exporters halves among those �rms that have never applied for a
patent. Small di�erences are shown instead for the foreign ownership status: the
foreign capital penetration is quite low among Danish �rms. For the purposes of
our analysis it appears relevant to take into account the role of external sources
of knowledge since they may facilitate �rms' innovation activity. Although we
already control (using the export dummy) whether �rms compete in the inter-
national arena and then have access to foreign knowledge, more precise indexes
of knowledge spillovers can be de�ned at the national level. Speci�cally, we
construct two measures of knowledge spillovers, one based on the geographical
distance and the other on the technological proximity, see Appendix 2 for a de-
tailed description of the external knowledge indexes. Looking at these measures
of knowledge spillovers, see Table 1, we �nd no evidence of di�used clustering
behavior or huge di�erences in technological distance between the two groups
of �rms.
As evident from the Table 1, there are remarkable di�erences between patent-
ing and non-patenting �rms with respect to �rms' workforce composition. Not
surprisingly, patenting �rms are characterized by larger shares of highly edu-
cated employees, white-collar workers and managers, whereas the opposite holds
true for middle managers. Interestingly, patenting �rms also record a higher
share of female and foreign employees. Workers in these knowledge-based �rms
are slightly older on average terms: presumably the share of young employees
is lower because patenting �rms hire a wider proportion of well trained and
experienced people. As a matter of fact long tenure pro�les are more common
within patenting �rms' environment. Diversity indexes register higher values
10
for patenting �rms. Particularly evident is the di�erential in the ethnic hetero-
geneity that is 3.5 times larger on average with respect to non-patenting �rms.
These indexes also report substantial lower skill diversity, which is 16% poorer
in mean values. Thus, the presented descriptives raise a reasonable interest
in evaluating the �nexus� between �rms' patenting behavior and diversity in
ethnicity, education and demographics.
3 Econometric methods
3.1 Propensity to innovate
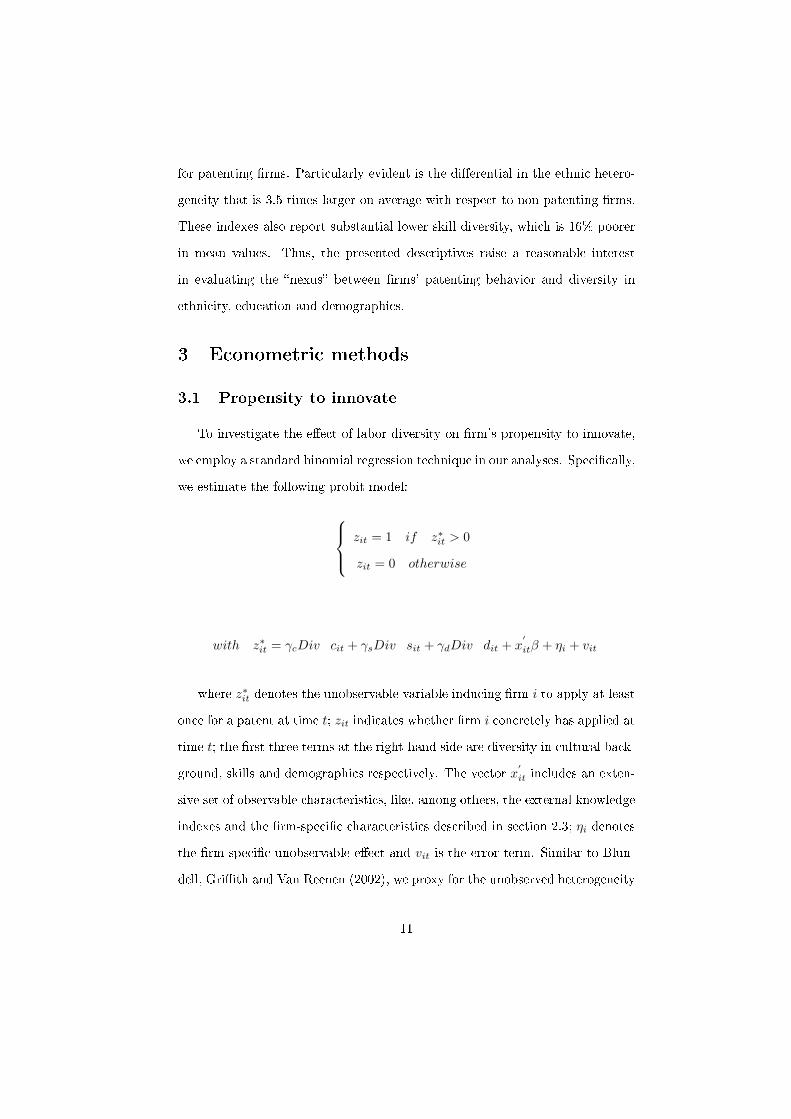
To investigate the e�ect of labor diversity on �rm's propensity to innovate,
we employ a standard binomial regression technique in our analyses. Speci�cally,
we estimate the following probit model:
zit = 1 if z∗it > 0
zit = 0 otherwise
with z∗it = γcDiv_cit + γsDiv_sit + γdDiv_dit + x′
itβ + ηi + vit
where z∗it denotes the unobservable variable inducing �rm i to apply at least
once for a patent at time t; zit indicates whether �rm i concretely has applied at
time t; the �rst three terms at the right-hand side are diversity in cultural back-
ground, skills and demographics respectively. The vector x′
it includes an exten-
sive set of observable characteristics, like, among others, the external knowledge
indexes and the �rm-speci�c characteristics described in section 2.3; ηi denotes
the �rm-speci�c unobservable e�ect and vit is the error term. Similar to Blun-
dell, Gri�th and Van Reenen (2002), we proxy for the unobserved heterogeneity
11
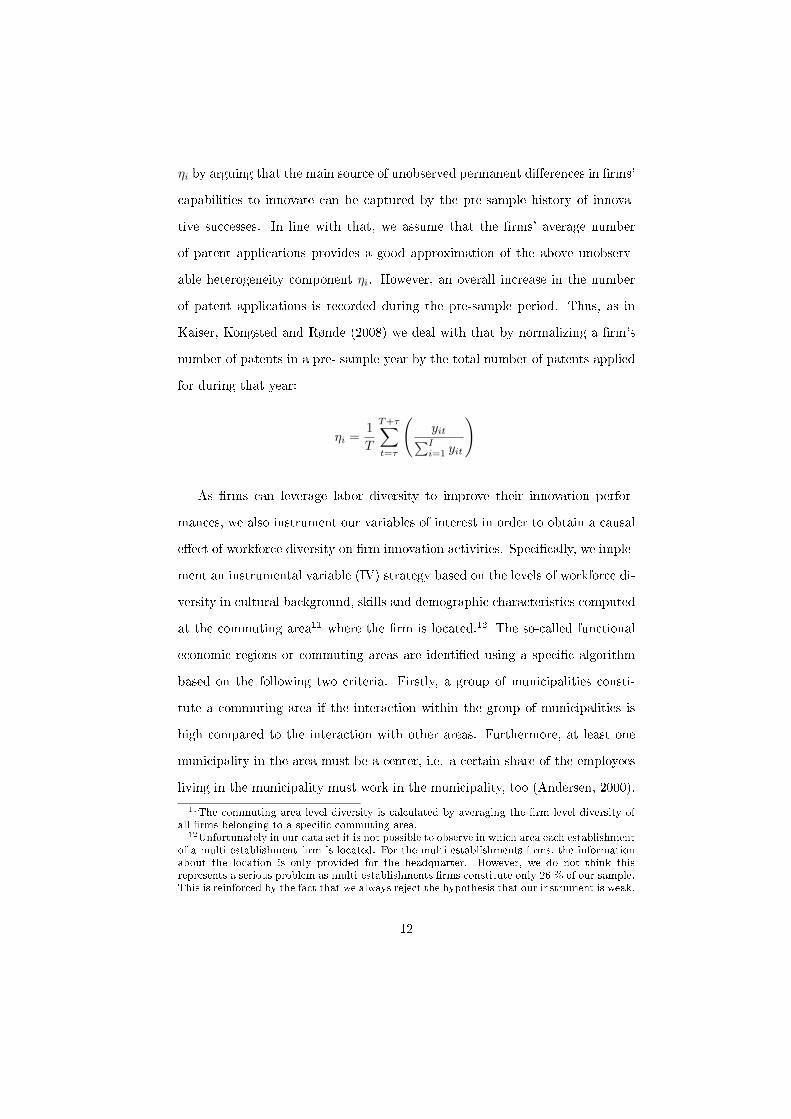
ηi by arguing that the main source of unobserved permanent di�erences in �rms'
capabilities to innovate can be captured by the pre-sample history of innova-
tive successes. In line with that, we assume that the �rms' average number
of patent applications provides a good approximation of the above unobserv-
able heterogeneity component ηi. However, an overall increase in the number
of patent applications is recorded during the pre-sample period. Thus, as in
Kaiser, Kongsted and Rønde (2008) we deal with that by normalizing a �rm's
number of patents in a pre- sample year by the total number of patents applied
for during that year:
ηi =1
T
T+τ∑t=τ
(yit∑Ii=1 yit
)
As �rms can leverage labor diversity to improve their innovation perfor-
mances, we also instrument our variables of interest in order to obtain a causal
e�ect of workforce diversity on �rm innovation activities. Speci�cally, we imple-
ment an instrumental variable (IV) strategy based on the levels of workforce di-
versity in cultural background, skills and demographic characteristics computed
at the commuting area11 where the �rm is located.12 The so-called functional
economic regions or commuting areas are identi�ed using a speci�c algorithm
based on the following two criteria. Firstly, a group of municipalities consti-
tute a commuting area if the interaction within the group of municipalities is
high compared to the interaction with other areas. Furthermore, at least one
municipality in the area must be a center, i.e. a certain share of the employees
living in the municipality must work in the municipality, too (Andersen, 2000).
11The commuting area level diversity is calculated by averaging the �rm level diversity ofall �rms belonging to a speci�c commuting area.
12Unfortunately in our data set it is not possible to observe in which area each establishmentof a multi-establishment �rm is located. For the multi-establishments �rms, the informationabout the location is only provided for the headquarter. However, we do not think thisrepresents a serious problem as multi-establishments �rms constitute only 26 % of our sample.This is reinforced by the fact that we always reject the hypothesis that our instrument is weak.
12

In total there are 51 commuting areas identi�ed, see Figure 1.
We believe that diversity at the commuting area level presents a suitable
supply driven instrument for workplace level diversity because commuting ar-
eas in Denmark (except for the area around Copenhagen) are typically relatively
small and therefore �rms very likely recruit workers from a given local supply
of labor, which is characterized by a certain degree of heterogeneity. This ar-
gument is further reinforced by the role of networks in the employment process
(Montgomery, 1991, Munshi, 2003). Thus �rms placed in areas with a high
labor diversity are also more likely to employ more a diverse workforce. More-
over, the rather low residential mobility in Denmark (Deding, Filges and Van
Ommeren, 2009) seems to support the properness of our IV strategy.13 To re-
inforce the exogeneity of our instruments we exclude each �rm workforce from
the computation of labor diversity at the related commuting area. We use the
same IV strategy for the analyses of intensive and extensive margins.
3.2 Intensive margins
As the number of patents is by de�nition restricted to non-negative integers,
the econometric strategy used to analyze the relationship between intensive
margins of patenting activity and labor diversity is grounded on the family of
count models. As a starting point we assume that the data generating process
follows a Poisson distribution. If the random variable Yit, in our case number
of patent applications �led by �rm i at time t, is Poisson distributed, then the
probability that exactly y applications are observed is as follows
13Furthermore, one may point towards potentially endogenous location behavior of immi-grants. The validity of our instrument may be strengthened by the spatial dispersion policyimplemented for immigrants between 1986 and 1998 by the Danish authorities. The dispersalpolicy implied that new refugees were randomly distributed across locations in Denmark, seee.g. Damm (2009).
13
P (Yit = y | λit) =e−λitλy
y!.
Covariates can be introduced by specifying the individual mean as
λit = exp(βcDiv_cit + βsDiv_sit + βdDiv_dit + w
′
itβw + ηi
), (1)
where ηi stands for the unobserved time-invariant �rm-speci�c heterogeneity
term and wit is a vector of patent production determinants, as speci�ed in
subsection 3.1. Following Blundell, Gri�th and Van Reenen (1995), we also
include, among the covariates wit, the discounted patent stock of �rm i at
period t − 1 in order to account for potential state dependence in patenting
activity. This is calculated as
disc_stockit−1 = yit−1 + (1− δ)disc_stockit−2 ,
where yit−1 is the lagged number of patent applications and δ is the depreciation
rate set equal to 30 per cent as in Blundell, Gri�th and Van Reenen (1995).
We also add a dummy variable taking value on zero if the �rm had never
innovated prior to 1995, to capture persistent di�erences between patenting
and non-patenting �rms (Blundell, Gri�th and Van Reenen, 1995; Blundell,
Gri�th and Van Reenen, 1999). In addition, this dummy variable represents a
remedy for the so-called "zero-in�ation problem" given that in our data many
�rms never applied for a single patent. The pre-sample information technique
is feasible in a study like ours because we have a long series for the dependent
variable (1977-1994) prior to the starting period (1995) of the �nal sample in
14
use.
However, as the Poisson model imposes the equality of conditional mean
and conditional variance of the dependent variable distribution, we also decide
to implement a negative binomial model, which is more �exible. In fact, it
allows the variance to exceed the mean and the dispersion parameter α to vary
randomly between �rms14:
P (Yit = y | αi, λit) =Γ(y + α−1
)y!Γ (α−1)
(α−1
α−1 + λit
)α−1 (λit
α−1 + λit
)y,
where Γ is the Gamma distribution.
As we have mentioned before, one may argue that the relationship between
�rm-patenting activity and diversity could be a�ected by endogeneity. The
latter issue might arise because there could be unobserved �rm-speci�c factors
in�uencing both the number of patent applications and the degree of labor
diversity. To address these concerns, we apply a two-stage IV procedure to
the Poisson model as suggested by Vuong (1984). In this case, equation (1) is
speci�ed as follows:
λit = exp(βcDiv_cit + βsDiv_sit + βdDiv_dit + w
′
itβw + ηi + uit
)(2)
where the term uit can be interpreted as unobserved heterogeneity correlated
with the diversity indexes but uncorrelated with the vector of patent production
determinants wit.15 To model the correlation between the endogenous variables
and uit, we specify a system of linear reduced-form equations, one for each
diversity index. This is
14The Negative binomial model coincides to a Poisson distribution when α = 0 .15The error term uit is added to allow for endogeneity. It also induces overdispersion, so
that the Poisson model and the Negative binomial model are empirically equivalent.
15

Div_cit = w
′
itγw + z′
itγz + εcit
Div_sit = witγw + z′
itγz + εsit
Div_dit = w′
itγw + z′
itγz + εdit
where zit is the vector of exogenous variables that a�ects �rm level diversity,
but does not directly a�ect the number of patent applications. As in section
3.1, the excluded variables are the diversity indexes computed at the commuting
area where the �rm is located and the model is just-identi�ed. The error terms ε
are assumed to have zero mean and to be correlated across equations for a given
�rm i, but uncorrelated across observations. Furthermore, we assume that the
errors u and ε are related via
uit = ρcεcit + ρsεsit + ρdεdit + ζit (3)
where ζit ∼[0, σ2
ζ
]is independent of εcit, εsit and εcit.
16 Substituting equation
(3) in equation (2) for uit and taking the expectation with respect to ζ yields
Eζ(λ) = exp(βcDiv_c+βsDiv_s+βdDiv_d+w′β+η+lnE(eζ)+ρcεc+ρsεs+ρdεd) .
The constant term lnE(eζ) can be absorbed in the coe�cient of the intercept
as an element of w. It follows that
λit = exp(βcDiv_cit + βsDiv_sit + βdDiv_dit + w
′itβw + ηi + ρcεcit + ρsεsit + ρdεdit
),
where εcit, εsit and εcit are the new additional variables. Given that the former
variables are unobservable, we follow a two-step estimation procedure where
we �rst estimate and generate them and second we estimate parameters of
the Poisson model after replacing εcit, εsit and εcit with ε̂cit, ε̂sit and ε̂cit .
Obviously, the variance and covariance matrix of the two-step estimator needs
16This assumption means that ε is a common latent factor that a�ects both diversity andpatent applications and is the only source of dependence between them, after controlling forthe in�uence of the observable variables.
16
to be adjusted for the above replacement by bootstrapping the sequential two-
step estimator.
3.3 Extensive margins
The estimation approach used to evaluate the extensive margins of �rms'
patenting behavior is similar to the one adopted for the �rms' propensity to
patent. Although the count data models would be more suitable for the anal-
yses of relationship between workforce diversity and the number of di�erent
technological areas of patent application, our data and concretely the lack of
minimum observations required to run count data models do not allow us to use
them. Instead, we evaluate whether more labor diversity increases the proba-
bility of a �rm to (apply for a) patent in more than one technological area.
4 Results
This section reports �ndings for each of the outcome dimensions we look at:
propensity to innovate, intensive and extensive margins. Several speci�cations
among the di�erent econometric models here employed help in understanding
the strength of our results. Further, in the sensitivity analyses subsection we
examine whether the results di�er between white- and blue-collar occupations,
and across alternative diversity and innovation measures.
4.1 Results on labor diversity and propensity to innovate
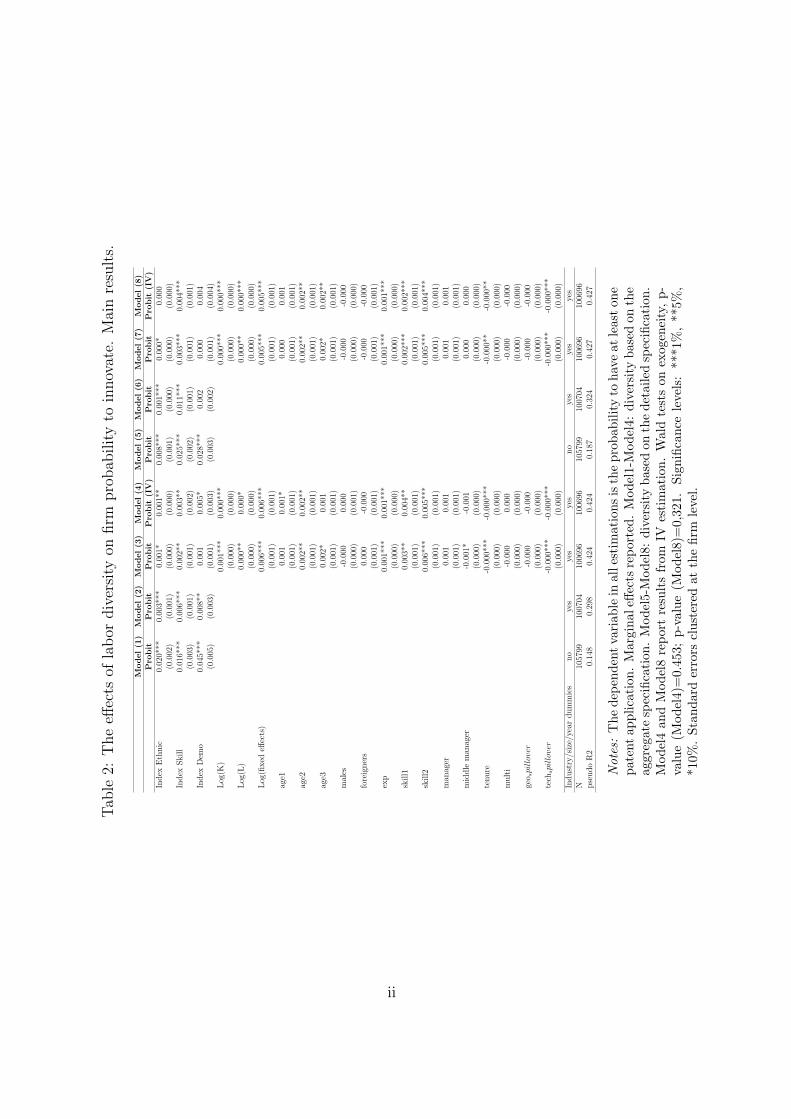
Table 2 reports estimates concerning the propensity to patent. As explained
in the previous section, we implement probit models having as dependent vari-
able the dummy indicating whether a �rm has applied for a patent in a given
17
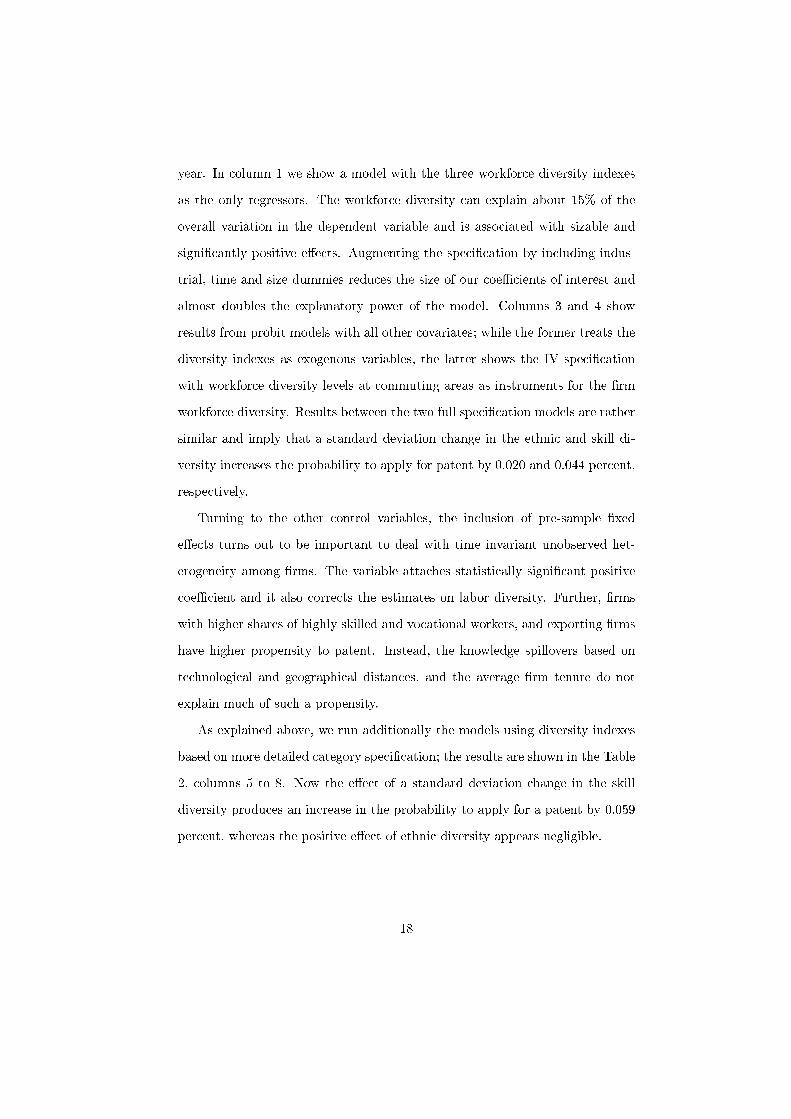
year. In column 1 we show a model with the three workforce diversity indexes
as the only regressors. The workforce diversity can explain about 15% of the
overall variation in the dependent variable and is associated with sizable and
signi�cantly positive e�ects. Augmenting the speci�cation by including indus-
trial, time and size dummies reduces the size of our coe�cients of interest and
almost doubles the explanatory power of the model. Columns 3 and 4 show
results from probit models with all other covariates; while the former treats the
diversity indexes as exogenous variables, the latter shows the IV speci�cation
with workforce diversity levels at commuting areas as instruments for the �rm
workforce diversity. Results between the two full speci�cation models are rather
similar and imply that a standard deviation change in the ethnic and skill di-
versity increases the probability to apply for patent by 0.020 and 0.044 percent,
respectively.
Turning to the other control variables, the inclusion of pre-sample �xed
e�ects turns out to be important to deal with time invariant unobserved het-
erogeneity among �rms. The variable attaches statistically signi�cant positive
coe�cient and it also corrects the estimates on labor diversity. Further, �rms
with higher shares of highly skilled and vocational workers, and exporting �rms
have higher propensity to patent. Instead, the knowledge spillovers based on
technological and geographical distances, and the average �rm tenure do not
explain much of such a propensity.
As explained above, we run additionally the models using diversity indexes
based on more detailed category speci�cation; the results are shown in the Table
2, columns 5 to 8. Now the e�ect of a standard deviation change in the skill
diversity produces an increase in the probability to apply for a patent by 0.059
percent, whereas the positive e�ect of ethnic diversity appears negligible.
18
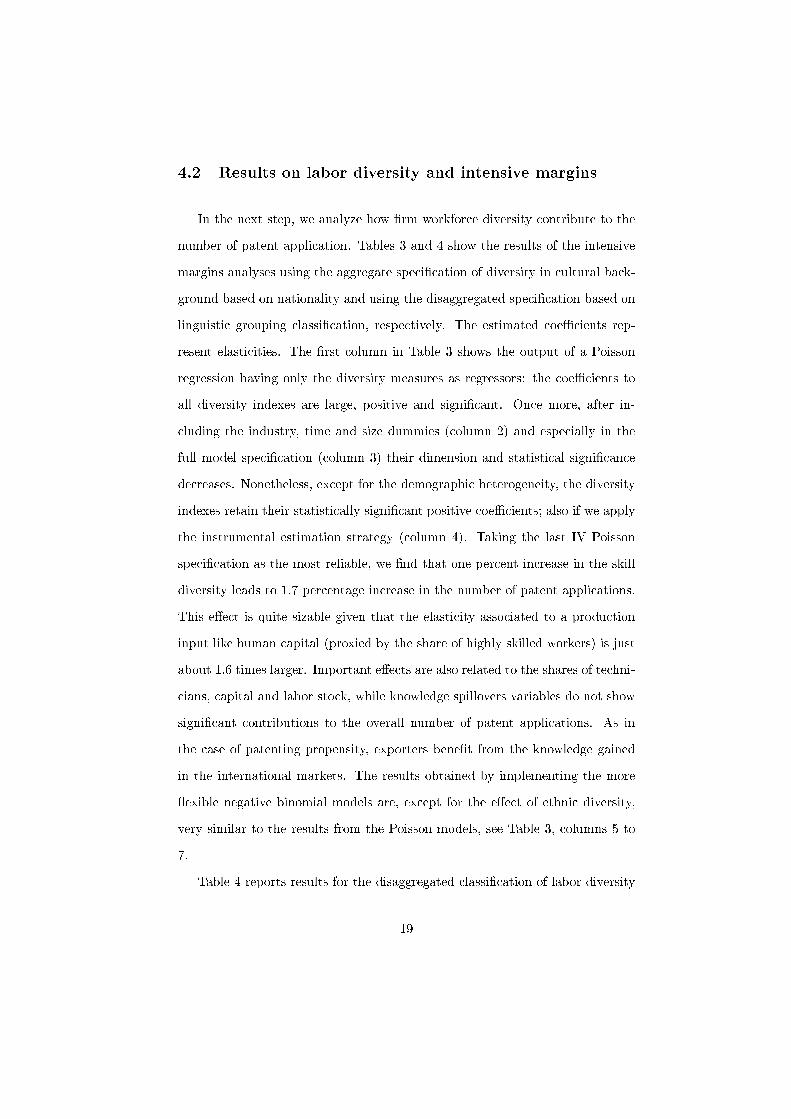
4.2 Results on labor diversity and intensive margins
In the next step, we analyze how �rm workforce diversity contribute to the
number of patent application. Tables 3 and 4 show the results of the intensive
margins analyses using the aggregate speci�cation of diversity in cultural back-
ground based on nationality and using the disaggregated speci�cation based on
linguistic grouping classi�cation, respectively. The estimated coe�cients rep-
resent elasticities. The �rst column in Table 3 shows the output of a Poisson
regression having only the diversity measures as regressors: the coe�cients to
all diversity indexes are large, positive and signi�cant. Once more, after in-
cluding the industry, time and size dummies (column 2) and especially in the
full model speci�cation (column 3) their dimension and statistical signi�cance
decreases. Nonetheless, except for the demographic heterogeneity, the diversity
indexes retain their statistically signi�cant positive coe�cients; also if we apply
the instrumental estimation strategy (column 4). Taking the last IV Poisson
speci�cation as the most reliable, we �nd that one percent increase in the skill
diversity leads to 1.7 percentage increase in the number of patent applications.
This e�ect is quite sizable given that the elasticity associated to a production
input like human capital (proxied by the share of highly skilled workers) is just
about 1.6 times larger. Important e�ects are also related to the shares of techni-
cians, capital and labor stock, while knowledge spillovers variables do not show
signi�cant contributions to the overall number of patent applications. As in
the case of patenting propensity, exporters bene�t from the knowledge gained
in the international markets. The results obtained by implementing the more
�exible negative binomial models are, except for the e�ect of ethnic diversity,
very similar to the results from the Poisson models, see Table 3, columns 5 to
7.
Table 4 reports results for the disaggregated classi�cation of labor diversity
19

dimensions. Although the results are very similar to the results using aggre-
gate diversity speci�cation shown in Table 3, there are some changes worth
noting. Speci�cally, in the IV Poisson (column 4) the coe�cient on the ethnic
diversity turns to be insigni�cant; in addition a larger e�ect is associated with
heterogeneity in skills. According to this speci�cation a one percent increase in
the educational heterogeneity implies a 2.23 percent increase in the number of
patent applications.17
4.3 Results on labor diversity and extensive margins
Table 5 reports the e�ects of labor diversity on the probability of applying
for a patent in di�erent technological areas in a given year. The structure of this
table is similar to Table 2. The low number of annual patent applications in each
technological area does not allow us to use potentially more suited count mod-
els. Regarding the variables of interest, we �nd that the diversity indexes alone
explain 6.8 percent of the overall variation in the dependent variable, coe�cients
to all diversity indexes are positive and statistically signi�cant. However, the
signi�cance of the diversity in cultural background and demographics vanishes
when all covariates are included. Overall, we �nd that skill diversity is impor-
tant for patenting in di�erent technological areas. Taking the lowest estimate
between the full IV speci�cations, it turns out that a standard deviation increase
in skill diversity is associated to a raise of about 7.2 percent in the probability
to patent in di�erent technological �elds. Thus it seems as the skill diversity is
17
We have also investigated whether the e�ects of a particular dimension of diversity can bein�uenced by other forms of labor heterogeneity by inclusion of all possible interaction cou-ples between the diversity indexes. Furthermore, driven by the hypothesis that there mightbe complementarities among di�erent skills and demographic groups, in particular young andeducated workers together with a more diverse workforce can stimulate innovation and cre-ativity, we have augmented our models with interactions between diversity indexes and sharesof highly skilled and younger workers. Nevertheless, none of the interactions turned out tobe statistically signi�cant. Figures showing marginal e�ects of the interactions are availablefrom the authors upon request.
20
much more relevant for patenting in di�erent technological areas than for the
patenting per se.
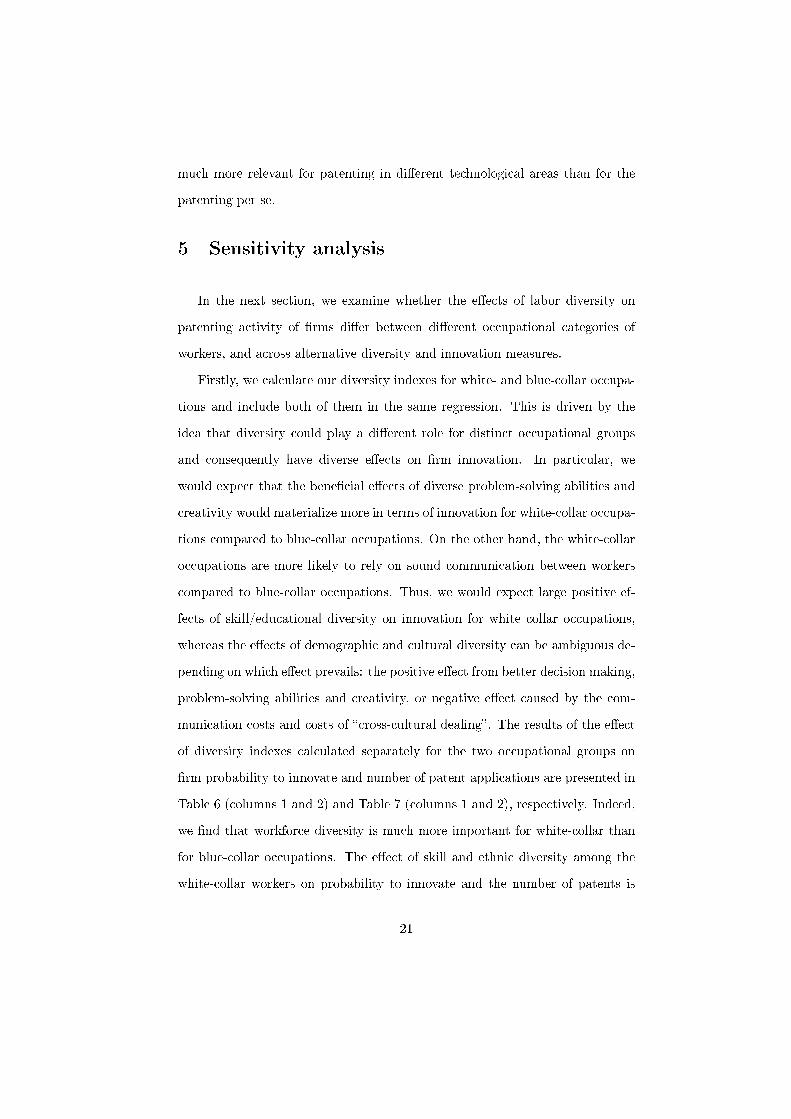
5 Sensitivity analysis
In the next section, we examine whether the e�ects of labor diversity on
patenting activity of �rms di�er between di�erent occupational categories of
workers, and across alternative diversity and innovation measures.
Firstly, we calculate our diversity indexes for white- and blue-collar occupa-
tions and include both of them in the same regression. This is driven by the
idea that diversity could play a di�erent role for distinct occupational groups
and consequently have diverse e�ects on �rm innovation. In particular, we
would expect that the bene�cial e�ects of diverse problem-solving abilities and
creativity would materialize more in terms of innovation for white-collar occupa-
tions compared to blue-collar occupations. On the other hand, the white-collar
occupations are more likely to rely on sound communication between workers
compared to blue-collar occupations. Thus, we would expect large positive ef-
fects of skill/educational diversity on innovation for white collar occupations,
whereas the e�ects of demographic and cultural diversity can be ambiguous de-
pending on which e�ect prevails: the positive e�ect from better decision making,
problem-solving abilities and creativity, or negative e�ect caused by the com-
munication costs and costs of �cross-cultural dealing�. The results of the e�ect
of diversity indexes calculated separately for the two occupational groups on
�rm probability to innovate and number of patent applications are presented in
Table 6 (columns 1 and 2) and Table 7 (columns 1 and 2), respectively. Indeed,
we �nd that workforce diversity is much more important for white-collar than
for blue-collar occupations. The e�ect of skill and ethnic diversity among the
white-collar workers on probability to innovate and the number of patents is
21

positive and statistically signi�cant. On contrary, the e�ect of demographic di-
versity is insigni�cant for both white- and blue-collar occupations. In the model
using detailed/disaggregated diversity indexes, the e�ect of demographic diver-
sity on the number of patent applications turns out to be negative, see Table
7. This is partly consistent with the notion by Lazear (1999). Finally, it is also
worth noting that the positive e�ect of ethnic and skill diversity is larger for the
number of patent application than for the probability to innovate.
Further, as a part of the sensitivity analysis we evaluate eventual varia-
tions in the e�ects of labor diversity when the diversity measure is di�erently
computed. In particular, we use two alternative diversity indexes: the Shannon-
Weaver entropy and the richness indexes. The former is considered as one of
the most profound and useful diversity indexes in biology (Maignan, Ottaviano,
Pinelli and Rullani, 2003), whereas the latter is de�ned as a number of categories
observed for each dimension of interest (it does not account for the �evenness�
dimension). Final checks come from the evaluation of the relationship between
labor diversity and �rms' granted patents rather than from patent applications.
The reason behind this sensitivity is based on the potential critique that appli-
cations may not result in granted patents18. Table 6 reports marginal e�ects
of the three dimensions of labor diversity on the �rm probability to innovate.
These �ndings do not substantially di�er from the main results. Interestingly,
the role of skill heterogeneity strengthens when the outcome variable is based on
patent grants rather than applications. This result is also con�rmed in analysis
of the number of patents shown in Table 7. Overall, the results of sensitivity
analysis are in line with the main �ndings and hence their overall interpretation
18Unfortunately, given the relatively low number of patenting �rms (and the delay occurringbetween the application year and period in which the potential grant is received), it is notpossible to evaluate how our main �ndings might have changed for the probability to patentin di�erent technological areas in a given year. The results with the alternative diversityindexes, Shannon-Weaver entropy and the richness indexes, are available from the authorsupon request.
22
does not vary. That notably corroborates our main analyses and provides an
evident support to the conclusions, which are summarized in the next section.
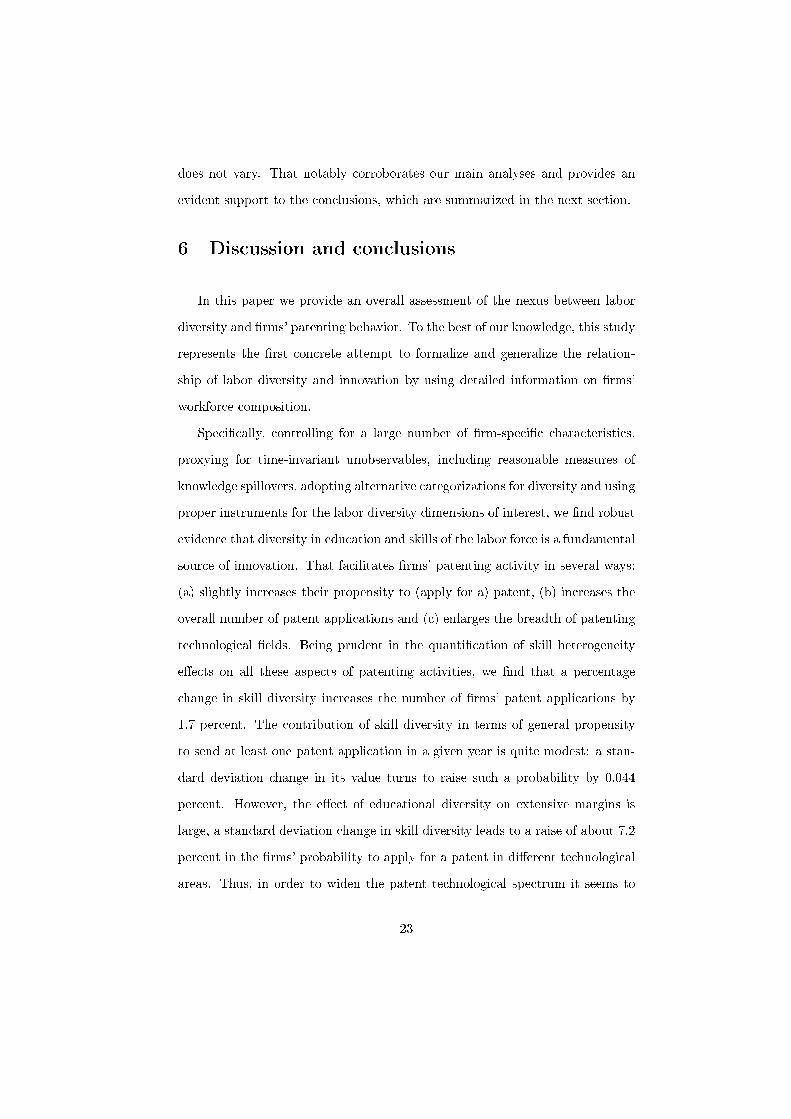
6 Discussion and conclusions
In this paper we provide an overall assessment of the nexus between labor
diversity and �rms' patenting behavior. To the best of our knowledge, this study
represents the �rst concrete attempt to formalize and generalize the relation-
ship of labor diversity and innovation by using detailed information on �rms'
workforce composition.
Speci�cally, controlling for a large number of �rm-speci�c characteristics,
proxying for time-invariant unobservables, including reasonable measures of
knowledge spillovers, adopting alternative categorizations for diversity and using
proper instruments for the labor diversity dimensions of interest, we �nd robust
evidence that diversity in education and skills of the labor force is a fundamental
source of innovation. That facilitates �rms' patenting activity in several ways:
(a) slightly increases their propensity to (apply for a) patent, (b) increases the
overall number of patent applications and (c) enlarges the breadth of patenting
technological �elds. Being prudent in the quanti�cation of skill heterogeneity
e�ects on all these aspects of patenting activities, we �nd that a percentage
change in skill diversity increases the number of �rms' patent applications by
1.7 percent. The contribution of skill diversity in terms of general propensity
to send at least one patent application in a given year is quite modest: a stan-
dard deviation change in its value turns to raise such a probability by 0.044
percent. However, the e�ect of educational diversity on extensive margins is
large, a standard deviation change in skill diversity leads to a raise of about 7.2
percent in the �rms' probability to apply for a patent in di�erent technological
areas. Thus, in order to widen the patent technological spectrum it seems to
23
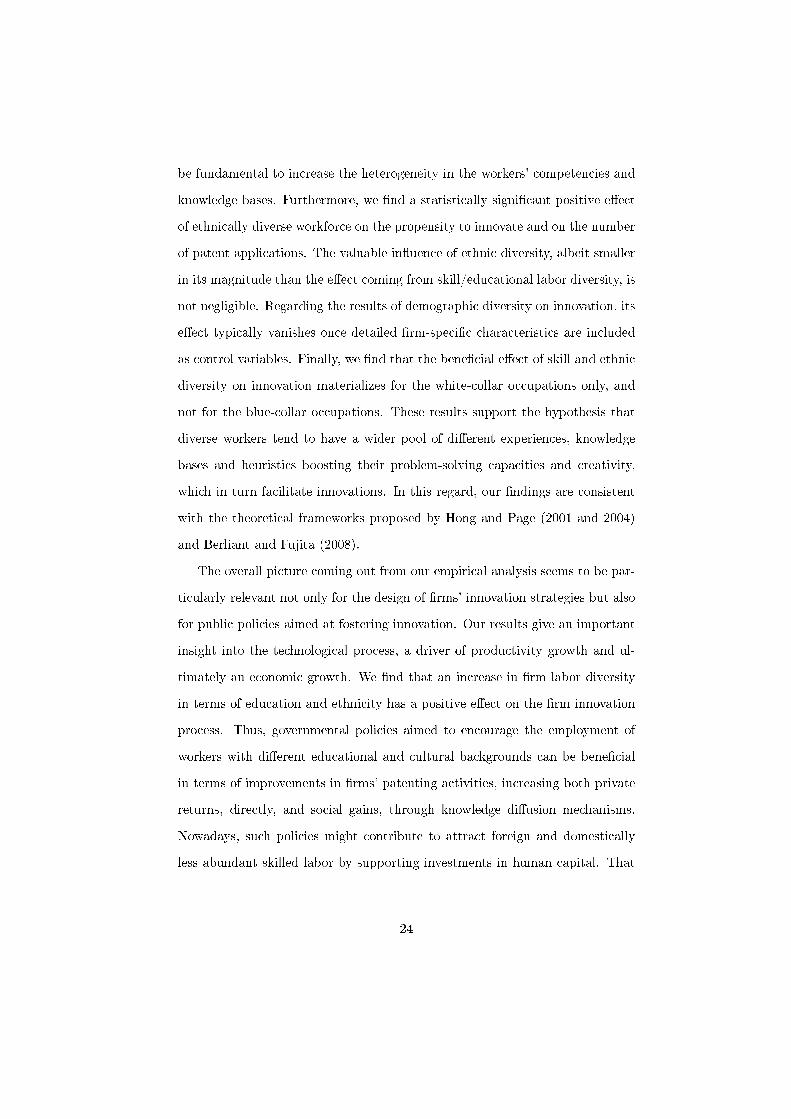
be fundamental to increase the heterogeneity in the workers' competencies and
knowledge bases. Furthermore, we �nd a statistically signi�cant positive e�ect
of ethnically diverse workforce on the propensity to innovate and on the number
of patent applications. The valuable in�uence of ethnic diversity, albeit smaller
in its magnitude than the e�ect coming from skill/educational labor diversity, is
not negligible. Regarding the results of demographic diversity on innovation, its
e�ect typically vanishes once detailed �rm-speci�c characteristics are included
as control variables. Finally, we �nd that the bene�cial e�ect of skill and ethnic
diversity on innovation materializes for the white-collar occupations only, and
not for the blue-collar occupations. These results support the hypothesis that
diverse workers tend to have a wider pool of di�erent experiences, knowledge
bases and heuristics boosting their problem-solving capacities and creativity,
which in turn facilitate innovations. In this regard, our �ndings are consistent
with the theoretical frameworks proposed by Hong and Page (2001 and 2004)
and Berliant and Fujita (2008).
The overall picture coming out from our empirical analysis seems to be par-
ticularly relevant not only for the design of �rms' innovation strategies but also
for public policies aimed at fostering innovation. Our results give an important
insight into the technological process, a driver of productivity growth and ul-
timately an economic growth. We �nd that an increase in �rm labor diversity
in terms of education and ethnicity has a positive e�ect on the �rm innovation
process. Thus, governmental policies aimed to encourage the employment of
workers with di�erent educational and cultural backgrounds can be bene�cial
in terms of improvements in �rms' patenting activities, increasing both private
returns, directly, and social gains, through knowledge di�usion mechanisms.
Nowadays, such policies might contribute to attract foreign and domestically
less abundant skilled labor by supporting investments in human capital. That
24

could be one of the determinants to invert the general decline in patenting ac-
tivity recorded during the recent economic crisis among the OECD countries
(OECD, 2009).
25

References
[1] ADSERA, A. and PYTLIKOVA, M. "The Role of Language in Shaping Inter-national Migration: Evidence from OECD Countries 1985-2006," Unpub-lished manuscript, 2010.
[2] ANDERSEN, A. K. "Commuting Areas in Denmark�, AKF working paper(2000).
[3] AUDRETSCH, D. B. and FELDMAN, M. P. "R&D Spillovers and the Geog-raphy of Innovation and Production." American Economic Review, Vol. 86(1996), pp. 630-640.
[4] ADAMS, J. D. �Fundamental Stocks of Knowledge and ProductivityGrowth�, Journal of Political Economy, Vol. 98 (1990), pp. 673-703.
[5] ADAMS, J.D. and JAFFE, A. �Bounding the E�ects of R&D: An Investi-gation Using Linked Establishment and Firm Data� Rand Journal of Eco-
nomics, Vol. 98 (1996), pp. 673-702.
[6] ANDERSON R, QUIGLEY J M, WILHELMSSON M. �Agglomerationand the spatial distribution of creativity�, Papers in Regional Science, 83(2005): pp. 445�464.
[7] BANTEL, K. A. and JACKSON S. E. �Top Management and Innovationsin Banking: Does the Composition of the Top Team Make a Di�erence?�,Strategic Management Journal, Vol. 10 (1989), pp. 107-124.
[8] BASSET-JONES, N. �The Paradox of Diversity Management, Creativity andInnovation�, Creativity and Innovation Management, Vol. 14 (2005), pp.169-175.
[9] BERLIANT M. and FUJITA M. �Knowledge Creation as a Square Danceon the Hilbert Cube.� International Economic Review, 49 (2008), pp.1251�1295.
[10] BLOOM, N. and VAN REENEN, J. �Patents, real options and �rm perfor-mance�, Economic Journal, Vol. 112 (2002), pp. 97-116.
[11] BLUNDELL, R., GRIFFITH R. and VAN REENEN J. "Dynamic Count DataModels of Technological Innovation", Economic Journal, Vol. 105 (1995),pp. 333-44.
[12] BLUNDELL, R., GRIFFITH R. and VAN REENEN J. �Market Share, MarketValue and Innovation in a Panel of British Manufacturing Firms�, TheReview of Economic Studies, Vol. 66 (1999), pp. 529-554.
[13] BLUNDELL, R., GRIFFITH R. and WINDMEIJER F. �Individual E�ectsand Dynamics in Count Data Models�, Journal of Econometrics, Vol. 108(2002), pp. 113-131.
26
[14] COHEN, W.M. and LEVINTHAL D.A. �Absorptive Capacity: A New Per-spective on Learning and Innovation�, Administrative Science Quarterly,Vol. 5 (1990), pp. 128-152.
[15] DEDING, M., FILGES, T. and VAN OMMEREN J. "Spatial Mobility andCommuting: the Case of Two-Earner Households", Journal of RegionalScience, Vol. 49 (2009), pp. 113-147.
[16] DRACH-ZAHAVY A. and SOMECH A. �Understanding Team Innovation: TheRole of Team Processes and Structures�, Group Dynamics: Theory, Re-
search, and Practice, Vol. 5 (2001), No. 2, pp. 111-123.
[17] EUROPEAN COMMISSION �The Business Case for Diversity: Good Practicesin the Workplace� (2005).
[18] FELDMAN, M. P. and AUDRETSCH, D. B. �Innovation in Cities: Science-Based Diversity, Specialization and Localized Competition.� European Eco-
nomic Review, Vol. 43 (1999), pp. 409�429.
[19] GRILICHES, Z. �Patent Statistics as Economic Indicators: A Survey�, Jour-nal of Economic Literature, vol. 28 (1990), pp. 1661-1707.
[20] GUISO, L., SAPIENZA, P. and ZINGALES L. "Cultural Biases in EconomicExchange?," Quarterly Journal of Economics, Vol. 124 (2009), pp. 1095-1131.
[21] HARRISON, D. A. and KLEIN K. J. �What's the di�erence? Diversity con-structs as separation, variety, or disparity in organizations�, Academy of
Management Review, Vol. 32 (2007), pp. 1199-1228.
[22] HONG, L. and PAGE SCOTT E. "Problem Solving by HeterogeneousAgents" Journal of Economic Theory, Vol. 97 (2001), Issue 1, pp. 123-163.
[23] HONG, L. and PAGE SCOTT E. "Groups of Diverse Problem Solvers CanOutperform Groups of High-Ability Problem Solvers," Proceedings of the
National Academy of Sciences, Vol. 101 (2004), No. 46, pp. 16385-16389.
[24] HORWITZ S. K. and HORWITZ I. B. �The E�ects of Team Diversity onTeam Outcomes: A Meta-Analytic Review of Team Demography�, Journalof Management, Vol. 33 (2007), pp. 987-1015.
[25] JAFFE, A. B. �Technological Opportunity and Spillovers of R&D�, Ameri-can Economic Review, Vol. 76 (1986), pp. 984-1001.
[26] KAISER, U., KONGSTED H. and RØNDE T. �Labor Mobility and PatentingActivity�, CAM working paper no. 16 (2008).
[27] KERR, W., LINCOLN, W. �The Supply Side of Innovation: H-1B VisaReforms and US Ethnic Invention�, Journal of Labor Economics, Vol. 28(2010), pp. 473-508.
27

[28] KELLEY, M. R. and HELPER, S. �Firm Size and Capabilities, RegionalAgglomeration, and the Adoption of New Technology�, Economics of In-novation and New Technology, Vol. 8 (1999), pp. 79�103.
[29] KNIGHT, D., PEARCE, C. L., SMITH K.G., OLIAN, J.D., SIMS, H. P.,SMITH, K.A. and FLOOD, P. �Top management team diversity, group pro-cess, and strategic consensus�, Journal of Strategic Management, Vol. 20(1999), pp. 445�465.
[30] LAZEAR, E. P. "Globalisation and the Market for Team-Mates", The Eco-nomic Journal, Vol. 109 (1999), pp. c15-c40.
[31] MAIGNAN, C., OTTAVIANO, G., PINELLI, D. and RULLANI F. �Bio-Ecological Diversity vs. Socio-Economic Diversity: A Comparison of Exist-ing Measures�, Nota di Lavoro (2003), Fondazione Eni Enrico Mattei.
[32] MONTGOMERY, James D., "Social Networks and Labor Market Outcomes:Toward an Economic Analysis," American Economic Review, 81 (1991),pp. 1408-1418.
[33] MUNSHI, K. "Networks in the Modern Economy: Mexican Migrants in theUS Labor Market," The Quarterly Journal of Economics, Vol. 118 (2003),pp. 549-599.
[33] NIEBUHR, A. �Migration and innovation: Does cultural diversity matterfor regional R&D activity?�, Papers in Regional Science, 89 (2010), pp.563�585.
[34] OECD, �Policy responses to the Economic crisis. Investing in Innovation forLong-Term Growth�, Paris, (2009).
[35] OSBORNE, E. "The Deceptively Simple Economics of Workplace Diversity",Journal of Labor Research, Vol. 21 (2000), pp. 463-475.
[36] PARROTTA P., POZZOLI D. and PYTLIKOVA M. �Does Labor DiversityA�ect Firm Productivity?� Aarhus School of Business Working Paper No.10-12. Aarhus. (2010).
[37] PEDERSEN,J. P., PYTLIKOVA, M. and SMITH N. "Selection and NetworkE�ects - Migration Flows into OECD Countries 1990-2000", European
Economic Review. Vol. 52, Issue 7 (2008), pp. 1160-1186.
[38] PITCHER P. and SMITH A.D. �Top Management Team Heterogeneity: Per-sonality, Power, and Proxies�, Organization Science, Vol. 12, No. 1 (2001),pp. 1-18.
[39] SÖLLNER, R. �Human Capital Diversity and Product Innovation: A Micro-Level Analysis�, Jena Economic Research Papers, (2010) - 027.
28
[40] VUONG, Q. H. �Two-Stage Conditional Maximum Likelihood Estimation ofEconometric Models�, Social Science Working Paper, 538 (1984), CaliforniaInstitute of Technology.
[41] WALLSTEN S. J. �An Empirical Test of Geographic Knowledge SpilloversUsing Geographic Information Systems and Firm-Level Data.� Regional
Science and Urban Economics, Vol. 31 (2001), No. 5: 571-599.
[42] WATSON, W. E., KUMAR K. and MICHAELSEN L.K. �Cultural Diversity'sImpact on Interaction Process and Performance: Comparing Homogeneousand Diverse Task Groups�, The Academy of Management Journal, Vol. 36,No. 3 (Jun., 1993), pp. 590-602.
[43] WILLIAMS, K.Y. and O'REILLY III. C.A.�Demography and Diversity inOrganizations: A Review of 40 Years of Research�, In B.M. Staw & L.L.Cummings (Eds.), Research in Organizational Behavior, Vol. 20 (1998), pp.77-140.
[44] ZAJAC E., GOLDEN B. R. and SHORTELL S. M. �New Organizational Formsfor Enhancing Innovation: The Case of Internal Corporate Joint Ventures�,Management Science, Vol. 37 (1991), No. 2, pp. 170-184.
[45] ØSTERGAARD C. R., TIMMERMANS B. and KRISTINSSON K. �BeyondTechnological Diversi�cation: The Impact of Employee Diversity on Inno-vation�, DRUID Working Papers 09-03 (2009), DRUID, Copenhagen Busi-ness School, Department of Industrial Economics and Strategy/AalborgUniversity, Department of Business Studies.
29
Appendix 1: Measurement of ethnic diversity
1) The citizens in the di�erent nationality groups are: Danish, Danish native in-
cluding second generation immigrants; North America and Oceania, United
States, Canada, Australia, New Zealand; Central and South America, Guatemala,
Belize, Costa Rica, Honduras, Panama, El Salvador, Nicaragua, Venezuela,
Ecuador, Peru, Bolivia, Chile, Argentina, Brazil; Formerly Communist Coun-
tries, Armenia, Belarus, Estonia, Georgia, Latvia, Lithuania, Moldova, Russia,
Tajikistan, Ukraine, Bulgaria, Czech Republic, Hungary, Poland, Romania, Slo-
vakia, Albania, Bosnia and Herzegovina, Bulgaria, Croatia, Rep. of Macedonia,
Montenegro, Serbia, and Slovenia; Muslim Countries, Afghanistan, Algeria,
Arab Emirates, Azerbaijan, Bahrain, Bangladesh, Brunei Darussalem, Burk-
ina Faso, Camoros, Chad, Djibouti, Egypt, Eritrea, Gambia, Guinea, Indone-
sia, Iran, Iraq, Jordan, Kazakstan, Kirgizstan, Kuwait, Lebanon, Libyan Arab
Jamahiriya, Malaysia, Maldives, Mali, Mauritania, Morocco, Nigeria, Oman,
Pakistan, Palestine, Qatar, Saudi Arabia, Senegal, Sierra Leone, Somalia, Su-
dan, Syria, Tadzhikstan, Tunisia, Turkey, Turkmenistan, Uzbekistan, Yemen;
East Asia, China, Hong Kong, Japan, Korea, Korea Dem. People's Rep. Of,
Macao, Mongolia, Taiwan; Asia, all the other Asian countries non included
in both East Asia and Muslim Countries categories and Africa, all the other
African countries not included in the Muslim Country; Western and South-
ern Europe, all the other European countries not included in the Formerly
Communist Countries category.
2) Using linguistic grouping: Germanic West (Antigua Barbuda, Aruba, Aus-
tralia, Austria, Bahamas, Barbados, Belgium, Belize, Bermuda, Botswana, Brunei,
Cameroon, Canada, Cook Islands, Dominica, Eritrea, Gambia, Germany, Ghana,
Grenada, Guyana, Haiti, Ireland, Jamaica, Liberia, Liechtenstein, Luxemburg,
Mauritius, Namibia, Netherlands, Netherlands Antilles, New Zealand, Saint
Kitts and Nevis, Saint Lucia, Saint Vincent and Grenadines, Seychelles, Sierra
Leone, Solomon Islands, South Africa, St. Helena, Suriname, Switzerland,
Trinidad and Tobago, Uganda, United Kingdom, United States, Zambia, Zim-
babwe), Germanic Nord (Denmark, Iceland, Norway, Sweden), Slavic West
(Czech Republic, Poland, Slovakia), Slavic South (Bosnia and Herzegovina,
Croatia, Serbia, Slovenia), Slavic East (Belarus, Georgia, Mongolia, Rus-
sian Federation, Ukraine), Baltic East (Latvia, Lithuania), Finno-Permic
30
(Finland, Estonia), Ugric (Hungary), Romance (Andorra, Angola, Argentina,
Benin, Bolivia, Brazil, Burkina Faso, Cape Verde, Chile, Columbia, Costa Rica,
Cote D'Ivoire, Cuba, Djibouti, Dominican Republic, Ecuador, El Salvador,
Equatorial Guinea, France, French Guina, Gabon, Guadeloupe, Guatemala,
Guinea, Guinea Bissau, Holy See, Honduras, Italy, Macau, Martinique, Mexico,
Moldova, Mozambique, Nicaragua, Panama, Peru, Portugal, Puerto Rico, Re-
union, Romania, San Marino, Sao Tome, Senegal, Spain, Uruguay, Venezuela),
Attic (Cyprus, Greece), Turkic South (Azerbaijan, Turkey, Turkmenistan),
Turkic West (Kazakhstan, Kyrgystan), Turkic East (Uzbekistan), Gheg
(Albania, Kosovo, Republic of Macedonia, Montenegro), Semitic Central (Al-
geria, Bahrain, Comoros, Chad, Egypt, Irak, Israel, Jordan, Kuwait, Lebanon,
Lybian Arab Jamahiria, Malta, Mauritiania, Morocco, Oman, Qatar, Saudi Ara-
bia, Sudan, Syrian Arab Republic, Tunisia, Yemen, United Arabs Emirates),
Indo-Aryan (Bangladesh, Fiji, India, Maldives, Nepal, Pakistan, Sri Lanka),
Mon-Khmer East (Cambodia), Semitic South (Ethiopia), Malayo-Polynesian
West (Indonesia, Philippines), Malayo-Polynesian Central East (Kiribati,
Marshall Islands, Nauru, Samoa, Tonga), Iranian (Afghanistan, Iran, Tajik-
istan), Betai (Laos, Thailand), Malayic (Malasya), Cushitic East (Somalia),
Viet-Muong (Vietnam), Volta-Congo (Burundi, Congo, Kenya, Lesotho,
Malawi, Nigeria, Rwanda, Swaziland, Tanzania, Togo), Barito (Madagascar),
MandeWest (Mali), Lolo-Burmese (Burma), Chadic West (Niger), Guarani
(Paraguay), Himalayish (Buthan), Armenian (Armenia), Sino Tibetan
(China, Hong Kong, Singapore, Taiwan), Japonic (Japan, Republic of Korea,
Korea D.P.R.O.).
Appendix 2: External knowledge indexes
The main literature on agglomeration economies emphasizes the importance of
�rm's local environment, which may re�ect information advantages, labor or
other inputs pooling and further bene�cial network e�ects aimed at alleviating
the burden represented by �xed costs. A seminal contribution in this �eld is
due to Audretsch and Feldman (1996), who �nd that industries characterized
31
by elevated R&D intensity or particularly skilled labor forces present a greater
degree of geographic concentration of production. Other relevant studies like
Wallsten (2001) and Adams and Ja�e (1996) provide evidence of the geographic
extent of knowledge spillovers by computing the distance in miles between each
�rm-pair. However, the geography is not the only dimension of the external
knowledge. In fact, there exists at least another approach which focuses on the
concept of technological proximity (Ja�e, 1986; Adams, 1990). Speci�cally, the
idea that the technology developed by a �rm can a�ect other �rms, even though
they are not geographically close or no transactions of goods occur between
them, has led to the de�nition of technological proximity as closeness between
�rm-pairs' technological pro�les.
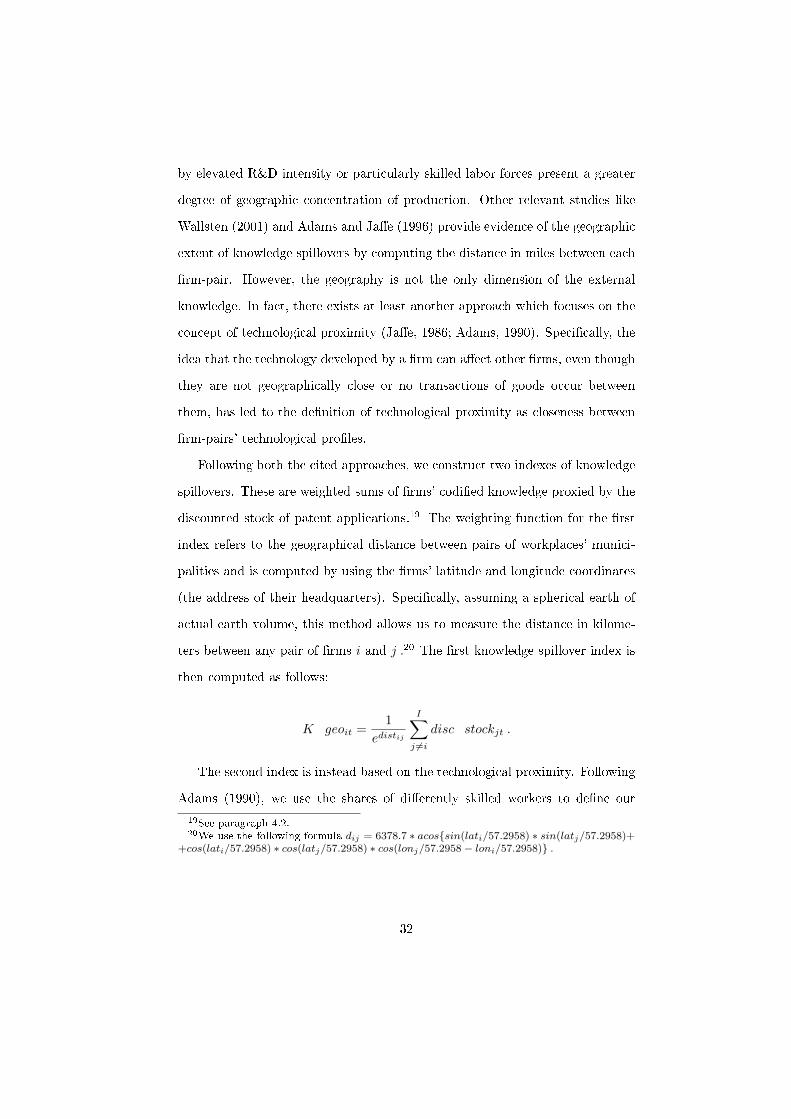
Following both the cited approaches, we construct two indexes of knowledge
spillovers. These are weighted sums of �rms' codi�ed knowledge proxied by the
discounted stock of patent applications.19 The weighting function for the �rst
index refers to the geographical distance between pairs of workplaces' munici-
palities and is computed by using the �rms' latitude and longitude coordinates
(the address of their headquarters). Speci�cally, assuming a spherical earth of
actual earth volume, this method allows us to measure the distance in kilome-
ters between any pair of �rms i and j .20 The �rst knowledge spillover index is
then computed as follows:
K_geoit =1
edistij
I∑j 6=i
disc_stockjt .
The second index is instead based on the technological proximity. Following
Adams (1990), we use the shares of di�erently skilled workers to de�ne our
19See paragraph 4.2.20We use the following formula dij = 6378.7 ∗ acos{sin(lati/57.2958) ∗ sin(latj/57.2958)+
+cos(lati/57.2958) ∗ cos(latj/57.2958) ∗ cos(lonj/57.2958− loni/57.2958)} .
32
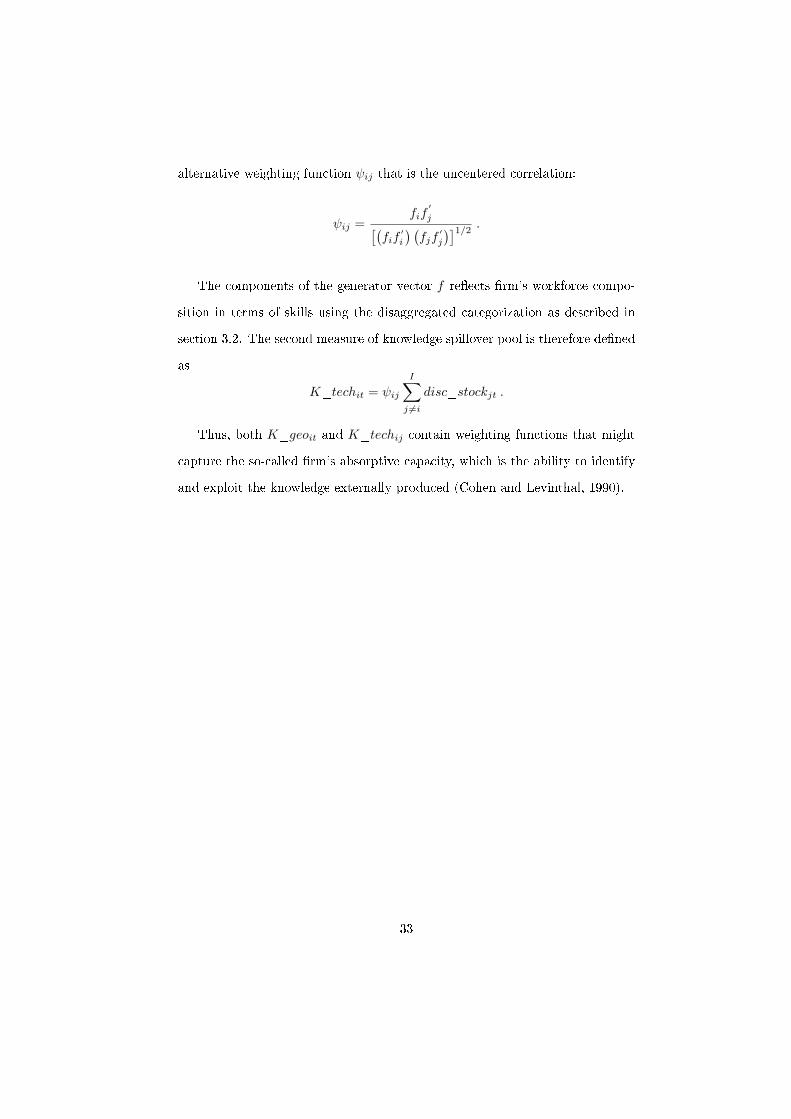
alternative weighting function ψij that is the uncentered correlation:
ψij =fif
′
j[(fif
′i
) (fjf
′j
)]1/2 .
The components of the generator vector f re�ects �rm's workforce compo-
sition in terms of skills using the disaggregated categorization as described in
section 3.2. The second measure of knowledge spillover pool is therefore de�ned
as
K_techit = ψij
I∑j 6=i
disc_stockjt .
Thus, both K_geoit and K_techij contain weighting functions that might
capture the so-called �rm's absorptive capacity, which is the ability to identify
and exploit the knowledge externally produced (Cohen and Levinthal, 1990).
33
Tab
le1:
Des
crip
tive
stat
isti
cs
All
sam
ple
Non
-pat
enti
ng
firm
sP
aten
ting
firm
sV
aria
ble
sD
efinit
ion
Med
ian
Mea
nSd
Med
ian
Mea
nSd
Med
ian
Mea
nSd
IDA
Var
iable
s:m
ales
men
asa
pro
por
tion
ofal
lem
plo
yees
0.78
60.
709
0.24
30.
786
0.70
60.
247
0.17
40.
674
0.19
9fo
reig
ner
snon
-dan
ish
emplo
yees
asa
pro
por
tion
ofal
lem
plo
yees
00.
042
0.08
60
0.42
30.
494
10.
750
0.43
3ag
e1em
plo
yees
aged
15-2
8as
apro
por
tion
ofal
lem
plo
yees
0.30
40.
325
0.17
20.
304
0.32
50.
173
0.26
30.
280
0.12
7ag
e2em
plo
yees
aged
29-3
6as
apro
por
tion
ofal
lem
plo
yees
0.25
50.
259
0.12
00.
250
0.25
70.
121
0.29
60.
300
0.09
0ag
e3em
plo
yees
aged
37-4
7as
apro
por
tion
ofal
lem
plo
yees
0.20
00.
204
0.10
90.
200
0.20
40.
110
0.22
20.
219
0.07
9ag
e4em
plo
yees
aged
47-6
5as
apro
por
tion
ofal
lem
plo
yees
0.25
10.
212
0.12
40.
252
0.17
80.
150.
232
0.16
20.
067
skill1
emplo
yees
wit
hco
mpuls
ory
educa
tion
asa
pro
por
tion
ofal
lem
plo
yees
0.17
60.
271
0.12
90.
164
0.27
20.
128
0.20
10.
238
0.12
3sk
ill2
emplo
yees
wit
ha
seco
ndar
y/
pos
t-se
condar
yed
uca
tion
asa
pro
por
tion
ofal
lem
plo
yees
0.71
40.
689
0.18
90.
714
0.69
00.
189
0.65
80.
662
0.14
7sk
ill3
emplo
yees
wit
ha
tert
iary
educa
tion
asa
pro
por
tion
ofal
lem
plo
yees
00.
040
0.09
90
0.03
80.
097
0.04
30.
100
0.13
7te
nure
aver
age
tenure
4.47
34.
622
1.86
74.
466
4.61
61.
871
5.03
85.
025
1.59
6m
anag
erm
anag
ers
asa
pro
por
tion
ofal
lem
plo
yees
0.01
80.
045
0.06
40.
016
0.04
50.
064
0.03
70.
052
0.05
9m
iddle
man
ager
mid
dle
man
ager
sas
apro
por
tion
ofal
lem
plo
yees
0.83
70.
762
0.24
10.
842
0.76
40.
240
0.65
80.
599
0.24
0blu
eco
llar
sblu
eco
llar
sas
apro
por
tion
ofal
lem
plo
yees
0.14
00.
236
0.34
80.
140
0.23
40.
348
00.
384
0.48
6si
ze1
1,if
the
firm
has
less
than
50em
plo
yees
10.
816
0.38
71
0.82
50.
379
00.
154
0.31
6si
ze2
1,if
the
firm
has
btw
50an
dem
plo
yees
00.
096
0.29
50
0.09
30.
291
00.
416
0.49
8si
ze3
1,if
the
firm
has
mor
eth
an50
emplo
yees
00.
087
0.28
10
0.08
00.
272
00.
056
0.32
4In
dex
Eth
nic
Her
findah
ldiv
ersi
tyin
dex
bas
edon
emplo
yees
’nat
ional
ity
00.
095
0.20
20
0.08
70.
194
0.34
00.
299
0.27
8In
dex
Skill
Her
findah
ldiv
ersi
tyin
dex
bas
edon
emplo
yees
’sk
ills
0.40
60.
369
0.14
80.
402
0.36
70.
148
0.47
20.
437
0.13
1In
dex
Dem
oH
erfindah
ldiv
ersi
tyin
dex
bas
edon
emplo
yees
’dem
ogra
phic
char
acte
rist
ics
0.76
20.
748
0.08
20.
760
0.74
60.
081
0.80
40.
795
0.05
5A
ccou
nti
ng
Var
iable
s:P
aten
tap
plica
tion
san
nual
num
ber
ofpat
ent
applica
tion
s0
0.02
90.
628
00
00
0.82
93.
142
capit
al(1
000
kr.
)11
334.
2973
542.
3684
1303
.410
864
5701
5.39
7814
29.8
7771
4.73
5412
78.6
2071
364
fore
ign-o
wner
ship
1,if
the
firm
isfo
reig
now
ned
00.
004
0.06
60
0.00
50.
066
00.
004
0.06
1m
ult
i1,
ifth
efirm
ism
ult
i-es
tablish
men
t0
0.09
30.
260
00.
093
0.29
10
0.29
80.
457
exp
1,if
the
firm
isex
por
ting
10.
506
0.49
90
0.48
80.
499
10.
874
0.33
1ge
osp
illo
ver
spillo
ver
vari
able
bas
edon
the
tech
nol
ogic
aldis
tance
40.1
925
226.
697
456.
646
40.1
9252
228.
2731
228.
2731
1130
.534
1063
.769
362.
0997
tech
spillo
ver
spillo
ver
vari
able
bas
edon
the
geog
raphic
aldis
tance
1091
.168
1031
.535
345.
931
1090
.384
1030
.382
345.
2853
50.0
8433
182.
6429
340.
2594
N10
7536
1032
2443
12
Not
es:
:A
llw
orkf
orce
com
posi
tion
and
acco
unti
ngva
riab
les
are
expr
esse
das
tim
eav
erag
esfr
om19
95to
2003
.T
hein
dust
rial
sect
ors
incl
uded
inth
eem
piri
cala
naly
sis
are
the
follo
win
g:fo
od,
beve
rage
san
dto
bacc
o(4
.05
%);
text
iles
(2.2
4%
),w
ood
prod
ucts
(6.6
8%
),ch
emic
als
(3.4
9%
),ot
her
non-
met
allic
min
eral
prod
ucts
(1.5
0%
),ba
sic
met
als
(19.
13%
),fu
rnit
ure
(3.7
9%
),co
nstr
ucti
on(2
2.40
%),
who
lesa
letr
ade
(14.
67%
),re
tail
trad
e(9
.02
%),
post
and
tele
com
mun
icat
ions
(0.2
7%
),fin
anci
alin
term
edia
tion
(1.1
9%
)an
dbu
sine
ssac
tivi
ties
(11.
02%
).
i
Tab
le2:
The
effec
tsof
lab
ordiv
ersi
tyon
firm
pro
bab
ilit
yto
innov
ate.
Mai
nre
sult
s.
Mod
el
(1)
Mod
el
(2)
Mod
el
(3)
Mod
el
(4)
Mod
el
(5)
Mod
el
(6)
Mod
el
(7)
Mod
el
(8)
Pro
bit
Pro
bit
Pro
bit
Pro
bit
(IV
)P
rob
itP
rob
itP
rob
itP
rob
it(I
V)
Index
Eth
nic
0.02
0***
0.00
3***
0.00
1*0.
001*
*0.
008*
**0.
001*
**0.
000*
0.00
0(0
.002
)(0
.001
)(0
.000
)(0
.000
)(0
.001
)(0
.000
)(0
.000
)(0
.000
)In
dex
Skill
0.01
6***
0.00
6***
0.00
2**
0.00
3**
0.02
5***
0.01
1***
0.00
3***
0.00
4***
(0.0
03)
(0.0
01)
(0.0
01)
(0.0
02)
(0.0
02)
(0.0
01)
(0.0
01)
(0.0
01)
Index
Dem
o0.
045*
**0.
008*
*0.
001
0.00
5*0.
028*
**0.
002
0.00
00.
004
(0.0
05)
(0.0
03)
(0.0
01)
(0.0
03)
(0.0
03)
(0.0
02)
(0.0
01)
(0.0
04)
Log
(K)
0.00
1***
0.00
0***
0.00
0***
0.00
0***
(0.0
00)
(0.0
00)
(0.0
00)
(0.0
00)
Log
(L)
0.00
0**
0.00
0*0.
000*
*0.
000*
**(0
.000
)(0
.000
)(0
.000
)(0
.000
)L
og(fi
xed
effec
ts)
0.00
6***
0.00
6***
0.00
5***
0.00
5***
(0.0
01)
(0.0
01)
(0.0
01)
(0.0
01)
age1
0.00
10.
001*
0.00
00.
001
(0.0
01)
(0.0
01)
(0.0
01)
(0.0
01)
age2
0.00
2**
0.00
2**
0.00
2**
0.00
2**
(0.0
01)
(0.0
01)
(0.0
01)
(0.0
01)
age3
0.00
2*0.
001
0.00
2*0.
002*
*(0
.001
)(0
.001
)(0
.001
)(0
.001
)m
ales
-0.0
000.
000
-0.0
00-0
.000
(0.0
00)
(0.0
01)
(0.0
00)
(0.0
00)
fore
igner
s0.
000
-0.0
00-0
.000
-0.0
00(0
.001
)(0
.001
)(0
.001
)(0
.001
)ex
p0.
001*
**0.
001*
**0.
001*
**0.
001*
**(0
.000
)(0
.000
)(0
.000
)(0
.000
)sk
ill1
0.00
3**
0.00
4**
0.00
2***
0.00
2***
(0.0
01)
(0.0
01)
(0.0
01)
(0.0
01)
skill2
0.00
6***
0.00
5***
0.00
5***
0.00
4***
(0.0
01)
(0.0
01)
(0.0
01)
(0.0
01)
man
ager
0.00
10.
001
0.00
10.
001
(0.0
01)
(0.0
01)
(0.0
01)
(0.0
01)
mid
dle
man
ager
-0.0
01*
-0.0
010.
000
0.00
0(0
.000
)(0
.000
)(0
.000
)(0
.000
)te
nure
-0.0
00**
*-0
.000
***
-0.0
00**
-0.0
00**
(0.0
00)
(0.0
00)
(0.0
00)
(0.0
00)
mult
i-0
.000
0.00
0-0
.000
-0.0
00(0
.000
)(0
.000
)(0
.000
)(0
.000
)ge
o spi
llov
er-0
.000
-0.0
00-0
.000
-0.0
00(0
.000
)(0
.000
)(0
.000
)(0
.000
)te
chspi
llov
er-0
.000
***
-0.0
00**
*-0
.000
***
-0.0
00**
*(0
.000
)(0
.000
)(0
.000
)(0
.000
)In
dust
ry/s
ize/
year
dum
mie
sno
yes
yes
yes
no
yes
yes
yes
N10
5799
1007
0410
0696
1006
9610
5799
1007
0410
0696
1006
96pse
udo
R2
0.14
80.
298
0.42
40.
424
0.18
70.
324
0.42
70.
427
Not
es:
The
depe
nden
tva
riab
lein
alle
stim
atio
nsis
the
prob
abili
tyto
have
atle
ast
one
pate
ntap
plic
atio
n.M
argi
nale
ffect
sre
port
ed.
Mod
el1-
Mod
el4:
dive
rsit
yba
sed
onth
eag
greg
ate
spec
ifica
tion
.M
odel
5-M
odel
8:di
vers
ity
base
don
the
deta
iled
spec
ifica
tion
.M
odel
4an
dM
odel
8re
port
resu
lts
from
IVes
tim
atio
n.W
ald
test
son
exog
enei
ty,
p-va
lue
(Mod
el4)
=0.
453;
p-va
lue
(Mod
el8)
=0,
321.
Sign
ifica
nce
leve
ls:
***1
%,
**5%
,*1
0%.
Stan
dard
erro
rscl
uste
red
atth
efir
mle
vel.
ii

Tab
le3:
The
effec
tsof
lab
ordiv
ersi
tyon
firm
pat
ent
applica
tion
s.D
iver
sity
bas
edon
the
aggr
egat
esp
ecifi
cati
on.
Mod
el
(1)
Mod
el
(2)
Mod
el
(3)
Mod
el
(4)
Mod
el
(5)
Mod
el
(6)
Mod
el
(7)
Pois
son
Pois
son
Pois
son
Pois
son
(IV
)N
egb
inN
egb
inN
egb
inIn
dex
Eth
nic
0.38
2***
0.16
4***
0.04
4*0.
043*
0.30
8***
0.10
3***
0.02
7(0
.033
)(0
.033
)(0
.023
)(0
.024
)(0
.017
)(0
.018
)(0
.020
)In
dex
Skil
l1.
792*
**1.
502*
**1.
097*
*1.
701*
*1.
047*
**0.
850*
**0.
977*
*(0
.356
)(0
.364
)(0
.459
)(0
.700
)(0
.210
)(0
.215
)(0
.345
)In
dex
Dem
o11
.184
***
4.28
2**
0.66
15.
010
6.31
5***
2.21
2**
0.50
7(1
.834
)(1
.579
)(1
.435
)(3
.384
)(0
.717
)(0
.789
)(1
.060
)L
og(K
)4.
901*
**4.
792*
**4.
222*
**(0
.601
)(0
.620
)(0
.617
)L
og(L
)0.
837*
*0.
339
0.96
8**
(0.3
40)
(0.4
85)
(0.3
50)
Dis
cou
nte
dst
ock
ofap
pli
cati
ons
-0.0
00-0
.000
-0.0
00(0
.000
)(0
.000
)(0
.000
)L
og(fi
xed
effec
ts)
0.00
30.
005*
0.00
3(0
.002
)(0
.003
)(0
.002
)F
ixed
effec
td
um
my
0.05
3***
0.05
2***
0.05
0***
(0.0
06)
(0.0
06)
(0.0
05)
age1
0.15
40.
452
0.14
0(0
.262
)(0
.327
)(0
.212
)ag
e20.
212
0.19
50.
326*
(0.2
37)
(0.2
35)
(0.1
74)
age3
0.14
40.
051
0.18
4(0
.209
)(0
.226
)(0
.171
)m
ales
0.26
60.
717
0.02
3(0
.524
)(0
.641
)(0
.368
)fo
reig
ner
s0.
032
0.02
90.
017
(0.0
33)
(0.0
33)
(0.0
27)
exp
0.49
6***
0.46
8***
0.46
2***
(0.1
10)
(0.1
08)
(0.0
87)
skil
l12.
079*
*2.
761*
*1.
858*
*(0
.776
)(0
.942
)(0
.594
)sk
ill2
0.16
2***
0.12
2**
0.15
0***
(0.0
30)
(0.0
47)
(0.0
29)
man
ager
0.00
1-0
.007
0.03
7(0
.038
)(0
.039
)(0
.034
)m
idd
lem
anag
er-0
.389
-0.3
09-0
.370
(0.2
67)
(0.2
66)
(0.2
45)
tenu
re-0
.392
-0.4
25-0
.396
**(0
.290
)(0
.286
)(0
.200
)m
ult
i-0
.000
0.02
20.
003
(0.0
17)
(0.0
24)
(0.0
13)
geo s
pillov
er-0
.392
-1.3
40-0
.446
(0.5
80)
(0.9
91)
(0.4
84)
tech
spi
llov
er-0
.027
-0.0
09-0
.039
(0.0
38)
(0.0
40)
(0.0
38)
Ind
ust
ry/s
ize/
year
du
mm
ies
no
yes
yes
yes
no
yes
yes
N10
5799
1057
9910
5791
1057
8710
5799
1057
9910
5791
chi2
192.
411
2434
.350
404.
748
668.
460
6.2
6979
1.2
5106
4.6
Not
es:
The
depe
nden
tva
riab
lein
all
esti
mat
ions
isth
enu
mbe
rof
pate
ntap
plic
a-ti
ons.
Ela
stic
itie
sre
port
ed.
Sign
ifica
nce
leve
ls:
***1
%,*
*5%
,*10
%.
Stan
dard
erro
rscl
uste
red
atth
efir
mle
vel.
Poi
sson
(IV
):st
anda
rder
rors
are
boot
stra
pped
usin
ga
se-
quen
tial
two
step
boot
stra
ppin
gpr
oced
ure
wit
h20
0re
plic
atio
ns.
F-s
tats
onex
clud
edin
stru
men
ts:
i)In
dex
Eth
nic
atco
unty
leve
l:12
99.6
8;ii)
Inde
xsk
illat
coun
tyle
vel:
189.
68;
iii)
Inde
xde
mo
atco
unty
leve
l:22
1.79
.
iii
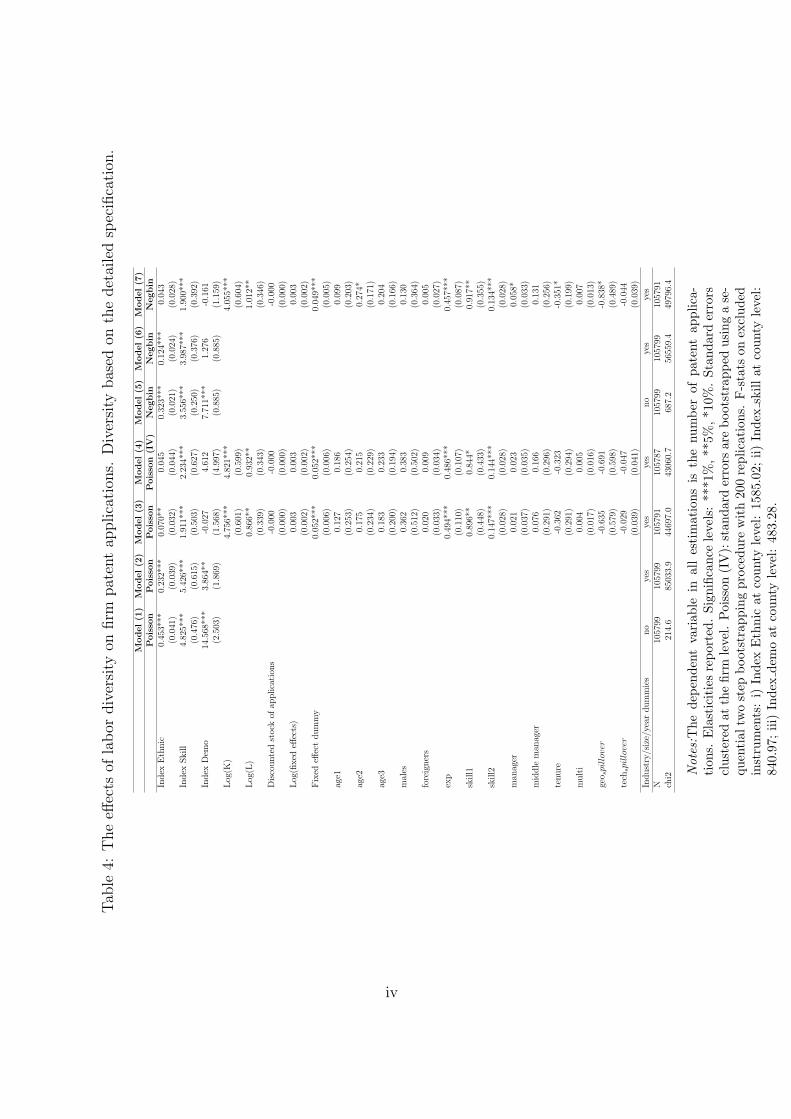
Tab
le4:
The
effec
tsof
lab
ordiv
ersi
tyon
firm
pat
ent
applica
tion
s.D
iver
sity
bas
edon
the
det
aile
dsp
ecifi
cati
on.
Mod
el
(1)
Mod
el
(2)
Mod
el
(3)
Mod
el
(4)
Mod
el
(5)
Mod
el
(6)
Mod
el
(7)
Pois
son
Pois
son
Pois
son
Pois
son
(IV
)N
egb
inN
egb
inN
egb
inIn
dex
Eth
nic
0.45
3***
0.23
2***
0.07
0**
0.04
50.
323*
**0.
124*
**0.
043
(0.0
41)
(0.0
39)
(0.0
32)
(0.0
44)
(0.0
21)
(0.0
24)
(0.0
28)
Ind
exS
kil
l4.
825*
**5.
426*
**1.
911*
**2.
234*
**3.
556*
**3.
987*
**1.
900*
**(0
.476
)(0
.615
)(0
.503
)(0
.627
)(0
.250
)(0
.376
)(0
.392
)In
dex
Dem
o14
.568
***
3.86
4**
-0.0
274.
612
7.71
1***
1.27
6-0
.161
(2.5
03)
(1.8
69)
(1.5
68)
(4.9
97)
(0.8
85)
(0.8
85)
(1.1
59)
Log
(K)
4.75
6***
4.82
1***
4.05
5***
(0.6
01)
(0.5
99)
(0.6
04)
Log
(L)
0.86
6**
0.93
2**
1.01
2**
(0.3
39)
(0.3
43)
(0.3
46)
Dis
cou
nte
dst
ock
ofap
pli
cati
ons
-0.0
00-0
.000
-0.0
00(0
.000
)(0
.000
)(0
.000
)L
og(fi
xed
effec
ts)
0.00
30.
003
0.00
3(0
.002
)(0
.002
)(0
.002
)F
ixed
effec
td
um
my
0.05
2***
0.05
2***
0.04
9***
(0.0
06)
(0.0
06)
(0.0
05)
age1
0.12
70.
186
0.09
9(0
.253
)(0
.254
)(0
.203
)ag
e20.
175
0.21
50.
274*
(0.2
34)
(0.2
29)
(0.1
71)
age3
0.18
30.
233
0.20
4(0
.200
)(0
.194
)(0
.166
)m
ales
0.36
20.
383
0.13
0(0
.512
)(0
.502
)(0
.364
)fo
reig
ner
s0.
020
0.00
90.
005
(0.0
33)
(0.0
34)
(0.0
27)
exp
0.49
4***
0.48
6***
0.45
7***
(0.1
10)
(0.1
07)
(0.0
87)
skil
l10.
896*
*0.
844*
0.91
7**
(0.4
48)
(0.4
33)
(0.3
55)
skil
l20.
147*
**0.
144*
**0.
134*
**(0
.028
)(0
.028
)(0
.028
)m
anag
er0.
021
0.02
30.
058*
(0.0
37)
(0.0
35)
(0.0
33)
mid
dle
man
ager
0.07
60.
166
0.13
1(0
.291
)(0
.296
)(0
.256
)te
nu
re-0
.362
-0.3
23-0
.351
*(0
.291
)(0
.294
)(0
.199
)m
ult
i0.
004
0.00
50.
007
(0.0
17)
(0.0
16)
(0.0
13)
geo s
pillov
er-0
.635
-0.6
91-0
.838
*(0
.579
)(0
.598
)(0
.489
)te
chspi
llov
er-0
.029
-0.0
47-0
.044
(0.0
39)
(0.0
41)
(0.0
39)
Ind
ust
ry/s
ize/
year
du
mm
ies
no
yes
yes
yes
no
yes
yes
N10
5799
1057
9910
5791
1057
8710
5799
1057
9910
5791
chi2
214.
685
033.
944
697.
043
060.
768
7.2
5655
9.4
4979
6.4
Not
es:T
hede
pend
ent
vari
able
inal
les
tim
atio
nsis
the
num
ber
ofpa
tent
appl
ica-
tion
s.E
last
icit
ies
repo
rted
.Si
gnifi
canc
ele
vels
:**
*1%
,**5
%,*
10%
.St
anda
rder
rors
clus
tere
dat
the
firm
leve
l.P
oiss
on(I
V):
stan
dard
erro
rsar
ebo
otst
rapp
edus
ing
ase
-qu
enti
altw
ost
epbo
otst
rapp
ing
proc
edur
ew
ith
200
repl
icat
ions
.F
-sta
tson
excl
uded
inst
rum
ents
:i)
Inde
xE
thni
cat
coun
tyle
vel:
1585
.02;
ii)In
dex
skill
atco
unty
leve
l:84
0.97
;iii
)In
dex
dem
oat
coun
tyle
vel:
483.
28.
iv
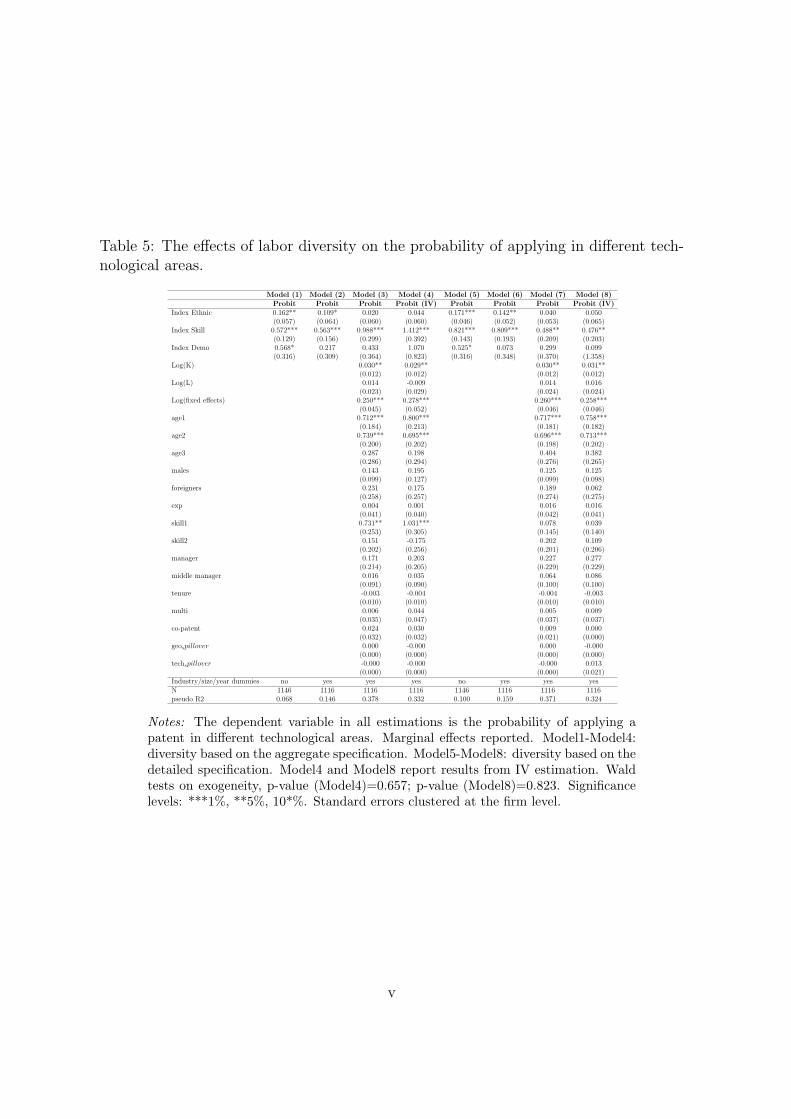
Table 5: The effects of labor diversity on the probability of applying in different tech-nological areas.
Model (1) Model (2) Model (3) Model (4) Model (5) Model (6) Model (7) Model (8)Probit Probit Probit Probit (IV) Probit Probit Probit Probit (IV)
Index Ethnic 0.162** 0.109* 0.020 0.044 0.171*** 0.142** 0.040 0.050(0.057) (0.064) (0.060) (0.060) (0.046) (0.052) (0.053) (0.065)
Index Skill 0.572*** 0.563*** 0.988*** 1.412*** 0.821*** 0.809*** 0.488** 0.476**(0.129) (0.156) (0.299) (0.392) (0.143) (0.193) (0.209) (0.203)
Index Demo 0.568* 0.217 0.433 1.070 0.525* 0.073 0.299 0.099(0.316) (0.309) (0.364) (0.823) (0.316) (0.348) (0.370) (1.358)
Log(K) 0.030** 0.029** 0.030** 0.031**(0.012) (0.012) (0.012) (0.012)
Log(L) 0.014 -0.009 0.014 0.016(0.023) (0.029) (0.024) (0.024)
Log(fixed effects) 0.250*** 0.278*** 0.260*** 0.258***(0.045) (0.052) (0.046) (0.046)
age1 0.712*** 0.800*** 0.717*** 0.758***(0.184) (0.213) (0.181) (0.182)
age2 0.739*** 0.695*** 0.696*** 0.713***(0.200) (0.202) (0.198) (0.202)
age3 0.287 0.198 0.404 0.382(0.286) (0.294) (0.276) (0.265)
males 0.143 0.195 0.125 0.125(0.099) (0.127) (0.099) (0.098)
foreigners 0.231 0.175 0.189 0.062(0.258) (0.257) (0.274) (0.275)
exp 0.004 0.001 0.016 0.016(0.041) (0.040) (0.042) (0.041)
skill1 0.731** 1.031*** 0.078 0.039(0.253) (0.305) (0.145) (0.140)
skill2 0.151 -0.175 0.202 0.109(0.202) (0.256) (0.201) (0.206)
manager 0.171 0.203 0.227 0.277(0.214) (0.205) (0.229) (0.229)
middle manager 0.016 0.035 0.064 0.086(0.091) (0.090) (0.100) (0.100)
tenure -0.003 -0.004 -0.004 -0.003(0.010) (0.010) (0.010) (0.010)
multi 0.006 0.044 0.005 0.009(0.035) (0.047) (0.037) (0.037)
co-patent 0.024 0.030 0.009 0.000(0.032) (0.032) (0.021) (0.000)
geospillover 0.000 -0.000 0.000 -0.000(0.000) (0.000) (0.000) (0.000)
techspillover -0.000 -0.000 -0.000 0.013(0.000) (0.000) (0.000) (0.021)
Industry/size/year dummies no yes yes yes no yes yes yesN 1146 1116 1116 1116 1146 1116 1116 1116pseudo R2 0.068 0.146 0.378 0.332 0.100 0.159 0.371 0.324
Notes: The dependent variable in all estimations is the probability of applying apatent in different technological areas. Marginal effects reported. Model1-Model4:diversity based on the aggregate specification. Model5-Model8: diversity based on thedetailed specification. Model4 and Model8 report results from IV estimation. Waldtests on exogeneity, p-value (Model4)=0.657; p-value (Model8)=0.823. Significancelevels: ***1%, **5%, 10*%. Standard errors clustered at the firm level.
v
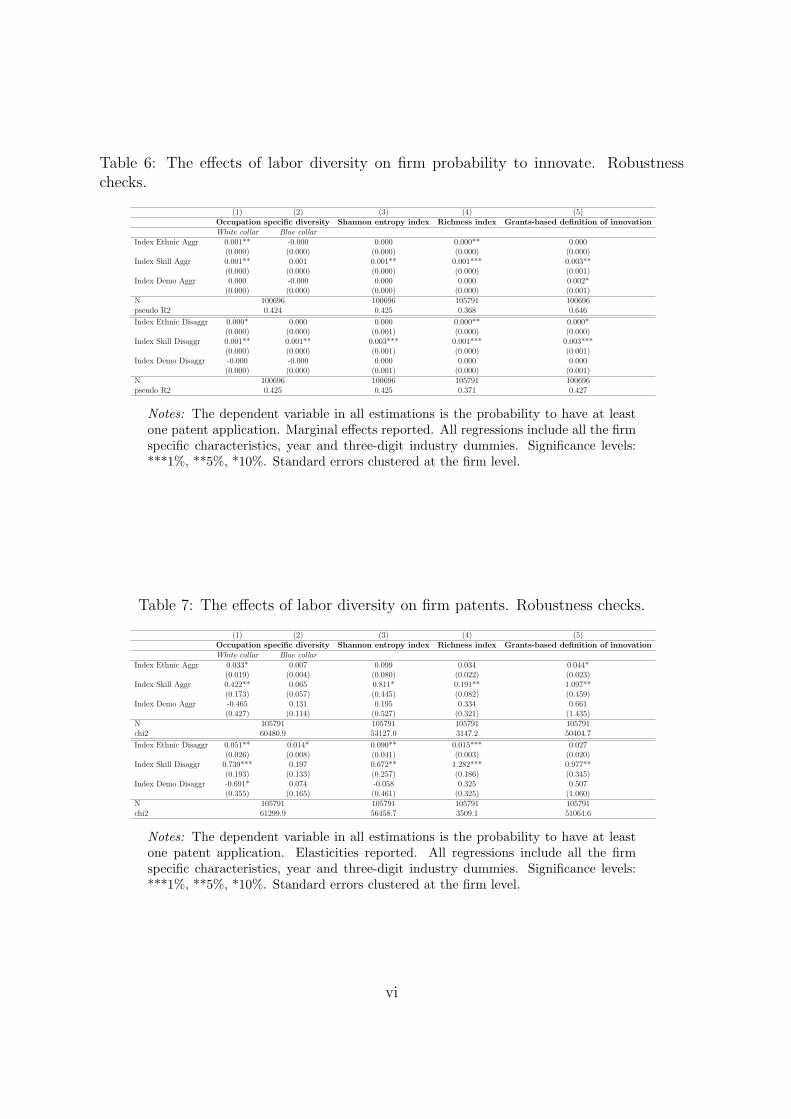
Table 6: The effects of labor diversity on firm probability to innovate. Robustnesschecks.
(1) (2) (3) (4) (5)Occupation specific diversity Shannon entropy index Richness index Grants-based definition of innovationWhite collar Blue collar
Index Ethnic Aggr 0.001** -0.000 0.000 0.000** 0.000(0.000) (0.000) (0.000) (0.000) (0.000)
Index Skill Aggr 0.001** 0.001 0.001** 0.001*** 0.003**(0.000) (0.000) (0.000) (0.000) (0.001)
Index Demo Aggr 0.000 -0.000 0.000 0.000 0.002*(0.000) (0.000) (0.000) (0.000) (0.001)
N 100696 100696 105791 100696pseudo R2 0.424 0.425 0.368 0.646
Index Ethnic Disaggr 0.000* 0.000 0.000 0.000** 0.000*(0.000) (0.000) (0.001) (0.000) (0.000)
Index Skill Disaggr 0.001** 0.001** 0.003*** 0.001*** 0.003***(0.000) (0.000) (0.001) (0.000) (0.001)
Index Demo Disaggr -0.000 -0.000 0.000 0.000 0.000(0.000) (0.000) (0.001) (0.000) (0.001)
N 100696 100696 105791 100696pseudo R2 0.425 0.425 0.371 0.427
Notes: The dependent variable in all estimations is the probability to have at leastone patent application. Marginal effects reported. All regressions include all the firmspecific characteristics, year and three-digit industry dummies. Significance levels:***1%, **5%, *10%. Standard errors clustered at the firm level.
Table 7: The effects of labor diversity on firm patents. Robustness checks.
(1) (2) (3) (4) (5)Occupation specific diversity Shannon entropy index Richness index Grants-based definition of innovationWhite collar Blue collar
Index Ethnic Aggr 0.033* 0.007 0.099 0.034 0.044*(0.019) (0.004) (0.080) (0.022) (0.023)
Index Skill Aggr 0.422** 0.065 0.811* 0.191** 1.097**(0.173) (0.057) (0.445) (0.082) (0.459)
Index Demo Aggr -0.465 0.131 0.195 0.334 0.661(0.427) (0.114) (0.527) (0.321) (1.435)
N 105791 105791 105791 105791chi2 60480.9 53127.0 3147.2 50404.7
Index Ethnic Disaggr 0.051** 0.014* 0.090** 0.015*** 0.027(0.026) (0.008) (0.041) (0.003) (0.020)
Index Skill Disaggr 0.739*** 0.197 0.672** 1.282*** 0.977**(0.193) (0.133) (0.257) (0.186) (0.345)
Index Demo Disaggr -0.691* 0.074 -0.058 0.325 0.507(0.355) (0.165) (0.461) (0.325) (1.060)
N 105791 105791 105791 105791chi2 61299.9 56458.7 3509.1 51064.6
Notes: The dependent variable in all estimations is the probability to have at leastone patent application. Elasticities reported. All regressions include all the firmspecific characteristics, year and three-digit industry dummies. Significance levels:***1%, **5%, *10%. Standard errors clustered at the firm level.
vi

Figure 1: Commuting areas,1995, Denmark.
vii