Embed Size (px)
DESCRIPTION
A joint publication with the latest research findings of six public research organisations in Denmark, Finland, Iceland, Norway and Sweden.
Citation preview
No 3 • 2004 News from Denmark, Finland, Iceland, Norway and Sweden
N R & T R
Traffic InformationCentre – page 22
2 NORDIC ROAD & TRANSPORT RESEARCH NO. 3 2004
Volume 16 • No. 3 • December 2004
Editorial notesNordic Road & Transport Research is ajoint publication of six public road andtransport research organisations in theNordic countries, Denmark, Finland,Iceland, Norway, and Sweden. Themain objective of the publication is todisseminate research results and newsfrom the institutions, especially toresearchers and decision makers. Eachinstitution is responsible for the selec-tion and presentation of the materialfrom its own scope of activities.
Nordic Road & Transport Research ispublished three times a year. It is regu-larly sent out, free of charge, to recipi-ents selected by the six joint publis-hers. Free sample copies are also sentout on special request.
Reproduction and quotation of thetexts are allowed if reference is madeto the author and source. However,legislation regulates and restricts theright to reproduce the illustrations.Please contact the respective publis-hing institution for information.
Advertising is not accepted.Correspondence about the contents
of the publication:Please write to the author or to the
respective publishing organisation.Requests for back issues, and notifi-
cation of address changes:Readers outside the Nordic coun-
tries: please write to the Editor-in-chief at the VTI in Sweden.
Readers in the Nordic countries:please contact the publishing institu-tion of your country.
Addresses: see back cover.
The Editorial Board consists of the following representatives of the publishing institutions
Editor-in-ChiefTarja Magnusson, Swedish NationalRoad and Transport Research Institute
DenmarkHelen Hasz-Singh, Danish Road Institute
FinlandKari Mäkelä, Technical Research Centreof Finland, Building and Transport
IcelandHreinn Haraldsson, Public RoadsAdministration
NorwayThorbjørn Chr. Risan, Norwegian Public Roads Administration
Harald Aas, Institute of TransportEconomics
Production: Johnny Dahlgren GrafiskProduktion ABPlace of publication: Linköping, SwedenIssue: 3,500ISSN 1101-5179
Cover photo: Traffic Information Centre at the DanishRoad Directorate.
Danish Road Directorate (DRD)Danish Road Institute (DRI)The Road Directorate, which is a part of The Ministry ofTransport, Denmark, is responsible for development andmanagement of the national highways and for servicing andfacilitating traffic on the network. As part of this responsibility,the Directorate conducts R&D, the aim of which is to contri-bute to efficient road management and to the safe use of thenetwork. The materials research component is carried out bythe Danish Road Institute.
Technical Research Centre of Finland(VTT), Building and TransportVTT Building and Transport, employing a staff of 450, is oneof the eight research units of the Technical Research Centre ofFinland (VTT), with a total staff of 3,000. VTT Building andTransport covers all fields of transport and road engineering.The unit is active in international research and has a prominentrole on the national level.
Public Roads Administration (PRA),IcelandThe duty of PRA is to provide society with a road system according to its needs and to offer service aiming at safe, unobstructed traffic. The number of employees is about 340. Applied research concerning road construction, maintenanceand traffic and safety is to some extent performed or directedby the PRA. The authority with its Research and Developmentdivision is responsible for road research in Iceland.
Norwegian Public Roads Administration (NPRA)The Norwegian Public Roads Administration is one of the administrative agencies under the Ministry of Transport andCommunications in Norway. The NPRA is responsible for thedevelopment and management of public roads and road traffic, as well as the Vehicle Department. This responsibility includes research and development of all areas related to roadtransport, and the application of R&D products.
Institute of Transport Economics (TØI),NorwayThe Institute of Transport Economics is the national institu-tion for transport research and development in Norway. Themain objectives of the Institute are to carry out applied researchand promote the application and use of results through con-sultative assistance to public authorities, the transport industryand others. The Institute is an independent research foundationemploying about one hundred persons.
The Swedish National Road and Transport Research Institute (VTI)carries out research and development work of an internationallyhigh standard for the transport sector. Our work embraces allmodes of transport. Our key expertise is in the fields of safety,economy, environment, traffic and transport analysis, behaviourand the human-vehicle-transport system interaction, as well asin road design and infrastructure maintenance. VTI is a worldleader in several areas. The Institute is state-owned and has atotal of 180 employees.
N R & T R
3NORDIC ROAD & TRANSPORT RESEARCH NO. 3 2004
CONTENTS
Technical Research Centre of Finland (VTT), Building and Transport
Potential Harmonisation of Variable Message Signs in VikingCountries . . . . . . . . . . . . . . . . . . . . . . . . . . . . . . . . . . . . . . . . .4
Institute of Transport Economics (TØI)
Aggressive Drivers Increase the Accicent Risk . . . . . . . . . . . .6Road Investments in Oslo Did Not Induce New Traffic . . . . .8Increased Penalties Make People Use the Seat Belt . . . . . . .9
Swedish Road and Transport Research Institute (VTI)
With Tiny, Tiny Particles in View . . . . . . . . . . . . . . . . . . . . . .10VTI-algorithm Structuring the Austrian Road Network . . .12Designing and Testing a School Transportation Bus Stop . .14Driving when Tired – from the Drivers’ Point of View . . . .15
Norwegian Public Roads Administration (NPRA)
Sand, Salt and Hot Water in Winter Road Maintenance . .16Toll Financing – How to Reduce the Operating Costs? . . . .19
Danish Road Directorate (DRD)
The Traffic Information Centre Seen in an International Perspective . . . . . . . . . . . . . . . . . . . . . . . . . . . . . . . . . . . . . . .22Recycling in Roads Has Been Upgraded . . . . . . . . . . . . . . . . . . . . .24Noise from Road Humps . . . . . . . . . . . . . . . . . . . . . . . . . . . .26
Annotated reports . . . . . . . . . . . . . . . . . . . . . . . . . . . . . . . . .28
4
TECHNICAL RESEARCH CENTRE OF FINLAND (VTT), BUILDING AND TRANSPORT
NORDIC ROAD & TRANSPORT RESEARCH NO. 3 2004
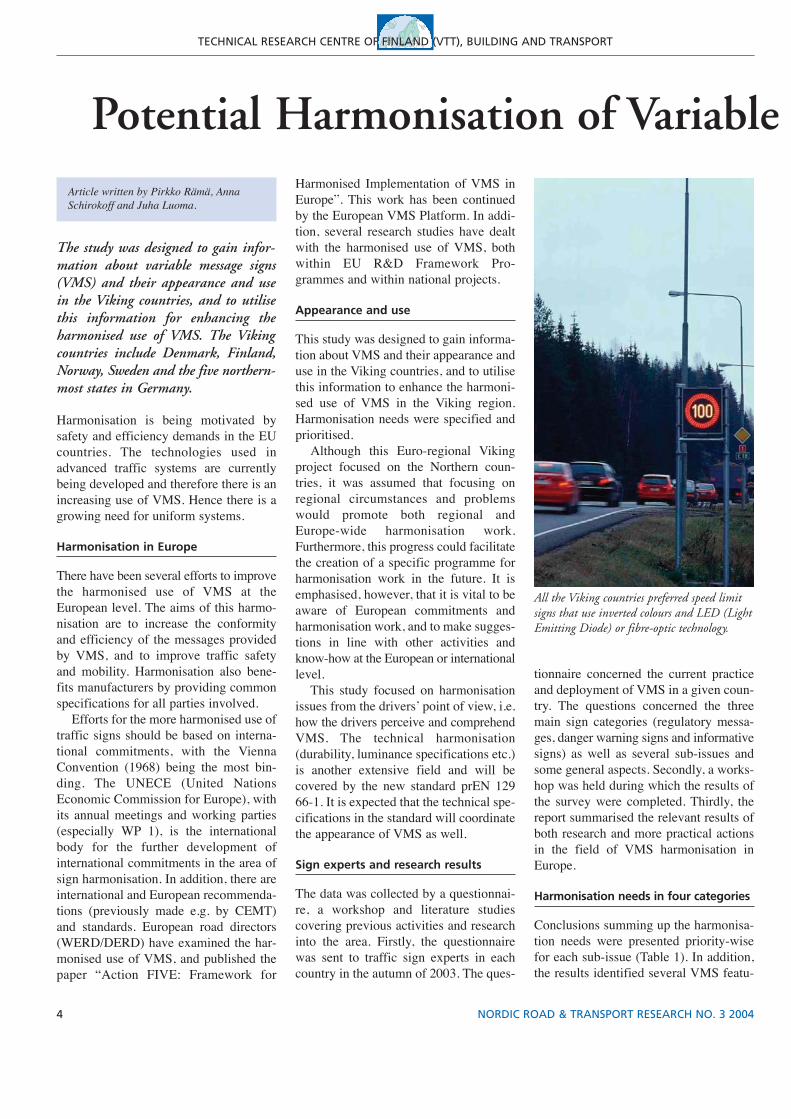
The study was designed to gain infor-mation about variable message signs(VMS) and their appearance and usein the Viking countries, and to utilisethis information for enhancing theharmonised use of VMS. The Vikingcountries include Denmark, Finland,Norway, Sweden and the five northern-most states in Germany.
Harmonisation is being motivated bysafety and efficiency demands in the EUcountries. The technologies used inadvanced traffic systems are currentlybeing developed and therefore there is anincreasing use of VMS. Hence there is agrowing need for uniform systems.
Harmonisation in Europe
There have been several efforts to improvethe harmonised use of VMS at theEuropean level. The aims of this harmo-nisation are to increase the conformityand efficiency of the messages providedby VMS, and to improve traffic safetyand mobility. Harmonisation also bene-fits manufacturers by providing commonspecifications for all parties involved.
Efforts for the more harmonised use oftraffic signs should be based on interna-tional commitments, with the ViennaConvention (1968) being the most bin-ding. The UNECE (United NationsEconomic Commission for Europe), withits annual meetings and working parties(especially WP 1), is the internationalbody for the further development ofinternational commitments in the area ofsign harmonisation. In addition, there areinternational and European recommenda-tions (previously made e.g. by CEMT)and standards. European road directors(WERD/DERD) have examined the har-monised use of VMS, and published thepaper “Action FIVE: Framework for
Potential Harmonisation of Variable Article written by Pirkko Rämä, AnnaSchirokoff and Juha Luoma.
Harmonised Implementation of VMS inEurope”. This work has been continuedby the European VMS Platform. In addi-tion, several research studies have dealtwith the harmonised use of VMS, bothwithin EU R&D Framework Pro-grammes and within national projects.
Appearance and use
This study was designed to gain informa-tion about VMS and their appearance anduse in the Viking countries, and to utilisethis information to enhance the harmoni-sed use of VMS in the Viking region.Harmonisation needs were specified andprioritised.
Although this Euro-regional Vikingproject focused on the Northern coun-tries, it was assumed that focusing onregional circumstances and problemswould promote both regional andEurope-wide harmonisation work.Furthermore, this progress could facilitatethe creation of a specific programme forharmonisation work in the future. It isemphasised, however, that it is vital to beaware of European commitments andharmonisation work, and to make sugges-tions in line with other activities andknow-how at the European or internationallevel.
This study focused on harmonisationissues from the drivers’ point of view, i.e.how the drivers perceive and comprehendVMS. The technical harmonisation(durability, luminance specifications etc.)is another extensive field and will becovered by the new standard prEN 12966-1. It is expected that the technical spe-cifications in the standard will coordinatethe appearance of VMS as well.
Sign experts and research results
The data was collected by a questionnai-re, a workshop and literature studiescovering previous activities and researchinto the area. Firstly, the questionnairewas sent to traffic sign experts in eachcountry in the autumn of 2003. The ques-
tionnaire concerned the current practiceand deployment of VMS in a given coun-try. The questions concerned the threemain sign categories (regulatory messa-ges, danger warning signs and informativesigns) as well as several sub-issues andsome general aspects. Secondly, a works-hop was held during which the results ofthe survey were completed. Thirdly, thereport summarised the relevant results ofboth research and more practical actionsin the field of VMS harmonisation inEurope.
Harmonisation needs in four categories
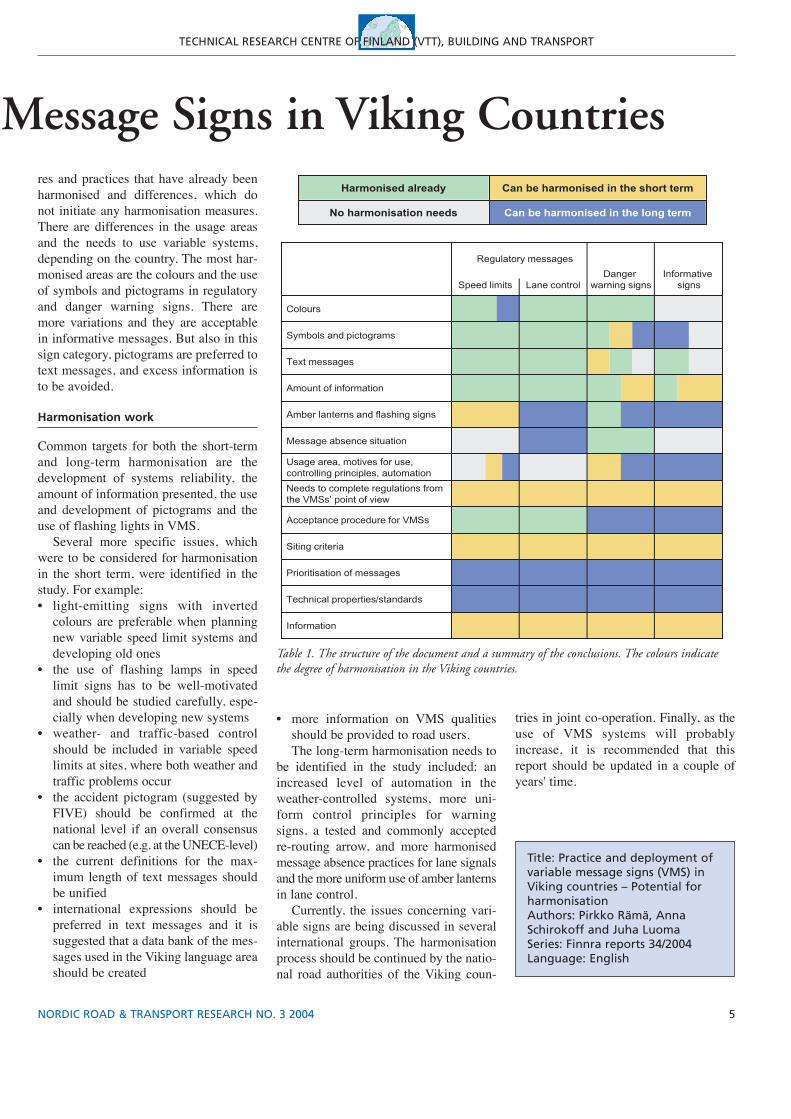
Conclusions summing up the harmonisa-tion needs were presented priority-wisefor each sub-issue (Table 1). In addition,the results identified several VMS featu-
All the Viking countries preferred speed limitsigns that use inverted colours and LED (LightEmitting Diode) or fibre-optic technology.
5NORDIC ROAD & TRANSPORT RESEARCH NO. 3 2004
TECHNICAL RESEARCH CENTRE OF FINLAND (VTT), BUILDING AND TRANSPORT
Message Signs in Viking Countriesres and practices that have already beenharmonised and differences, which donot initiate any harmonisation measures.There are differences in the usage areasand the needs to use variable systems,depending on the country. The most har-monised areas are the colours and the useof symbols and pictograms in regulatoryand danger warning signs. There aremore variations and they are acceptablein informative messages. But also in thissign category, pictograms are preferred totext messages, and excess information isto be avoided.
Harmonisation work
Common targets for both the short-termand long-term harmonisation are thedevelopment of systems reliability, theamount of information presented, the useand development of pictograms and theuse of flashing lights in VMS.
Several more specific issues, whichwere to be considered for harmonisationin the short term, were identified in thestudy. For example:• light-emitting signs with inverted
colours are preferable when planningnew variable speed limit systems anddeveloping old ones
• the use of flashing lamps in speedlimit signs has to be well-motivatedand should be studied carefully, espe-cially when developing new systems
• weather- and traffic-based controlshould be included in variable speedlimits at sites, where both weather andtraffic problems occur
• the accident pictogram (suggested byFIVE) should be confirmed at thenational level if an overall consensuscan be reached (e.g. at the UNECE-level)
• the current definitions for the max-imum length of text messages shouldbe unified
• international expressions should bepreferred in text messages and it issuggested that a data bank of the mes-sages used in the Viking language areashould be created
• more information on VMS qualitiesshould be provided to road users. The long-term harmonisation needs to
be identified in the study included: anincreased level of automation in theweather-controlled systems, more uni-form control principles for warningsigns, a tested and commonly acceptedre-routing arrow, and more harmonisedmessage absence practices for lane signalsand the more uniform use of amber lanternsin lane control.
Currently, the issues concerning vari-able signs are being discussed in severalinternational groups. The harmonisationprocess should be continued by the natio-nal road authorities of the Viking coun-
Title: Practice and deployment ofvariable message signs (VMS) inViking countries – Potential forharmonisationAuthors: Pirkko Rämä, AnnaSchirokoff and Juha LuomaSeries: Finnra reports 34/2004Language: English
tries in joint co-operation. Finally, as theuse of VMS systems will probablyincrease, it is recommended that thisreport should be updated in a couple ofyears' time.
Table 1. The structure of the document and a summary of the conclusions. The colours indicatethe degree of harmonisation in the Viking countries.
6 NORDIC ROAD & TRANSPORT RESEARCH NO. 3 2004
Author: Pål Ulleberg.
Several studies indicate that aggressiveor reckless driving may increase the riskof traffic accidents. The most domi-nant ones are excessive speeding, tail-gating, failure to yield the right of wayfor other road users and red-light run-ning. At the same time, explicit aggres-sive acts like rude gesturing, flashingheadlights, sustained horn-honkingand yelling do not seem to increase theaccident risk, according to a literaturereview carried out by the Institute ofTransport Economics.
Aggressive Drivers Increase theAccident Risk
Aggression in traffic, aggressive driverbehaviour and its association with roadaccidents has definitely been put on theagenda in the recent years. One of themajor problems concerning aggressivedriving behaviour, and the possible asso-ciation with accidents in traffic, is to defi-ne in a clear way what ‘aggressive dri-ving behaviour’ actually is. This difficul-ty may be a reflection of the variation indefinitions of aggression proposed byexperts in this field.
Literature review
A review of the literature suggests thatthree main types of definitions exist. Thefirst defines aggressive driving as direct
physical assaults on other road users. Thesecond focuses on any form of drivingbehaviour with the intention to injure,harm or frighten other road users physi-cally or psychologically. The last defini-tion puts emphasis on deliberate and wil-ful driving behaviour that while notintended to harm/frighten other roadusers shows disregard for their safety andwellbeing.
The literature review concludes thatthe last definition is the most functionalone. This means, however, that aggressi-ve driving behaviour will include actsthat commonly are referred to as “reck-less driving” or even “active driving”(e.g. failure to give right of way, tail-gating). A recommendation is therefore to
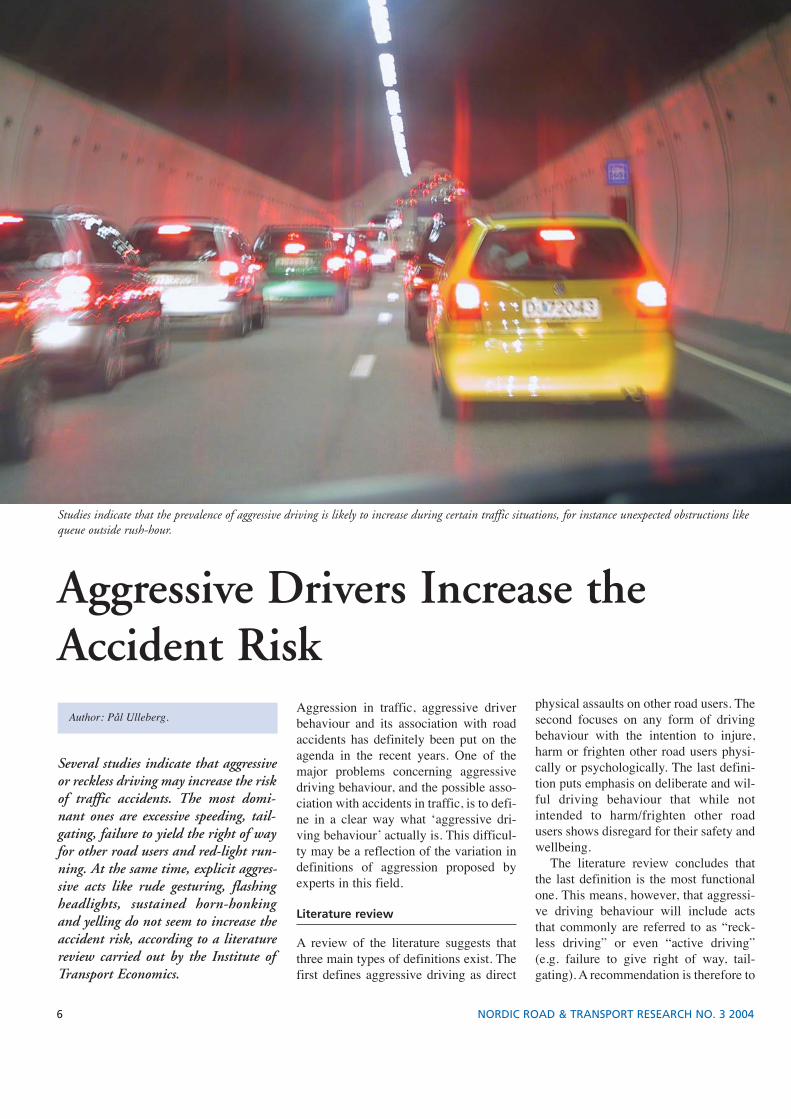
Studies indicate that the prevalence of aggressive driving is likely to increase during certain traffic situations, for instance unexpected obstructions likequeue outside rush-hour.
7NORDIC ROAD & TRANSPORT RESEARCH NO. 3 2004
INSTITUTE OF TRANSPORT ECONOMICS (TØI)
use the term “reckless driving” instead of“aggressive driving” if this definition isapplied. This will make it easier to achie-ve a common understanding of which typesof driver behaviour that are referred to.
Several studies indicate that drivingbehaviour that is labelled as aggressive orreckless may increase the risk of trafficaccidents. The most dominant ones areexcessive speeding, tailgating, failure toyield the right of way for other road usersand red-light running. At the same time,explicit aggressive acts like rude gestu-ring, flashing headlights, sustained horn-honking and yelling do not seem toincrease the accident risk. However, dri-vers who behave in such ways are alsomore likely to conduct other types ofaggressive driving behaviour that increa-ses the risk of accidents.
Frustrations generate aggressivebehaviour
Studies indicate that the prevalence ofaggressive driving is likely to increaseduring certain traffic situations. The mostcommon ones are situations where dri-vers’ progress in traffic is slowed downdue to unexpected obstructions (e.g.queue outside rush-hour) or unexpectedbehaviour of other road users (e.g. slowdriving when it is difficult to overtake).At the same time, certain characteristicsof the driver seem to increase the likeli-hood of aggressive driving under suchcircumstances. Low frustration tolerance,low empathy, mild social deviance and aneed for seeking excitement are of parti-cular relevance in this context.
No gender differences
There seems to be no gender differenceof importance pertaining to how muchirritation and anger drivers experience onthe road. However, male drivers reportmore aggressive acts in traffic than fema-le drivers. This suggests that the irritationand frustration experienced during drivingare more likely to result in aggressive dri-ving among male drivers. The propensityto commit aggressive acts in traffic seemsto be highest among young drivers, espe-cially young males.
Some studies suggest that characteris-tics of the vehicle may contribute toaggressive driving. The results indicate
Title: Aggressive driving – a literature review.Author: Pål Ulleberg ([email protected])Series: TØI report 709/2004Language: Norwegian
that new cars are driven more aggressive-ly compared to older ones, especiallynew cars with high engine power, fastacceleration ability and a “sporty” image.It cannot, however, be ruled out that thisresult is due to that drivers who anywaywould have driven aggressively chooseto drive such cars. It is thus uncertainwhether it is the car or the driver or acombination of both that contribute toaggressive driving.
Different measures
Measures to reduce aggressive drivinghave primarily been carried out in theUS. Such measures usually includeincreased police surveillance concerningaggressive driving acts such as tailgating,dangerous overtaking, excessive speedingand red-light running. The use of unmarkedpolice cars seems to be a popular strategy.The measures are often combined withincreased media attention concerning thepolice efforts to target aggressive drivers.Other measures include the use of “greennumbers”, where road users can dial inthe licence number of the driver commit-ting aggressive acts in traffic. There areno formal evaluations of these measuresaimed at reducing aggressive driving, butevaluations conducted by the policethemselves indicate that such measuresmay reduce the prevalence of aggressivedriving, as well as the number of seriousand fatal accidents.
Another measure applied is anger-management courses for aggressive dri-vers. Studies show that such courses maybe beneficial in order to decrease the irri-tation experienced when driving, as wellas the frequency of aggressive acts intraffic. The effects are, however, measu-red at a relatively short time after thecompletion of the course, meaning thatthe long-term effect of anger-manage-ment courses is uncertain.
HappyNew Year 2005
PHO
TO-S
ERVI
CE

8 NORDIC ROAD & TRANSPORT RESEARCH NO. 3 2004
INSTITUTE OF TRANSPORT ECONOMICS (TØI)
Road Investments in Oslo Did NotInduce New TrafficMajor road and transit infrastructureinvestments in the Oslo region inNorway have been partly financed by atoll ring established in 1990. Thereare no indications that the road invest-ments themselves have induced newtraffic in general in the region. Trafficgrowth has occurred on major roads,while local roads have experiencedunchanged traffic volumes.
The Government has covered 45 per centof the investments in the period1990–2001 as planned. However, the lasttwo years the Government share has beendecreasing. A fully connected metro sys-tem and road lanes reserved for buseshave been important and effective mea-sures for public transport.
During the period 1990–2002 trafficgrowth has been slightly lower than the
national average, in spite of stronggrowth in factors like population, em-ployment and income. Thus, it is hard toclaim that major road investments haveinduced new traffic in general in theregion. Traffic growth has occurred onmajor roads, while local roads have expe-rienced unchanged traffic volumes. Thisis in line with the aims of the investmentpackage. The toll ring itself led only to asmall reduction in car travel crossing thecordon toll (3–5 %).
In the period there is a slight reductionin travel times during morning rushhours, but no significant change in theafternoon. Increased road capacity hasthus counter-balanced the growth in traf-fic with a small positive margin. Mainimprovements have occurred along theouter ring road (Ring 3). Delays vary bycorridor, western and southern corridorbeing the worst. Road sections 10–15 km
from the city centre have the largestdelays. Freighters regard road accessibili-ty to be improved.
Air pollution levels do not seem to benegatively affected by road investments.Noise nuisance is reduced where newroads are built as tunnels. Measures toimprove the local environment, like traf-fic management, reinforce environmentaleffects. Traffic accident risks are reduced,but to a smaller extent than on nationallevel. However, Oslo experienced a lar-ger reduction in persons killed and seve-re injuries due to traffic accidents thanthe national average.
The population was rather negative tothe toll ring before it opened, but theopposition is reduced over the years. Twothirds of the population are in favour of anew toll ring where a substantial part ofgenerated income is dedicated to publictransport. Car travellers passing the tollring are fairly representative for thepopulation as a whole, but have slightlyhigher income.
The toll ring has succeeded in puttingforward extra effort in infrastructureinvestments in the Oslo region. Theinvestment plans were not fully develo-ped at the time of decision, giving needfor revision and a certain room for flexi-bility on the way. In the future, if the tollring is continued, subsidies to publictransport should also be included in thescheme. Parking and land use policiesand possibilities given by a time differen-tiated toll should also be evaluated. Lessa priori guidance on the use of meansshould be given. Measures should bechosen according to their cost effective-ness and achievement of specified goals.
Title: Evaluation of Trunk RoadInvestments in OsloAuthor: Jon Inge Lian ([email protected])Series: TØI report 714/2004Language: NorwegianIncreased road capacity in Oslo in the period 1990–2001, partly financed by the toll ring, has
counterbalanced the growth in traffic with a small positive margin.
9NORDIC ROAD & TRANSPORT RESEARCH NO. 3 2004
INSTITUTE OF TRANSPORT ECONOMICS (TØI)
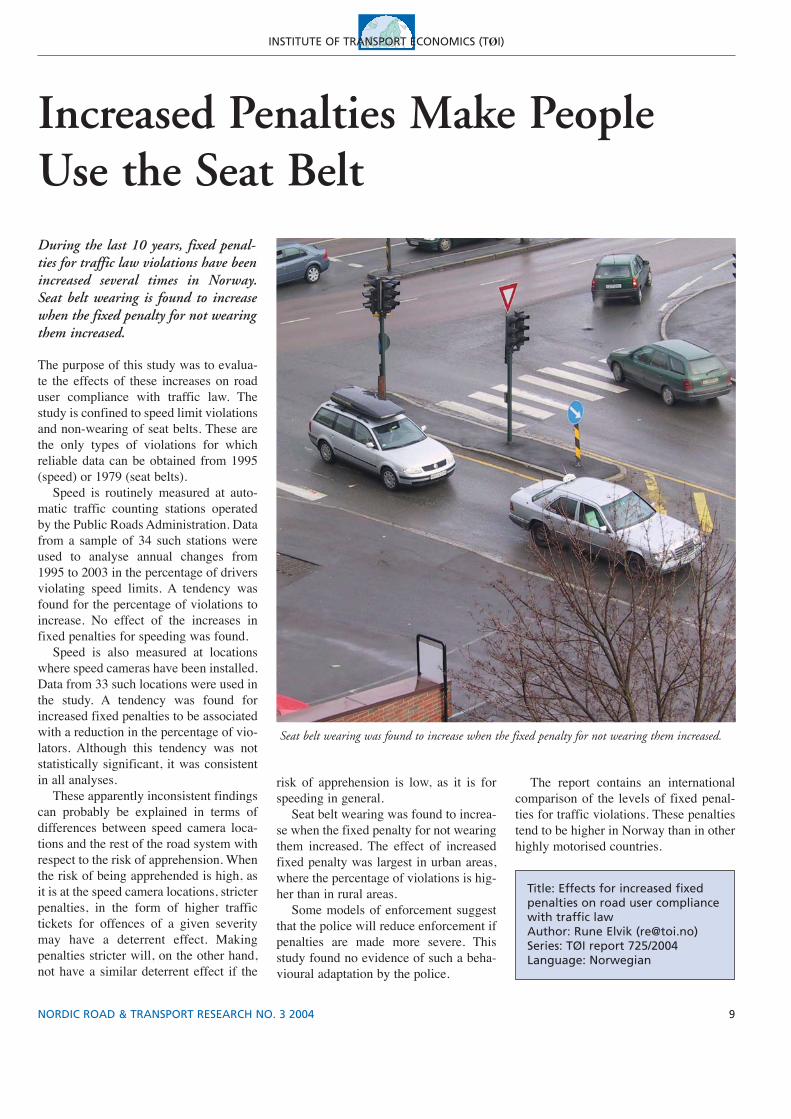
During the last 10 years, fixed penal-ties for traffic law violations have beenincreased several times in Norway.Seat belt wearing is found to increasewhen the fixed penalty for not wearingthem increased.
The purpose of this study was to evalua-te the effects of these increases on roaduser compliance with traffic law. Thestudy is confined to speed limit violationsand non-wearing of seat belts. These arethe only types of violations for whichreliable data can be obtained from 1995(speed) or 1979 (seat belts).
Speed is routinely measured at auto-matic traffic counting stations operatedby the Public Roads Administration. Datafrom a sample of 34 such stations wereused to analyse annual changes from1995 to 2003 in the percentage of driversviolating speed limits. A tendency wasfound for the percentage of violations toincrease. No effect of the increases infixed penalties for speeding was found.
Speed is also measured at locationswhere speed cameras have been installed.Data from 33 such locations were used inthe study. A tendency was found forincreased fixed penalties to be associatedwith a reduction in the percentage of vio-lators. Although this tendency was notstatistically significant, it was consistentin all analyses.
These apparently inconsistent findingscan probably be explained in terms ofdifferences between speed camera loca-tions and the rest of the road system withrespect to the risk of apprehension. Whenthe risk of being apprehended is high, asit is at the speed camera locations, stricterpenalties, in the form of higher traffictickets for offences of a given severitymay have a deterrent effect. Makingpenalties stricter will, on the other hand,not have a similar deterrent effect if the
Title: Effects for increased fixedpenalties on road user compliancewith traffic lawAuthor: Rune Elvik ([email protected])Series: TØI report 725/2004Language: Norwegian
Increased Penalties Make PeopleUse the Seat Belt
risk of apprehension is low, as it is forspeeding in general.
Seat belt wearing was found to increa-se when the fixed penalty for not wearingthem increased. The effect of increasedfixed penalty was largest in urban areas,where the percentage of violations is hig-her than in rural areas.
Some models of enforcement suggestthat the police will reduce enforcement ifpenalties are made more severe. Thisstudy found no evidence of such a beha-vioural adaptation by the police.
The report contains an internationalcomparison of the levels of fixed penal-ties for traffic violations. These penaltiestend to be higher in Norway than in otherhighly motorised countries.
Seat belt wearing was found to increase when the fixed penalty for not wearing them increased.
10
SWEDISH NATIONAL ROAD AND TRANSPORT RESEARCH INSTITUTE (VTI)
NORDIC ROAD & TRANSPORT RESEARCH NO. 3 2004
The potentially major consequences ofcertain particles on human health arekeeping researcher Mats Gustafsson atVTI very busy.
Mats Gustafsson is hunting for par-ticles of less than 10 micrometers insize, namely particles that are invisibleto the naked eye. In air quality circlesthese particles are called PM10 or inha-lable particles.
VTI has a great interest in particle researchbecause road traffic accounts for approx-imately 20 per cent – in some places sig-nificantly more – of particle emissions inSweden. The particle emissions occurpartly as a result of vehicle exhausts, butparticles from wear of road pavements,tyres, brakes and through road serviceand maintenance i.e. salting and sanding,are very important for PM10.
– It is quite natural that VTI is invol-ved because we have broad competenceand partly unique resources in theseareas. We also have a well establishedcollaboration with particle researchers atthe universities of Lund, Linköping andStockholm, among others. VTI also hasthe technical equipment which helps usto generate and study wear particles andwe are actively investing in improvingour measurement resources, states MatsGustafsson.
– VTI possess a wide range of com-petence in the fields of composition andproperties of road paving materials, win-ter and summer road service and themaintenance of paving materials. We andour collaborators also have extensiveknowledge regarding the environmentaland health aspects related to the area.
– VTI definitely has the capacity to offerqualified action-orientated research, inven-tory and advice, says Mats Gustafsson.
With Tiny, Tiny
Stricter requirements from 2005
The link with negative effects on humanhealth has meant that an environmentalquality standard for PM10 will come intoforce 2005. The standard will be reinfor-ced with limits for even smaller particles– PM2,5. This requires municipalities androad service companies to investigatepartly whether the limit is being exceededand partly how the problem can be dealtwith. The regulations about the environ-mental quality standard were introducedat the same time as the environment codewhich came into effect in 1999. In otherwords, environmental quality standardsare a new control mechanism in Swedishenvironmental law.
Particles and people’s health
Particles from road traffic can consist ofsoot and other combustion wastes fromvehicle exhausts, rubber particles fromtyre wear, and stone particles from theroad surfaces etc. The effect of the partic-les on our health has proven to be depen-
dent to some extent on the size of the par-ticles. The link however is complicatedand the chemical composition, surfacechemistry, shape and surface structurepossibly all have some role to play.Particles with a diameter of more than 10micrometers get caught in the nose, mouthand throat and it is suspected that theymainly act as irritants causing coughingfor example. Larger particles such as pollenhowever can trigger off and cause allergicreactions. Particles less than 10 micrometerscan, depending on their size, fasten in therespiratory passages, causing respiratoryillnesses in various parts of the breathingsystem. Particles of less than 2.5 micro-meters can get as far as the lung alveoli.The major effects on our health arethought to be caused by particles of lessthan 2.5 micrometers although coarserparticles have also been related to negativehealth effects.
VTI’s research in the field of particles
– We are researching into the physical andchemical properties of road dust particles
Article written by Michael Höglund, VTI.For more information [email protected].
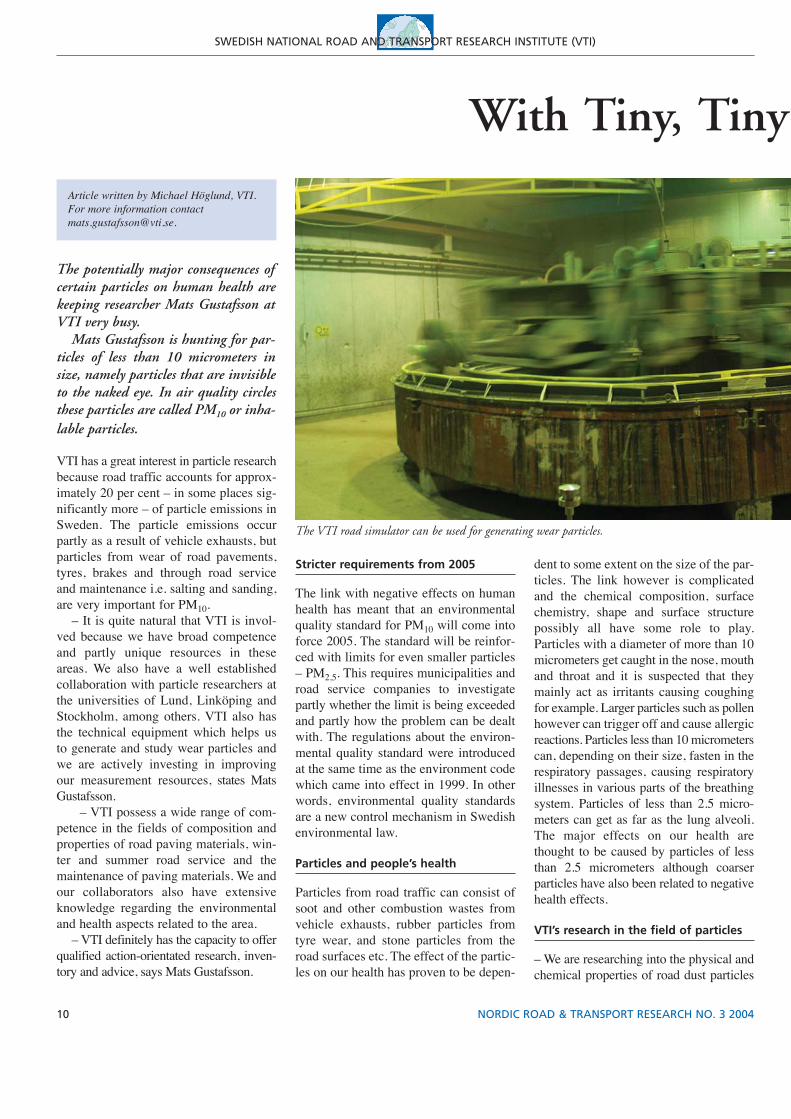
The VTI road simulator can be used for generating wear particles.
11NORDIC ROAD & TRANSPORT RESEARCH NO. 3 2004
SWEDISH NATIONAL ROAD AND TRANSPORT RESEARCH INSTITUTE (VTI)
Particles in View
as well as into how toxic they are onhuman cells. Basically at the moment, wedon’t know for sure which properties ofthe particles can affect human beings andthat is what we are trying to find out.
A lot of research is going on in thisfield, both in Sweden and abroad. Onecurrent project is about the dust causedby studded winter tyres and wintersanding on the road surface, which iswhy many road and street environmentsin towns and cities do not come up to theenvironmental goals set for particles thatcan be inhaled in the local air. Wear materialfrom paving materials is also a significantsource of sediment pollution in surfacewaters near major roads. At the momentit is not clear how and to what extent thedifferent measures taken in road building,service and maintenance can reduce theproblems, which is why efforts are neededto clarify all this.
What has been done so far?
VTI has made several investigations intothe area of road dust.
– During 2003, we acted as consul-tants for the County AdministrationBoard in Stockholm working on an actionprogramme for Stockholm’s problemwith high concentrations of particlesthat can be inhaled (PM10), says MatsGustafsson.
The proposal regarded as the mosteffective was the one to reduce the use ofstudded winter tyres because a very largeamount of PM10 consists of wear particlesfrom the road surface caused by studdedtyres. There were several other proposalsfocussing solely on road dust in theaction programme, such as, binding thedust during periods of extremely highdust concentrations, improvements inroad surface materials, and improvedroad cleaning.
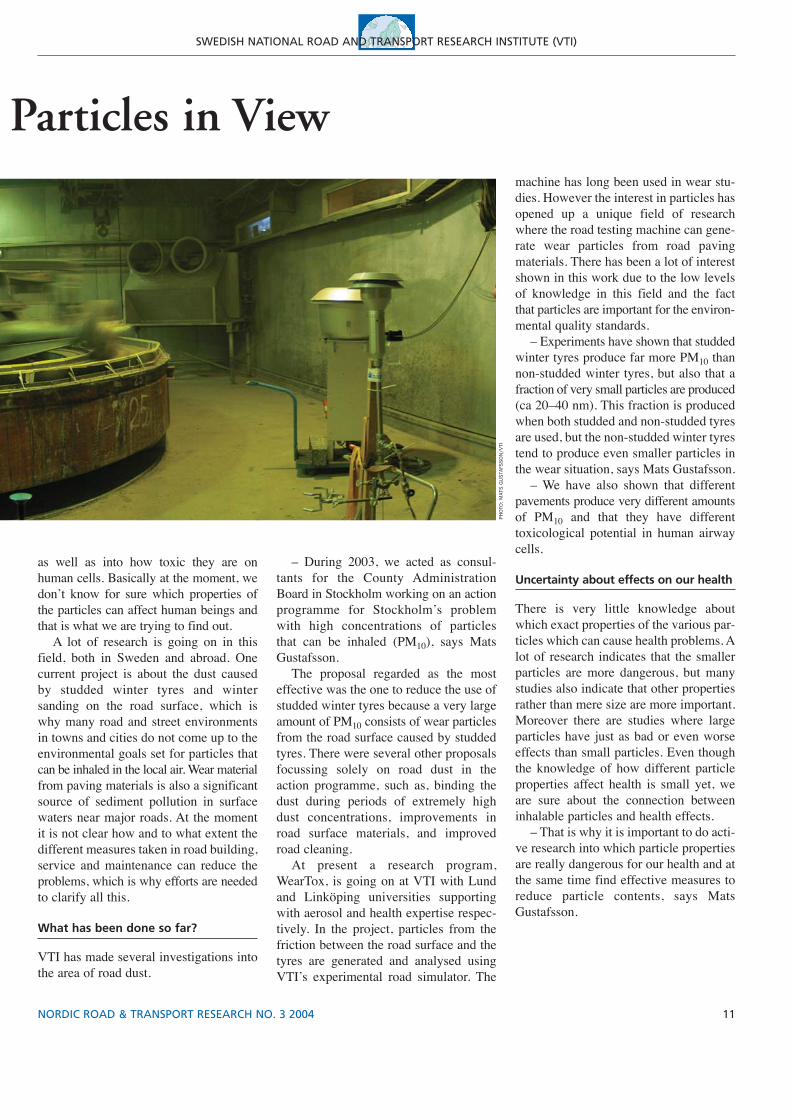
At present a research program,WearTox, is going on at VTI with Lundand Linköping universities supportingwith aerosol and health expertise respec-tively. In the project, particles from thefriction between the road surface and thetyres are generated and analysed usingVTI’s experimental road simulator. The
machine has long been used in wear stu-dies. However the interest in particles hasopened up a unique field of researchwhere the road testing machine can gene-rate wear particles from road pavingmaterials. There has been a lot of interestshown in this work due to the low levelsof knowledge in this field and the factthat particles are important for the environ-mental quality standards.
– Experiments have shown that studdedwinter tyres produce far more PM10 thannon-studded winter tyres, but also that afraction of very small particles are produced(ca 20–40 nm). This fraction is producedwhen both studded and non-studded tyresare used, but the non-studded winter tyrestend to produce even smaller particles inthe wear situation, says Mats Gustafsson.
– We have also shown that differentpavements produce very different amountsof PM10 and that they have differenttoxicological potential in human airwaycells.
Uncertainty about effects on our health
There is very little knowledge aboutwhich exact properties of the various par-ticles which can cause health problems. Alot of research indicates that the smallerparticles are more dangerous, but manystudies also indicate that other propertiesrather than mere size are more important.Moreover there are studies where largeparticles have just as bad or even worseeffects than small particles. Even thoughthe knowledge of how different particleproperties affect health is small yet, weare sure about the connection betweeninhalable particles and health effects.
– That is why it is important to do acti-ve research into which particle propertiesare really dangerous for our health and atthe same time find effective measures toreduce particle contents, says MatsGustafsson.
PHO
TO:
MAT
S G
US
TAFS
SO
N/V
TI
12
SWEDISH NATIONAL ROAD AND TRANSPORT RESEARCH INSTITUTE (VTI)
NORDIC ROAD & TRANSPORT RESEARCH NO. 3 2004
VTI-Algorithm Structuring theAustrian Road Network
Article specially written for Nordic Road& Transport Research by Fridtjof Thomas,[email protected], +46 243 736 75.
– At last we can do it! Petra Simanek ispleased with her new ability to genera-te homogenous road sections for theAustrian road network. For the firsttime she is now able to automaticallyidentify consecutive parts of theAustrian roads that are similar withrespect to rut depth, skid resistance,and longitudinal unevenness as measu-red by the International RoughnessIndex (IRI). The tool at her disposal isan implementation of the segmentationalgorithm developed at VTI.
– We measure the federal roads periodi-cally with a road surface profiler, butuntil now we haven’t been able to handlethe first step in the analysis of the large
amount of data in an automated way,explains Petra Simanek from the Institutefor Road Construction and Maintenanceat Vienna University of Technology(ISTU). She has been leading the projectthat has combined the Austrian needswith the statistical approach developed inSweden and that has resulted in thestand-alone software SAMSRoad.
– I use SAMSRoad in two ways,explains Petra Simanek. SAMSRoadgenerates the homogeneous sections neededin our pavement management system(PMS), and it can do that fully automati-cally for all the federal roads in all ourcounties. But SAMSRoad also allows meto have a look at selected parts of a road:the program allows me to manually changeidentified homogeneous sections bysimply clicking with the mouse on thesection borders, and it gives me a neatrepresentation of the entire road in termsof summary measurements computed onthe identified sections.
– We felt the need to generate homo-
geneous sections, before summarizingthe surface conditions in terms of averagerut depth and the like, but we couldn’tfind an approach that would give usreasonably reliable results when fullyautomatically executed, says AlfredWeninger-Vycudil, the architect behindthe Austrian PMS at ISTU, describing theproblem targeted by SAMSRoad.
– The resulting sections should reallybe homogeneous with respect to thosemeasurements we actually consider insubsequent optimization procedures withinour PMS. Ultimately we want to derivegood maintenance plans for our federalroads from this project, and we do collecthigh quality road surface measurements –so it felt odd not being able to identifysections of a road that are homogeneouswith respect to rutting or unevenness.
It was decided at an early stage in theproject that the result should be a stand-alone computer program that can processlarge amounts of data. Therefore pro-grammer Murat Özcan, who frequently
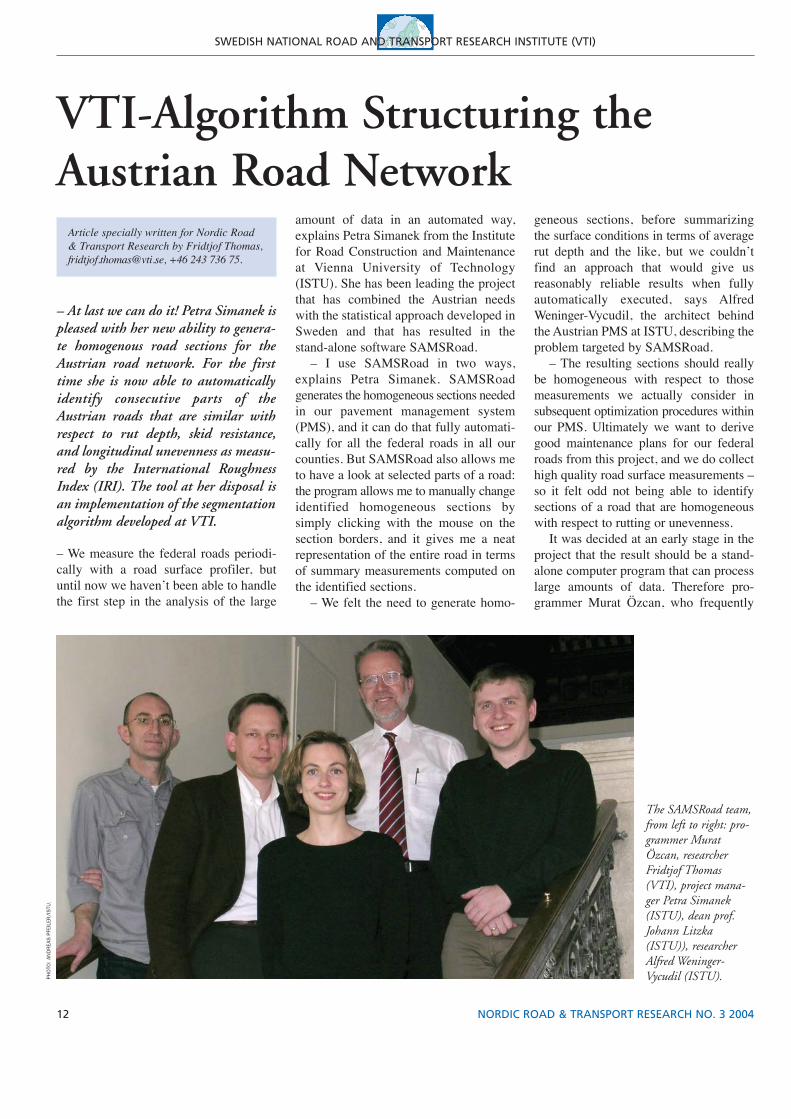
The SAMSRoad team,from left to right: pro-grammer MuratÖzcan, researcherFridtjof Thomas(VTI), project mana-ger Petra Simanek(ISTU), dean prof.Johann Litzka(ISTU)), researcherAlfred Weninger-Vycudil (ISTU). PH
OTO
: AN
DR
EAS
PFE
ILER
/IS
TU.
13NORDIC ROAD & TRANSPORT RESEARCH NO. 3 2004
SWEDISH NATIONAL ROAD AND TRANSPORT RESEARCH INSTITUTE (VTI)
tackles scientific programming problemsat ISTU, was brought into the group, andthe project was started with a three daymeeting in Vienna. Murat Özcan had toconstantly translate the wishes from thepotential users to feasible software solu-tions, and stressed the importance of theinterface issues.
The algorithm is the part that sets theprogram apart from other approaches, butit’s the user interface that will determinewhether the program is used in the future.
SAMSRoad should be viewed as aroutine implemented in a statistical pro-gram package, even though it is stand-alone software that can execute in batchmode and process large data sets fullyautomatically. The method will work ifthe measurement series submitted satisfycertain requirements. But it is the user’sresponsibility to check whether theserequirements are reasonably well met.
SAMSRoad was written in JAVA pro-
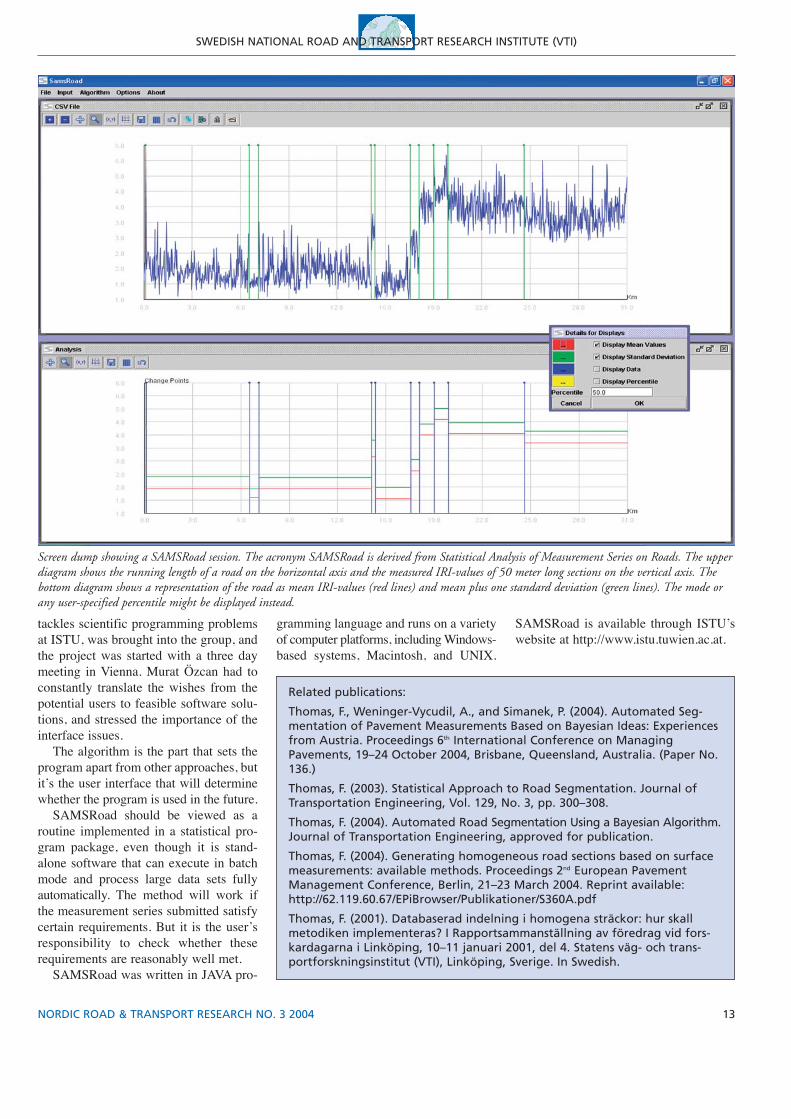
Screen dump showing a SAMSRoad session. The acronym SAMSRoad is derived from Statistical Analysis of Measurement Series on Roads. The upperdiagram shows the running length of a road on the horizontal axis and the measured IRI-values of 50 meter long sections on the vertical axis. Thebottom diagram shows a representation of the road as mean IRI-values (red lines) and mean plus one standard deviation (green lines). The mode orany user-specified percentile might be displayed instead.
Related publications:
Thomas, F., Weninger-Vycudil, A., and Simanek, P. (2004). Automated Seg-mentation of Pavement Measurements Based on Bayesian Ideas: Experiencesfrom Austria. Proceedings 6th International Conference on ManagingPavements, 19–24 October 2004, Brisbane, Queensland, Australia. (Paper No.136.)
Thomas, F. (2003). Statistical Approach to Road Segmentation. Journal ofTransportation Engineering, Vol. 129, No. 3, pp. 300–308.
Thomas, F. (2004). Automated Road Segmentation Using a Bayesian Algorithm.Journal of Transportation Engineering, approved for publication.
Thomas, F. (2004). Generating homogeneous road sections based on surfacemeasurements: available methods. Proceedings 2nd European PavementManagement Conference, Berlin, 21–23 March 2004. Reprint available:http://62.119.60.67/EPiBrowser/Publikationer/S360A.pdf
Thomas, F. (2001). Databaserad indelning i homogena sträckor: hur skallmetodiken implementeras? I Rapportsammanställning av föredrag vid fors-kardagarna i Linköping, 10–11 januari 2001, del 4. Statens väg- och trans-portforskningsinstitut (VTI), Linköping, Sverige. In Swedish.
gramming language and runs on a varietyof computer platforms, including Windows-based systems, Macintosh, and UNIX.
SAMSRoad is available through ISTU’swebsite at http://www.istu.tuwien.ac.at.
14
SWEDISH NATIONAL ROAD AND TRANSPORT RESEARCH INSTITUTE (VTI)
NORDIC ROAD & TRANSPORT RESEARCH NO. 3 2004
Title: Designing and Testing of aSchool Transportation Bus StopAuthors: Anna Anund, TorbjörnFalkmer and Helena HellstenSeries: VTI rapport 494Language: Swedish with EnglishsummaryThe report is also available as apdf file on www.vti.se/ Publications.
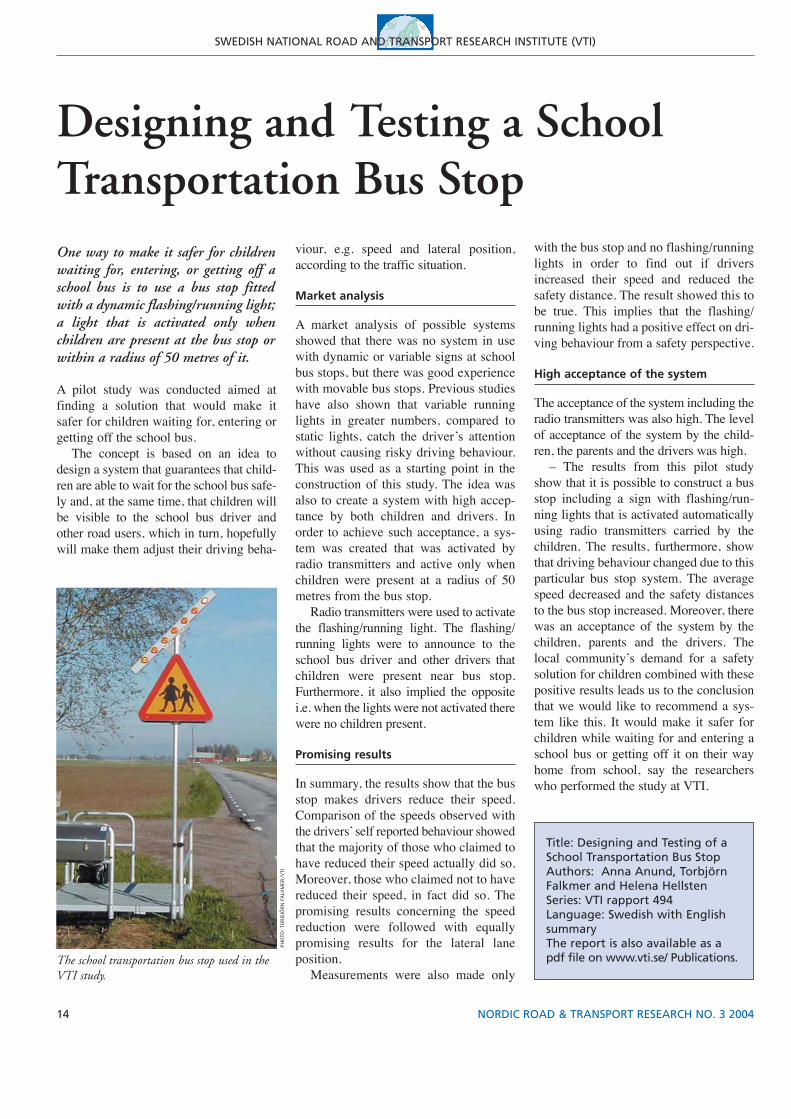
One way to make it safer for childrenwaiting for, entering, or getting off aschool bus is to use a bus stop fittedwith a dynamic flashing/running light;a light that is activated only whenchildren are present at the bus stop orwithin a radius of 50 metres of it.
A pilot study was conducted aimed atfinding a solution that would make itsafer for children waiting for, entering orgetting off the school bus.
The concept is based on an idea todesign a system that guarantees that child-ren are able to wait for the school bus safe-ly and, at the same time, that children willbe visible to the school bus driver andother road users, which in turn, hopefullywill make them adjust their driving beha-
Designing and Testing a SchoolTransportation Bus Stop
viour, e.g. speed and lateral position,according to the traffic situation.
Market analysis
A market analysis of possible systemsshowed that there was no system in usewith dynamic or variable signs at schoolbus stops, but there was good experiencewith movable bus stops. Previous studieshave also shown that variable runninglights in greater numbers, compared tostatic lights, catch the driver’s attentionwithout causing risky driving behaviour.This was used as a starting point in theconstruction of this study. The idea wasalso to create a system with high accep-tance by both children and drivers. Inorder to achieve such acceptance, a sys-tem was created that was activated byradio transmitters and active only whenchildren were present at a radius of 50metres from the bus stop.
Radio transmitters were used to activatethe flashing/running light. The flashing/running lights were to announce to theschool bus driver and other drivers thatchildren were present near bus stop.Furthermore, it also implied the oppositei.e. when the lights were not activated therewere no children present.
Promising results
In summary, the results show that the busstop makes drivers reduce their speed.Comparison of the speeds observed withthe drivers’ self reported behaviour showedthat the majority of those who claimed tohave reduced their speed actually did so.Moreover, those who claimed not to havereduced their speed, in fact did so. Thepromising results concerning the speedreduction were followed with equallypromising results for the lateral laneposition.
Measurements were also made only
with the bus stop and no flashing/runninglights in order to find out if driversincreased their speed and reduced thesafety distance. The result showed this tobe true. This implies that the flashing/running lights had a positive effect on dri-ving behaviour from a safety perspective.
High acceptance of the system
The acceptance of the system including theradio transmitters was also high. The levelof acceptance of the system by the child-ren, the parents and the drivers was high.
– The results from this pilot studyshow that it is possible to construct a busstop including a sign with flashing/run-ning lights that is activated automaticallyusing radio transmitters carried by thechildren. The results, furthermore, showthat driving behaviour changed due to thisparticular bus stop system. The averagespeed decreased and the safety distancesto the bus stop increased. Moreover, therewas an acceptance of the system by thechildren, parents and the drivers. Thelocal community’s demand for a safetysolution for children combined with thesepositive results leads us to the conclusionthat we would like to recommend a sys-tem like this. It would make it safer forchildren while waiting for and entering aschool bus or getting off it on their wayhome from school, say the researcherswho performed the study at VTI.
PHO
TO:
TOR
BJÖ
RN
FAL
KM
ER/V
TI
The school transportation bus stop used in theVTI study.
15NORDIC ROAD & TRANSPORT RESEARCH NO. 3 2004
SWEDISH NATIONAL ROAD AND TRANSPORT RESEARCH INSTITUTE (VTI)
Title: Driving when tired– fromthe drivers’ point of viewAuthors: Anna Anund, GöranKecklund and Björn PetersSeries: VTI rapport 498Language: Swedish with EnglishsummaryThe report is also available as apdf file on www.vti.se/ Publications.
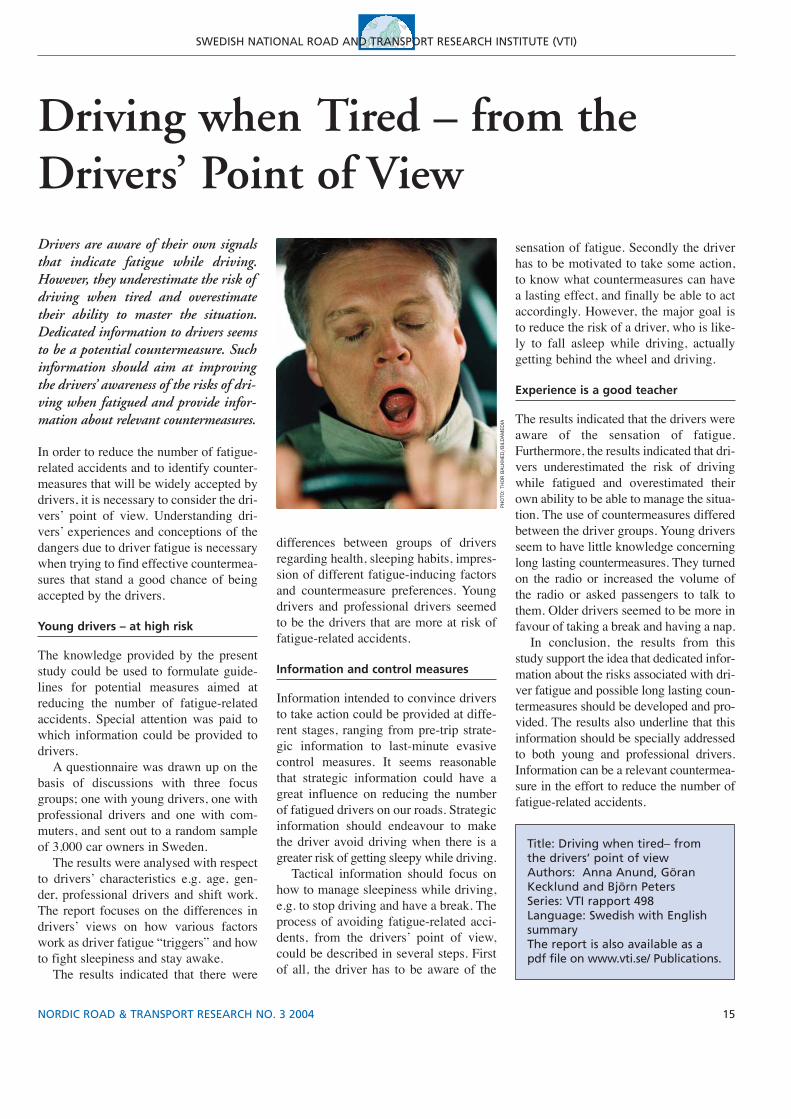
Drivers are aware of their own signalsthat indicate fatigue while driving.However, they underestimate the risk ofdriving when tired and overestimatetheir ability to master the situation.Dedicated information to drivers seemsto be a potential countermeasure. Suchinformation should aim at improvingthe drivers’ awareness of the risks of dri-ving when fatigued and provide infor-mation about relevant countermeasures.
In order to reduce the number of fatigue-related accidents and to identify counter-measures that will be widely accepted bydrivers, it is necessary to consider the dri-vers’ point of view. Understanding dri-vers’ experiences and conceptions of thedangers due to driver fatigue is necessarywhen trying to find effective countermea-sures that stand a good chance of beingaccepted by the drivers.
Young drivers – at high risk
The knowledge provided by the presentstudy could be used to formulate guide-lines for potential measures aimed atreducing the number of fatigue-relatedaccidents. Special attention was paid towhich information could be provided todrivers.
A questionnaire was drawn up on thebasis of discussions with three focusgroups; one with young drivers, one withprofessional drivers and one with com-muters, and sent out to a random sampleof 3,000 car owners in Sweden.
The results were analysed with respectto drivers’ characteristics e.g. age, gen-der, professional drivers and shift work.The report focuses on the differences indrivers’ views on how various factorswork as driver fatigue “triggers” and howto fight sleepiness and stay awake.
The results indicated that there were
Driving when Tired – from theDrivers’ Point of View
differences between groups of driversregarding health, sleeping habits, impres-sion of different fatigue-inducing factorsand countermeasure preferences. Youngdrivers and professional drivers seemedto be the drivers that are more at risk offatigue-related accidents.
Information and control measures
Information intended to convince driversto take action could be provided at diffe-rent stages, ranging from pre-trip strate-gic information to last-minute evasivecontrol measures. It seems reasonablethat strategic information could have agreat influence on reducing the numberof fatigued drivers on our roads. Strategicinformation should endeavour to makethe driver avoid driving when there is agreater risk of getting sleepy while driving.
Tactical information should focus onhow to manage sleepiness while driving,e.g. to stop driving and have a break. Theprocess of avoiding fatigue-related acci-dents, from the drivers’ point of view,could be described in several steps. Firstof all, the driver has to be aware of the
sensation of fatigue. Secondly the driverhas to be motivated to take some action,to know what countermeasures can havea lasting effect, and finally be able to actaccordingly. However, the major goal isto reduce the risk of a driver, who is like-ly to fall asleep while driving, actuallygetting behind the wheel and driving.
Experience is a good teacher
The results indicated that the drivers wereaware of the sensation of fatigue.Furthermore, the results indicated that dri-vers underestimated the risk of drivingwhile fatigued and overestimated theirown ability to be able to manage the situa-tion. The use of countermeasures differedbetween the driver groups. Young driversseem to have little knowledge concerninglong lasting countermeasures. They turnedon the radio or increased the volume ofthe radio or asked passengers to talk tothem. Older drivers seemed to be more infavour of taking a break and having a nap.
In conclusion, the results from thisstudy support the idea that dedicated infor-mation about the risks associated with dri-ver fatigue and possible long lasting coun-termeasures should be developed and pro-vided. The results also underline that thisinformation should be specially addressedto both young and professional drivers.Information can be a relevant countermea-sure in the effort to reduce the number offatigue-related accidents.
PHO
TO:
THO
R B
ALK
HED
/BIL
DAM
EDIA
16
NORWEGIAN PUBLIC ROADS ADMINISTRATION (NPRA)
NORDIC ROAD & TRANSPORT RESEARCH NO. 3 2004
Recognising that there was a need forincreased knowledge of all types of fric-tion measurements, the NorwegianPublic Roads Administration started aresearch project in 1997 with focus onwinter road maintenance. The goalsfor the project were, among others, a)to come up with optimal methods thatcan be of practical use and b) come upwith the type and amount of salt andsand to be used during various condi-tions. Besides studying different sandingand salting methods, the project hasalso dealt with different ways of applyingabrasives.
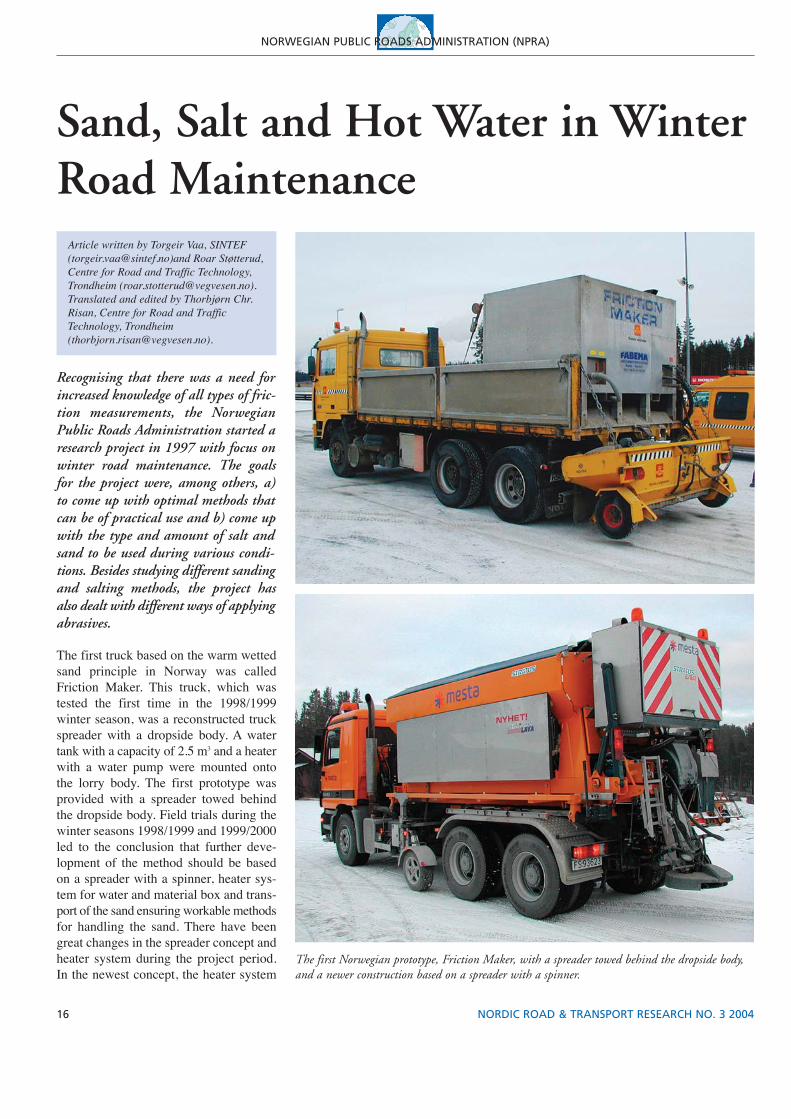
The first truck based on the warm wettedsand principle in Norway was calledFriction Maker. This truck, which wastested the first time in the 1998/1999winter season, was a reconstructed truckspreader with a dropside body. A watertank with a capacity of 2.5 m3 and a heaterwith a water pump were mounted ontothe lorry body. The first prototype wasprovided with a spreader towed behindthe dropside body. Field trials during thewinter seasons 1998/1999 and 1999/2000led to the conclusion that further deve-lopment of the method should be basedon a spreader with a spinner, heater sys-tem for water and material box and trans-port of the sand ensuring workable methodsfor handling the sand. There have beengreat changes in the spreader concept andheater system during the project period.In the newest concept, the heater system
Sand, Salt and Hot Water in WinterRoad Maintenance
The first Norwegian prototype, Friction Maker, with a spreader towed behind the dropside body,and a newer construction based on a spreader with a spinner.
Article written by Torgeir Vaa, SINTEF([email protected])and Roar Støtterud,Centre for Road and Traffic Technology,Trondheim ([email protected]).Translated and edited by Thorbjørn Chr.Risan, Centre for Road and TrafficTechnology, Trondheim([email protected]).
17NORDIC ROAD & TRANSPORT RESEARCH NO. 3 2004
NORWEGIAN PUBLIC ROADS ADMINISTRATION (NPRA)
and water tanks are separated. The newspreader type in combination with a spinnercan be used both for spreading sand andsalt with or without adding liquid.
Description and method
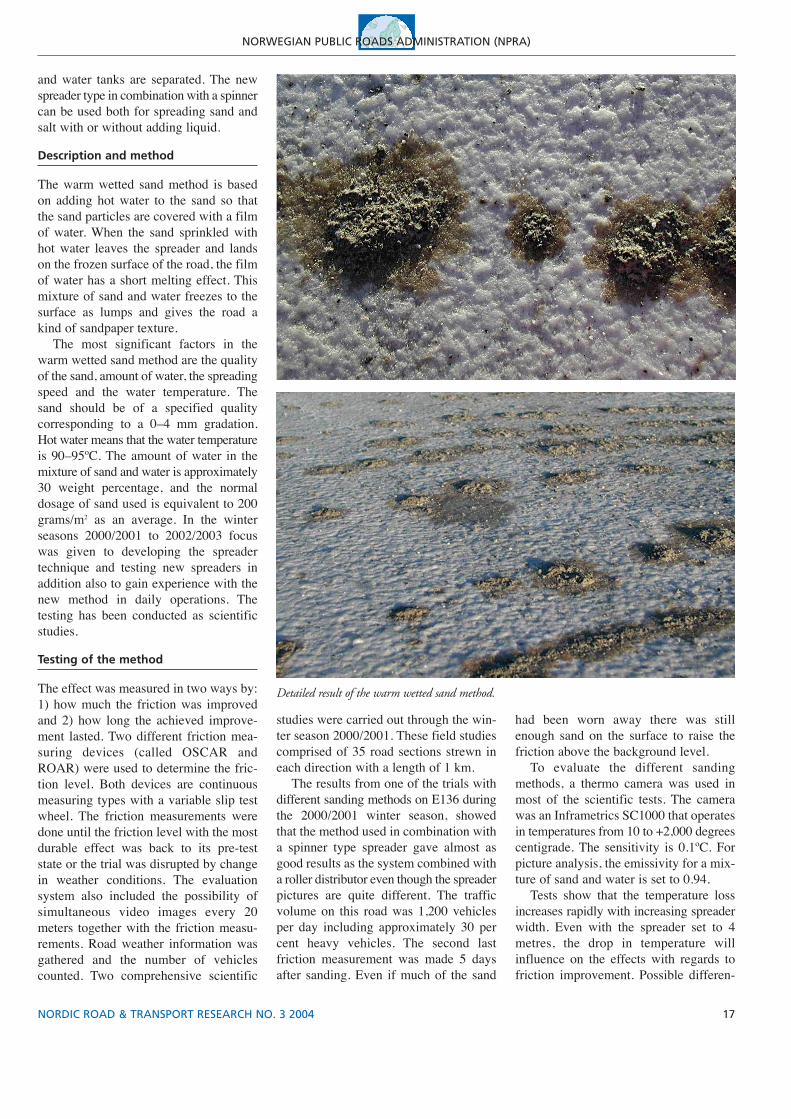
The warm wetted sand method is basedon adding hot water to the sand so thatthe sand particles are covered with a filmof water. When the sand sprinkled withhot water leaves the spreader and landson the frozen surface of the road, the filmof water has a short melting effect. Thismixture of sand and water freezes to thesurface as lumps and gives the road akind of sandpaper texture.
The most significant factors in thewarm wetted sand method are the qualityof the sand, amount of water, the spreadingspeed and the water temperature. Thesand should be of a specified qualitycorresponding to a 0–4 mm gradation.Hot water means that the water temperatureis 90–95ºC. The amount of water in themixture of sand and water is approximately30 weight percentage, and the normaldosage of sand used is equivalent to 200grams/m2 as an average. In the winterseasons 2000/2001 to 2002/2003 focuswas given to developing the spreadertechnique and testing new spreaders inaddition also to gain experience with thenew method in daily operations. Thetesting has been conducted as scientificstudies.
Testing of the method
The effect was measured in two ways by:1) how much the friction was improvedand 2) how long the achieved improve-ment lasted. Two different friction mea-suring devices (called OSCAR andROAR) were used to determine the fric-tion level. Both devices are continuousmeasuring types with a variable slip testwheel. The friction measurements weredone until the friction level with the mostdurable effect was back to its pre-teststate or the trial was disrupted by changein weather conditions. The evaluationsystem also included the possibility ofsimultaneous video images every 20meters together with the friction measu-rements. Road weather information wasgathered and the number of vehiclescounted. Two comprehensive scientific
studies were carried out through the win-ter season 2000/2001. These field studiescomprised of 35 road sections strewn ineach direction with a length of 1 km.
The results from one of the trials withdifferent sanding methods on E136 duringthe 2000/2001 winter season, showedthat the method used in combination witha spinner type spreader gave almost asgood results as the system combined witha roller distributor even though the spreaderpictures are quite different. The trafficvolume on this road was 1,200 vehiclesper day including approximately 30 percent heavy vehicles. The second lastfriction measurement was made 5 daysafter sanding. Even if much of the sand
had been worn away there was stillenough sand on the surface to raise thefriction above the background level.
To evaluate the different sandingmethods, a thermo camera was used inmost of the scientific tests. The camerawas an Inframetrics SC1000 that operatesin temperatures from 10 to +2,000 degreescentigrade. The sensitivity is 0.1ºC. Forpicture analysis, the emissivity for a mix-ture of sand and water is set to 0.94.
Tests show that the temperature lossincreases rapidly with increasing spreaderwidth. Even with the spreader set to 4metres, the drop in temperature willinfluence on the effects with regards tofriction improvement. Possible differen-
Detailed result of the warm wetted sand method.
18
NORWEGIAN PUBLIC ROADS ADMINISTRATION (NPRA)
NORDIC ROAD & TRANSPORT RESEARCH NO. 3 2004
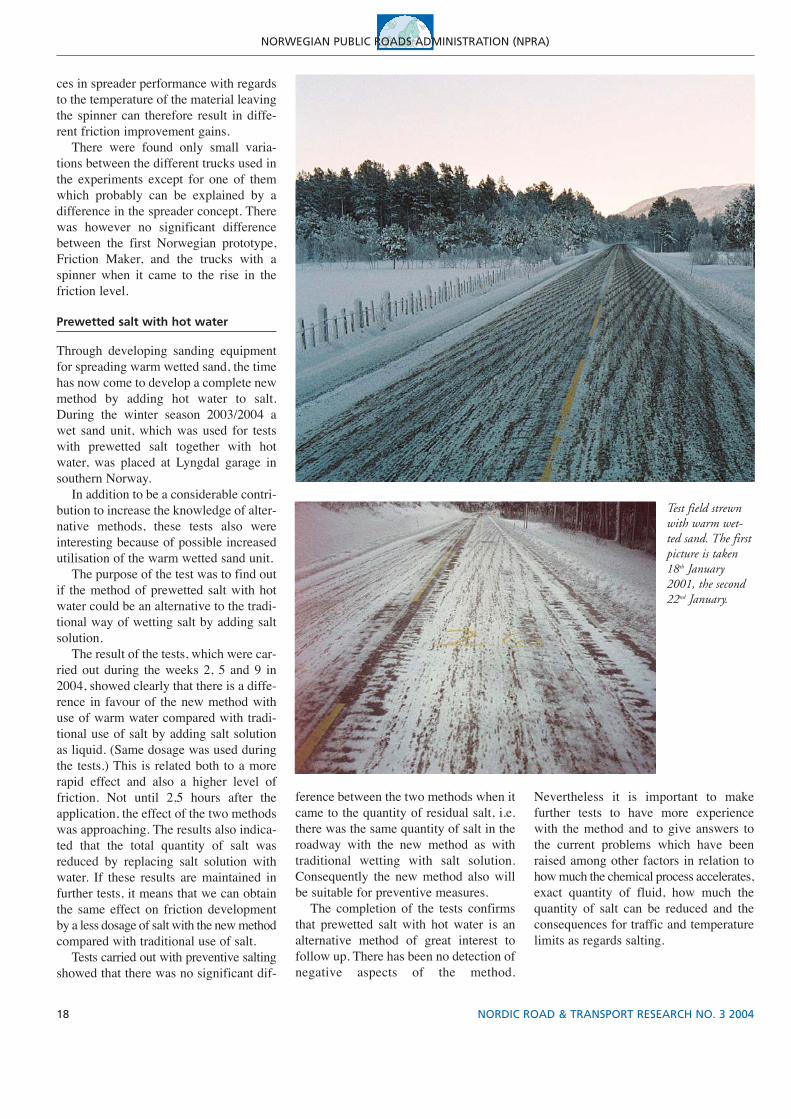
Test field strewnwith warm wet-ted sand. The firstpicture is taken18th January2001, the second22nd January.
ces in spreader performance with regardsto the temperature of the material leavingthe spinner can therefore result in diffe-rent friction improvement gains.
There were found only small varia-tions between the different trucks used inthe experiments except for one of themwhich probably can be explained by adifference in the spreader concept. Therewas however no significant differencebetween the first Norwegian prototype,Friction Maker, and the trucks with aspinner when it came to the rise in thefriction level.
Prewetted salt with hot water
Through developing sanding equipmentfor spreading warm wetted sand, the timehas now come to develop a complete newmethod by adding hot water to salt.During the winter season 2003/2004 awet sand unit, which was used for testswith prewetted salt together with hotwater, was placed at Lyngdal garage insouthern Norway.
In addition to be a considerable contri-bution to increase the knowledge of alter-native methods, these tests also wereinteresting because of possible increasedutilisation of the warm wetted sand unit.
The purpose of the test was to find outif the method of prewetted salt with hotwater could be an alternative to the tradi-tional way of wetting salt by adding saltsolution.
The result of the tests, which were car-ried out during the weeks 2, 5 and 9 in2004, showed clearly that there is a diffe-rence in favour of the new method withuse of warm water compared with tradi-tional use of salt by adding salt solutionas liquid. (Same dosage was used duringthe tests.) This is related both to a morerapid effect and also a higher level offriction. Not until 2,5 hours after theapplication, the effect of the two methodswas approaching. The results also indica-ted that the total quantity of salt wasreduced by replacing salt solution withwater. If these results are maintained infurther tests, it means that we can obtainthe same effect on friction developmentby a less dosage of salt with the new methodcompared with traditional use of salt.
Tests carried out with preventive saltingshowed that there was no significant dif-
ference between the two methods when itcame to the quantity of residual salt, i.e.there was the same quantity of salt in theroadway with the new method as withtraditional wetting with salt solution.Consequently the new method also willbe suitable for preventive measures.
The completion of the tests confirmsthat prewetted salt with hot water is analternative method of great interest tofollow up. There has been no detection ofnegative aspects of the method.
Nevertheless it is important to makefurther tests to have more experiencewith the method and to give answers tothe current problems which have beenraised among other factors in relation tohow much the chemical process accelerates,exact quantity of fluid, how much thequantity of salt can be reduced and theconsequences for traffic and temperaturelimits as regards salting.
19NORDIC ROAD & TRANSPORT RESEARCH NO. 3 2004
NORWEGIAN PUBLIC ROADS ADMINISTRATION (NPRA)
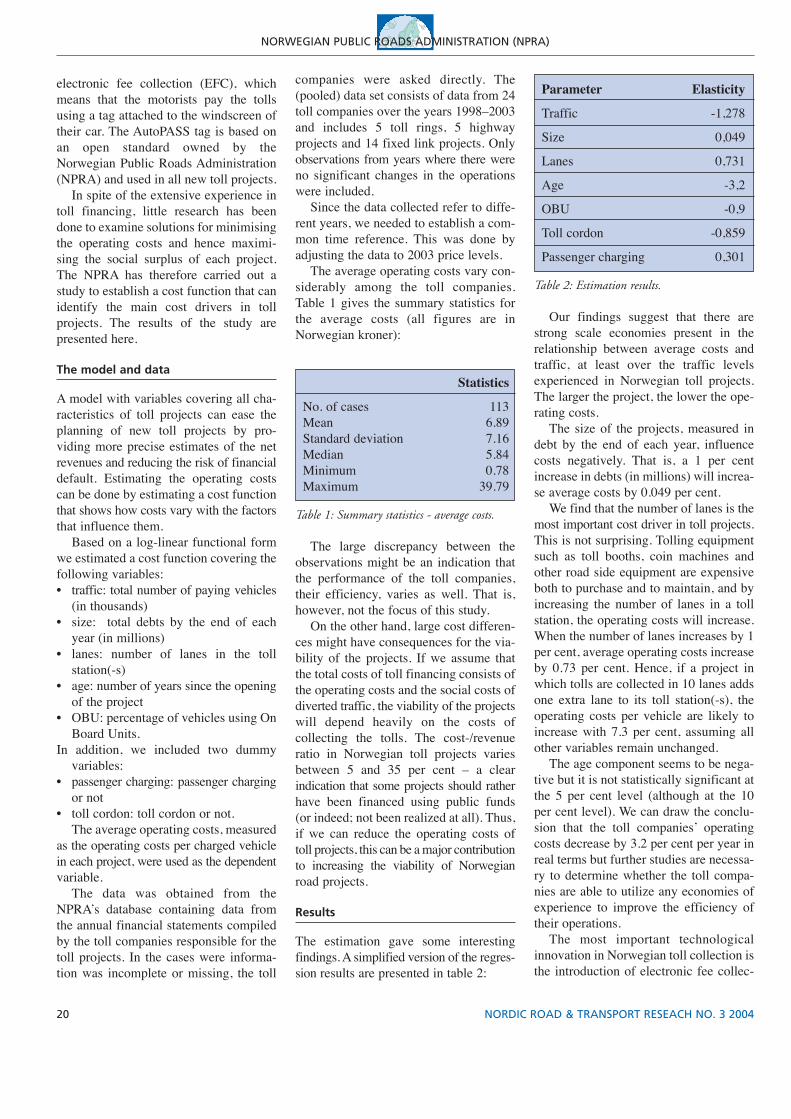
Toll financing in Norway has beenused to finance new roads as a supple-ment to public funds for more than 70years. In total over 100 projects havebeen financed by tolls and only one hasever been declared bankrupt.
Tolls have traditionally been used tofinance bridges and tunnels to supersedeferry connections, but since the 1980s thenumber of and the type of projects financedby tolls have increased considerably.Today there are 47 projects and the numberof projects is increasing. There are 7 tollcordons in operation and although fixedlink projects still make up the bulk of thetotal number of projects, there are plansto use tolls to finance larger parts of the
Toll Financing – How to Reducethe Operating Costs?
Article written by Erik Amdal([email protected]), Morten Welde([email protected]), NorwegianPublic Roads Administration.
motorway network as well. The net revenues from toll financing
annually make up between 25 and 35 percent of the annual budgets for road construc-tion. Norwegian motorists spend averagely
175 euros per vehicle per year on tolls.The use of technology plays an impor-
tant part in the toll collection. Since theearly 1990s an increasing proportion ofthe tolls have been collected using
The figure illustrates the development in the number of toll projects.
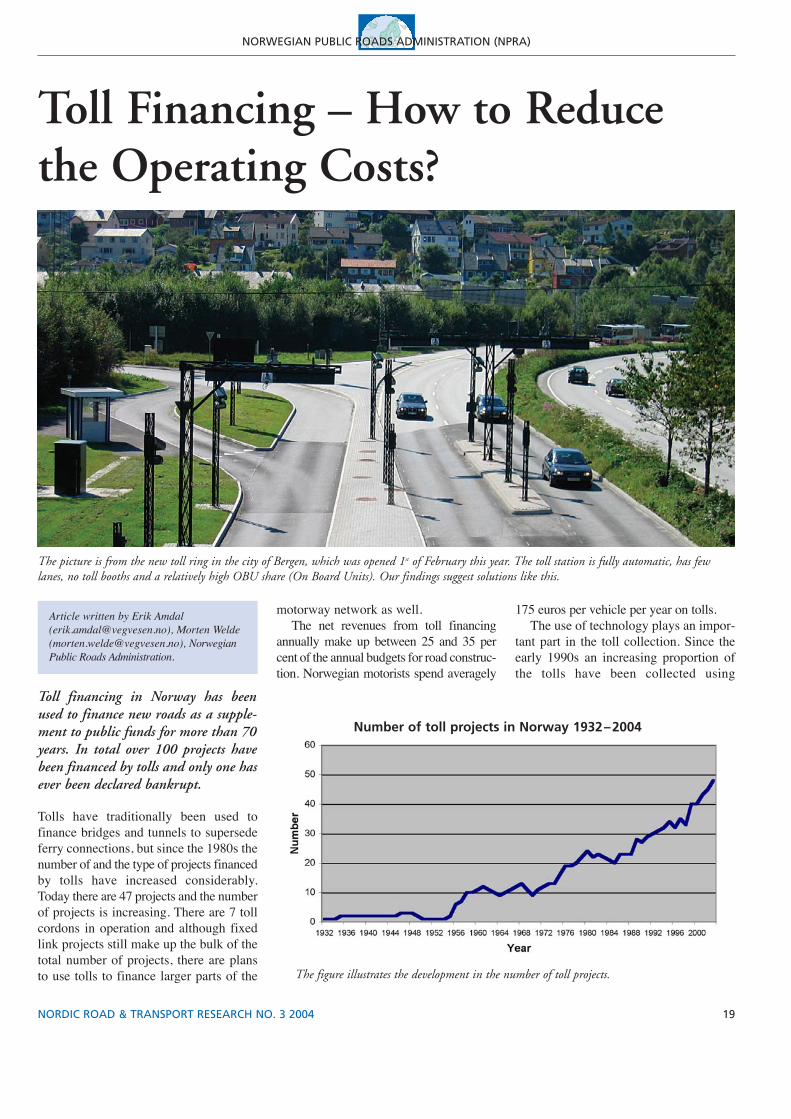
The picture is from the new toll ring in the city of Bergen, which was opened 1st of February this year. The toll station is fully automatic, has fewlanes, no toll booths and a relatively high OBU share (On Board Units). Our findings suggest solutions like this.
Number of toll projects in Norway 1932–2004
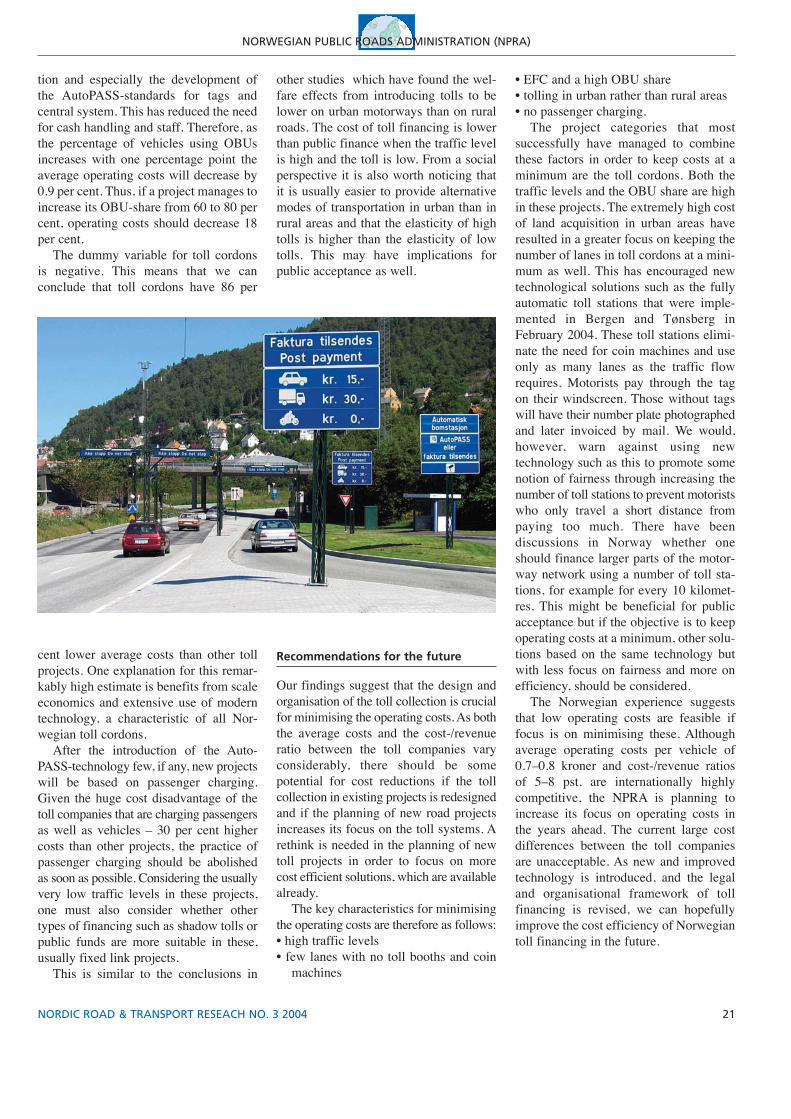
Parameter Elasticity
Traffic -1,278
Size 0,049
Lanes 0,731
Age -3,2
OBU -0,9
Toll cordon -0,859
Passenger charging 0,301
Table 2: Estimation results.
Our findings suggest that there arestrong scale economies present in therelationship between average costs andtraffic, at least over the traffic levelsexperienced in Norwegian toll projects.The larger the project, the lower the ope-rating costs.
The size of the projects, measured indebt by the end of each year, influencecosts negatively. That is, a 1 per centincrease in debts (in millions) will increa-se average costs by 0.049 per cent.
We find that the number of lanes is themost important cost driver in toll projects.This is not surprising. Tolling equipmentsuch as toll booths, coin machines andother road side equipment are expensiveboth to purchase and to maintain, and byincreasing the number of lanes in a tollstation, the operating costs will increase.When the number of lanes increases by 1per cent, average operating costs increaseby 0.73 per cent. Hence, if a project inwhich tolls are collected in 10 lanes addsone extra lane to its toll station(-s), theoperating costs per vehicle are likely toincrease with 7.3 per cent, assuming allother variables remain unchanged.
The age component seems to be nega-tive but it is not statistically significant atthe 5 per cent level (although at the 10per cent level). We can draw the conclu-sion that the toll companies’ operatingcosts decrease by 3.2 per cent per year inreal terms but further studies are necessa-ry to determine whether the toll compa-nies are able to utilize any economies ofexperience to improve the efficiency oftheir operations.
The most important technologicalinnovation in Norwegian toll collection isthe introduction of electronic fee collec-
20 NORDIC ROAD & TRANSPORT RESEACH NO. 3 2004
NORWEGIAN PUBLIC ROADS ADMINISTRATION (NPRA)
electronic fee collection (EFC), whichmeans that the motorists pay the tollsusing a tag attached to the windscreen oftheir car. The AutoPASS tag is based onan open standard owned by theNorwegian Public Roads Administration(NPRA) and used in all new toll projects.
In spite of the extensive experience intoll financing, little research has beendone to examine solutions for minimisingthe operating costs and hence maximi-sing the social surplus of each project.The NPRA has therefore carried out astudy to establish a cost function that canidentify the main cost drivers in tollprojects. The results of the study arepresented here.
The model and data
A model with variables covering all cha-racteristics of toll projects can ease theplanning of new toll projects by pro-viding more precise estimates of the netrevenues and reducing the risk of financialdefault. Estimating the operating costscan be done by estimating a cost functionthat shows how costs vary with the factorsthat influence them.
Based on a log-linear functional formwe estimated a cost function covering thefollowing variables:• traffic: total number of paying vehicles
(in thousands)• size: total debts by the end of each
year (in millions)• lanes: number of lanes in the toll
station(-s)• age: number of years since the opening
of the project• OBU: percentage of vehicles using On
Board Units.In addition, we included two dummy
variables:• passenger charging: passenger charging
or not• toll cordon: toll cordon or not.
The average operating costs, measuredas the operating costs per charged vehiclein each project, were used as the dependentvariable.
The data was obtained from theNPRA’s database containing data fromthe annual financial statements compiledby the toll companies responsible for thetoll projects. In the cases were informa-tion was incomplete or missing, the toll
companies were asked directly. The(pooled) data set consists of data from 24toll companies over the years 1998–2003and includes 5 toll rings, 5 highwayprojects and 14 fixed link projects. Onlyobservations from years where there wereno significant changes in the operationswere included.
Since the data collected refer to diffe-rent years, we needed to establish a com-mon time reference. This was done byadjusting the data to 2003 price levels.
The average operating costs vary con-siderably among the toll companies.Table 1 gives the summary statistics forthe average costs (all figures are inNorwegian kroner):
Statistics
No. of cases 113Mean 6.89Standard deviation 7.16Median 5.84Minimum 0.78Maximum 39.79
Table 1: Summary statistics - average costs.
The large discrepancy between theobservations might be an indication thatthe performance of the toll companies,their efficiency, varies as well. That is,however, not the focus of this study.
On the other hand, large cost differen-ces might have consequences for the via-bility of the projects. If we assume thatthe total costs of toll financing consists ofthe operating costs and the social costs ofdiverted traffic, the viability of the projectswill depend heavily on the costs ofcollecting the tolls. The cost-/revenueratio in Norwegian toll projects variesbetween 5 and 35 per cent – a clearindication that some projects should ratherhave been financed using public funds(or indeed; not been realized at all). Thus,if we can reduce the operating costs oftoll projects, this can be a major contributionto increasing the viability of Norwegianroad projects.
Results
The estimation gave some interestingfindings. A simplified version of the regres-sion results are presented in table 2:
21NORDIC ROAD & TRANSPORT RESEACH NO. 3 2004
NORWEGIAN PUBLIC ROADS ADMINISTRATION (NPRA)
tion and especially the development ofthe AutoPASS-standards for tags andcentral system. This has reduced the needfor cash handling and staff. Therefore, asthe percentage of vehicles using OBUsincreases with one percentage point theaverage operating costs will decrease by0.9 per cent. Thus, if a project manages toincrease its OBU-share from 60 to 80 percent, operating costs should decrease 18per cent.
The dummy variable for toll cordonsis negative. This means that we canconclude that toll cordons have 86 per
other studies which have found the wel-fare effects from introducing tolls to belower on urban motorways than on ruralroads. The cost of toll financing is lowerthan public finance when the traffic levelis high and the toll is low. From a socialperspective it is also worth noticing thatit is usually easier to provide alternativemodes of transportation in urban than inrural areas and that the elasticity of hightolls is higher than the elasticity of lowtolls. This may have implications forpublic acceptance as well.
• EFC and a high OBU share• tolling in urban rather than rural areas• no passenger charging.
The project categories that mostsuccessfully have managed to combinethese factors in order to keep costs at aminimum are the toll cordons. Both thetraffic levels and the OBU share are highin these projects. The extremely high costof land acquisition in urban areas haveresulted in a greater focus on keeping thenumber of lanes in toll cordons at a mini-mum as well. This has encouraged newtechnological solutions such as the fullyautomatic toll stations that were imple-mented in Bergen and Tønsberg inFebruary 2004. These toll stations elimi-nate the need for coin machines and useonly as many lanes as the traffic flowrequires. Motorists pay through the tagon their windscreen. Those without tagswill have their number plate photographedand later invoiced by mail. We would,however, warn against using newtechnology such as this to promote somenotion of fairness through increasing thenumber of toll stations to prevent motoristswho only travel a short distance frompaying too much. There have beendiscussions in Norway whether oneshould finance larger parts of the motor-way network using a number of toll sta-tions, for example for every 10 kilomet-res. This might be beneficial for publicacceptance but if the objective is to keepoperating costs at a minimum, other solu-tions based on the same technology butwith less focus on fairness and more onefficiency, should be considered.
The Norwegian experience suggeststhat low operating costs are feasible iffocus is on minimising these. Althoughaverage operating costs per vehicle of0.7–0.8 kroner and cost-/revenue ratiosof 5–8 pst. are internationally highlycompetitive, the NPRA is planning toincrease its focus on operating costs inthe years ahead. The current large costdifferences between the toll companiesare unacceptable. As new and improvedtechnology is introduced, and the legaland organisational framework of tollfinancing is revised, we can hopefullyimprove the cost efficiency of Norwegiantoll financing in the future.
cent lower average costs than other tollprojects. One explanation for this remar-kably high estimate is benefits from scaleeconomics and extensive use of moderntechnology, a characteristic of all Nor-wegian toll cordons.
After the introduction of the Auto-PASS-technology few, if any, new projectswill be based on passenger charging.Given the huge cost disadvantage of thetoll companies that are charging passengersas well as vehicles – 30 per cent highercosts than other projects, the practice ofpassenger charging should be abolishedas soon as possible. Considering the usuallyvery low traffic levels in these projects,one must also consider whether othertypes of financing such as shadow tolls orpublic funds are more suitable in these,usually fixed link projects.
This is similar to the conclusions in
Recommendations for the future
Our findings suggest that the design andorganisation of the toll collection is crucialfor minimising the operating costs. As boththe average costs and the cost-/revenueratio between the toll companies varyconsiderably, there should be somepotential for cost reductions if the tollcollection in existing projects is redesignedand if the planning of new road projectsincreases its focus on the toll systems. Arethink is needed in the planning of newtoll projects in order to focus on morecost efficient solutions, which are availablealready.
The key characteristics for minimisingthe operating costs are therefore as follows:• high traffic levels• few lanes with no toll booths and coin
machines
22 NORDIC ROAD & TRANSPORT RESEACH NO. 3 2004
Traditionally, National RoadAdministrations across the world havefocused on road construction andmaintenance. The latest tendencies,however, are more focused on conduc-ting traffic efficiently. What does itmean and how is it achieved? And howare things developing in Denmark?
Article specially written for Nordic Road& Transport Research by Bente Iversen([email protected], tel. + 45 33 41 34 21), M.A.,Head of Road and Traffic Information.
The Traffic Information CentreSeen in an International Perspective
Danes continue to buy more vehicles.The Danish road system, however, is notkeeping pace with vehicle ownership.Consequently, traffic flows continue togrow at rates that cannot be sustained bycapacity increases from construction,especially around the larger cities.
Obviously, Denmark is not alone inthis matter. The situation is the same allover Europe. Saturation point has beenreached around cities such as London andParis which have required alternative andin some cases radical solutions.
From road to management
For many years and rightly so, EuropeanRoad Administrations have put theirefforts into road extensions, maintenanceand improvements of the physical infra-structure – the actual road network.
For several reasons, it is no longerpossible to keep up the ‘capacity increa-ses’ at the pace of the growing trafficflows. The ‘physical space’ is not theonly factor to be taken into consideration;today financial and environmental consi-
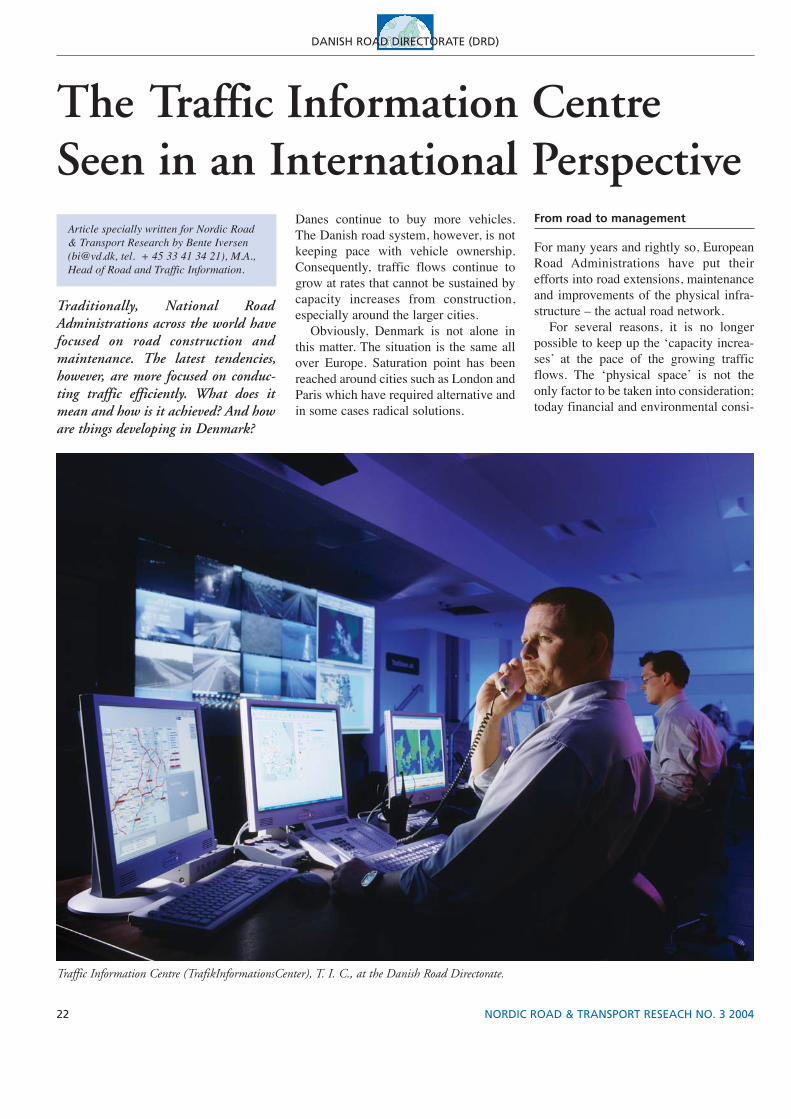
Traffic Information Centre (TrafikInformationsCenter), T. I. C., at the Danish Road Directorate.
DANISH ROAD DIRECTORATE (DRD)
23NORDIC ROAD & TRANSPORT RESEACH NO. 3 2004
DANISH ROAD DIRECTORATE (DRD)
derations are equally crucial. Alternatively, or perhaps supplementa-
ry to a new infrastructure, traffic manage-ment comes into play; it ensures that traf-fic is effectively conducted and therebywe obtain a more useful utilisation of theexisting road system.
ITS – a step in the right direction
Traffic management can take several dif-ferent forms, from a stationary sign warningabout a queue, to a traffic announcementon the radio, to more advanced, dynamic,electronic information systems that arecentrally controlled.
ITS, Intelligent Transport Systems –such as road sensors and electrical sign-posting, which warn and inform road-users on the spot about e.g. queues or traveltime to the centre of the city – are a stepin the right direction but are only part ofthe solution.
ITS, however, only solves a limitedpart of the mission – even when connec-ted to advanced navigation systems. Toarrive safely and without delay requirescoordination and a far more comprehen-sive gathering process. This is whereNational Road Administrations becomeimportant.
The obvious centre
The Traffic Information Centre, T.I.C., isthe Danish Road Directorate’s trafficmanagement centre – and has been forseveral years. As an independent, publicauthority the T.I.C. is the natural centre ofall necessary information about trafficand the road conditions.
T.I.C.’s integrity and ability to surveythe roads is due to a wide range of diffe-rent sources.
These sources include the driversthemselves – today more than 5,000 pri-vate and professional drivers are listed asthe Danish Road Directorate’s Road-Reporters. Furthermore, T.I.C. employs awide variety of ITS, and cooperates withrescue forces, police and other road-authorities.
Simultaneously, T.I.C. verifies thereceived data before it is passed on asvalid, user-friendly nationwide informa-tion. The media that T.I.C. uses covers abroad spectrum; e.g. internet, teletext,
radio, electronic devices placed in thevehicles and broadcasting news on TV.
Traffic management in the future
Today effective traffic management pri-marily means information. T.I.C. and itsmedia partners make sure that the road-users receive information about e.g. traf-fic jams, accidents, slippery roads, ghostdrivers or when a road is closed to trafficetc.
Due to the change from ‘IntelligentTransport Systems’ to ‘IntelligentTransport Services’, the internationalRoad Administrations will more directlyand actively be able to undertake the roleas coordinating operative traffic managerin the future, e.g. by opening or closing alane, by temporarily diverting traffic intothe emergency lane – as it is done inEngland during rush hour – or by recom-mending inter-modal routes, i.e. routesinvolving several means of transport,when car and public transportation arecombined based on a knowledge on howtraffic is at the moment.
Traffic management has to be anintegrated part of any kind of effort whena traffic accident or bad weather etc. occurs,because the socio-economic consequencesof disrupted traffic flows are far-reaching.It is therefore incumbent on National RoadAdministrations to manage the entireprocess, collecting and disseminating‘pre-trip’and ‘on-trip’ information togetherwith the effective management of theavailable transport infrastructure.
The way forward is clear: trafficmanagement will be of great significancein the future. In other words, trafficmanagement will get closer to reality, tothe road and the individual driver.
The gains to society as a whole – animproved traffic flow on one of our mostimportant arterial roads, the motorway –will be significant. This implies that poli-ce, emergency services, Public TransportOperators and Road Authorities will pooltheir resources and efforts to improve thisvital function. This is to be discussed inDenmark.
Visit our web site:www.vti.se/nordic
PHO
TO:
JOH
NN
Y D
AHLG
REN
24 NORDIC ROAD & TRANSPORT RESEACH NO. 3 2004
DANISH ROAD DIRECTORATE (DRD)
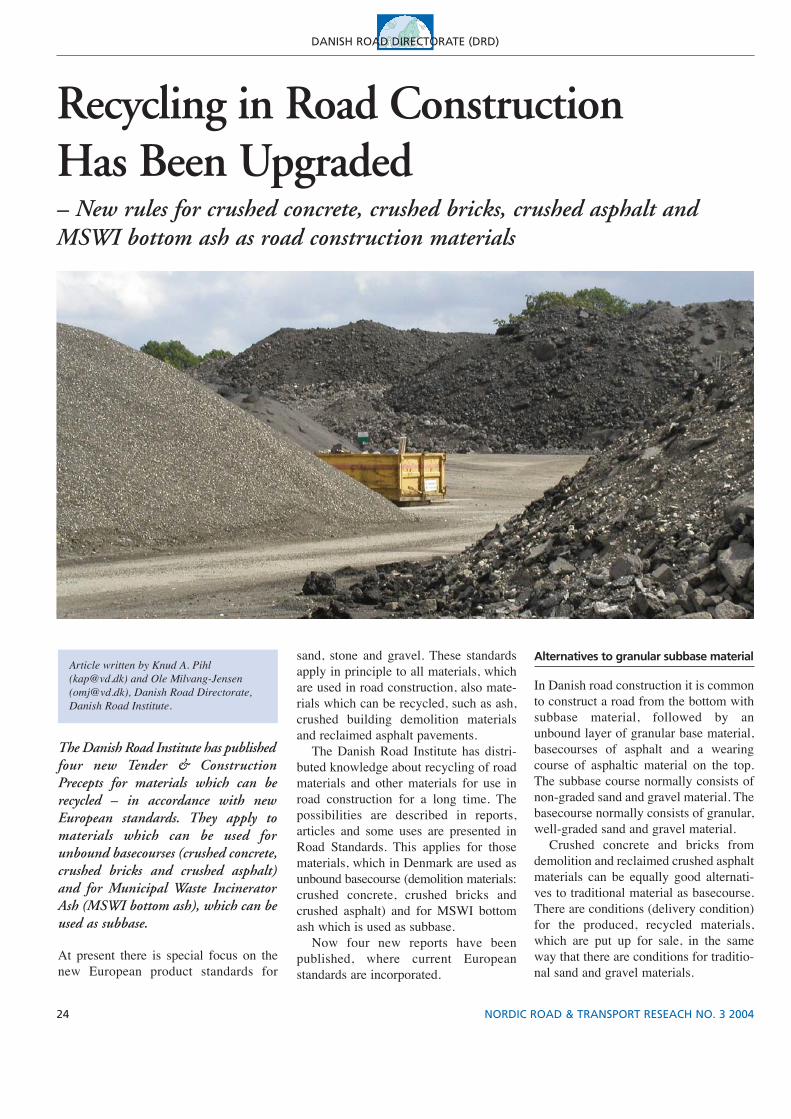
The Danish Road Institute has publishedfour new Tender & ConstructionPrecepts for materials which can berecycled – in accordance with newEuropean standards. They apply tomaterials which can be used forunbound basecourses (crushed concrete,crushed bricks and crushed asphalt)and for Municipal Waste IncineratorAsh (MSWI bottom ash), which can beused as subbase.
At present there is special focus on thenew European product standards for
Article written by Knud A. Pihl([email protected]) and Ole Milvang-Jensen([email protected]), Danish Road Directorate,Danish Road Institute.
sand, stone and gravel. These standardsapply in principle to all materials, whichare used in road construction, also mate-rials which can be recycled, such as ash,crushed building demolition materialsand reclaimed asphalt pavements.
The Danish Road Institute has distri-buted knowledge about recycling of roadmaterials and other materials for use inroad construction for a long time. Thepossibilities are described in reports,articles and some uses are presented inRoad Standards. This applies for thosematerials, which in Denmark are used asunbound basecourse (demolition materials:crushed concrete, crushed bricks andcrushed asphalt) and for MSWI bottomash which is used as subbase.
Now four new reports have beenpublished, where current Europeanstandards are incorporated.
Alternatives to granular subbase material
In Danish road construction it is commonto construct a road from the bottom withsubbase material, followed by anunbound layer of granular base material,basecourses of asphalt and a wearingcourse of asphaltic material on the top.The subbase course normally consists ofnon-graded sand and gravel material. Thebasecourse normally consists of granular,well-graded sand and gravel material.
Crushed concrete and bricks fromdemolition and reclaimed crushed asphaltmaterials can be equally good alternati-ves to traditional material as basecourse.There are conditions (delivery condition)for the produced, recycled materials,which are put up for sale, in the sameway that there are conditions for traditio-nal sand and gravel materials.
Recycling in Road Construction Has Been Upgraded– New rules for crushed concrete, crushed bricks, crushed asphalt and MSWI bottom ash as road construction materials

25NORDIC ROAD & TRANSPORT RESEACH NO. 3 2004
DANISH ROAD DIRECTORATE (DRD)
Electronic versions of the Danish reports can be found on:http://www.vejdirektoratet.dk/publikationer/VIrap133/index.htmhttp://www.vejdirektoratet.dk/publikationer/VIrap132/index.htmhttp://www.vejdirektoratet.dk/publikationer/VIrap131/index.htmhttp://www.vejdirektoratet.dk/publikationer/VIrap130/index.htm
Local administrations can use alterna-tive materials with advantage
Major road constructions require largeamounts of material. This also applies toa number of the alternative materialsmentioned above, which are not availablein large amounts. This makes such deli-veries impossible. Even though several of
levels from heavily trafficked roads tominor roads and footpaths.
Crushed bricks is a useable material asreplacement for granular unbound basematerial on roads, paths and squares withlimited traffic – up to 10 lorries in bothdirections per day. The available amountsof crushed brick are limited.
An alternative to traditional subbasematerial
MSWI bottom ash can often replace sandand gravel materials, which usually areused as subbase material.
MSWI bottom ash has a slightly lesserbearing capacity and does not drain as
the mentioned materials could be usedfor construction of heavily traffickedroads, it can in practice be difficult toobtain them, when necessary.
Alternative materials can therefore beused most advantageously for smallernew constructions and since local admi-nistrations are in charge of smallerconstructions, this seems a good possibilityto use crushed concrete, bricks andasphalt as an alternative in granularunbound base. Prices are controlled bymarket economy, but in general alternativerecycled materials are cheaper thantraditional materials. In Denmark, localadministrations have carried out or haveplanned constructions with use of recycledmaterials.
Crushed concrete can replace granularunbound base material for all types ofroads. Crushed concrete is a good material,which can be superior to unbound granu-lar base material. There are in principle 3classes: High quality called Class A,which has a higher bearing capacity thangranular base material (an E-modulus of400 MPa compared to 300 MPa), so thereis some saving in the other layers in theroad construction. Class B is equal to thebearing capacity of granular base material.Finally there is Class C, which is a littlepoorer in quality than traditional granularbase material.
Crushed asphalt is a correspondinglygood material, which can be equated tounbound base material for use in all
well as a traditional good subbase of sandand gravel materials. There are certainlimitations in the use of MSWI bottom ash.Firstly, the ash should not be used on heavilytrafficked roads (i.e. roads with more than400 lorries per day in total in both direc-tions). Secondly, if the subgrade is waterexposed, there are also certain restrictions.
Environmental regulations
Ordinary environmental and work regu-lations apply for construction work.Particularly for MSWI bottom ash, theremay be difficulties in obtaining environ-mental permissions due to ground waterinterests in the area, where the road, pathor square should be constructed.
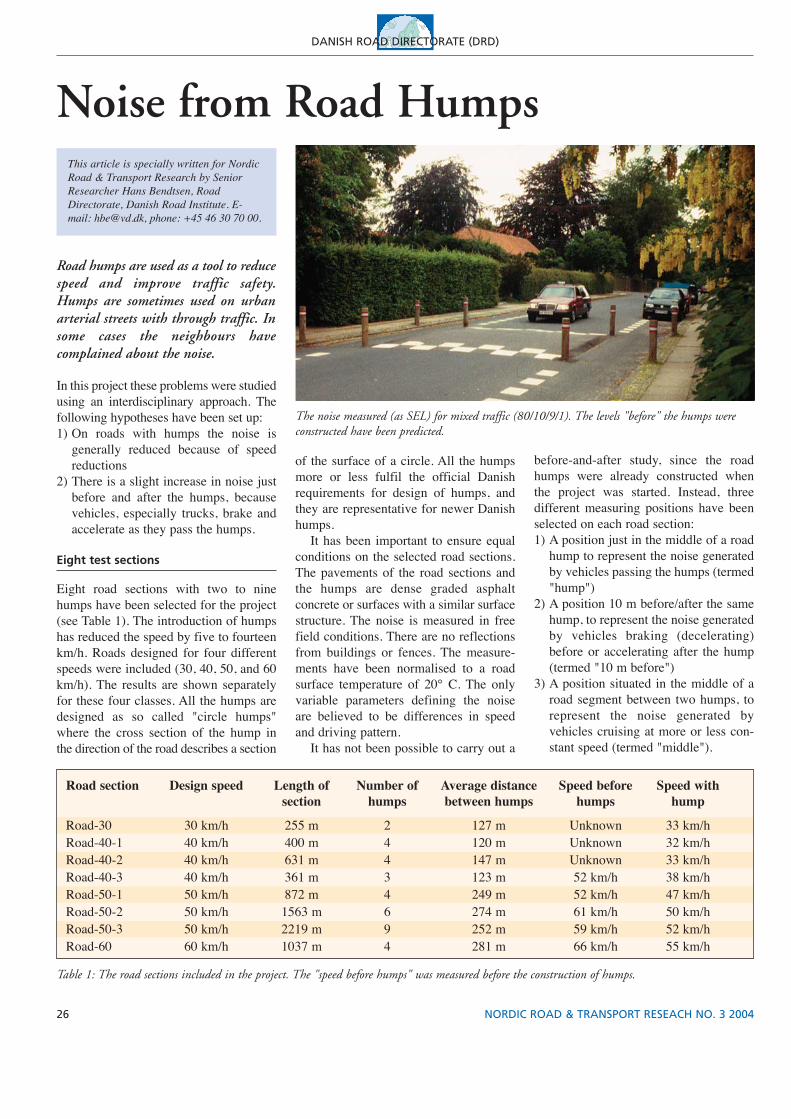
26 NORDIC ROAD & TRANSPORT RESEACH NO. 3 2004
DANISH ROAD DIRECTORATE (DRD)
Road section Design speed Length of Number of Average distance Speed before Speed with section humps between humps humps hump
Road-30 30 km/h 255 m 2 127 m Unknown 33 km/hRoad-40-1 40 km/h 400 m 4 120 m Unknown 32 km/hRoad-40-2 40 km/h 631 m 4 147 m Unknown 33 km/hRoad-40-3 40 km/h 361 m 3 123 m 52 km/h 38 km/hRoad-50-1 50 km/h 872 m 4 249 m 52 km/h 47 km/hRoad-50-2 50 km/h 1563 m 6 274 m 61 km/h 50 km/hRoad-50-3 50 km/h 2219 m 9 252 m 59 km/h 52 km/hRoad-60 60 km/h 1037 m 4 281 m 66 km/h 55 km/h
Noise from Road HumpsThis article is specially written for NordicRoad & Transport Research by SeniorResearcher Hans Bendtsen, RoadDirectorate, Danish Road Institute. E-mail: [email protected], phone: +45 46 30 70 00.
Road humps are used as a tool to reducespeed and improve traffic safety.Humps are sometimes used on urbanarterial streets with through traffic. Insome cases the neighbours havecomplained about the noise.
In this project these problems were studiedusing an interdisciplinary approach. Thefollowing hypotheses have been set up:1) On roads with humps the noise is
generally reduced because of speedreductions
2) There is a slight increase in noise justbefore and after the humps, becausevehicles, especially trucks, brake andaccelerate as they pass the humps.
Eight test sections
Eight road sections with two to ninehumps have been selected for the project(see Table 1). The introduction of humpshas reduced the speed by five to fourteenkm/h. Roads designed for four differentspeeds were included (30, 40, 50, and 60km/h). The results are shown separatelyfor these four classes. All the humps aredesigned as so called "circle humps"where the cross section of the hump inthe direction of the road describes a section
The noise measured (as SEL) for mixed traffic (80/10/9/1). The levels "before" the humps wereconstructed have been predicted.
Table 1: The road sections included in the project. The "speed before humps" was measured before the construction of humps.
of the surface of a circle. All the humpsmore or less fulfil the official Danishrequirements for design of humps, andthey are representative for newer Danishhumps.
It has been important to ensure equalconditions on the selected road sections.The pavements of the road sections andthe humps are dense graded asphaltconcrete or surfaces with a similar surfacestructure. The noise is measured in freefield conditions. There are no reflectionsfrom buildings or fences. The measure-ments have been normalised to a roadsurface temperature of 20° C. The onlyvariable parameters defining the noiseare believed to be differences in speedand driving pattern.
It has not been possible to carry out a
before-and-after study, since the roadhumps were already constructed whenthe project was started. Instead, threedifferent measuring positions have beenselected on each road section:1) A position just in the middle of a road
hump to represent the noise generatedby vehicles passing the humps (termed"hump")
2) A position 10 m before/after the samehump, to represent the noise generatedby vehicles braking (decelerating)before or accelerating after the hump(termed "10 m before")
3) A position situated in the middle of aroad segment between two humps, torepresent the noise generated byvehicles cruising at more or less con-stant speed (termed "middle").
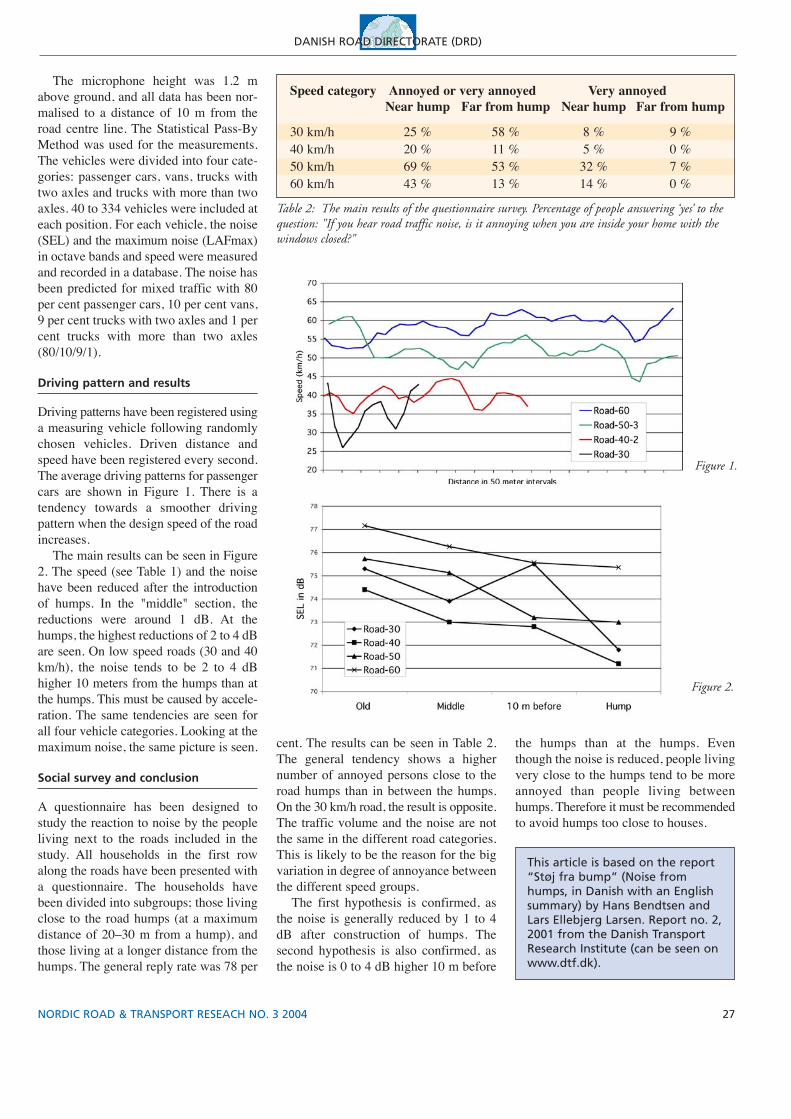
27NORDIC ROAD & TRANSPORT RESEACH NO. 3 2004
This article is based on the report“Støj fra bump” (Noise fromhumps, in Danish with an Englishsummary) by Hans Bendtsen andLars Ellebjerg Larsen. Report no. 2,2001 from the Danish TransportResearch Institute (can be seen onwww.dtf.dk).
Speed category Annoyed or very annoyed Very annoyedNear hump Far from hump Near hump Far from hump
30 km/h 25 % 58 % 8 % 9 %40 km/h 20 % 11 % 5 % 0 %50 km/h 69 % 53 % 32 % 7 %60 km/h 43 % 13 % 14 % 0 %
The microphone height was 1.2 mabove ground, and all data has been nor-malised to a distance of 10 m from theroad centre line. The Statistical Pass-ByMethod was used for the measurements.The vehicles were divided into four cate-gories: passenger cars, vans, trucks withtwo axles and trucks with more than twoaxles. 40 to 334 vehicles were included ateach position. For each vehicle, the noise(SEL) and the maximum noise (LAFmax)in octave bands and speed were measuredand recorded in a database. The noise hasbeen predicted for mixed traffic with 80per cent passenger cars, 10 per cent vans,9 per cent trucks with two axles and 1 percent trucks with more than two axles(80/10/9/1).
Driving pattern and results
Driving patterns have been registered usinga measuring vehicle following randomlychosen vehicles. Driven distance andspeed have been registered every second.The average driving patterns for passengercars are shown in Figure 1. There is atendency towards a smoother drivingpattern when the design speed of the roadincreases.
The main results can be seen in Figure2. The speed (see Table 1) and the noisehave been reduced after the introductionof humps. In the "middle" section, thereductions were around 1 dB. At thehumps, the highest reductions of 2 to 4 dBare seen. On low speed roads (30 and 40km/h), the noise tends to be 2 to 4 dBhigher 10 meters from the humps than atthe humps. This must be caused by accele-ration. The same tendencies are seen forall four vehicle categories. Looking at themaximum noise, the same picture is seen.
Social survey and conclusion
A questionnaire has been designed tostudy the reaction to noise by the peopleliving next to the roads included in thestudy. All households in the first rowalong the roads have been presented witha questionnaire. The households havebeen divided into subgroups; those livingclose to the road humps (at a maximumdistance of 20–30 m from a hump), andthose living at a longer distance from thehumps. The general reply rate was 78 per
cent. The results can be seen in Table 2.The general tendency shows a highernumber of annoyed persons close to theroad humps than in between the humps.On the 30 km/h road, the result is opposite.The traffic volume and the noise are notthe same in the different road categories.This is likely to be the reason for the bigvariation in degree of annoyance betweenthe different speed groups.
The first hypothesis is confirmed, asthe noise is generally reduced by 1 to 4dB after construction of humps. Thesecond hypothesis is also confirmed, asthe noise is 0 to 4 dB higher 10 m before
the humps than at the humps. Eventhough the noise is reduced, people livingvery close to the humps tend to be moreannoyed than people living betweenhumps. Therefore it must be recommendedto avoid humps too close to houses.
Table 2: The main results of the questionnaire survey. Percentage of people answering ‘yes’ to thequestion: "If you hear road traffic noise, is it annoying when you are inside your home with thewindows closed?"
DANISH ROAD DIRECTORATE (DRD)
Figure 1.
Figure 2.
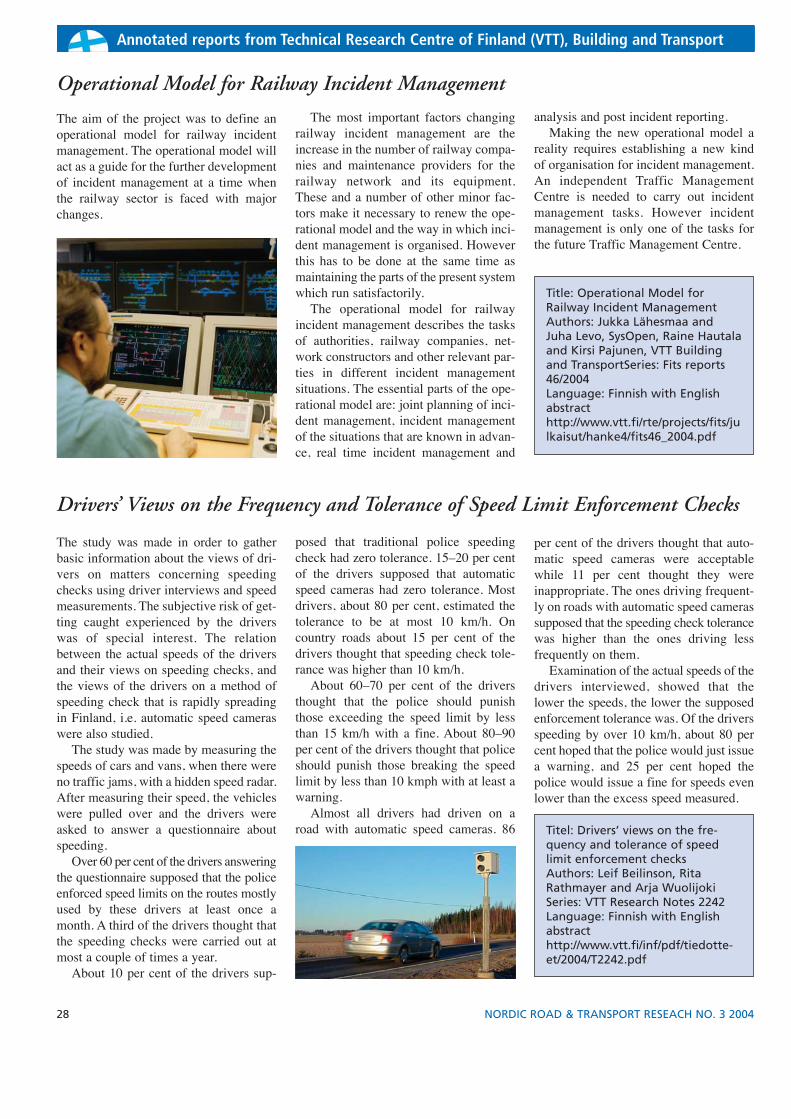
28 NORDIC ROAD & TRANSPORT RESEACH NO. 3 2004
Operational Model for Railway Incident Management
Annotated reports from Technical Research Centre of Finland (VTT), Building and Transport
The aim of the project was to define anoperational model for railway incidentmanagement. The operational model willact as a guide for the further developmentof incident management at a time whenthe railway sector is faced with majorchanges.
The most important factors changingrailway incident management are theincrease in the number of railway compa-nies and maintenance providers for therailway network and its equipment.These and a number of other minor fac-tors make it necessary to renew the ope-rational model and the way in which inci-dent management is organised. Howeverthis has to be done at the same time asmaintaining the parts of the present systemwhich run satisfactorily.
The operational model for railwayincident management describes the tasksof authorities, railway companies, net-work constructors and other relevant par-ties in different incident managementsituations. The essential parts of the ope-rational model are: joint planning of inci-dent management, incident managementof the situations that are known in advan-ce, real time incident management and
analysis and post incident reporting.Making the new operational model a
reality requires establishing a new kindof organisation for incident management.An independent Traffic ManagementCentre is needed to carry out incidentmanagement tasks. However incidentmanagement is only one of the tasks forthe future Traffic Management Centre.
Drivers’ Views on the Frequency and Tolerance of Speed Limit Enforcement Checks
The study was made in order to gatherbasic information about the views of dri-vers on matters concerning speedingchecks using driver interviews and speedmeasurements. The subjective risk of get-ting caught experienced by the driverswas of special interest. The relationbetween the actual speeds of the driversand their views on speeding checks, andthe views of the drivers on a method ofspeeding check that is rapidly spreadingin Finland, i.e. automatic speed cameraswere also studied.
The study was made by measuring thespeeds of cars and vans, when there wereno traffic jams, with a hidden speed radar.After measuring their speed, the vehicleswere pulled over and the drivers wereasked to answer a questionnaire aboutspeeding.
Over 60 per cent of the drivers answeringthe questionnaire supposed that the policeenforced speed limits on the routes mostlyused by these drivers at least once amonth. A third of the drivers thought thatthe speeding checks were carried out atmost a couple of times a year.
About 10 per cent of the drivers sup-
posed that traditional police speedingcheck had zero tolerance. 15–20 per centof the drivers supposed that automaticspeed cameras had zero tolerance. Mostdrivers, about 80 per cent, estimated thetolerance to be at most 10 km/h. Oncountry roads about 15 per cent of thedrivers thought that speeding check tole-rance was higher than 10 km/h.
About 60–70 per cent of the driversthought that the police should punishthose exceeding the speed limit by lessthan 15 km/h with a fine. About 80–90per cent of the drivers thought that policeshould punish those breaking the speedlimit by less than 10 kmph with at least awarning.
Almost all drivers had driven on aroad with automatic speed cameras. 86
per cent of the drivers thought that auto-matic speed cameras were acceptablewhile 11 per cent thought they wereinappropriate. The ones driving frequent-ly on roads with automatic speed camerassupposed that the speeding check tolerancewas higher than the ones driving lessfrequently on them.
Examination of the actual speeds of thedrivers interviewed, showed that thelower the speeds, the lower the supposedenforcement tolerance was. Of the driversspeeding by over 10 km/h, about 80 percent hoped that the police would just issuea warning, and 25 per cent hoped thepolice would issue a fine for speeds evenlower than the excess speed measured.
Titel: Drivers’ views on the fre-quency and tolerance of speedlimit enforcement checksAuthors: Leif Beilinson, RitaRathmayer and Arja WuolijokiSeries: VTT Research Notes 2242Language: Finnish with Englishabstracthttp://www.vtt.fi/inf/pdf/tiedotte-et/2004/T2242.pdf
Title: Operational Model forRailway Incident ManagementAuthors: Jukka Lähesmaa andJuha Levo, SysOpen, Raine Hautalaand Kirsi Pajunen, VTT Buildingand TransportSeries: Fits reports46/2004Language: Finnish with Englishabstracthttp://www.vtt.fi/rte/projects/fits/julkaisut/hanke4/fits46_2004.pdf

29NORDIC ROAD & TRANSPORT RESEACH NO. 3 2004
Annotated reports from Annotated reports from
Safety Measures Targeted at Older Drivers Are Beneficial for All Drivers
The proportion of senior citizens (aged65+) will increase from about 15 per centin the year 2000 to about 30 per cent inthe year 2050. The share of older driversin the driving population will grow evenfaster because of the increasing numberof driving licence holders among the age-ing population.
Generally speaking, safety measurestargeted at older drivers are beneficial forall drivers. In the present report, measu-res are described that focus on the dri-vers, on the traffic environment, onvehicles and on ITS applications.
The aim of the present report is to pro-vide a review of older drivers, with specialemphasis on older drivers’ safety andmobility needs. The report focuses on theissues of older driver population hetero-geneity, infrastructure developments, andon the even older drivers (aged 75+). Aneffort is also made to forecast someexpected changes in the transportationsystem and in the population of olderdrivers.
Conclusions and recommendations:
1) Older drivers as a group drive just assafely as younger experienced drivers
2) Older drivers do not constitute anincreased risk for their fellow road-users
3) Screening of drivers of a certain age isnot an effective measure for increasingtraffic safety
4) When older drivers are involved in anaccident they run a higher risk of beingseriously injured or killed compared toyounger age groups. This is due togreater fragility related to their age
5) Compared to other modes of transpor-tation, driving is also for old drivers
6) Traffic safety should be viewed from apublic health perspective in order tobalance the legitimate demands ofageing citizens concerning both mobi-lity and safety
7) The mobility of the aging citizens whodrive can be improved by supportingthe continuation of driving especiallyfor old women as well as by improvingthe design of cars and roads.
Title: Older drivers – a reviewAuthors: Liisa Hakamies-Blomqvist,Anu Sirén and Ragnhild DavidseSeries; VTI rapport 497ALanguage: EnglishThe report is also available as apdf file on www.vti.se/ Publications.
Annotated reports from the Swedish National Road and Transport Research Institute, VTI
PHO
TO:
THO
R B
ALK
HED
/BIL
DAM
EDIA
The Effects of Speed and Side Acceleration Related to the Location of the Centre ofRotation for Banking of Sharp Curves
Sharp curves constitute a significant safe-ty risk. The question is whether it is pos-sible to design sharp curves in such a waythat drivers take themwith greater margins ofsafety. In this work itwas studied whether thedrivers’ choice of speedand side accelerationwould change with thelocation of the centre ofrotation for banking ofsharp curves.
The influence of trai-ning was also studied.
The study was carriedout in VTI’s drivingsimulator (Model I).
The results show firstly that the loca-tion of the centre of rotation for bankingof sharp curves influenced the drivers’
choice of speed and side acceleration andsecondly that these results were notinfluenced by training.
Title: The effects of speed and sideacceleration related to the loca-tion of the centre of rotation forbanking of sharp curves, and theinfluence of training – an experi-ment in a driving simulator.Authors: Gabriel Helmers and JanTörnrosSeries: VTI meddelande 967Language: Swedish with Englishsummary The report is also available as apdf file on www.vti.se/ Publications.
PHO
TO:
GAB
RIE
L H
ELM
ERS
/VTI
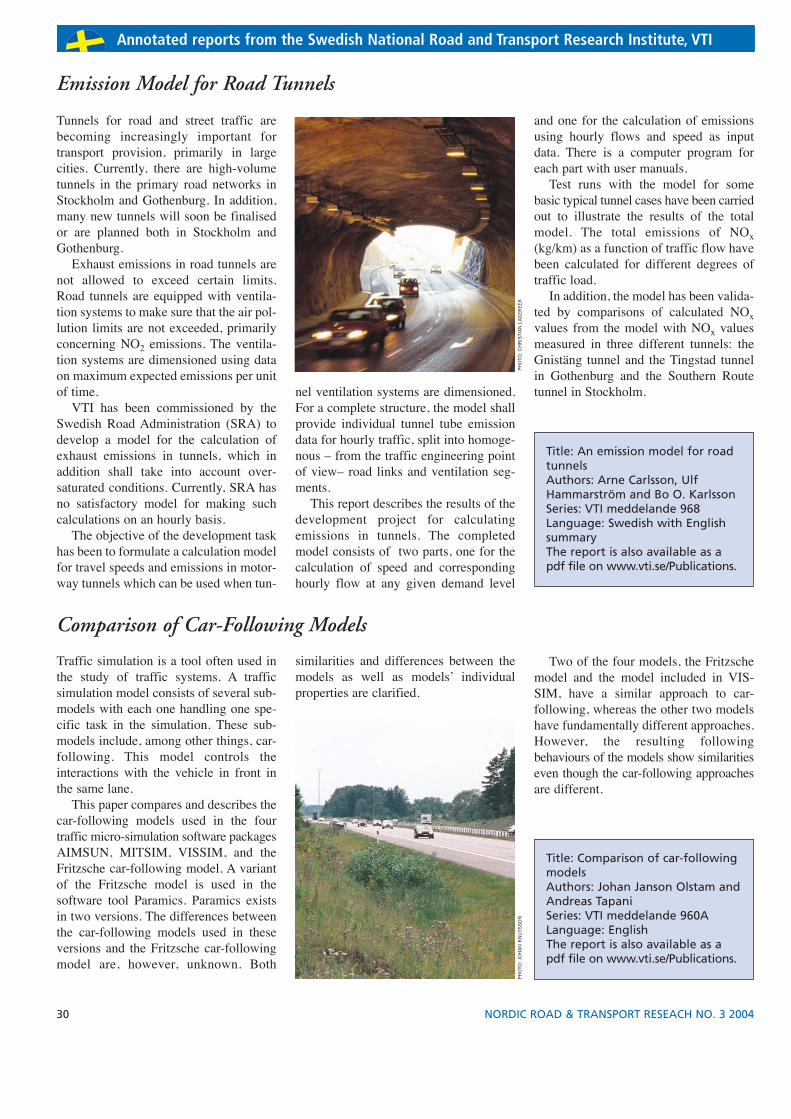
Annotated reports from
30 NORDIC ROAD & TRANSPORT RESEACH NO. 3 2004
Annotated reports from Annotated reports from Annotated reports from Annotated reports from Annotated reports from the Swedish National Road and Transport Research Institute, VTI
Emission Model for Road Tunnels
Tunnels for road and street traffic arebecoming increasingly important fortransport provision, primarily in largecities. Currently, there are high-volumetunnels in the primary road networks inStockholm and Gothenburg. In addition,many new tunnels will soon be finalisedor are planned both in Stockholm andGothenburg.
Exhaust emissions in road tunnels arenot allowed to exceed certain limits.Road tunnels are equipped with ventila-tion systems to make sure that the air pol-lution limits are not exceeded, primarilyconcerning NO2 emissions. The ventila-tion systems are dimensioned using dataon maximum expected emissions per unitof time.
VTI has been commissioned by theSwedish Road Administration (SRA) todevelop a model for the calculation ofexhaust emissions in tunnels, which inaddition shall take into account over-saturated conditions. Currently, SRA hasno satisfactory model for making suchcalculations on an hourly basis.
The objective of the development taskhas been to formulate a calculation modelfor travel speeds and emissions in motor-way tunnels which can be used when tun-
nel ventilation systems are dimensioned.For a complete structure, the model shallprovide individual tunnel tube emissiondata for hourly traffic, split into homoge-nous – from the traffic engineering pointof view– road links and ventilation seg-ments.
This report describes the results of thedevelopment project for calculatingemissions in tunnels. The completedmodel consists of two parts, one for thecalculation of speed and correspondinghourly flow at any given demand level
and one for the calculation of emissionsusing hourly flows and speed as inputdata. There is a computer program foreach part with user manuals.
Test runs with the model for somebasic typical tunnel cases have been carriedout to illustrate the results of the totalmodel. The total emissions of NOx(kg/km) as a function of traffic flow havebeen calculated for different degrees oftraffic load.
In addition, the model has been valida-ted by comparisons of calculated NOxvalues from the model with NOx valuesmeasured in three different tunnels: theGnistäng tunnel and the Tingstad tunnelin Gothenburg and the Southern Routetunnel in Stockholm.
Title: An emission model for roadtunnelsAuthors: Arne Carlsson, UlfHammarström and Bo O. KarlssonSeries: VTI meddelande 968Language: Swedish with EnglishsummaryThe report is also available as apdf file on www.vti.se/Publications.
Title: Comparison of car-followingmodelsAuthors: Johan Janson Olstam andAndreas TapaniSeries: VTI meddelande 960ALanguage: English The report is also available as apdf file on www.vti.se/Publications.
Traffic simulation is a tool often used inthe study of traffic systems. A trafficsimulation model consists of several sub-models with each one handling one spe-cific task in the simulation. These sub-models include, among other things, car-following. This model controls theinteractions with the vehicle in front inthe same lane.
This paper compares and describes thecar-following models used in the fourtraffic micro-simulation software packagesAIMSUN, MITSIM, VISSIM, and theFritzsche car-following model. A variantof the Fritzsche model is used in thesoftware tool Paramics. Paramics existsin two versions. The differences betweenthe car-following models used in theseversions and the Fritzsche car-followingmodel are, however, unknown. Both
similarities and differences between themodels as well as models’ individualproperties are clarified.
Comparison of Car-Following Models
Two of the four models, the Fritzschemodel and the model included in VIS-SIM, have a similar approach to car-following, whereas the other two modelshave fundamentally different approaches.However, the resulting followingbehaviours of the models show similaritieseven though the car-following approachesare different.
PHO
TO:
JOH
AN K
NU
TSS
ON
PHO
TO:
CH
RIS
TIAN
LAG
EREE
K
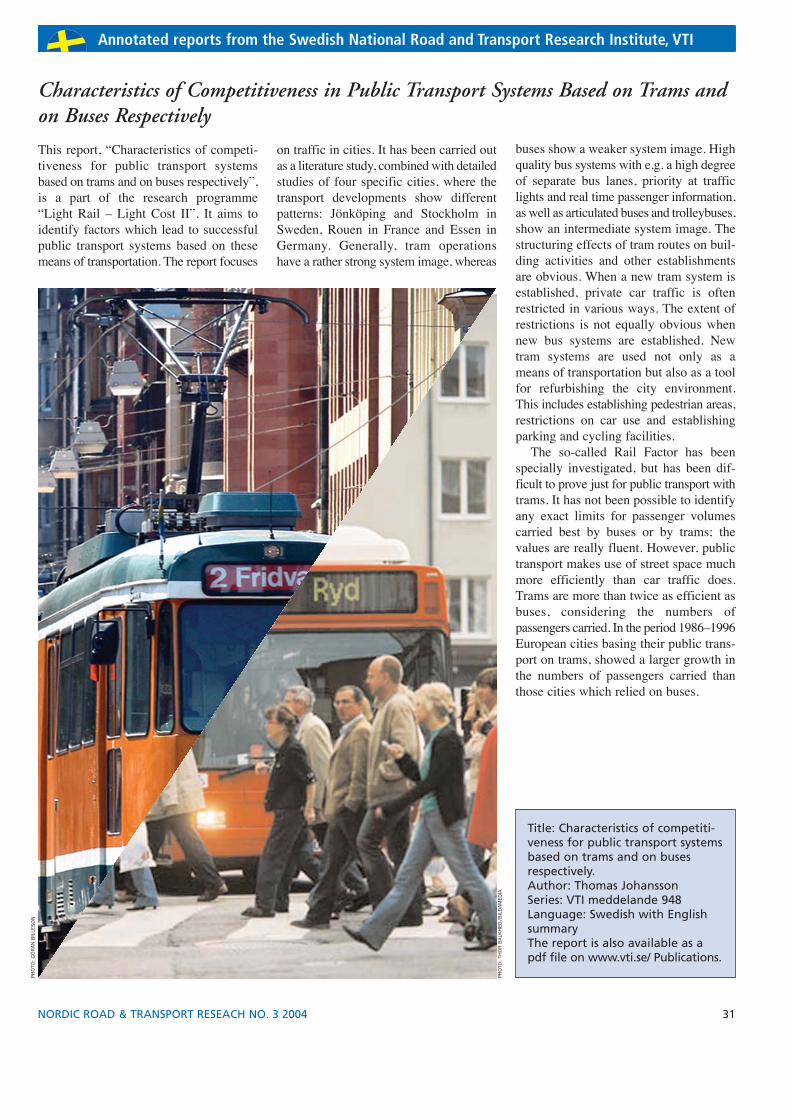
Annotated reports from the Swedish National Road and Transport Research Institute, VTI
This report, “Characteristics of competi-tiveness for public transport systemsbased on trams and on buses respectively”,is a part of the research programme“Light Rail – Light Cost II”. It aims toidentify factors which lead to successfulpublic transport systems based on thesemeans of transportation. The report focuses
on traffic in cities. It has been carried outas a literature study, combined with detailedstudies of four specific cities, where thetransport developments show differentpatterns: Jönköping and Stockholm inSweden, Rouen in France and Essen inGermany. Generally, tram operationshave a rather strong system image, whereas
buses show a weaker system image. Highquality bus systems with e.g. a high degreeof separate bus lanes, priority at trafficlights and real time passenger information,as well as articulated buses and trolleybuses,show an intermediate system image. Thestructuring effects of tram routes on buil-ding activities and other establishmentsare obvious. When a new tram system isestablished, private car traffic is oftenrestricted in various ways. The extent ofrestrictions is not equally obvious whennew bus systems are established. Newtram systems are used not only as ameans of transportation but also as a toolfor refurbishing the city environment.This includes establishing pedestrian areas,restrictions on car use and establishingparking and cycling facilities.
The so-called Rail Factor has beenspecially investigated, but has been dif-ficult to prove just for public transport withtrams. It has not been possible to identifyany exact limits for passenger volumescarried best by buses or by trams; thevalues are really fluent. However, publictransport makes use of street space muchmore efficiently than car traffic does.Trams are more than twice as efficient asbuses, considering the numbers ofpassengers carried. In the period 1986–1996European cities basing their public trans-port on trams, showed a larger growth inthe numbers of passengers carried thanthose cities which relied on buses.
Characteristics of Competitiveness in Public Transport Systems Based on Trams andon Buses Respectively
Title: Characteristics of competiti-veness for public transport systemsbased on trams and on busesrespectively.Author: Thomas JohanssonSeries: VTI meddelande 948Language: Swedish with EnglishsummaryThe report is also available as apdf file on www.vti.se/ Publications.
PHO
TO:
GÖ
RAN
BIL
LES
ON
PHO
TO:
THO
R B
ALK
HED
/BIL
DAM
EDIA
31NORDIC ROAD & TRANSPORT RESEACH NO. 3 2004
Denmark
Norway
Finland
Norway
Iceland
Sweden
Helen Hasz-SinghDanish Road InstituteP.O. Box 235DK-4000 RoskildePhone: +45 46 30 70 00Fax: +45 46 30 71 05E-mail: [email protected] site: www.vd.dk
Harald AasInstitute of Transport Economics(TØI)P.O. Box 6110 EtterstadN-0602 OsloPhone: +47 22 57 38 00Fax: +47 22 57 02 90E-mail: [email protected] site: www.toi.no
Kari MäkeläVTT Building and TransportP.O. Box 1800FIN-02044 VTTPhone: +358 9 45 64 586Fax: +358 9 46 48 50E-mail: [email protected] site: www.vtt.fi/rte/indexe.html
Hreinn HaraldssonPublic Road AdministrationBorgartún 7IS-105 ReykjavikPhone: +354 563 1400Fax: +354 562 2332E-mail: [email protected] site: www.vegagerdin.is
Thorbjørn Chr. RisanNorwegian Public RoadsAdministrationP.O. Box 8142 DepN-0033 OsloPhone: +47 73 95 46 48Fax: +47 73 95 46 31E-mail: [email protected] site: www.vegvesen.no
Tarja MagnussonSwedish National Road andTransport Research Institute (VTI)SE-581 95 LinköpingPhone: +46 13 20 42 15Fax: +46 13 14 14 36E-mail: [email protected] site: www.vti.se
Questions concerning the content of the articles, or orders for the publications referred to, should be directed to the publishing institution, see addresses below.
REQUEST FOR BACK ISSUES, AND NOTIFICATION OF ADDRESS CHANGES.Readers outside the Nordic countries: see Swedish address.
Readers in the Nordic countries: see addresses below.
Web site: www.vti.se/nordic