Embed Size (px)
Citation preview
• This presentation is only directed towards investment professionals, and the fund(s) are only available to them. Any person who do not have professional experience in matters relating to investments should not rely on this information.
• Historical returns are no guarantee for future returns. Future returns will depend, inter alia, on market developments, the fund manager’s skill, the fund’s risk profile and subscription and management fees. The return may become negative as a result of negative price developments.
• Pareto Forvaltning seeks to the best of its ability to ensure that all information given is correct, however, makes reservations regarding possible errors and omissions. Statements in the report may reflect the portfolio managers’ viewpoint at a given time, and this viewpoint may be changed without prior notice. The distribution of this information may be restricted by law in certain jurisdictions and this information is not intended for distribution to any person or entity in such jurisdiction.
• This presentation should not be perceived as an offer or recommendation to buy or sell financial instruments. Pareto Forvaltning does not assume responsibility for direct or indirect loss or expenses incurred through use or understanding of the presentation.
• Subscription and redemption fees are not taken into account in the historical performance given for our funds, this could affect the return adversely.
• Unless otherwise stated, the performance information given does not take into account any tax that may be incumbent on the product and / or customer. The tax treatment of the funds depends on the personal circumstances of each client and can be subject to future changes.
• Expectations of future performance should not be used as a reliable indicator of future performance. Such expectations do not take into account the effects of inflation and taxes, which will have a negative impact in real terms.
• In preparing this document we have relied upon and assumed, without independent verification, the accuracy and completeness of all information available from public sources or which was provided to us or otherwise reviewed by us. The information contained in this document has been taken from sources deemed to be reliable. We do not represent that such information is accurate or complete and it should not be relied on as such. Any opinions expressed herein reflect our judgment at this date, all of which are accordingly subject to change. Pareto Forvaltning AS accepts no liability whatsoever for any direct, indirect or consequential loss arising from the use of this document or its contents.
• The fund's KIID, prospectus, annual and semi-annual reports are available from www.paretoforvaltning.no/Rapporter (choose En for reports in English). For KIID documents in Swedish and German go to Customer information.
• Financial information and information about management and control is available from https://www.paretoforvaltning.no/Kundeinformasjon (choose En; General information; Pillar 3).
• Reference to Pareto Global Corporate Bond, means a fund under establishment, subject to CSSF approval, under the Luxembourg umbrella Pareto SICAV.
• Employees of Pareto Forvaltning AS have holdings in the fund(s) described herein.
• Pareto asset management is used as a description, the company name is Pareto Forvaltning AS.
• The source is Pareto Forvaltning unless otherwise stated. Read more about us, our products and risks associated with financial instruments on our website www.paretoforvaltning.no.
• Pareto Forvaltning has signed the United Nations-supported Principles of Responsible Investments (PRI) that include general guidelines for social responsibilities. Read more about PRI and the six principles here: http://www.unpri.org/about-pri/the-six-principles/
Disclaimer | 2
Variable net bias Long/Short Equity funds
Nordic Alpha - $ 150m – Sep 2003
– UCITS version 60m
– Offshore 90m
Nordic Omega - $ 30m – Dec 2005
– Only offshore
– Same investment approach as Nordic Alpha, but focus on small-caps
3
The Nordic economies
Population 27m
GDP $ 1700bn (43k p.c., all above Germany and the UK)
High level of education and R&D
Strong fiscal balances
Good demographics
Flexible labour markets
Open economies = continuous competitive pressures
Total market cap $ 1600bn
Highest density of top-return on capital companies
| 4
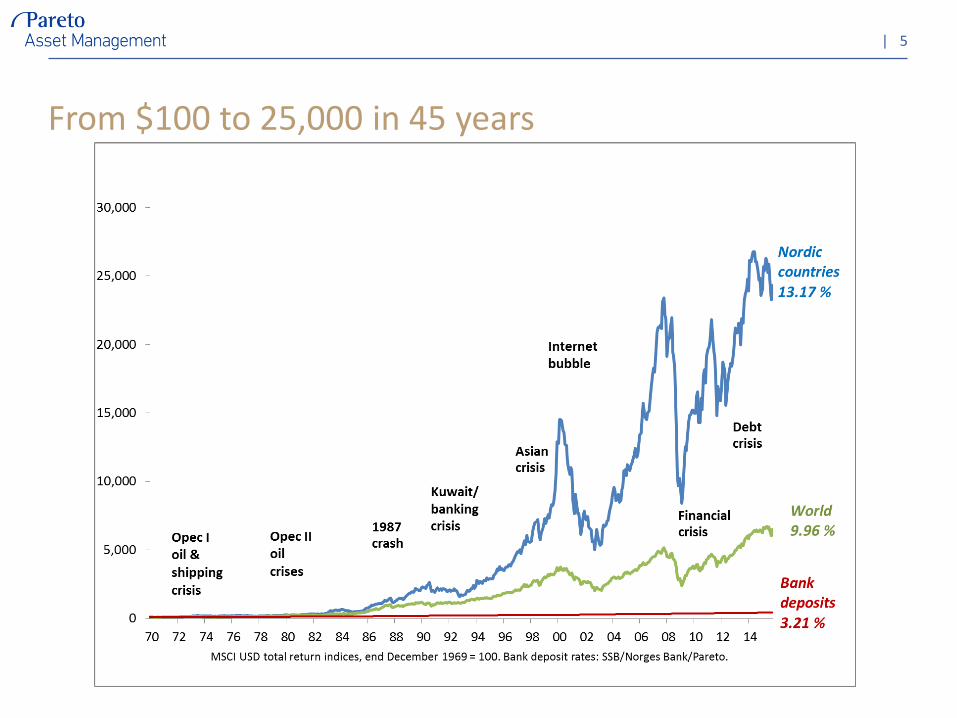
From $100 to 25,000 in 45 years
| 5
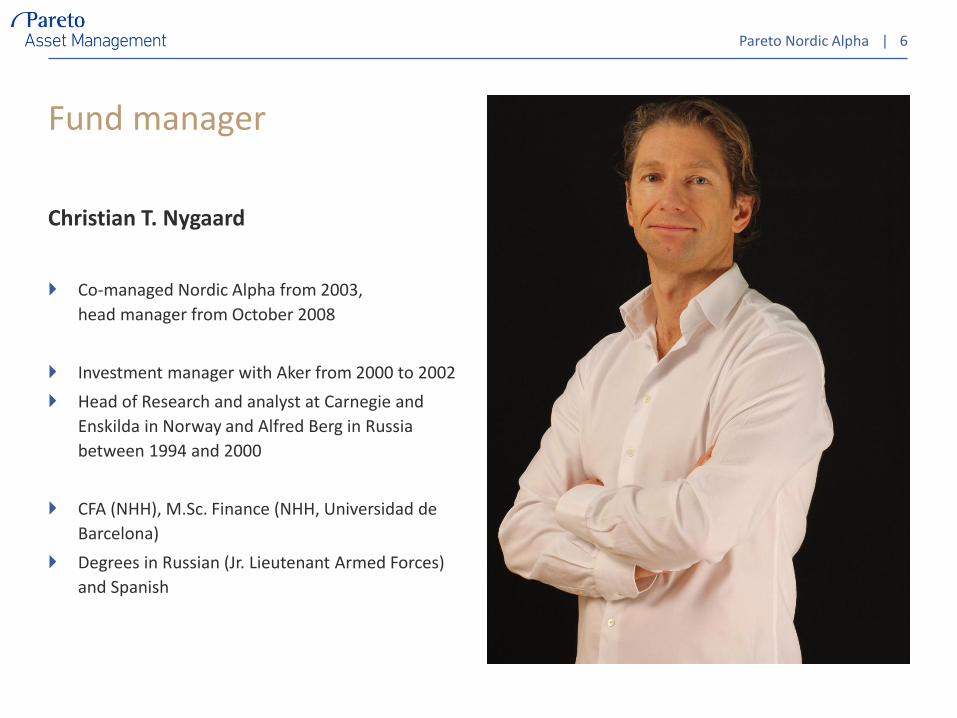
Fund manager
Christian T. Nygaard
Co-managed Nordic Alpha from 2003,
head manager from October 2008
Investment manager with Aker from 2000 to 2002
Head of Research and analyst at Carnegie and
Enskilda in Norway and Alfred Berg in Russia
between 1994 and 2000
CFA (NHH), M.Sc. Finance (NHH, Universidad de
Barcelona)
Degrees in Russian (Jr. Lieutenant Armed Forces)
and Spanish
| 6Pareto Nordic Alpha
Award nominations
| 7
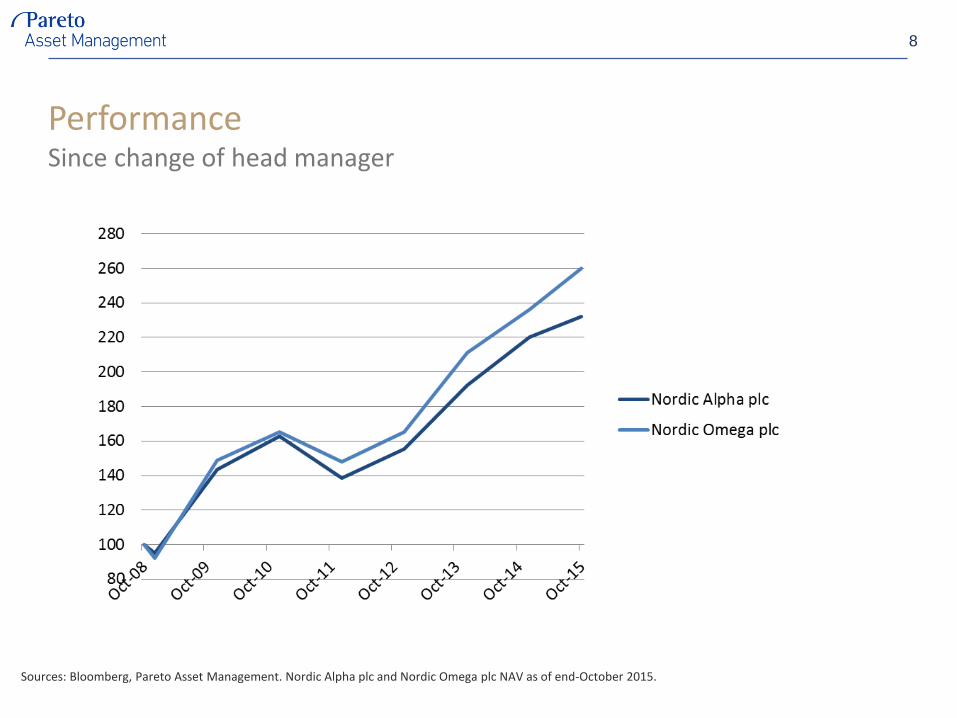
Performance
8
Sources: Bloomberg, Pareto Asset Management. Nordic Alpha plc and Nordic Omega plc NAV as of end-October 2015.
Since change of head manager
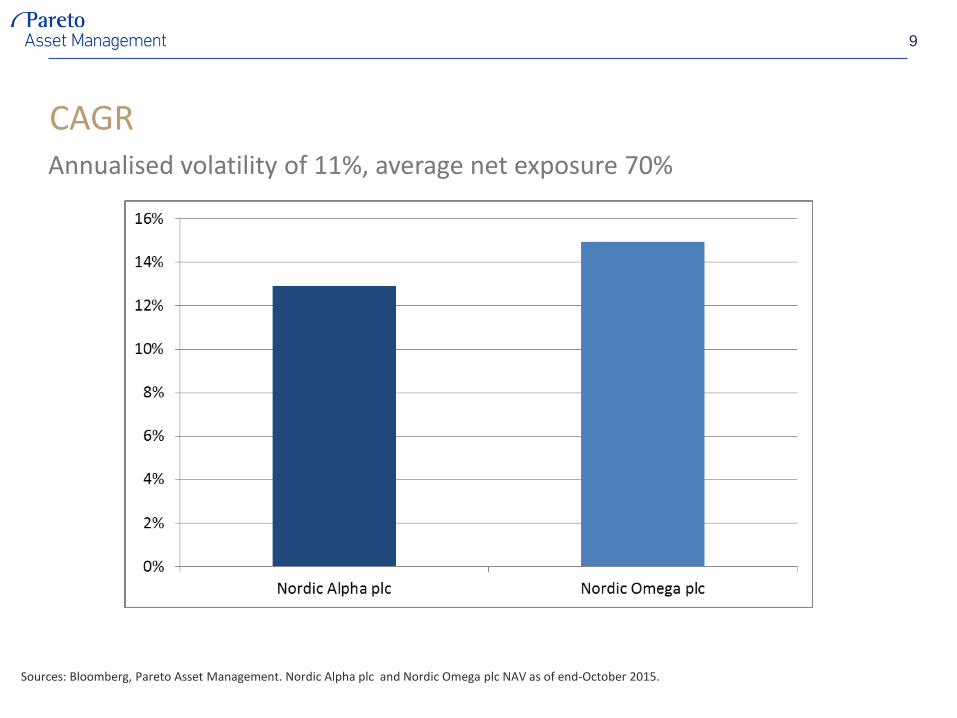
CAGRAnnualised volatility of 11%, average net exposure 70%
9
Sources: Bloomberg, Pareto Asset Management. Nordic Alpha plc and Nordic Omega plc NAV as of end-October 2015.
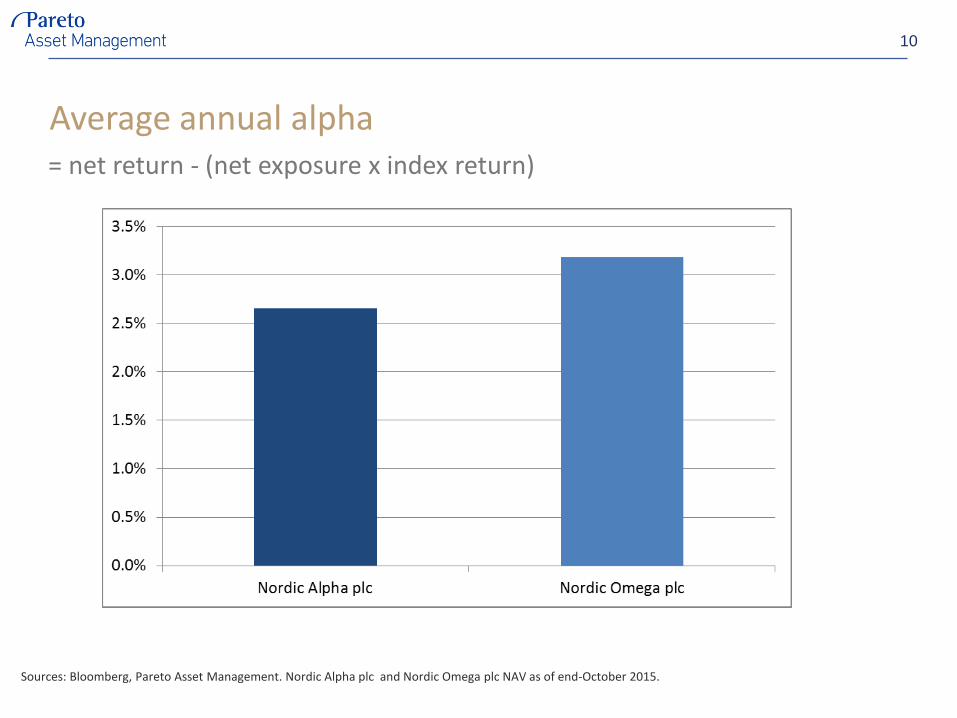
Average annual alpha= net return - (net exposure x index return)
10
Sources: Bloomberg, Pareto Asset Management. Nordic Alpha plc and Nordic Omega plc NAV as of end-October 2015.
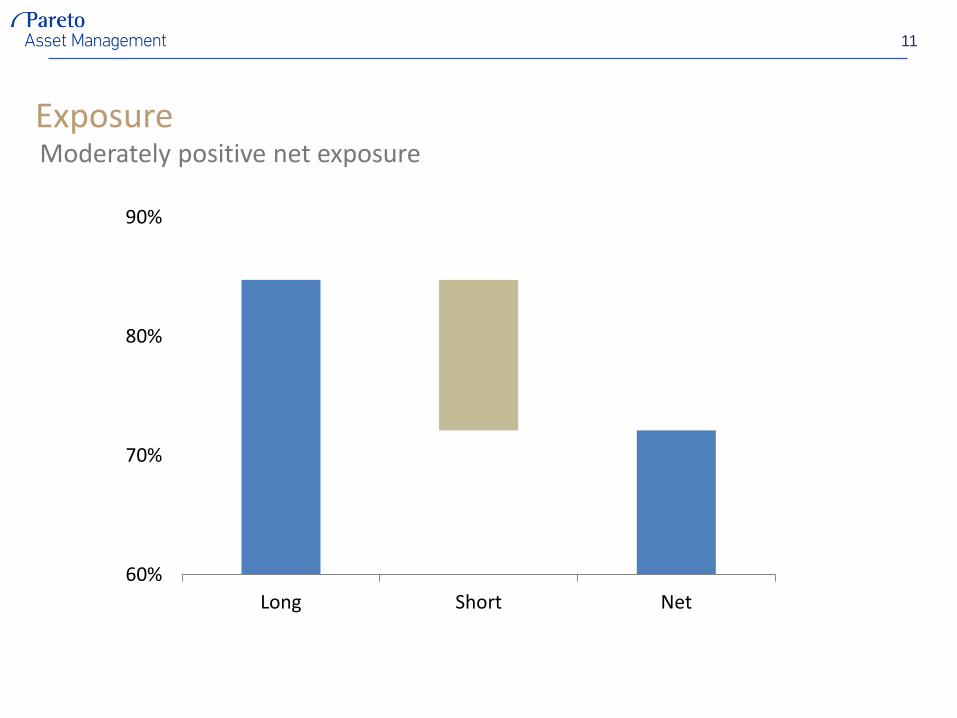
Exposure
11
Moderately positive net exposure
60%
70%
80%
90%
Long Short Net
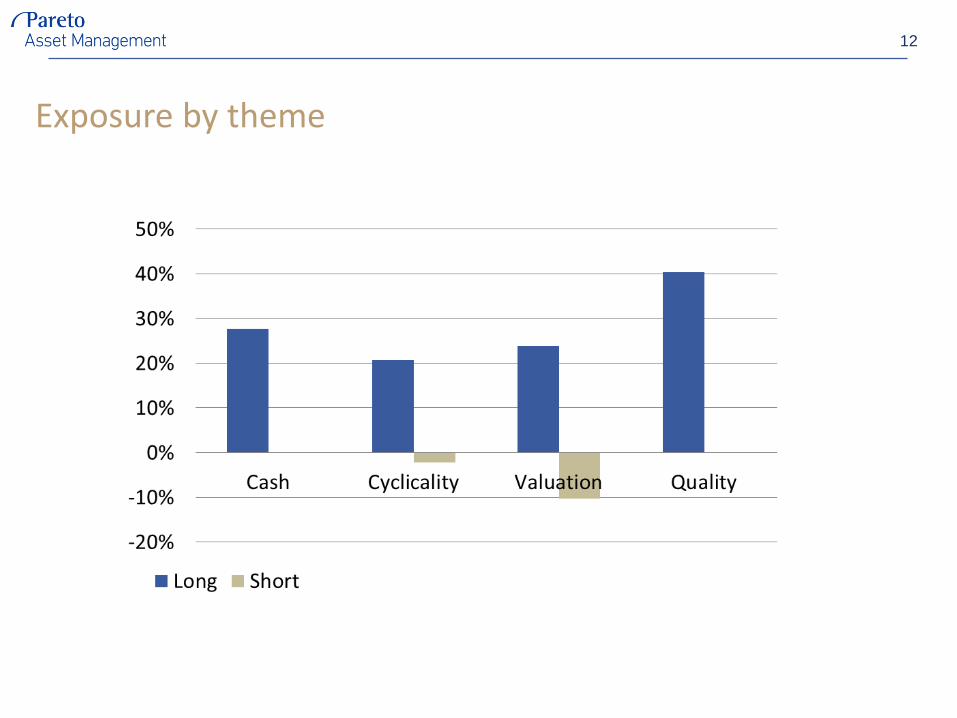
Exposure by theme
12
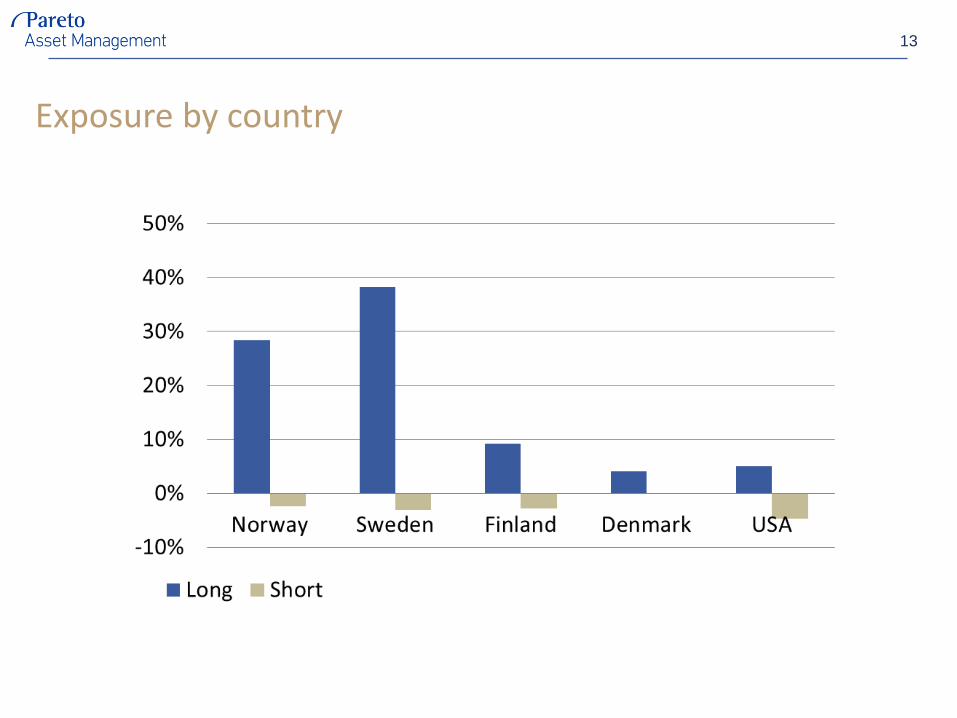
Exposure by country
13
Investment Style
Deep in-house company analysis, focus on stock selection
Aligning bottom-up stock selection with top-down market direction view
Low turnover (0.5/y)
High concentration (appr. 25 positions)
14
Stock selection – QualitySuperior position, growth and capital return at reasonable price
| 15
Stock selection – Quality
Market position – #1 (all companies)
Market share – 31% (#2 player 19%)
Organic growth Q3 – 9%
ROCE 2015 – 17%
EV/EBIT 2015 – 13.5 (discount to Nordic market at 14.8)
Three biggest position owned on average for 7 years with return CAGR of 29%
Median characteristics for our companies
| 16
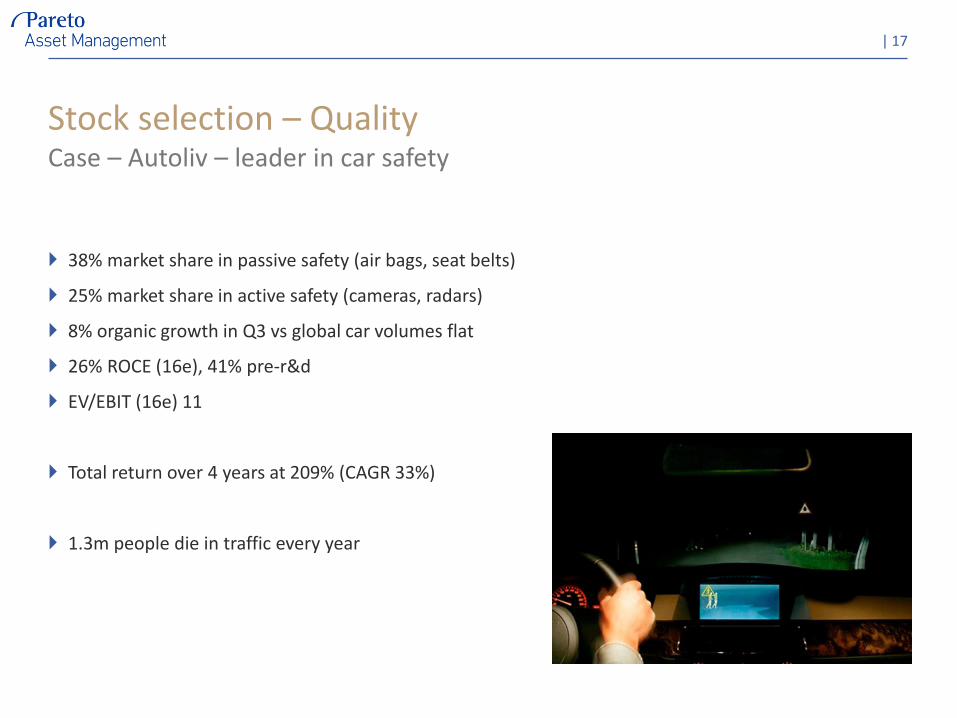
Stock selection – Quality
38% market share in passive safety (air bags, seat belts)
25% market share in active safety (cameras, radars)
8% organic growth in Q3 vs global car volumes flat
26% ROCE (16e), 41% pre-r&d
EV/EBIT (16e) 11
Total return over 4 years at 209% (CAGR 33%)
1.3m people die in traffic every year
Case – Autoliv – leader in car safety
| 17
Stock selection – Valuation
Opportunities arise with degree of popularity and external shocks
Mean-reverting valuation
| 18
Stock selection – Valuation
Short company in the leisure industry
– ROE of 10% (0-15% last 20y)
– Peak Price/Book multiple of 2.6
– Net debt/EBITDA 4x
– Negative acc. free cash flow last 10 years
– Negative return so far
Cases
| 19
Stock selection – Valuation
Stora Enso
– Mr. Market: «A doomed paper company»
– No! Paper is 20% of CE with 10% ROCE
– Great capital allocation to high-returning pulp and packaging
– 20% of EV in forests
– Total return over 3 years at 93% (CAGR 25%)
Cases
| 20
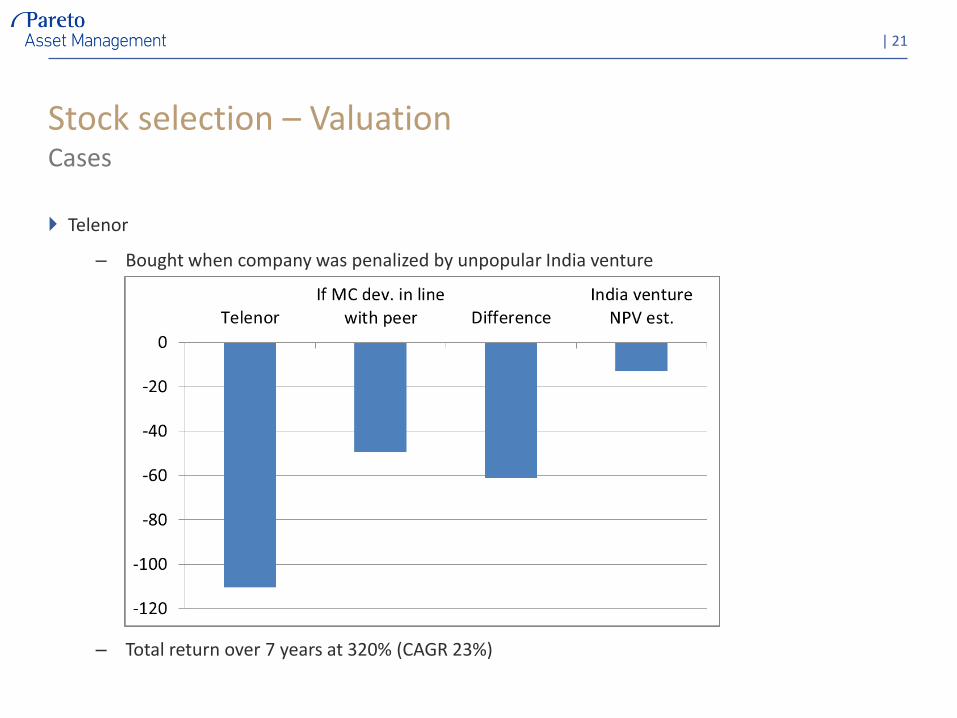
Stock selection – Valuation
Telenor
– Bought when company was penalized by unpopular India venture
– Total return over 7 years at 320% (CAGR 23%)
Cases
| 21
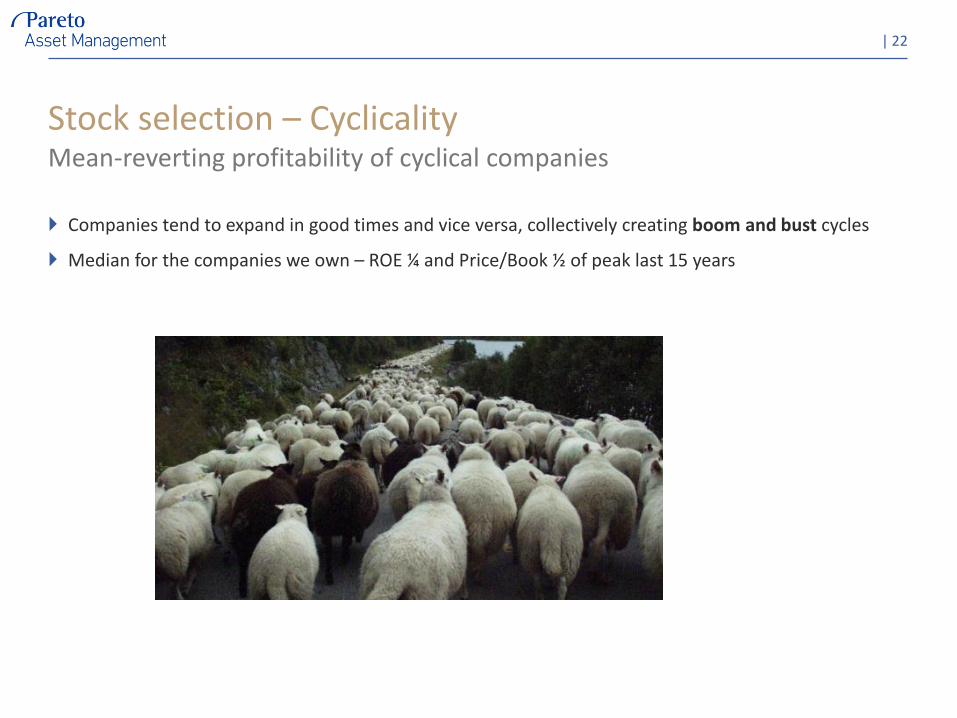
Stock selection – Cyclicality
Companies tend to expand in good times and vice versa, collectively creating boom and bust cycles
Median for the companies we own – ROE ¼ and Price/Book ½ of peak last 15 years
Mean-reverting profitability of cyclical companies
| 22
Stock selection – Cyclicality
Sales flat for 10 years
EBIT margin from 3 to 4%
– Including 1pp average margin headwind per year from higher steel and plastics costs
– And 1pp per year in costs for closing factories
Headwind is about to turn to tailwind
White goods volumes in Europe (1/3 of sales) flat since 2005
EV/EBIT (16e) at 20% discount to market
Case – Electrolux – 10 years of headwinds from costs and volume
| 23
Net exposure management
Anemic demand growth– No pull from China– Cheap money impact on demand in OECD largely behind us– Fiscal policy tool box is empty
Cost of capital will stay lower for longer– Inflation is dead– Central banks stay soft to stimulate demand
Both support the case for our Quality theme (2/3 of our net long)
| 24
Bottom-up meets top-down
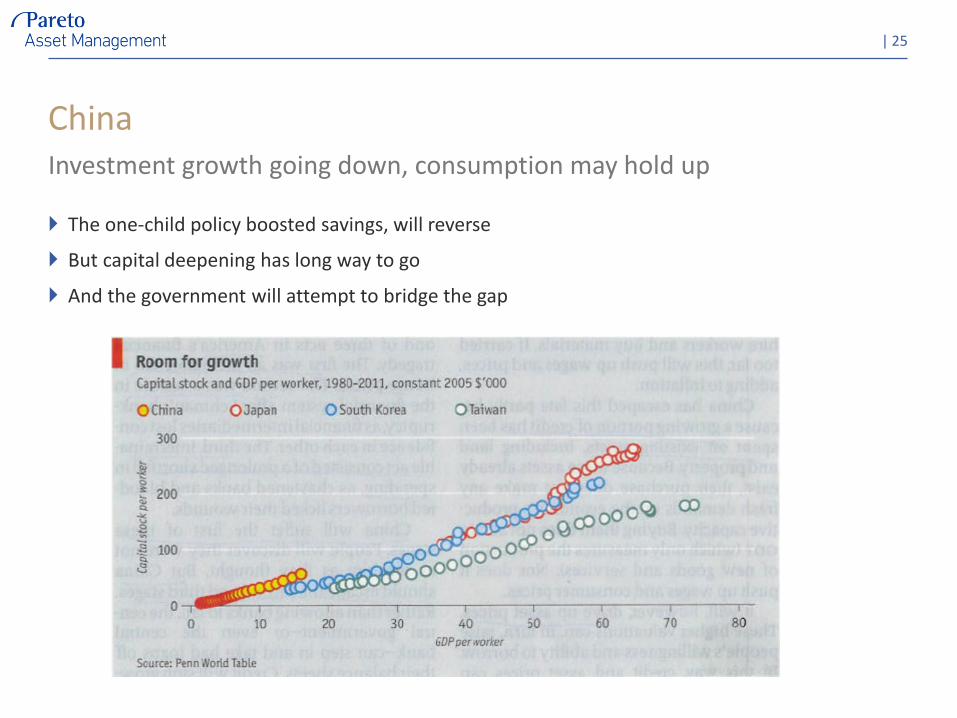
China
The one-child policy boosted savings, will reverse
But capital deepening has long way to go
And the government will attempt to bridge the gap
| 25
Investment growth going down, consumption may hold up
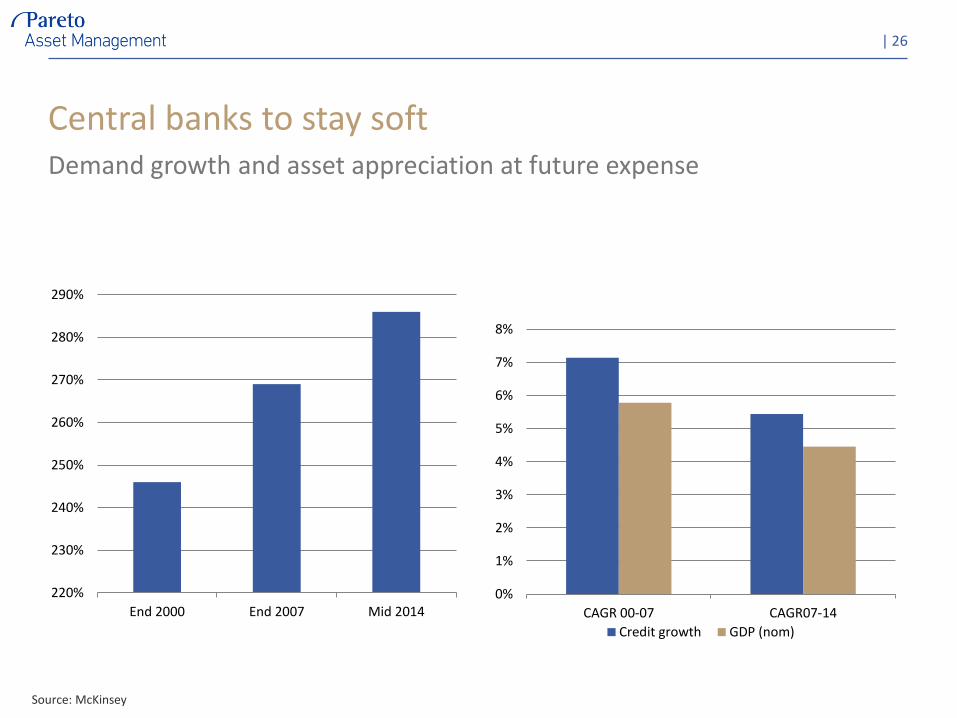
Central banks to stay soft
| 26
Source: McKinsey
220%
230%
240%
250%
260%
270%
280%
290%
End 2000 End 2007 Mid 20140%
1%
2%
3%
4%
5%
6%
7%
8%
CAGR 00-07 CAGR07-14
Credit growth GDP (nom)
Demand growth and asset appreciation at future expense
The cost of capital will stay low
More flexible labour market
High unemployment
Better price transparency for consumers
New capital-efficient business models
Sharing (cars in use 5% of time)
Higher asset turnover
Need to keep credit growth going
Saving the EMU
| 27
Net exposure management
Macro and earnings estimates equal current conditions, so they are in aggregate useless– and subject to large revisions
Consequently, aggregate P/E and EV/EBIT are useless
Price/Book measures the value of the production and earnings capacity
| 28
Valuation
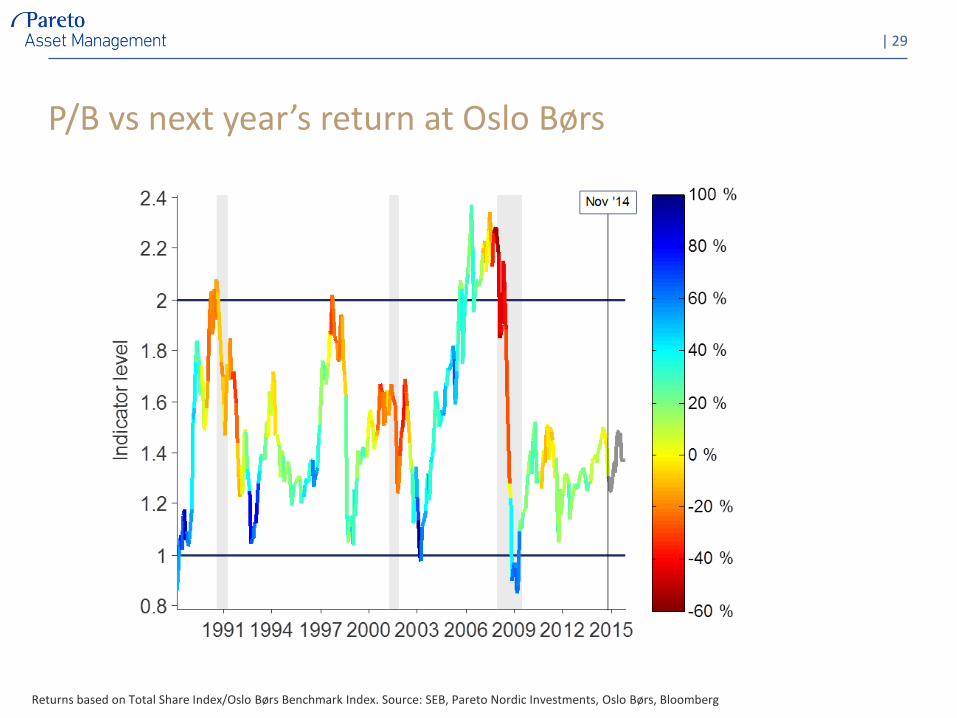
P/B vs next year’s return at Oslo Børs
| 29
Returns based on Total Share Index/Oslo Børs Benchmark Index. Source: SEB, Pareto Nordic Investments, Oslo Børs, Bloomberg

APPENDIX
| 30
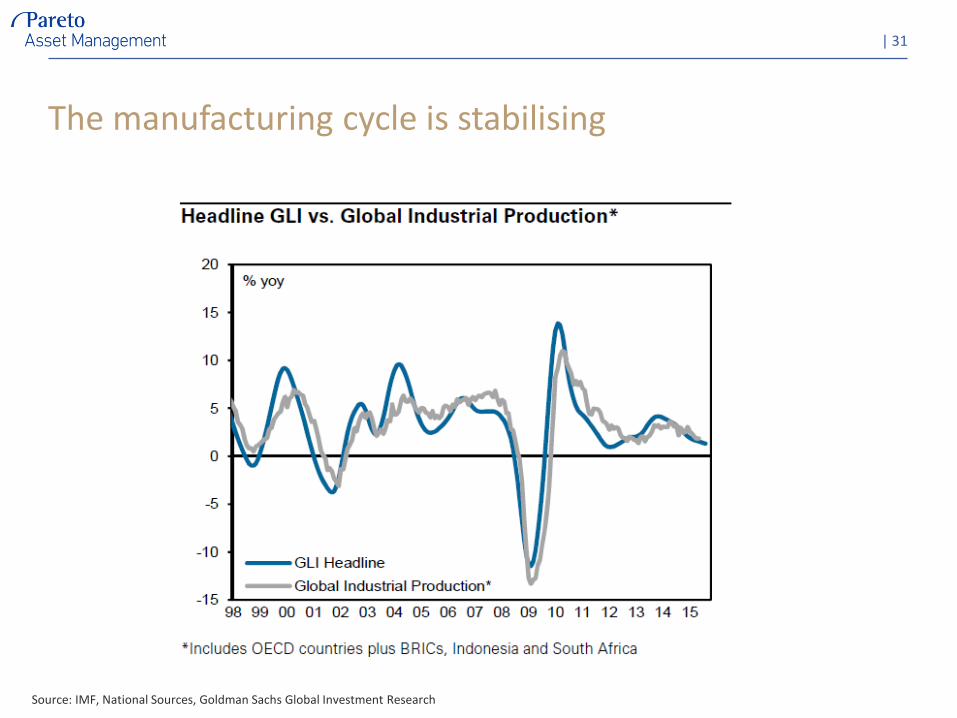
The manufacturing cycle is stabilising
| 31
Source: IMF, National Sources, Goldman Sachs Global Investment Research

US PMI to reboundInventories peaking
32
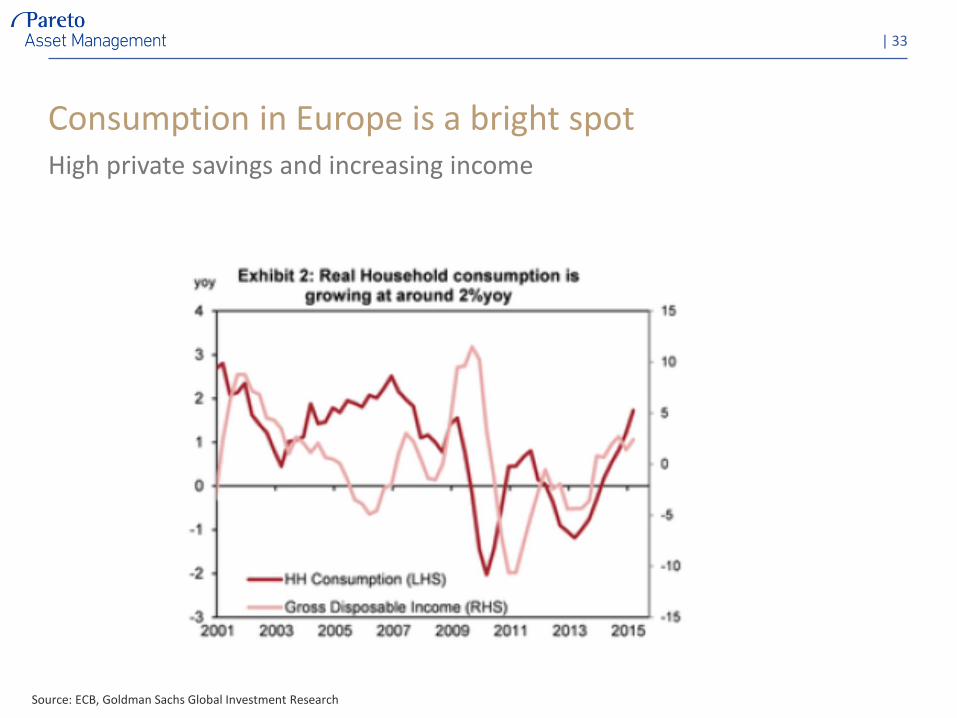
Consumption in Europe is a bright spot
| 33
High private savings and increasing income
Source: ECB, Goldman Sachs Global Investment Research
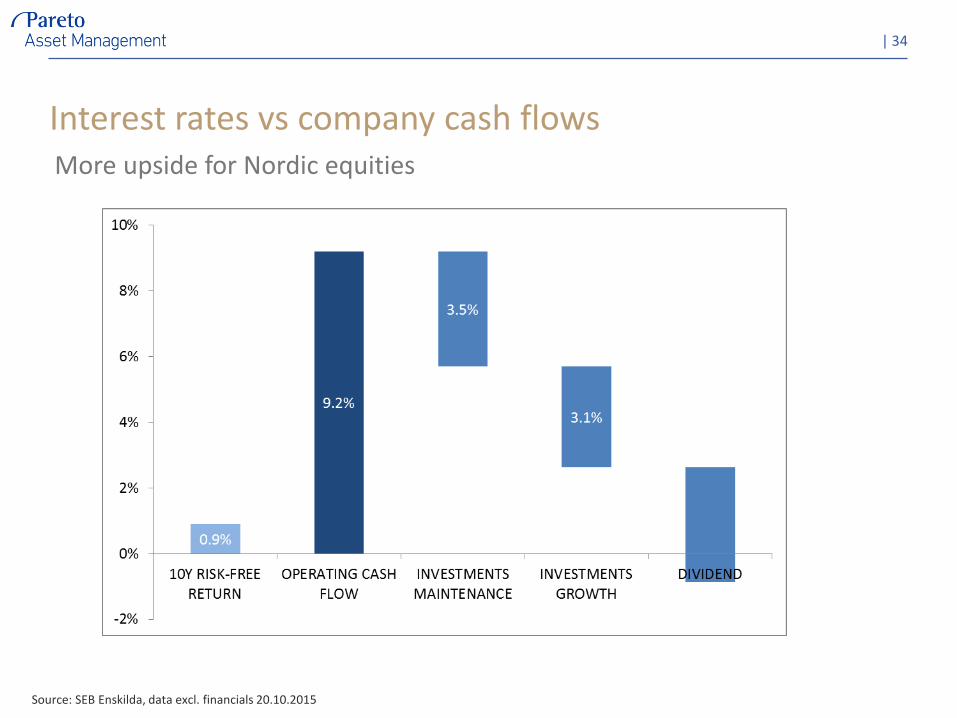
Interest rates vs company cash flowsMore upside for Nordic equities
| 34
Source: SEB Enskilda, data excl. financials 20.10.2015
3,2%
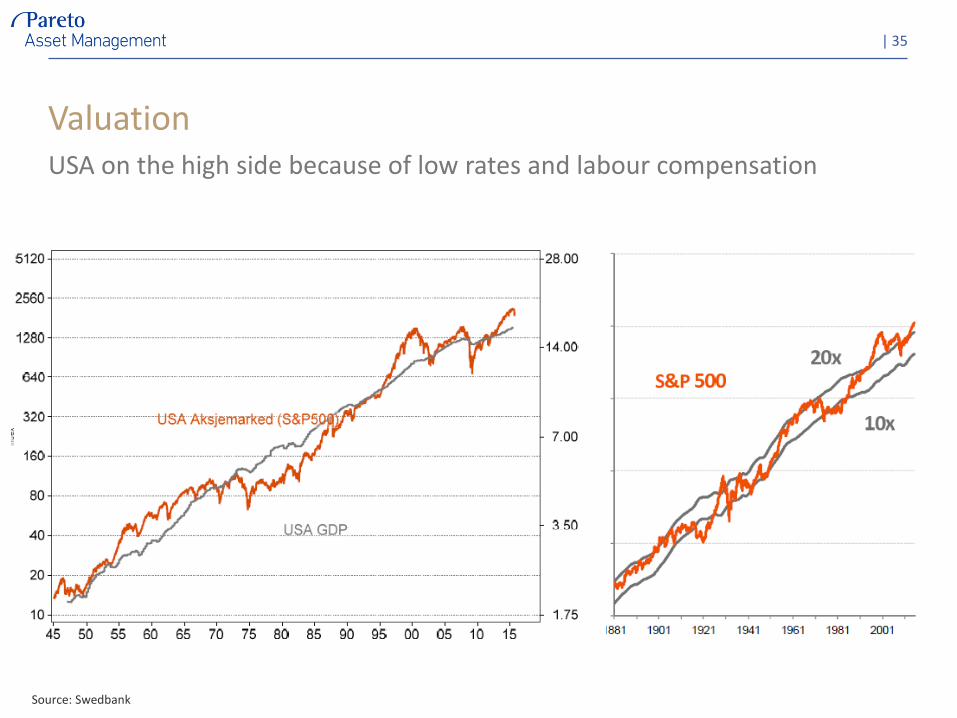
Valuation
| 35
Source: Swedbank
USA on the high side because of low rates and labour compensation
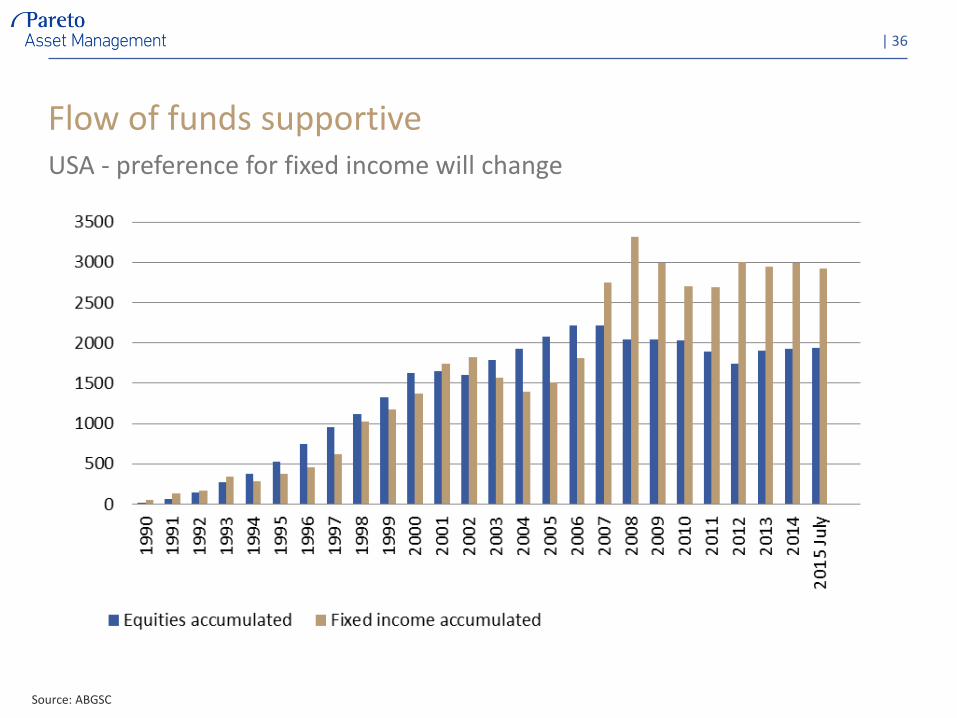
Flow of funds supportive
| 36
Source: ABGSC
USA - preference for fixed income will change
Other positive factors
Consumer surplus not in GDP
– What would you pay for this?
Energy will still get cheaper
More efficient logistics and capital employed
– Corporate margins at an all-time high, but asset turn grows 2.5% annually– Three years of asset turn growth neutralises 1pp margin decline
| 37
Source: ABGSC
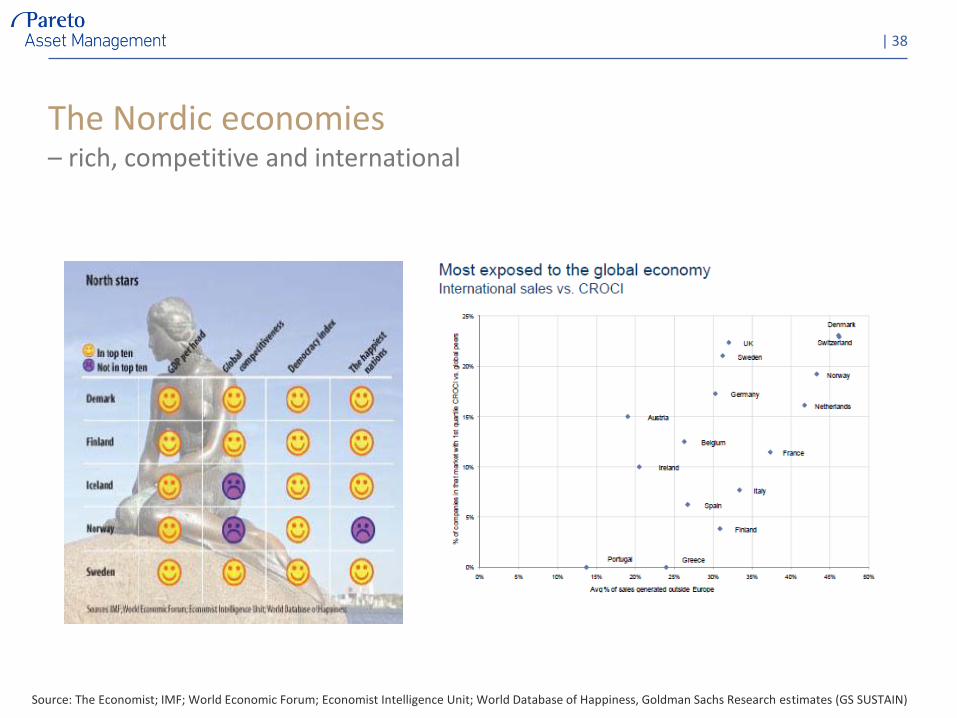
The Nordic economies– rich, competitive and international
| 38
Source: The Economist; IMF; World Economic Forum; Economist Intelligence Unit; World Database of Happiness, Goldman Sachs Research estimates (GS SUSTAIN)
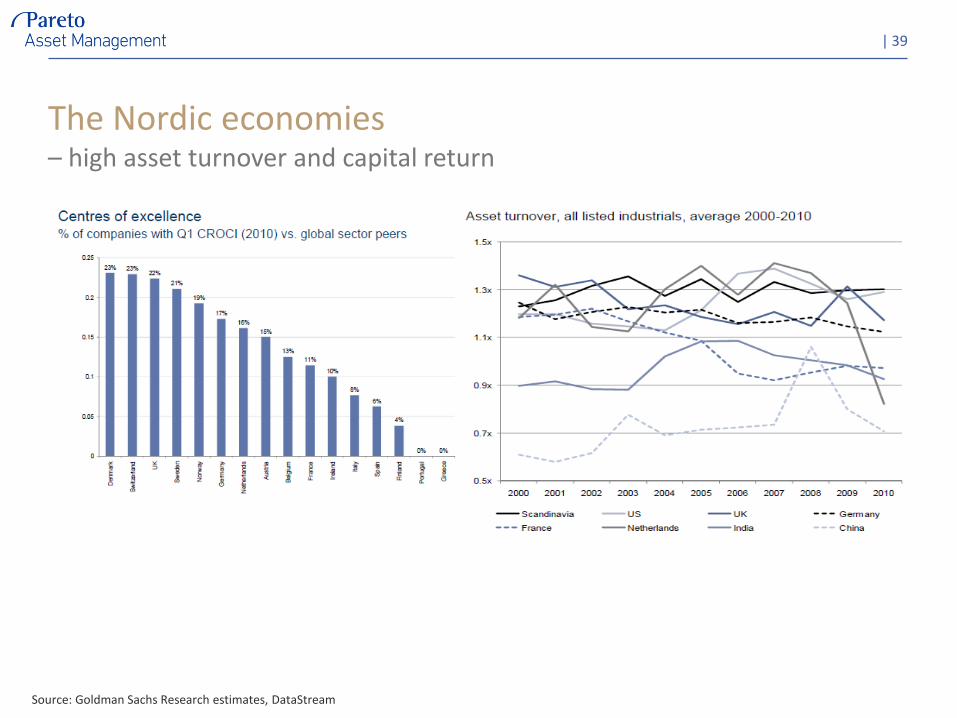
The Nordic economies– high asset turnover and capital return
| 39
Source: Goldman Sachs Research estimates, DataStream
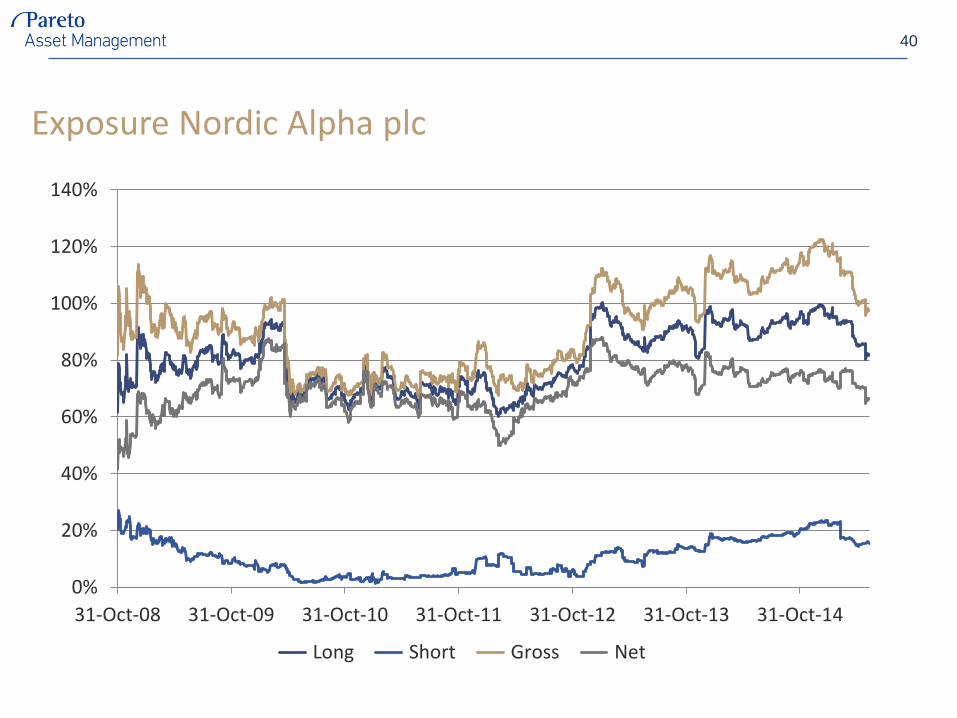
Exposure Nordic Alpha plc
40
0%
20%
40%
60%
80%
100%
120%
140%
31-Oct-08 31-Oct-09 31-Oct-10 31-Oct-11 31-Oct-12 31-Oct-13 31-Oct-14
Long Short Gross Net
The short side
Regardless of market view
Selective stock selection across all three vectors
Pair trades
Possible hedging with current positive market view
EMU break-up
– Telecom and utilities in countries with weak current account and debt position
Monetary policy impact breaks down
– But long in companies with credible organic growth, construction, gold miners
China’s investment boom is mature
– Commodities and capital goods
When negative market view
High beta (materials, capital goods, consumer discretionary)
| 41
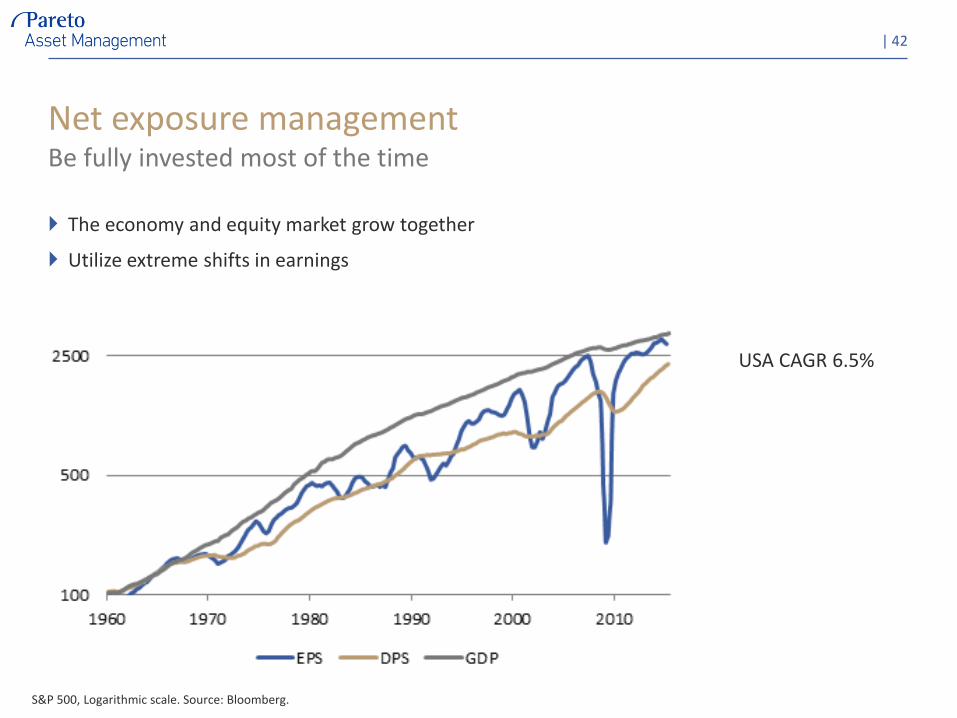
Net exposure management
The economy and equity market grow together
Utilize extreme shifts in earnings
Be fully invested most of the time
| 42
S&P 500, Logarithmic scale. Source: Bloomberg.
USA CAGR 6.5%
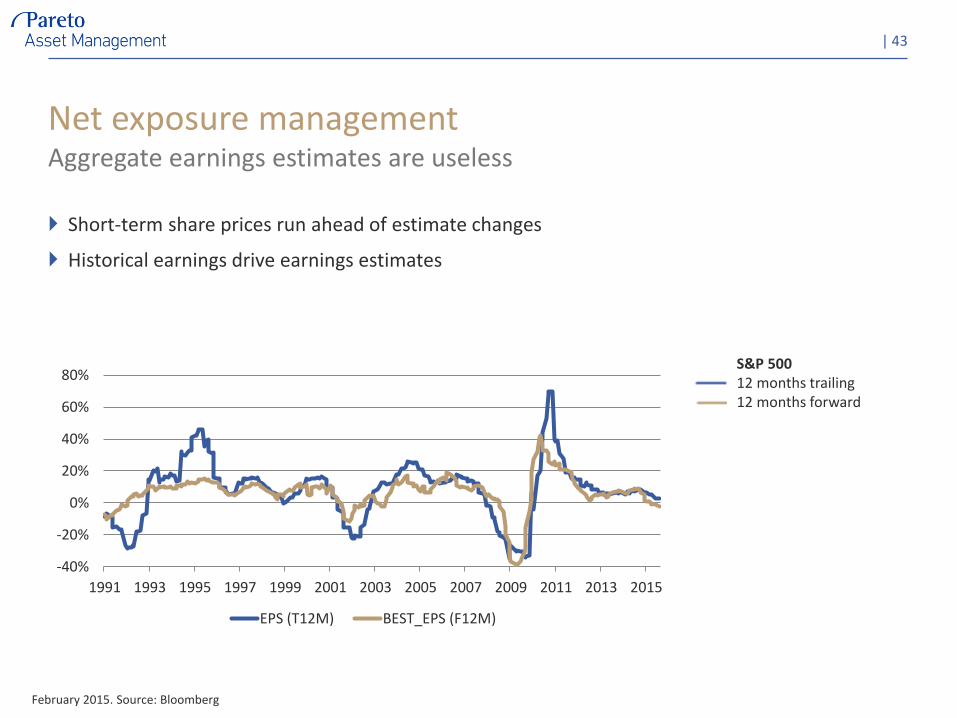
Net exposure management
Short-term share prices run ahead of estimate changes
Historical earnings drive earnings estimates
Aggregate earnings estimates are useless
| 43
February 2015. Source: Bloomberg
S&P 500 12 months trailing12 months forward
-40%
-20%
0%
20%
40%
60%
80%
1991 1993 1995 1997 1999 2001 2003 2005 2007 2009 2011 2013 2015
EPS (T12M) BEST_EPS (F12M)
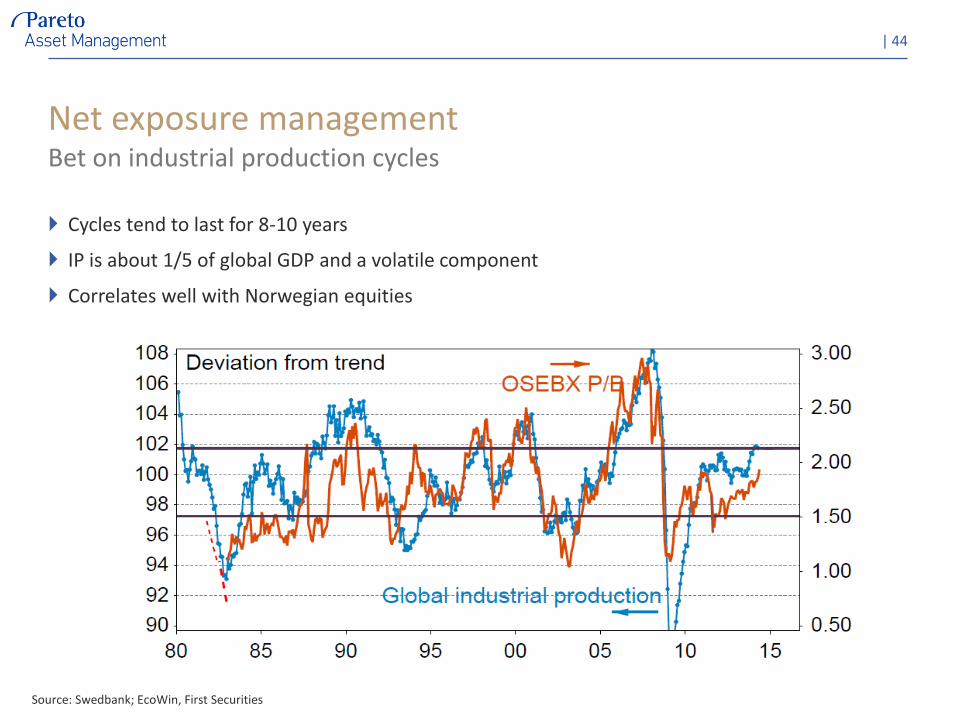
Net exposure management
Cycles tend to last for 8-10 years
IP is about 1/5 of global GDP and a volatile component
Correlates well with Norwegian equities
Bet on industrial production cycles
| 44
Source: Swedbank; EcoWin, First Securities


![[Nordic Built Challenge 17.12.2013] Trine Pertou Mach, Nordic Built: Nordic Built](https://img.pdfslide.us/doc/110x75/547174dcb4af9f980a8b4ad9/nordic-built-challenge-17122013-trine-pertou-mach-nordic-built-nordic-built.jpg)