Embed Size (px)
Citation preview
Cooperative Research Centre for Coastal Zone, Estuary & Waterway Management
Technical Report 61
Noosa River entrance
channel dynamics
Steven Chamberlain
Rodger Tomlinson

Noosa River entrance channel dynamics Steven Chamberlain Rodger Tomlinson

ii
Noosa River entrance channel dynamics Copyright © 2006:
Cooperative Research Centre for Coastal Zone, Estuary and Waterway Management
Written by:
Steven Chamberlain
Rodger Tomlinson
Published by the Cooperative Research Centre for Coastal Zone, Estuary
and Waterway Management (Coastal CRC)
Indooroopilly Sciences Centre
80 Meiers Road
Indooroopilly Qld 4068
Australia
www.coastal.crc.org.au The text of this publication may be copied and distributed for research and educational purposes with proper acknowledgment. Photos cannot be reproduced without permission of the copyright holder. Disclaimer: The information in this report was current at the time of publication. While the report was prepared with care by the authors, the Coastal CRC and its partner organisations accept no liability for any matters arising from its contents. National Library of Australia Cataloguing-in-Publication data
Noosa River entrance channel dynamics
QNRM06091 ISBN 1 921017 10 4 (print) ISBN 1 921017 11 2 (online)
iii
Table of contents
Executive summary ................................................................................................1
1 Introduction ....................................................................................................3
2 Objectives......................................................................................................5
3 Literature review..............................................................................................6
3.1 Tidal inlet behaviour ..........................................................................................................6 3.2 History of Noosa beach and estuary system .........................................................................13
4 Methodology.................................................................................................19
5 Aerial photograph analysis ...............................................................................20
5.1 19 May 1972 (Figure 9) ....................................................................................................20 5.2 12 September 1973 (Figure 10)..........................................................................................20 5.3 13 February 1974 (Figure 11) ............................................................................................20 5.4 6 February 1978 (Figure 12) ..............................................................................................21 5.5 9 April 1978 (Figure 13)....................................................................................................21 5.6 26 June 1978 (Figure 14)..................................................................................................22 5.7 13 July 1978 (Figure 15)...................................................................................................22 5.8 4 September 1978 (Figure 16) ...........................................................................................22 5.9 13 October 1978 (Figure 17) .............................................................................................23 5.10 5 December 1978 (Figure 18) ............................................................................................23 5.11 23 May 1979 (Figure 19) ..................................................................................................23 5.12 14 June 1980 (Figure 20)..................................................................................................24 5.13 5 March 1981 (Figure 21) .................................................................................................24 5.14 7 July 1982 (Figure 22) ....................................................................................................25 5.15 26 June 1983 (Figure 23)..................................................................................................25 5.16 23 November 1984 (Figure 24) ..........................................................................................26 5.17 12 September 1985 (Figure 25)..........................................................................................26 5.18 28 August 1986 (Figure 26)...............................................................................................26 5.19 23 July 1987 (Figure 27)...................................................................................................27 5.20 12 June 1988 (Figure 28)..................................................................................................27 5.21 17 December 1990 (Figure 29) ..........................................................................................28 5.22 15 April 1991 (Figure 30) ..................................................................................................28 5.23 6 June 1992 (Figure 31) ...................................................................................................28 5.24 31 July 1992 (Figure 32)...................................................................................................29 5.25 2 March 1993 (Figure 33) .................................................................................................30 5.26 25 May 1994 (Figure 34) ..................................................................................................30 5.27 5 September 1997 (Figure 35) ...........................................................................................30
iv
5.28 9 October 1997 (Figure 36) ...............................................................................................31 5.29 23 July 1999 (Figure 37)...................................................................................................31 5.30 7 July 2001 (Figure 38) ....................................................................................................31 5.31 24 October 2001 (Figure 39) .............................................................................................32 5.32 18 January 2002 (Figure 40) .............................................................................................32
6 Discussion ...................................................................................................34
7 Conclusions .................................................................................................38
References.........................................................................................................42
Appendix 1: Historical aerial photograph collection ...................................................44
Appendix 2: Dredging records for sand nourishment works at Noosa Beach ...................76
List of figures
Figure 1. Model 1 of inlet sediment bypassing proposed by FitzGerald et al. (1978 cited
in FitzGerald, 1988). ....................................................................................................... 11 Figure 2. Model 2 of inlet sediment bypassing proposed by FitzGerald et al. (1978 cited
in FitzGerald, 1988). ....................................................................................................... 12 Figure 3. Model 3 of inlet sediment bypassing proposed by FitzGerald et al. (1978 cited
in FitzGerald, 1988). ....................................................................................................... 13 Figure 4. The Noosa River entrance in the 1960s (Source unknown). ................................... 14 Figure 5. Dressing sheds on Main Beach falling into the sea as a result of the 1947–48
cyclones (Source unknown)............................................................................................ 15 Figure 6. The rock wall in 1972–73 after it was extended the entire length of the beach
(Source unknown)........................................................................................................... 16 Figure 7. Aerial photograph of the beach and estuary system highlighting the response
to a flood event in 1992................................................................................................... 29 Figure 8. Overlay of Noosa Beach and estuary system indicating the response to storm
events.............................................................................................................................. 35 Figure 9. Noosa beach and estuary system, 19 May 1972..................................................... 44 Figure 10. Noosa beach and estuary system, 12 September 1973. ....................................... 45 Figure 11. Noosa beach and estuary system, 13 February 1974. .......................................... 46 Figure 12. Noosa beach and estuary system, 6 February 1978. ............................................ 47 Figure 13. Noosa beach and estuary system, 9 April 1978. ................................................... 48 Figure 14. Noosa beach and estuary system, 26 June 1978.................................................. 49 Figure 15. Noosa beach and estuary system, 13 July 1978. .................................................. 50 Figure 16. Noosa beach and estuary system, 4 September 1978. ......................................... 51 Figure 17. Noosa beach and estuary system, 13 October 1978............................................. 52
v
Figure 18. Noosa beach and estuary system, 5 December 1978. .......................................... 53 Figure 19. Noosa beach and estuary system, 23 May 1979................................................... 54 Figure 20. Noosa beach and estuary system, 14 June 1980.................................................. 55 Figure 21. Noosa beach and estuary system, 5 March 1981.................................................. 56 Figure 22. Noosa beach and estuary system, 7 July 1982. .................................................... 57 Figure 23. Noosa beach and estuary system, 26 June 1983.................................................. 58 Figure 24. Noosa beach and estuary system, 23 November 1984. ........................................ 59 Figure 25. Noosa beach and estuary system, 12 September 1985. ....................................... 60 Figure 26. Noosa beach and estuary system, 28 August 1986. ............................................. 61 Figure 27. Noosa beach and estuary system, 23 July 1987. .................................................. 62 Figure 28. Noosa beach and estuary system, 12 June 1988.................................................. 63 Figure 29. Noosa beach and estuary system, 17 December 1990. ........................................ 64 Figure 30. Noosa beach and estuary system, 15 April 1991. ................................................. 65 Figure 31. Noosa beach and estuary system, 6 June 1992.................................................... 66 Figure 32. Noosa beach and estuary system, 31 July 1992. .................................................. 67 Figure 33. Noosa beach and estuary system, 2 March 1993.................................................. 68 Figure 34. Noosa beach and estuary system, 25 May 1994................................................... 69 Figure 35. Noosa beach and estuary system, 5 September 1997. ......................................... 70 Figure 36. Noosa beach and estuary system, 9 October 1997............................................... 71 Figure 37. Noosa beach and estuary system, 23 July 1999. .................................................. 72 Figure 38. Noosa beach and estuary system, 7 July 2001. .................................................... 73 Figure 39. Noosa beach and estuary system, 24 October 2001............................................. 74 Figure 40. Noosa beach and estuary system, 18 January 2002............................................. 75

vi
Noosa River entrance channel dynamics
1
Executive summary Noosa has become a tourist mecca that attracts large numbers of interstate and
international tourists. These visitors are largely attracted by the climate and
beaches that have proven popular with a variety of beach users. Noosa Main
Beach is located between the Noosa headland and the Noosa River entrance.
The river entrance was trained in 1978 with a single rock jetty, and a rock groyne
created midway between the river entrance and headland in 1983.
Erosion of Noosa Main Beach has been an ongoing problem, with historical
records indicating that storm events have caused cutback of the beach for as
long as historical records have been maintained. Prior to the mid 1960s though,
the beach and river system essentially remained in a state of dynamic
equilibrium. The sand dune was able to accommodate storm cutback and the
beach seemed to respond without any major concern. However, large scale
development witnessed in the mid 1960s led to modification of the beach system
and resulted in the construction of the protective rock seawall, training of the river
entrance and construction of the rock groyne.
The seawall and rock groyne failed to address the erosion concerns and resulted
in the formation of a new control point for the beach and river system. Beach
nourishment activities have been performed in recent times in an attempt to
maintain a useable beach. However, the modifications to the beach system and
atypical weather conditions in recent years have resulted in a beach that remains
in a severely eroded state for the majority of the time.
Erosion concerns have led to the placement of approximately 40 000 m3 of
nourishment sand being placed on the beach annually. The sand reserves from
the ‘inactive’ zone adjacent to Noosa Sound have almost been exhausted and
restrictions have been imposed by the Environmental Protection Agency (EPA)
on dredging locations due to the existence of a fish habitat on the northern side of
the entrance. It is now proposed that nourishment sand be obtained from the
‘active’ zone consisting of tidal deltas and deltas inside the river entrance.
A number of solutions to the beach erosion problem have been investigated,
including extension of the rock groyne, realignment of the seawall and
construction of an artificial reef. All these options have been rejected for a variety
of reasons and nourishment has continued in order to maintain a useable beach.

Noosa River entrance channel dynamics
2
This report focuses on the behaviour of nourishment sand entering the system
and the likely consequences should the proposed new dredging scheme proceed.
It has been concluded in view of the findings that continued nourishment is not a
suitable beach management strategy and that dredging of the active zone will be
of limited effectiveness and poses an unacceptable risk to the fish habitat on the
northern side of the river entrance.
More available data and better continuity of data is required before an accurate
conceptual model of longshore transport and delta response can be developed.
Once this is available, detailed modelling of the beach and river system will
provide a more thorough understanding of the nourishment sand transport
processes and the long-term consequences of the proposed dredging activities.
These factors will then assist in determining an effective and longer-term beach
management strategy for the region.
Noosa River entrance channel dynamics
3
1 Introduction Situated approximately 180 km north of Brisbane, Noosa is a tourist mecca that
attracts large numbers of interstate and international tourists. Noosa headland is
almost entirely surrounded by water, with tidal lakes to the north connected to the
Pacific Ocean by the Noosa River. Noosa has become a favoured holiday
destination, with Main Beach’s location on Laguna Bay providing protection
against southeasterly winds (Cato, 1989) and amenities for a variety of beach
activities (Jackson, Black & Tomlinson, 1999).
History has shown that Main Beach is vulnerable to erosion. Prior to the 1960s, it
was washed away many times but was able to repair itself in each instance. The
movement of shorelines is a complex phenomenon that may result from natural
processes, anthropogenic effects or in many cases a combination of both. The
impact of anthropogenic effects has become increasingly apparent in recent
times, with humans’ desire to develop the coast conflicting with natural processes
(Camfield & Morang, 1996). Unsuitable developments along Hastings Street and
on the foredune of Main Beach have placed property in danger. Attempts to
provide protection from erosion led to a beach system that is unable to
regenerate itself and as a result, the majority of the beach remains in a severely
eroded state (Cato, 1989).
Experience has led to the realisation that modifications to the coastal zone need
to be made with caution if adverse economic impacts and environmental effects
are to be avoided. It is now recognised that coastal engineering work should be
undertaken only if there is sufficient knowledge of the processes at work (Gao &
Collins, 1995). While this may assist in future coastal developments, it does little
to address the adverse effects that have already been caused. A number of
options have been investigated to maintain a useable beach and the visual
amenity at the eastern end of Hastings Street, but none have been deemed
suitable. As this beach has such a high resource value, there are many benefits
in increasing our understanding of the beach and estuary behaviour
(Geomorphology editorial, 2002). This is a major reason for this study being
undertaken.
Since the river entrance was trained in 1978, beach nourishment has been used
to maintain a useable area on Main Beach. Rapid removal of this sand results in
the beach quickly returning to its eroded state. The sand reserves in Noosa Inlet
that previously provided nourishment material have almost been exhausted
(Jackson et al., 2001), and the council is now looking to use the ‘active’ zone of

Noosa River entrance channel dynamics
4
tidal deltas as a supply of sand to continue nourishment activities. With this in
mind, it has become increasingly important to gain a thorough understanding of
the response to nourishment sand entering the system. This report will attempt to
develop a conceptual model of inlet response to the addition of nourishment
material. In addition, it will discuss the likely implications of the proposed new
dredging scheme based on historical observations of the response to
developments and extreme weather patterns in the region and a trial dredge of
the ‘active’ zone performed in late 2001/early 2002.

Noosa River entrance channel dynamics
5
2 Objectives The main objectives of this study are to:
• examine the existing beach management scheme to assess the behaviour
of nourishment sand;
• assess the response of estuarine ebb and flood-tidal deltas to nourishment
sand entering the system; and
• develop a conceptual model of longshore transport and delta response to
assist Noosa Shire Council in deciding upon a suitable beach management
strategy.
Noosa River entrance channel dynamics
6
3 Literature review 3.1 Tidal inlet behaviour
Tidal inlets are dynamic systems found everywhere in the world, with a variety of
parameters that makes their characterisation a difficult task. These inlets
generally demonstrate continuous change in geometry by varying their length and
configuration in response to the transportation of sediment (Bruun, 1979). They
impact upon the supply of sand to downdrift beaches and the erosional–
depositional patterns on adjacent beaches by interrupting the wave-induced
transport of sediment along the shoreline. Often, the greatest magnitude
erosional–depositional changes along a shoreline can be witnessed in the region
of tidal inlets (FitzGerald, 1988).
When waves are incident upon a shoreline at an angle, a portion of the water is
reflected back out into deeper water, while some moves parallel to the shoreline.
The volume of water that moves parallel to the shore, referred to as the longshore
current, is a function of both wave height and the angle of incidence. Longshore
currents and waves are responsible for transportation of large volumes of sand
and may result in a net movement of sand in one direction if there is a
predominant swell direction (Davis, 1994).
At times, tidal inlets act as sediment sinks, in which case they provide one or all
of the following:
• a pathway for the movement of sand into rivers and bays where the
sediments are deposited on flood-tidal deltas and marshes;
• storage for littoral sediments in swash platforms and ebb-tidal deltas; and
• temporary storage in other sand bodies such as channel margin bars and
sand spits.
Such behaviour plays a significant role in determining the impact on neighbouring
beaches (Liu and Hou, 1997), and can result in the reshaping of deltas, estuaries
and bays. Should sediments become part of an infill sequence, they may be
stored for long periods in the bay/lagoon environment (Morton and Donaldson,
1973; Kumar and Sanders, 1974; Moslow and Heron, 1978 cited in FitzGerald,
1988).
Flood-tidal deltas form on the landward side of a tidal inlet and as such are
protected from wave action. They are generally fan-shaped and usually only
subject to tidal currents. Ebb-tidal deltas on the other hand are exposed to the
Noosa River entrance channel dynamics
7
open ocean and wave attack that results in their shape and depositional patterns
being more varied than flood-tidal deltas. The tidal currents and interaction with
wave-generated processes are the controlling factors for the size and shape of
ebb-tidal deltas (Davis, 1994).
Ebb-tidal deltas perform a valuable function at tidal inlets. Their shallow nature
provides a natural breakwater, thereby reducing the wave energy incident upon
the inlet shorelines. This is particularly true at lower tidal elevations when most of
the energy is dissipated on the terminal lobe. However, intertidal and subtidal
bars still result in waves breaking offshore at higher tidal elevations (FitzGerald,
1988). Hales and Herbich (1972, cited in FitzGerald, 1988) have also shown that
ebb-tidal currents influence incident waves and result in a decreased wave
height. Together, these factors result in less erosion on shorelines adjacent to the
tidal inlet.
Much research has been performed on the relationships between ebb-tidal deltas
and tidal inlets. These deltas can contain huge volumes of sand so even slight
changes in their volume may have a considerable effect on the supply of sand to
adjacent beaches (FitzGerald, 1988). Walton and Adams (1976) compared the
idealised ‘no-inlet’ hydrographic charts with actual hydrographic charts for 44
inlets around sandy portions of the United States coast to determine the volume
of sand stored in ebb-tidal deltas. The following equation that relates the volume
to tidal prism was derived:
V = aPb (Eq. 1)
where V = volume of sand stored in the outer bar/delta
of the inlet (in cubic yards of immersed sand)
P = tidal prism of the inlet (ft3)
a,b = correlation coefficients.
They concluded that more sand is stored in the ebb-deltas of low energy coasts
than that of high energy coasts. However, limitations to this model exist in that
other factors such as longshore energy flux and sediment size that could present
an upper limit to the storage capacity were not considered in this study.
Gao and Collins (1995) claim that a tidal inlet will evolve towards a state of
dynamic equilibrium in terms of its cross-sectional area at the entrance under any
hydrodynamic and sediment dynamic conditions. Cooper, Hooke and Bray (2001)
suggest that over a particular time frame and spatial scale, such systems are
Noosa River entrance channel dynamics
8
capable of maintaining a balance between activity, morphology and sediment
transport, and can dissipate energy inputs with no net output from the system.
However, this state of dynamic equilibrium can be disturbed by changes to
energy inputs (e.g. storm events), coastal defence works that influence the
sediment budget, or other human activities that alter the morphology of the
system (e.g. dredging). Such interference may cause the system to be altered in
such a way that it can no longer dissipate energy inputs without net outputs. This
may become apparent through variations in the morphology and/or sediment
characteristics and/or sediment transport processes.
Storm impact is an important concern as storms are often responsible for rapid
changes to a tidal inlet (Davis, 1994). The corresponding, prolonged transport of
sand onto the beach is a poorly understood process that varies from location to
location. The balance of sand supply to adjacent beaches is altered considerably
during high-energy events and it is difficult to predict where erosion or deposition
will occur (Morton, Gibeaut and Paine, 1995). Variations in storm frequency can
impact on the longshore transport of sand in a system, which in turn can influence
the characteristics and position of tidal inlets and neighbouring beaches
(Camfield & Morang, 1996).
During storms, particularly when they coincide with a storm surge and high
astronomical tides, waves are able to attack sections of the beach that are not
typically vulnerable to erosion. For an undisturbed system, the dynamic response
is to sacrifice some of the beach and often the dune to provide material for an
offshore bar. Such bars protect the shoreline from further erosion and highlight
the importance of retaining the dunal system of the beach. After a storm, when
conditions return to normal, the system is dominated by low, long swells. These
swells transport the sand that formed the offshore bars back onto the beach,
before winds transport the material back onto the dune (USACE, 2001).
Short (1999) emphasises, with regard to human impacts, that structures designed
to prevent beach erosion, such as seawalls, tend to accelerate beach erosion and
reduce recovery rates due to a reduction in permeability. Groynes are the most
commonly used beach stabilisation structure and, when designed correctly, can
assist in stabilising erosion-prone beaches. By reducing the volume of sand
removed by longshore transport, an accumulation of sediment on the updrift side
of the structure occurs. This results in a reorientation of the shoreline and a
reduction in the incident angle of waves. The net effect is a reduction in the
volume of sand passing the structure and hence being removed from the beach
(USACE, 1994).
Noosa River entrance channel dynamics
9
In reducing the volume of sand passing the structure, erosion of the downdrift
section of beach is a likely consequence as the system attempts to maintain
previous longshore transport rates. These impacts can be reduced by
incorporating beach nourishment into the project to help reduce the time required
for the system to establish a new state of equilibrium and by encouraging earlier
sand bypassing of the structure (USACE, 1994). Beach nourishment is an
attractive alternative from a recreational point of view as an increased beach area
provides greater potential for tourist use (CUR, 1987).
Although beach nourishment is regularly regarded as an effective tool in
combating the effects of beach erosion, studies have shown that sand volumes
required do not decrease with time as was once believed (Trembanis & Pilkey,
1999). Nourishment activities in the past have applied design criteria that have
been qualitative rather than quantitative. The emphasis has been in many cases
on providing an increased useable beach area with little attempt being made to
predict the behaviour of the beach fill. This results in non-optimum designs being
used, which in turn reduces the cost-effectiveness of the project. To achieve
optimum results, the hydraulic and morphological processes of the relevant area
must be thoroughly understood (CUR, 1987).
In order to be effective, the nourishment material must be similar to the material
that characterises the beach. Removal of nourishment sand can be accelerated
by an unnatural steepness of beach fill and/or a large percentage of fine-grained
material present in the nourishment sand (Bruun, 1990). Using material with a
finer texture than the original beach material will result in its rapid removal and
reduce the economic viability of the project. Sources of material having similar
characteristics to the native beach material and which will not be adversely
affected by their removal are often a limiting factor in the continued success of
nourishment activities (Davis, 1994). Furthermore, those responsible for the
implementation of beach nourishment activities should not expect the beach fill to
be stable when it is placed on a continuously eroding coast (CUR, 1987).
Noosa River entrance channel dynamics
10
Bruun and Gerritson (1959 cited in Kidson, 1963) have shown that sand
bypassing tidal inlets is a naturally occurring process. They derived the equation:
r = Mmean/Qmax (Eq. 2)
where r equals the ratio between the longshore sediment
transport rate (Mmean (yd3/yr)) and the maximum discharge
at the outlet during spring tidal conditions (Qmax (yd3/s)).
Three methods of inlet bypassing were defined. These are:
• wave-induced sand transport along the periphery of the ebb-tidal delta
(terminal lobe);
• transport of sediment in channels by tidal currents; and
• migration of tidal channels and sand bars.
For inlets with high r values (r = 200–300), Bruun and Gerritson were able to
demonstrate that sand bypassing occurred via wave action along the terminal
lobe, whereas bypassing occurred by the other two methods for inlets with low
r values (r = 10–20). Bypassing may also be a result of a combination of these
methods. Bruun and Gerritsen’s (1959) original work has been refined by
FitzGerald et al. (1978 cited in FitzGerald, 1988) who proposed three models to
explain inlet sediment bypassing. These models are discussed below and
illustrated in Figures 1 to 3.
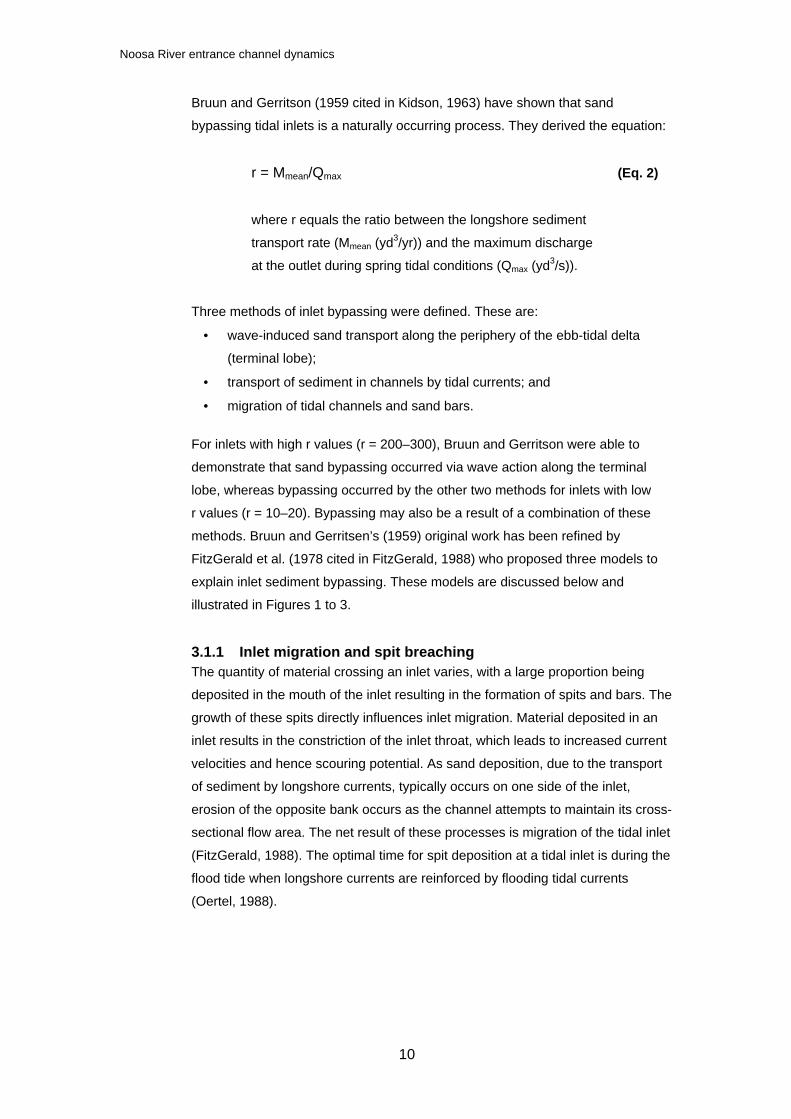
3.1.1 Inlet migration and spit breaching The quantity of material crossing an inlet varies, with a large proportion being
deposited in the mouth of the inlet resulting in the formation of spits and bars. The
growth of these spits directly influences inlet migration. Material deposited in an
inlet results in the constriction of the inlet throat, which leads to increased current
velocities and hence scouring potential. As sand deposition, due to the transport
of sediment by longshore currents, typically occurs on one side of the inlet,
erosion of the opposite bank occurs as the channel attempts to maintain its cross-
sectional flow area. The net result of these processes is migration of the tidal inlet
(FitzGerald, 1988). The optimal time for spit deposition at a tidal inlet is during the
flood tide when longshore currents are reinforced by flooding tidal currents
(Oertel, 1988).
Noosa River entrance channel dynamics
11
As depicted in Figure 1, migration of an inlet often corresponds with an elongation
of the inlet channel. This longer channel typically results in inefficient tidal flows
due to reduced hydraulic efficiency. Breaching of the updrift spit results in a
shorter, more efficient route for tidal exchange. This new pathway will typically
remain the dominant flow path as the older inlet closes. This process of spit
breaching essentially provides large quantities of sand to the downdrift shoreline
(FitzGerald, 1988).
Figure 1. Model 1 of inlet sediment bypassing proposed by
FitzGerald et al. (1978 cited in FitzGerald, 1988)
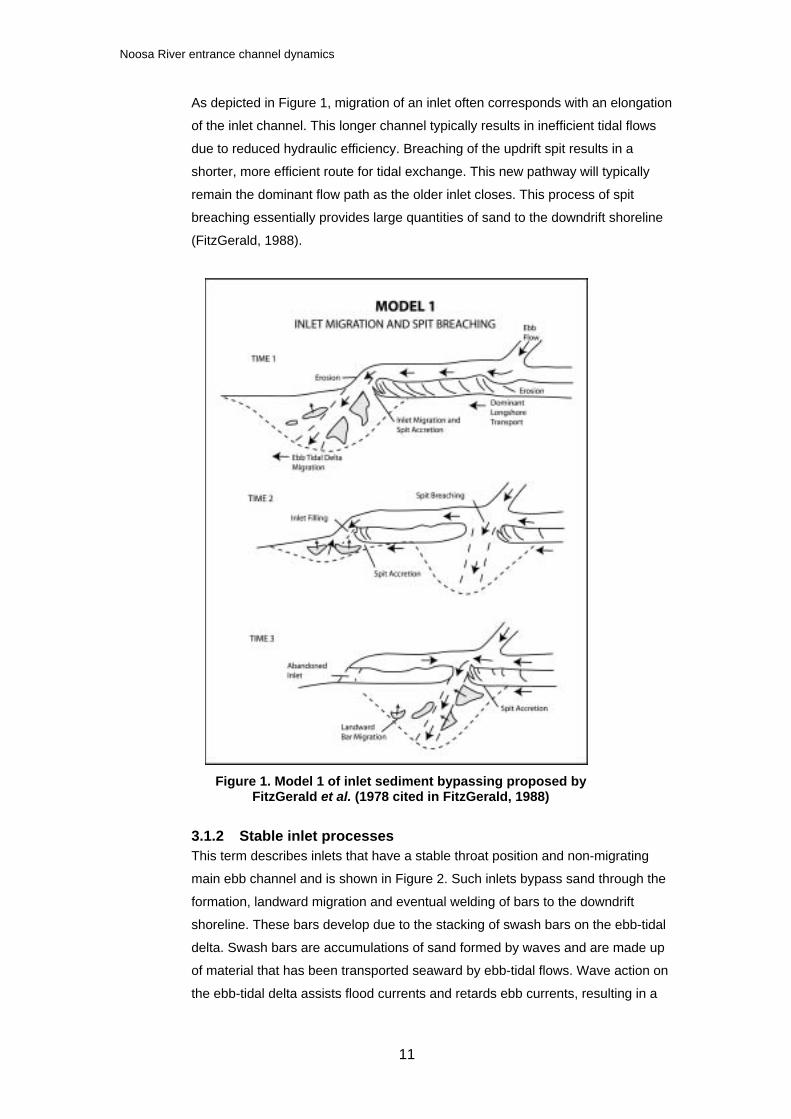
3.1.2 Stable inlet processes This term describes inlets that have a stable throat position and non-migrating
main ebb channel and is shown in Figure 2. Such inlets bypass sand through the
formation, landward migration and eventual welding of bars to the downdrift
shoreline. These bars develop due to the stacking of swash bars on the ebb-tidal
delta. Swash bars are accumulations of sand formed by waves and are made up
of material that has been transported seaward by ebb-tidal flows. Wave action on
the ebb-tidal delta assists flood currents and retards ebb currents, resulting in a
Noosa River entrance channel dynamics
12
net landward movement of sediment on both sides of the channel. These bars
begin to stack on one another due to a decrease in the rate of onshore migration
as they approach the shoreline (FitzGerald, 1988). This onshore migration
essentially provides a means of inlet bypassing.
Figure 2. Model 2 of inlet sediment bypassing proposed by
FitzGerald et al. (1978 cited in FitzGerald, 1988)
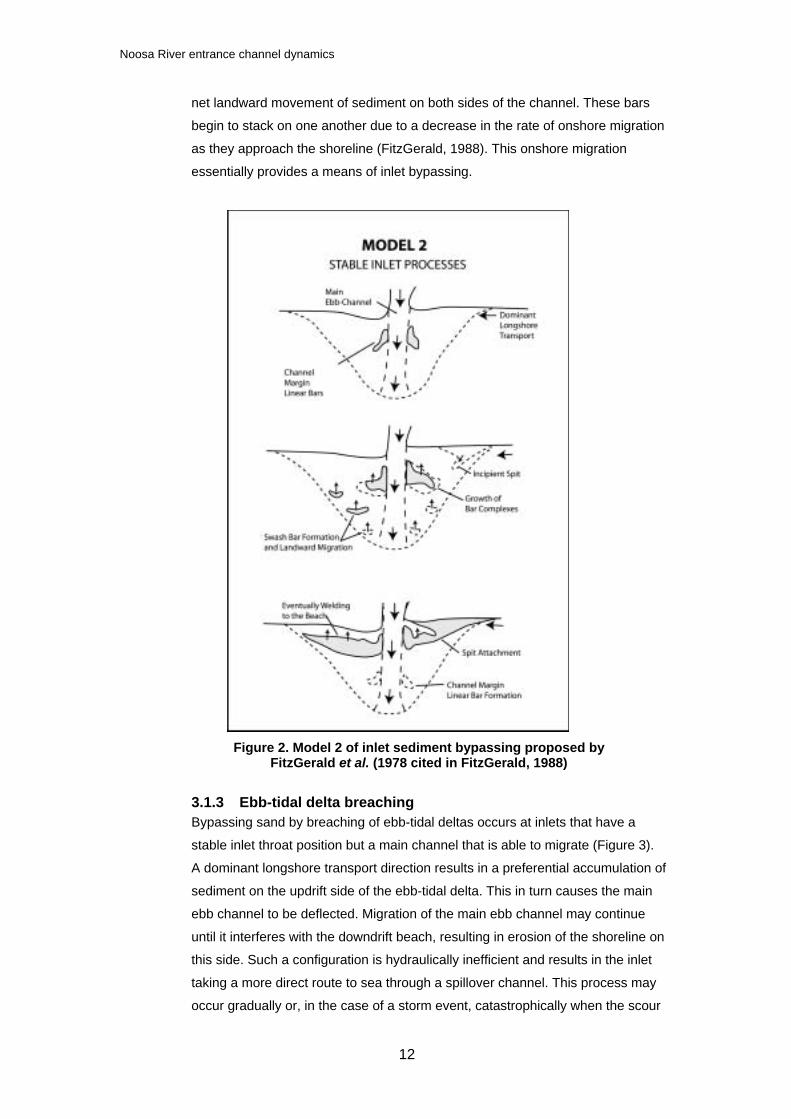
3.1.3 Ebb-tidal delta breaching Bypassing sand by breaching of ebb-tidal deltas occurs at inlets that have a
stable inlet throat position but a main channel that is able to migrate (Figure 3).
A dominant longshore transport direction results in a preferential accumulation of
sediment on the updrift side of the ebb-tidal delta. This in turn causes the main
ebb channel to be deflected. Migration of the main ebb channel may continue
until it interferes with the downdrift beach, resulting in erosion of the shoreline on
this side. Such a configuration is hydraulically inefficient and results in the inlet
taking a more direct route to sea through a spillover channel. This process may
occur gradually or, in the case of a storm event, catastrophically when the scour
Noosa River entrance channel dynamics
13
potential of the ebb jet has been increased by floodwaters. Once the delta has
been breached, the major portion of flow will pass through this new channel and
the abandoned channel will gradually fill. The result of this process is the
bypassing of a large volume of sand that was previously stored in the ebb-tidal
delta (FitzGerald, 1988).
Figure 3. Model 3 of inlet sediment bypassing proposed by FitzGerald et al. (1978 cited in FitzGerald, 1988)
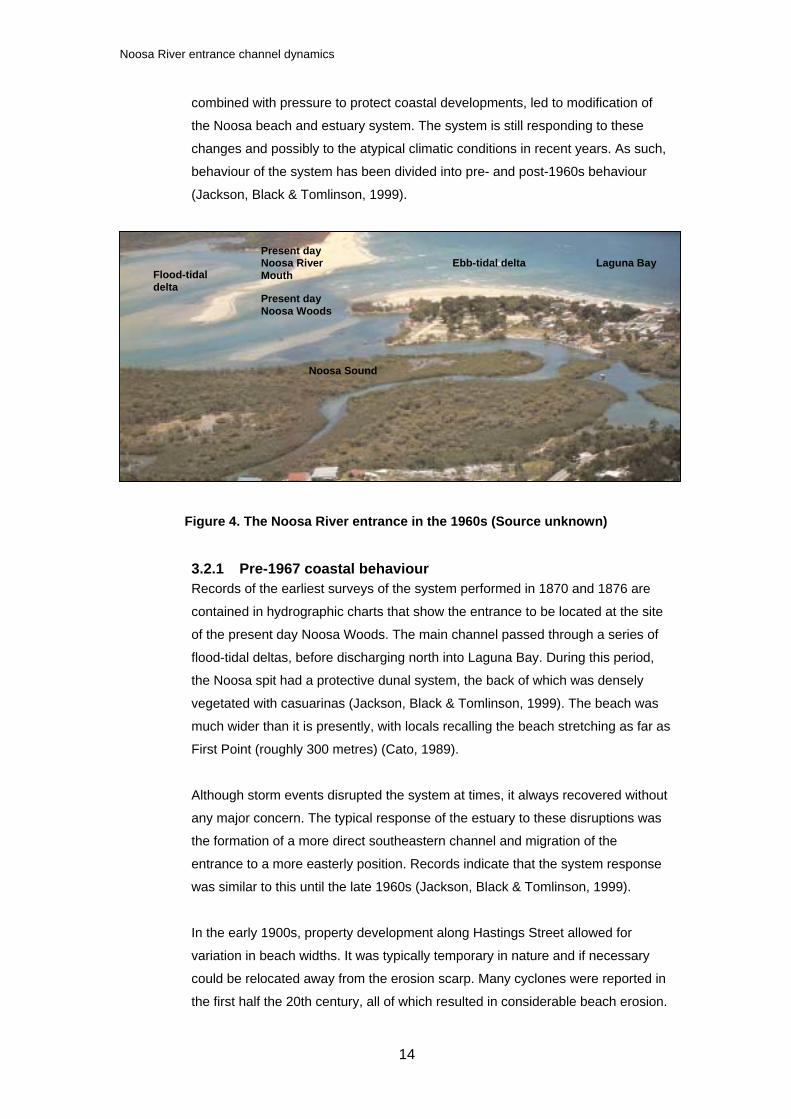
3.2 History of Noosa beach and estuary system Erosion of Noosa Main Beach has been an ongoing problem, resulting in property
damage and adverse effects for tourism and businesses in the area. Historical
records indicate that prior to the 1960s, the Noosa beach and estuary system
appear to have been in a state of dynamic equilibrium. Figure 4, taken in the
1960s, shows that the entrance to the river was wide, containing large ebb- and
flood-tidal deltas and able to migrate freely. Severe storm events in 1967,
Noosa River entrance channel dynamics
14
combined with pressure to protect coastal developments, led to modification of
the Noosa beach and estuary system. The system is still responding to these
changes and possibly to the atypical climatic conditions in recent years. As such,
behaviour of the system has been divided into pre- and post-1960s behaviour
(Jackson, Black & Tomlinson, 1999).
Figure 4. The Noosa River entrance in the 1960s (Source unknown)
3.2.1 Pre-1967 coastal behaviour Records of the earliest surveys of the system performed in 1870 and 1876 are
contained in hydrographic charts that show the entrance to be located at the site
of the present day Noosa Woods. The main channel passed through a series of
flood-tidal deltas, before discharging north into Laguna Bay. During this period,
the Noosa spit had a protective dunal system, the back of which was densely
vegetated with casuarinas (Jackson, Black & Tomlinson, 1999). The beach was
much wider than it is presently, with locals recalling the beach stretching as far as
First Point (roughly 300 metres) (Cato, 1989).
Although storm events disrupted the system at times, it always recovered without
any major concern. The typical response of the estuary to these disruptions was
the formation of a more direct southeastern channel and migration of the
entrance to a more easterly position. Records indicate that the system response
was similar to this until the late 1960s (Jackson, Black & Tomlinson, 1999).
In the early 1900s, property development along Hastings Street allowed for
variation in beach widths. It was typically temporary in nature and if necessary
could be relocated away from the erosion scarp. Many cyclones were reported in
the first half the 20th century, all of which resulted in considerable beach erosion.
Present day Noosa River Mouth
Present day Noosa Woods
Flood-tidal delta
Ebb-tidal delta Laguna Bay
Noosa Sound
Noosa River entrance channel dynamics
15
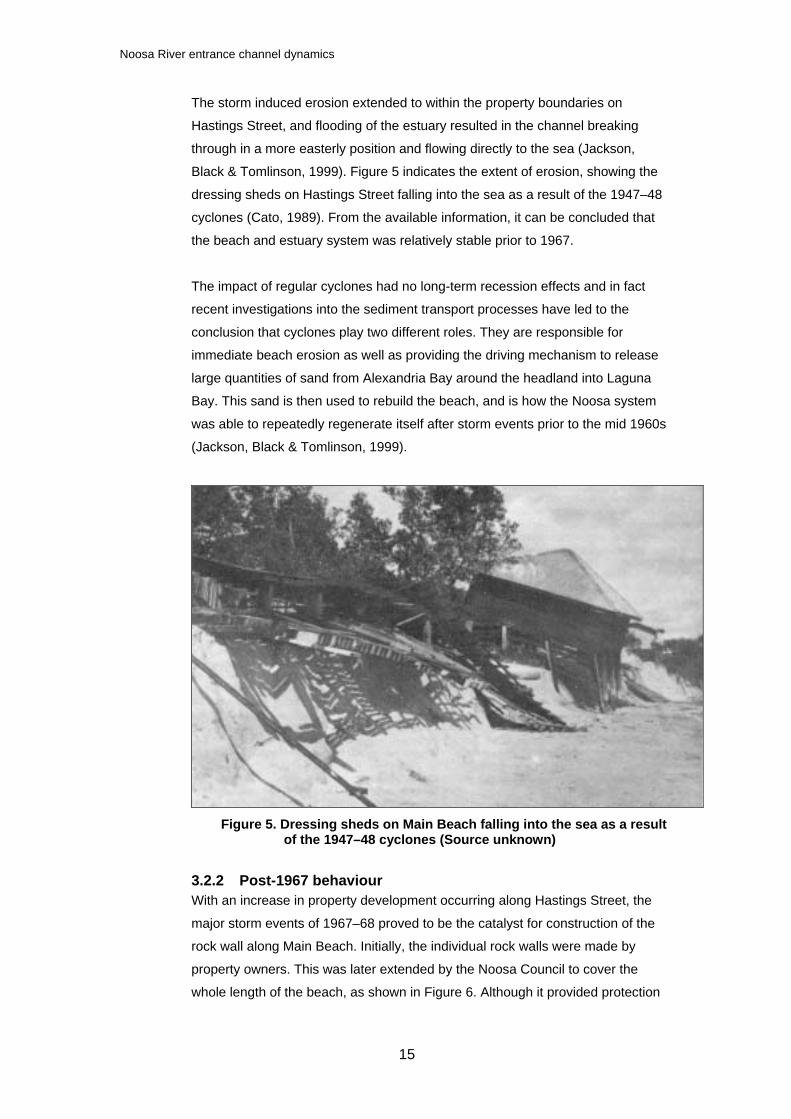
The storm induced erosion extended to within the property boundaries on
Hastings Street, and flooding of the estuary resulted in the channel breaking
through in a more easterly position and flowing directly to the sea (Jackson,
Black & Tomlinson, 1999). Figure 5 indicates the extent of erosion, showing the
dressing sheds on Hastings Street falling into the sea as a result of the 1947–48
cyclones (Cato, 1989). From the available information, it can be concluded that
the beach and estuary system was relatively stable prior to 1967.
The impact of regular cyclones had no long-term recession effects and in fact
recent investigations into the sediment transport processes have led to the
conclusion that cyclones play two different roles. They are responsible for
immediate beach erosion as well as providing the driving mechanism to release
large quantities of sand from Alexandria Bay around the headland into Laguna
Bay. This sand is then used to rebuild the beach, and is how the Noosa system
was able to repeatedly regenerate itself after storm events prior to the mid 1960s
(Jackson, Black & Tomlinson, 1999).
Figure 5. Dressing sheds on Main Beach falling into the sea as a result
of the 1947–48 cyclones (Source unknown)
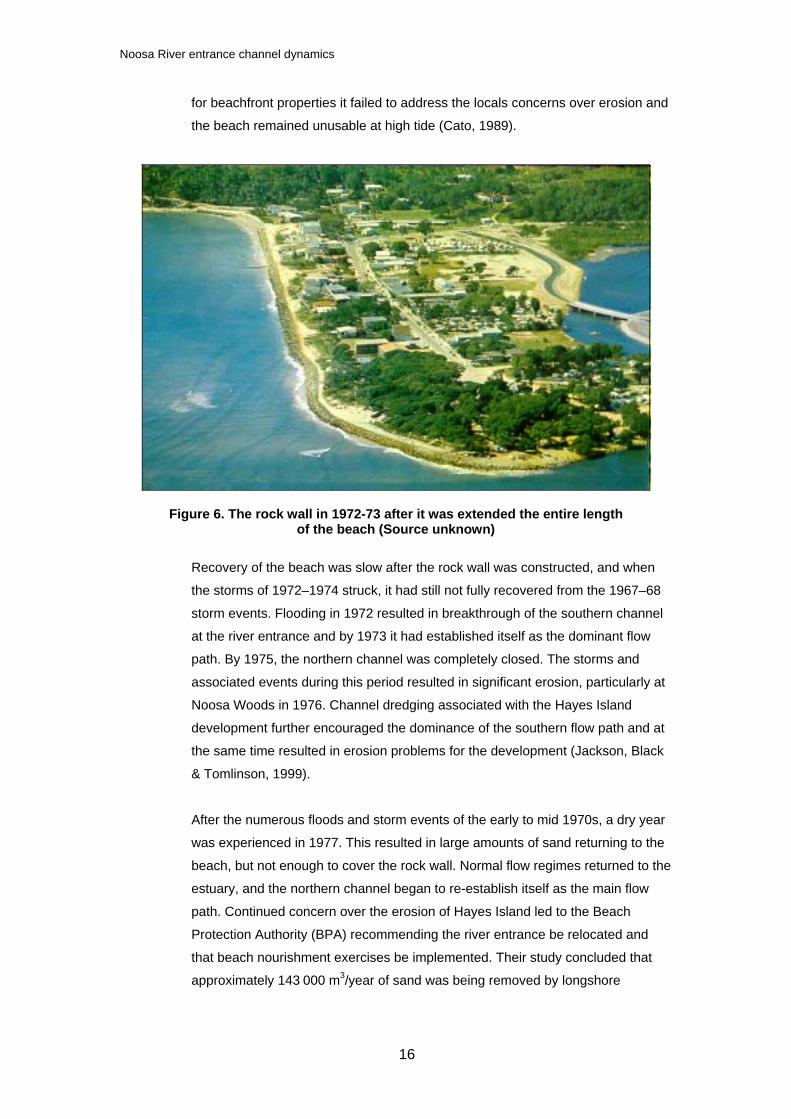
3.2.2 Post-1967 behaviour With an increase in property development occurring along Hastings Street, the
major storm events of 1967–68 proved to be the catalyst for construction of the
rock wall along Main Beach. Initially, the individual rock walls were made by
property owners. This was later extended by the Noosa Council to cover the
whole length of the beach, as shown in Figure 6. Although it provided protection
Noosa River entrance channel dynamics
16
for beachfront properties it failed to address the locals concerns over erosion and
the beach remained unusable at high tide (Cato, 1989).
Figure 6. The rock wall in 1972-73 after it was extended the entire length of the beach (Source unknown)
Recovery of the beach was slow after the rock wall was constructed, and when
the storms of 1972–1974 struck, it had still not fully recovered from the 1967–68
storm events. Flooding in 1972 resulted in breakthrough of the southern channel
at the river entrance and by 1973 it had established itself as the dominant flow
path. By 1975, the northern channel was completely closed. The storms and
associated events during this period resulted in significant erosion, particularly at
Noosa Woods in 1976. Channel dredging associated with the Hayes Island
development further encouraged the dominance of the southern flow path and at
the same time resulted in erosion problems for the development (Jackson, Black
& Tomlinson, 1999).
After the numerous floods and storm events of the early to mid 1970s, a dry year
was experienced in 1977. This resulted in large amounts of sand returning to the
beach, but not enough to cover the rock wall. Normal flow regimes returned to the
estuary, and the northern channel began to re-establish itself as the main flow
path. Continued concern over the erosion of Hayes Island led to the Beach
Protection Authority (BPA) recommending the river entrance be relocated and
that beach nourishment exercises be implemented. Their study concluded that
approximately 143 000 m3/year of sand was being removed by longshore
Noosa River entrance channel dynamics
17
transport, and that approximately 13 500m3/year had been passing into the
estuary over the previous thirty years (Jackson, Black & Tomlinson, 1999).
In 1978, the training wall at the entrance to the Noosa River was completed,
resulting in a new beach system being established. Training of river entrances is
generally performed to stabilise the entrance and improve navigation. Oddly, a
single training jetty was constructed even though these structures had proven
almost worthless in other locations. An investigation by Floyd (1968) concluded
that with the construction of single jetties, entrances remain unstable and were no
better than if left untouched. The effect of the training wall was to move the ebb
delta westward. Combined with the Hayes Island development, associated
channel dredging and infilling of the new entrance, the ebb-tidal delta was unable
to grow and the protection it provided was removed. As such, the northern
migration of the entrance and re-establishment of the northwestern channel was
unable to occur (Jackson, Black & Tomlinson, 1999).
A similar series of events occurred at Morris Island in the USA. In the late 1800s,
jetties were constructed in an attempt to stabilise the main channel leading into
Charleston Harbour. After the jetties were installed, the longshore supply of sand
to the deltas was cut off and resulted in their size decreasing. This decrease
corresponded to a decrease in the protection provided by the deltas and resulted
in the adjacent shorelines eroding at three times the rate they had prior to jetty
construction (FitzGerald, 1988).
Completion of the entrance works along the Noosa River was followed by the
placement of 200 000 m3 of nourishment sand on the beach. This was eroded
right back to the seawall within two years and led to further investigation by the
BPA that focused on the longshore transport rates. Their recommendations were
that a rock groyne and additional nourishment was required. In 1982–83, a 160 m
rock groyne was constructed and a further 220 000 m3 of nourishment sand
added. This was quickly eroded and in 1988 another 140 000 m3 was pumped
onto the beach and recommendations made that further nourishment be used to
maintain a useable beach (Jackson, Black & Tomlinson, 1999).
Since then, regular beach nourishment exercises have placed approximately
80 000 m3 of sand on the beach every two years. Combined with these
nourishment activities, the rock groyne has resulted in a ‘dynamically stable’
beach system, though Main Beach remains cut back to the seawall for much of its
length and for most of the time. Studies of the region have identified a number of
factors contributing to the erosion of Main Beach since the new control point was
Noosa River entrance channel dynamics
18
established by construction of the rock groyne. However, the primary cause of
erosion is due to the misalignment of the wave crests with the seawall. The
predominant southeasterly swell results in longshore movement of sand from
Main Beach in a northerly direction towards the river, bypassing the tip of the
groyne. A number of solutions have been considered but all have been rejected
for a variety of reasons (Jackson et al., 2001).
In order to maintain fish habitats inside the Noosa River inlet, the EPA has
restricted where dredging can be undertaken. The ‘inactive’ zones adjacent to
Noosa Sound (formerly Hayes Island) have been used in the past but the supply
of sand from this region has almost been exhausted. Continued nourishment is
not seen as a viable option as doubt exists over the continuing availability of a
suitable sand source.

Noosa River entrance channel dynamics
19
4 Methodology Many investigations have been performed at Noosa including the collection of
large volumes of wave, current and bathymetric data. These have been used to
gain an understanding of and to model coastal processes, in an attempt to
evaluate options to solve the erosion problem (Jackson et al., 2001). However, no
studies have been undertaken that describe the history of the inlet in as much
detail as presented here. No previous research has investigated the behaviour of
nourishment sand introduced to the system, and the impact that it has on the inlet
configuration. Therefore, this study will complement those that have been
undertaken in the past by explaining in more detail the processes occurring at the
inlet as a result of nourishment sand entering the system.
Flights over the Queensland coastline are performed at regular intervals by the
BPA, with aerial photography incorporated to monitor the state of the beaches.
These photographs provide a valuable resource that can be used to describe the
coastal response to weather conditions and human- related impacts. This project
will use these historical aerial photographs of the region to develop a time series
account of how the system has been behaving.
More accurate quantitative results could be provided by studies using radioactive
tracers and recording devices, or sophisticated computer or physical modelling
(for example). However, the resources and necessary time for such projects were
currently unavailable and data contained in the historical aerial photographs
provided the best opportunity for this investigation to be undertaken. The ability to
correlate the dredging records provided by Noosa Council and the storm events
described in previous reports allows an accurate description of the system’s
response to be obtained.
The analysis described in the following chapter follows standard photographic
interpretation techniques. A qualitative assessment will be made of the movement
of channels, direction of flow, vegetation changes, bank erosion and delta
deposition.
Noosa River entrance channel dynamics
20
5 Aerial photograph analysis The following sections describe the aerial photographs available for the project
that contain information relevant to this study. All photos form part of the BPA’s
aerial photography collection and can be viewed in Figures 9–40 in Appendix 1.
5.1 19 May 1972 (Figure 9) There is very little useable beach area along Hastings Street and the rock wall is
visible for the entire length of beach.
Both the northern and southern channels are open. The flood of 1972 has
resulted in the southern channel passing directly to the sea through the site of the
present-day Noosa Woods and the ebb-tidal delta has formed some distance off
the beach. The northern channel follows the path of the shoreline and is directed
a long way (about 800 m) south by the northern spit before joining the southern
channel.
The flood-tidal delta separating the channels is very large, being approximately
950 m across at its widest point.
5.2 12 September 1973 (Figure 10) The condition of Main Beach appears relatively unchanged since the previous
photo (from 1972). The Hayes Island development has been completed and the
southern channel passes alongside the development before being directed
northeasterly by the end of Hastings Street. This deflection has resulted in
erosion back to the car park and vegetation line in this area.
5.3 13 February 1974 (Figure 11) Still very little useable area exists on the eastern end of Main Beach. Additional
development has occurred next to Munna Point and at the entrance of Weyba
Creek. A large dredge hole that supplied material for this development is
apparent in front of Munna Point.
Although both channels are open, deposition of the northern spit and
southeastern corner of the flood-tidal delta has constricted the northern channel.
This has resulted in the southern channel becoming the dominant flow path and
may be a result of the decrease in frictional resistance due to the dredge hole.
Noosa River entrance channel dynamics
21
5.4 6 February 1978 (Figure 12) Still very little useable beach exists along Hastings Street and the rock wall
remains visible for the entire length of beach. Deposition on the southern side of
the inlet has resulted in the formation of a sand spit that extends around 180 m
from the vegetation line. Growth of this spit indicates that longshore transport
mechanisms are acting to move sand off Main Beach and into the ‘active’ zone.
This sand would have been transported from Alexandria Bay during the cyclones
of the mid 1970s, combined with the small amount pumped onto the beach after
the 1972–74 storms.
The southern and northern channels remain open, with the southern channel
running directly alongside Noosa Sound (formerly Hayes Island). The northern
channel appears to be the dominant flow path (as evidenced by the narrowing of
the channel alongside Noosa Sound). Deposition along the southern spit results
in the channel switching back to the west, before exiting in a northeasterly
direction. This area remains eroded back to the car park and vegetation line at
the end of Hastings Street.
Because of the channel migration, the northern spit has eroded but remains quite
large (approximately 600 m length). Erosion here would be in response to the
channel attempting to maintain its cross-sectional flow area and is common on
the opposite bank to where deposition occurs (FitzGerald, 1988).
The southern channel becomes quite narrow at the middle of Noosa Sound. This
would have resulted in an increase in flow velocity through this section and hence
the erosion concerns for the development.
The size of the flood-tidal delta separating the channels remains similar to
previous photos, although the shape has changed slightly.
5.5 9 April 1978 (Figure 13) The quality of this photo reduces the ability to determine the finer details of the
beach and estuary system but once again the area of useable beach along
Hastings Street remains minimal and the rock wall is visible.
Both the northern and southern channels remain open but the northern channel
still appears to be the dominant flow path. Deposition of the southern spit has
caused the inlet to migrate slightly to the north, resulting in erosion of the northern
spit. This spit has been breached, resulting in the tip of the northern spit
becoming separated from the north shore.
Noosa River entrance channel dynamics
22
The flood-tidal delta separating the two channels remains virtually unchanged, as
does the cutback of the southern channel to the car park and vegetation line at
the end of Hastings Street.
5.6 26 June 1978 (Figure 14) Noosa Main Beach remains eroded but there is a deposition of sand evident on
the southern spit.
In response to channel dredging near Munna Point, and hence a decrease in
frictional resistance, the southern channel has become the dominant flow path.
Flood tides have moved sand into the channel in an attempt to fill the dredge
holes. Pumping of sand to enable construction of the training wall has resulted in
a blockage of the northern channel that now appears to be in the process of
breaking through the spit closer to the vegetation line of the north shore.
5.7 13 July 1978 (Figure 15) The eastern end of Main Beach remains eroded.
The northern channel has breached the northern spit and nourishment works
associated with the training wall development have closed the southern channel.
Sand now fills the area that is the present-day Noosa Woods and connects the
flood-tidal delta that typically separates the northern and southern channels. Part
of the northern tip of this flood-tidal delta has been dredged, leaving a small sand
‘outcrop’.
5.8 4 September 1978 (Figure 16) A section of the training wall has been constructed. Continued sand nourishment
associated with the training wall (200 000 m3) has provided a wide beach along
Hastings Street and has continued to fill the area that represents the present-day
Noosa Woods. A second ‘finger’ of sand is connected to the flood-tidal delta in
the middle of the entrance.
The northern channel has developed a more meandering configuration and has
resulted in slight erosion of the northern spit. In addition, the outcrop resulting
from previous dredging on the northern tip of the flood-tidal delta (refer to
Section 5.7, 13 July 1978) has being removed (presumably to fill the dredge
hole), resulting in an increased cross-sectional flow through this region.
Noosa River entrance channel dynamics
23
5.9 13 October 1978 (Figure 17) Once again, the quality of this photo makes the minor changes difficult to
determine, but it does appear that sand from the eastern side of the training wall
is starting to migrate around the tip of the wall. Other than this, little change can
be detected.
5.10 5 December 1978 (Figure 18) There is little change evident on Noosa Main Beach, but erosion does appear to
be occurring on the eastern side of the training wall.
Deposition on the north shore has resulted in the northern spit becoming
elongated. The channel is moving back towards the training wall in response to
the growth of the northern spit and in an attempt to maintain its cross-sectional
area. This has resulted in a slightly longer channel length due to the increased
meandering.
The area in front of Noosa Sound remains virtually unchanged while the northern
tip of the flood-tidal delta has eroded slightly due to channel migration resulting
from the elongation of the northern spit.
5.11 23 May 1979 (Figure 19) The eastern end of Hastings Street is not visible in this photo but deposition on
the eastern side of the training wall suggests that longshore transport
mechanisms are removing sand from Main Beach. This deposition around the
training wall is resulting in the formation of a southern spit.
The northern spit has moved almost parallel with the training wall, and a small
delta has formed in the middle of the inlet. This has resulted in the separation of
flow paths through the inlet and is deflecting the more dominant southern channel
towards Noosa Woods. Dredge holes are apparent near Munna Point and the
north shore, with signs that the system is attempting to fill them on the flood tides.
This would be consistent with the movement of sand off Main Beach and into the
‘active’ zone and would be encouraged by the decrease in frictional resistance
associated with the dredge holes.
The first signs of vegetation are appearing on the newly formed Noosa Woods
area.
Noosa River entrance channel dynamics
24
5.12 14 June 1980 (Figure 20) Once again, the area of useable beach at the eastern end of Hastings Street has
been greatly reduced. Deposition at the training wall extends to the end of the
structure and has resulted in a spit formation that has welded to the flood-tidal
delta that typically separates the two channels. As a result, the southern channel
has been blocked.
Deposition of the flood-tidal delta and the southern spit/delta formation has
resulted in a northerly migration of the channel. This migration has resulted in a
shortened northern spit, as the channel attempts to maintain its cross-sectional
flow area.
The dredge hole closest to the north shore (and visible in previous photo)
appears to have been filled and a deposition of sediment in this region is
apparent. The hole closest to Munna Point is now only slightly visible.
Vegetation on the Noosa Woods site is becoming more established.
5.13 5 March 1981 (Figure 21) The eastern end of Main Beach remains in an eroded state, providing very little
useable beach area. The 200 000 m3 of nourishment material added after
completion of the training wall has been eroded back to the seawall (Jackson,
Black & Tomlinson, 1999).
Deposition of the ebb-tidal delta has resulted in the channel exiting in a more
northerly direction. The amount of sand on the beach between the training wall
and the river end of Hastings Street has reduced (presumably to form the ebb-
tidal delta).
The northern spit has grown in size with little change to its shape. This has
resulted in erosion and re-shaping of the southern spit as the channel attempts to
maintain its cross-sectional flow area. The southern channel still remains cut off
by this spit and delta formation while the northern channel has increased its
length through additional meandering.
The dredge holes are continuing to fill and are becoming less visible.
Noosa River entrance channel dynamics
25
5.14 7 July 1982 (Figure 22) The eastern end of Main Beach is not visible in this photograph but the width of
beach between the training wall and the western end of Hastings Street has
increased. Around 220 000 m3 of nourishment sand was added in 1981, some
time after 5 March, as the dredge holes are not apparent in the previous photo.
The southern spit and ebb-tidal delta have enlarged, as would be expected after
beach nourishment is performed. The channel remains in a similar position and
shape to the previous photo but the entrance has migrated further north due to
growth of southern spit and ebb-tidal delta. The northern spit has been eroded as
a result of this migration as the channel attempts to maintain its cross-sectional
flow area. The northern channel is the dominant flow path but it appears the
southern channel may be re-opening.
Beach nourishment has resulted in a large volume of sand being introduced to
the system as evidenced by the infilling of the channel and formation of many
deltas inside the entrance. Flood tides are transporting sand as far back as
Munna Point at low tide (when flow is restricted to the channel), as indicated by
the formation of deltas in this region and further upstream. The flood-tidal delta
has grown in size considerably due to the deposition of sediment at higher tides
when water passes over this region.
Dredge holes are apparent at Munna Point and adjacent to Noosa Sound, while
the vegetation on Noosa Woods is becoming well established.
5.15 26 June 1983 (Figure 23) The width of the eastern end of Main Beach appears quite small but the area
between the groyne and training wall appears to have remained relatively
constant.
The southern channel has reopened and cuts back slightly into the Noosa Woods
area, but the northern channel remains the dominant flow path. The volume of
sand in the ebb-tidal delta has decreased. The northern spit has grown and
resulted in the entrance migrating towards the training wall. The inlet now faces
its more characteristic easterly direction compared to its previously northern
orientation.
The flood-tidal delta between the two channels remains a dominant feature of the
system.
Noosa River entrance channel dynamics
26
5.16 23 November 1984 (Figure 24) The eastern end of Main Beach is not visible in this photo but the area between
the groyne and training wall appears to be eroding, as evidenced by the removal
of sand from the tip of the training wall. It appears this sand is moving into the
system to fill the southern channel, as it is now only a minor flow path.
Considerable deposition of the northern spit is obvious and has forced the
channel to meander back towards the training wall before exiting alongside it.
This meandering has increased the channel length, and migration towards the
training wall has almost entirely removed the southern spit.
The flood-tidal delta between the two channels appears to be growing in size and
is responsible for the blockage of the southern flow path.
5.17 12 September 1985 (Figure 25) The useable area of Main Beach appears quite small and erosion along the
western side of the rock groyne is apparent. This sand is moving into the system
and has resulted in deposition of the southern spit and ebb-tidal delta.
Deposition of the northern spit has increased the channel length, resulting in it
cutting further back into the Noosa Woods area before exiting in a northeasterly
direction. In addition, a second minor channel has formed on the north shore that
appears to be discharging at higher tides. There are signs that the northern
channel is infilling, as shown by the decreased channel width between the flood-
tidal delta and northern spit. In addition, it appears that the southern channel is
conveying larger flows.
Growth of the deltas opposite Munna Point is evident, further indicating the
transport of sand into the system in an attempt to fill the dredge holes.
5.18 28 August 1986 (Figure 26) The eastern end of Hastings Street is not visible, but deposition on the eastern
side of the rock groyne extends approximately two-thirds of the length of the
structure. However, erosion on the western side of the rock groyne is obvious.
The northern spit is quite long and hooks back towards the north shore inside the
river entrance. It connects to the flood-tidal delta and effectively blocks the
northern channel. The southern channel is now the dominant flow path and has
migrated towards the north shore due to growth of the southern spit and ebb-tidal
delta.
Noosa River entrance channel dynamics
27
The dredge holes near Munna Point are less visible and the volume of sand
contained in deltas in this region appears to have decreased.
5.19 23 July 1987 (Figure 27) Once again, the eastern end of Main Beach is not visible in this photo but the
amount of sand on the eastern side of the groyne has reduced and further
erosion between the groyne and training wall is apparent. Sand appears to be
bypassing the inlet on the ebb-tidal delta and being deposited on the north shore,
as deposition is evident in this region.
The northern channel has breached the northern spit and become the dominant
flow path. The material that previously formed the southern spit has been
transported back into the system, effectively blocking the southern flow path.
Deposition on the ocean side of the northern spit has forced the entrance towards
the training wall. As material is deposited on the northern side, the channel
migrates towards the training wall in an attempt to maintain its cross-sectional
flow area.
The flood-tidal delta inside the entrance has grown in size considerably and the
previously dominant southern channel now contains significant amounts of sand.
5.20 12 June 1988 (Figure 28) Erosion on the western side of the rock groyne has continued, resulting in a
relatively narrow section of beach.
The colour of the water suggests a recent fresh (i.e. rainfall) event that would
have increased the volume of ebb-tidal flows. The southern channel has
reopened and both channels are operating. The southern spit is quite large and
has recently been breached by ebb flows in an easterly direction.
The northern spit has grown in size compared to the previous photo (from 1987).
It forces the channel to meander back ‘sinusoidally’ before joining the southern
channel flow path. At this point, the channel exits in a northerly direction.
The large flood-tidal delta still separates the northern and southern channels.
Noosa River entrance channel dynamics
28
5.21 17 December 1990 (Figure 29) Between October 1988 and January 1989, 140 000 m3 of nourishment sand was
added to the beach. The effect of this material on the useable area of beach is
not clear as the eastern end of Hastings Street is not visible in this photo. It can
be seen that the western side of the rock groyne remains in an eroded state.
In this photo, both channels are open although it appears that the northern
channel may be in the process of filling between the tip of the northern spit and
the flood-tidal delta.
The volume of sand contained in both the northern and southern spits remains
virtually unchanged since the previous photo (from 1988), although the shape of
each has altered slightly.
5.22 15 April 1991 (Figure 30) The width of useable beach towards the middle section of Hastings Street is
relatively narrow, but more sand is evident than in previous photos. This is due to
the addition of 41 570 m3 of nourishment sand between June 1990 and
November 1990.
The northern channel was blocked by overwash of the northern spit into the
channel. However, the northern spit had recently been breached close to the
vegetation line on the north shore. The more direct southern channel remains the
dominant flow path (Jackson, Black & Tomlinson, 1999).
The southern channel cuts back towards Noosa Woods. Deposition of the
southern spit then forces the channel toward the north shore, before exiting in a
north-northeasterly direction. Some erosion is evident on the eastern side of the
training wall at Noosa Woods.
The flood-tidal delta separates the northern and southern flow paths but has
changed little since the previous photo (from 1990). Flood tides are transporting
sand further up the river, as evidenced by the formation of deltas where the
northern channel changes direction near Munna Point.
5.23 6 June 1992 (Figure 31) There is very little useable beach area towards the eastern end of Hastings Street
(about 50 m wide) and the volume of sand accumulated on the eastern side of
the rock groyne has reduced slightly. Considerable erosion between the groyne
and the training wall is also apparent.
Noosa River entrance channel dynamics
29
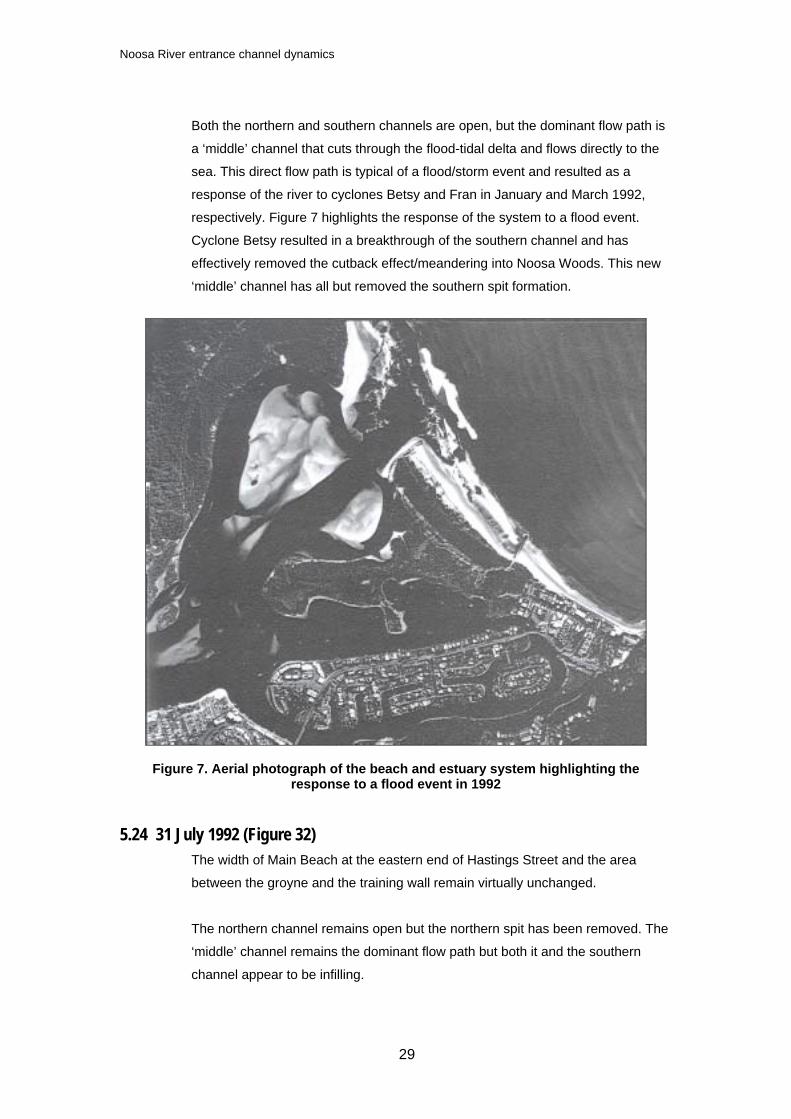
Both the northern and southern channels are open, but the dominant flow path is
a ‘middle’ channel that cuts through the flood-tidal delta and flows directly to the
sea. This direct flow path is typical of a flood/storm event and resulted as a
response of the river to cyclones Betsy and Fran in January and March 1992,
respectively. Figure 7 highlights the response of the system to a flood event.
Cyclone Betsy resulted in a breakthrough of the southern channel and has
effectively removed the cutback effect/meandering into Noosa Woods. This new
‘middle’ channel has all but removed the southern spit formation.
Figure 7. Aerial photograph of the beach and estuary system highlighting the response to a flood event in 1992
5.24 31 July 1992 (Figure 32) The width of Main Beach at the eastern end of Hastings Street and the area
between the groyne and the training wall remain virtually unchanged.
The northern channel remains open but the northern spit has been removed. The
‘middle’ channel remains the dominant flow path but both it and the southern
channel appear to be infilling.
Noosa River entrance channel dynamics
30
5.25 2 March 1993 (Figure 33) The width of Main Beach and the area between the rock groyne and the raining
wall appear to be relatively unchanged since the previous photo (from 1992) and
deposition at both northern and southern spits is minor. This suggests there is a
shortage of material available for longshore transport processes as deposition on
the spits is usually the first opportunity for sediments to settle.
The northern and dominant middle channel remains open but some changes are
apparent. Growth of the northern spit has resulted in the northern channel having
a more meandering configuration at its exit and it appears the spit may be in the
process of connecting to the flood-tidal delta.
Growth of the flood-tidal delta is causing a deflection of flow towards Noosa
Woods. This in turn is putting pressure on the southern channel to reopen. The
delta formations further inside the entrance (towards Munna Point) remain
relatively unchanged.
5.26 25 May 1994 (Figure 34) There are much larger volumes of sand between the groyne and the training wall
visible at this time, while accumulations of sand are maintained towards the
eastern end of Hastings Street. In addition, both northern and southern spits have
experienced considerable growth. As this has occurred in the absence of
nourishment activities, it is assumed that this material was transported around the
headland from Alexandria Bay by the cyclones of 1992.
The northern channel is completely blocked off with the spit having welded to the
flood-tidal delta. The southern spit has forced the channel to migrate to a more
northerly position and it exits in front of the north shore.
The middle channel remains the dominant flow path. The growth of the southern
spit has resulted in the channel moving away from Noosa Woods and extending
its length. The southern channel now contains considerable amounts of sand and
growth of the flood-tidal delta has continued.
5.27 5 September 1997 (Figure 35) Between August and November 1994, 146 000 m3 of nourishment material was
added to Main Beach, with an additional 74 930 m3 added between October and
November 1996. However, this material has been removed as the northwestern
end of Main Beach and the area between the groyne and the training wall are
again eroded.
Noosa River entrance channel dynamics
31
The river entrance has returned to a more characteristic location, exiting in a
northeasterly direction midway between the training wall and the north shore. The
northern channel has reopened, though it is only a minor flow path. The southern
channel has a ‘sinusoidal’ appearance due to growth of the southern spit and of
the flood-tidal delta towards Noosa Woods. This has resulted in the channel
cutting back into the Noosa Woods area.
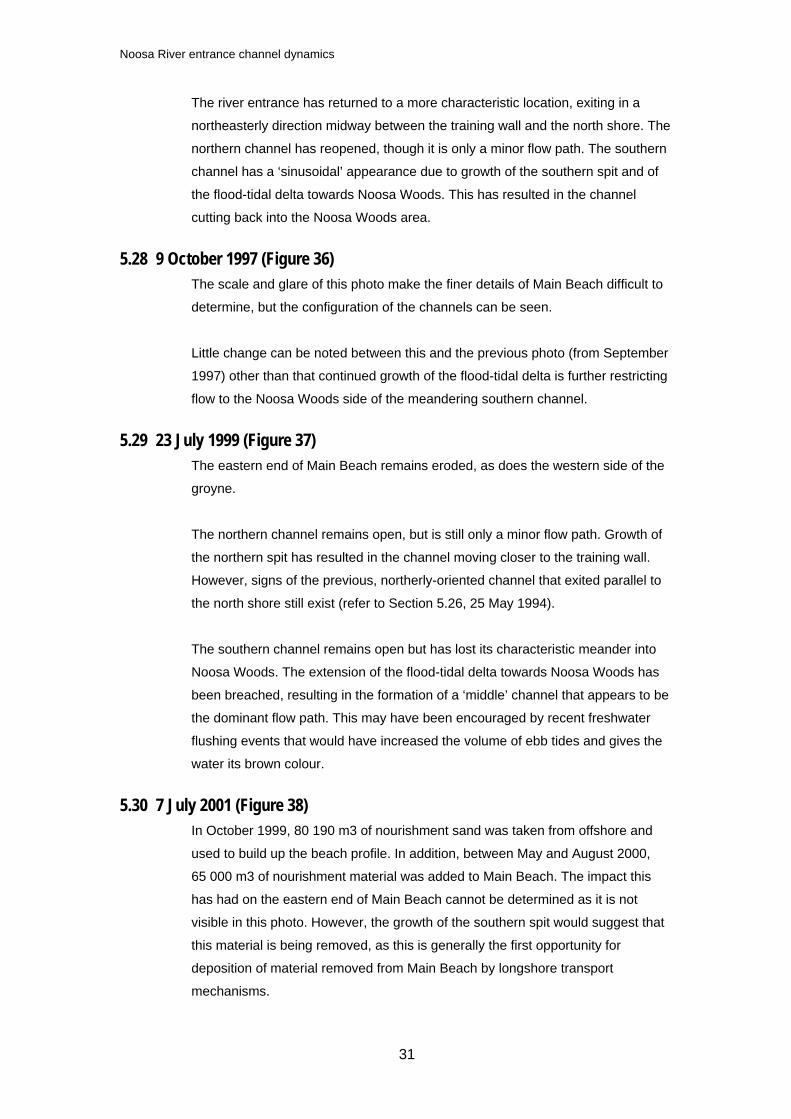
5.28 9 October 1997 (Figure 36) The scale and glare of this photo make the finer details of Main Beach difficult to
determine, but the configuration of the channels can be seen.
Little change can be noted between this and the previous photo (from September
1997) other than that continued growth of the flood-tidal delta is further restricting
flow to the Noosa Woods side of the meandering southern channel.
5.29 23 July 1999 (Figure 37) The eastern end of Main Beach remains eroded, as does the western side of the
groyne.
The northern channel remains open, but is still only a minor flow path. Growth of
the northern spit has resulted in the channel moving closer to the training wall.
However, signs of the previous, northerly-oriented channel that exited parallel to
the north shore still exist (refer to Section 5.26, 25 May 1994).
The southern channel remains open but has lost its characteristic meander into
Noosa Woods. The extension of the flood-tidal delta towards Noosa Woods has
been breached, resulting in the formation of a ‘middle’ channel that appears to be
the dominant flow path. This may have been encouraged by recent freshwater
flushing events that would have increased the volume of ebb tides and gives the
water its brown colour.
5.30 7 July 2001 (Figure 38) In October 1999, 80 190 m3 of nourishment sand was taken from offshore and
used to build up the beach profile. In addition, between May and August 2000,
65 000 m3 of nourishment material was added to Main Beach. The impact this
has had on the eastern end of Main Beach cannot be determined as it is not
visible in this photo. However, the growth of the southern spit would suggest that
this material is being removed, as this is generally the first opportunity for
deposition of material removed from Main Beach by longshore transport
mechanisms.
Noosa River entrance channel dynamics
32
The southern flow path appears now to be more dominant. Dredge holes are
visible in the ‘active’ zone opposite Munna Point. This would have reduced the
frictional resistance in this region and encouraged flood flows through the
southern channel. This increase in flow would increase the scour potential and
assist in filling the dredge holes.
Growth of the northern spit is threatening to close this channel, while the southern
channel is beginning to regain its characteristic meandering shape by cutting
back into the Noosa Woods area. Combined with the growth of the southern spit,
the southern channel is regaining a ‘sinusoidal’ shape and is effectively
increasing the channel length.
5.31 24 October 2001 (Figure 39) The area of useable beach on Main Beach has increased when compared to the
photo of 23 July 1999 (refer to Section 5.29). However, continued deposition
around the training wall would suggest that longshore transport mechanisms are
removing the material from the beach. This is in response to the trial dredge area
inside the “active” zone that the system is attempting to fill.
Growth of the southern spit is forcing the channel to migrate towards the north-
shore (about 370 m at the furthest point). The northern spit is also growing, and
has blocked the northern channel. It has ‘welded’ to the flood-tidal delta, though
there are signs of a minor flow path around the tip of the groyne at high tide. In
addition, a minor middle channel exists across the flood-tidal delta and would
transmit a small volume of flow at high tide.
The southern channel cuts back into Noosa Woods before being forced away
from the training wall by the southern spit. The ‘sinusoidal’ shape it was beginning
to obtain in the previous photo (Section 5.30) is now much more defined.
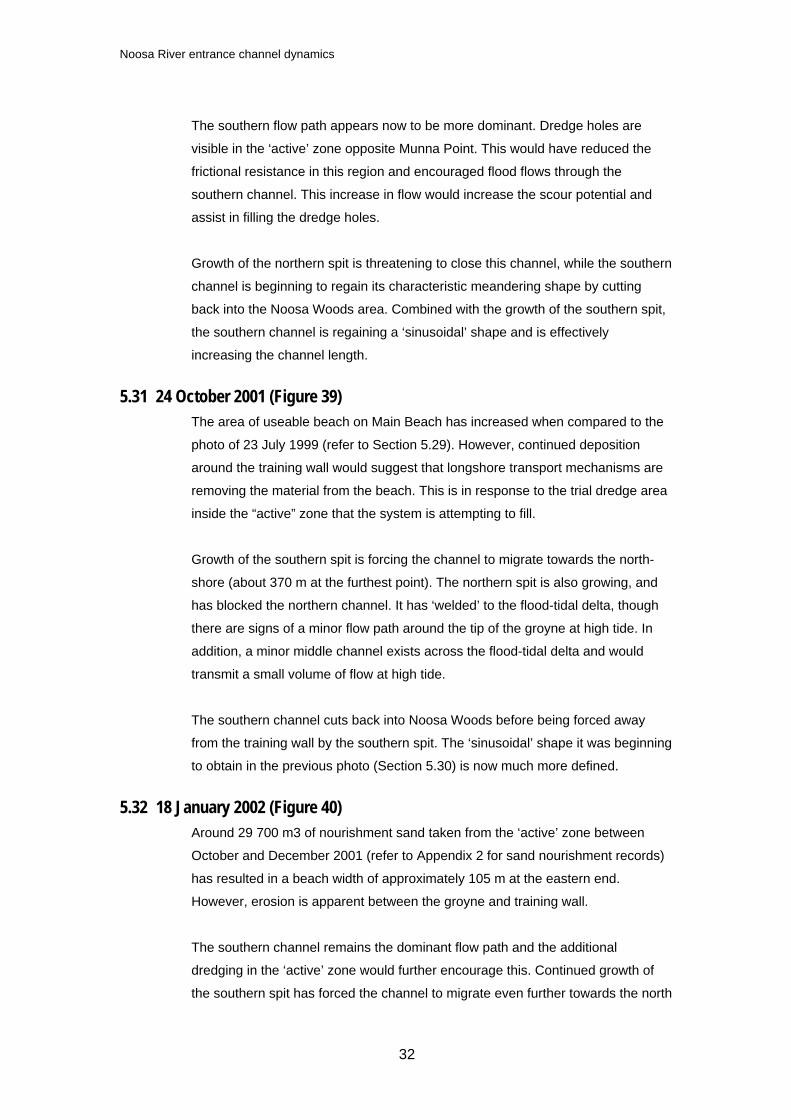
5.32 18 January 2002 (Figure 40) Around 29 700 m3 of nourishment sand taken from the ‘active’ zone between
October and December 2001 (refer to Appendix 2 for sand nourishment records)
has resulted in a beach width of approximately 105 m at the eastern end.
However, erosion is apparent between the groyne and training wall.
The southern channel remains the dominant flow path and the additional
dredging in the ‘active’ zone would further encourage this. Continued growth of
the southern spit has forced the channel to migrate even further towards the north

Noosa River entrance channel dynamics
33
shore. The ebb-tidal delta has continued to grow, resulting in a constriction of the
channel entrance and more than one discharge point is visible in this region.
There are signs that the northern spit has been breached on the flood tide, and
the minor flow path around the tip of the northern spit is still operating during high
tide. In addition, the middle channel through the flood-tidal delta is still conveying
minor flows during high tide.
Sand is continuing to be transported back into the ‘active’ zone to fill the dredge
hole. The trial dredge zone and breaching of the northern spit performed in late
2001 can be seen.
Noosa River entrance channel dynamics
34
6 Discussion As previously mentioned, training of the river entrance and other modifications to
the beach system have altered the control point and affected the way in which the
system now responds. Since 1978, when dredging for nourishment sand
commenced, the entrance has been infilling and channels realigning in response
to the altered flow regime (Jackson et al., 2001). In performing this study, a major
objective was to determine the fate of nourishment sand introduced to the system
and its effect on the Noosa River inlet. By investigating the recovery after the
1972 flood and comparing this with the recovery after the 1992 flood event, it was
hoped that similarities could be observed and used to develop a conceptual
model of how the system now responds. Furthermore, behaviour of the tidal
deltas and shoals and channel movement has been investigated in times of
limited and abundant sand supply.
The typical response of the system to flood events is the formation of a direct
channel to the sea. In 1972, this channel was deflected by the flood-tidal delta in
the middle of the lagoon area and exited via the southern channel at the end of
Hastings Street. Following this period, the system responded by forming a more
dominant northern channel. This was during a period where beach nourishment
was not being undertaken. Deposition of sand on the southern spit, however,
suggests that longshore transport mechanisms were in action and that the storm
event transported a ‘slug’ of sand around the headland that helped to rebuild the
beach system.
In recent times, the typical response of the system to flood events has been the
formation of a middle channel that cuts through the dominant flood-tidal shoal and
flows directly to the sea. Figure 8 indicates the location of the flood channel
formed in 1992 and compares it with the pre-flood configuration of 1988. The
recovery period generally results in the dominant middle channel reverting to the
more characteristic meandering southern channel.
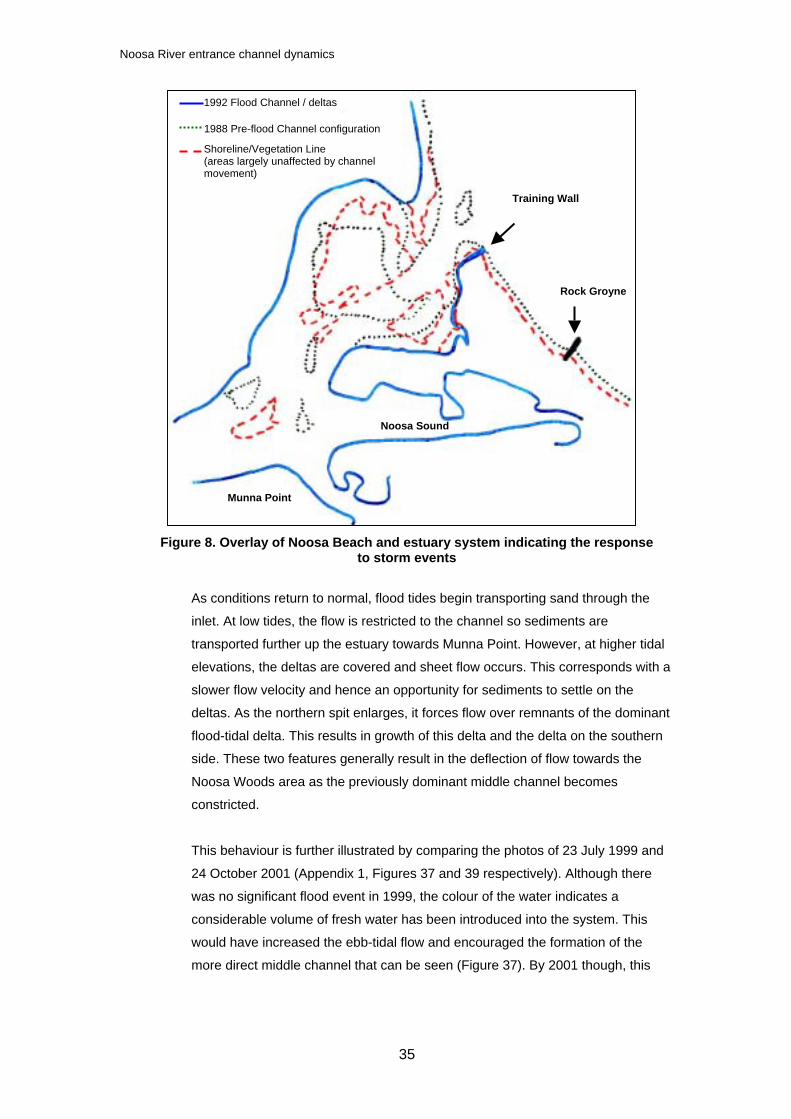
Noosa River entrance channel dynamics
35
Figure 8. Overlay of Noosa Beach and estuary system indicating the response to storm events
As conditions return to normal, flood tides begin transporting sand through the
inlet. At low tides, the flow is restricted to the channel so sediments are
transported further up the estuary towards Munna Point. However, at higher tidal
elevations, the deltas are covered and sheet flow occurs. This corresponds with a
slower flow velocity and hence an opportunity for sediments to settle on the
deltas. As the northern spit enlarges, it forces flow over remnants of the dominant
flood-tidal delta. This results in growth of this delta and the delta on the southern
side. These two features generally result in the deflection of flow towards the
Noosa Woods area as the previously dominant middle channel becomes
constricted.
This behaviour is further illustrated by comparing the photos of 23 July 1999 and
24 October 2001 (Appendix 1, Figures 37 and 39 respectively). Although there
was no significant flood event in 1999, the colour of the water indicates a
considerable volume of fresh water has been introduced into the system. This
would have increased the ebb-tidal flow and encouraged the formation of the
more direct middle channel that can be seen (Figure 37). By 2001 though, this
Training Wall
Rock Groyne
Noosa Sound
Munna Point
1992 Flood Channel / deltas
1988 Pre-flood Channel configuration
Shoreline/Vegetation Line (areas largely unaffected by channel movement)
Noosa River entrance channel dynamics
36
channel had been filled, the flood-tidal delta had grown considerably and the
meandering southern channel was again the dominant flow path.
The models described by FitzGerald et al. (1978 cited in FitzGerald, 1988) (refer
to Section 3.1, Figures 1–3) are very useful in describing the processes observed
at the Noosa River inlet. It should be noted that during the history of an inlet, all
three models may be the dominant bypassing process at any one time
(FitzGerald, 1988). This is certainly the case for Noosa, and will be described in
more detail in the following paragraphs.
Excess sand in the system results in growth of the southern spit which ultimately
forces the channel to discharge in a much more northerly position. As described
by Fitzgerald et al. (1978 cited in FitzGerald, 1988) in Model 1, this migration
typically corresponds with an elongation of the inlet channel. Such a configuration
results in inefficient hydraulic flows and an unstable system. A similar situation
can be observed a few times throughout the history of the Noosa River inlet.
In 1981, nourishment activities added 220 000 m3 of sand to the beach. The
photo taken in July 1982 (Appendix 1, Figure 22) suggests the effect of this sand
was to force the channel to discharge in a more northerly location. As the volume
of sand available for longshore transport decreased, the spit would have been
breached and the channel returned to a shorter, more stable configuration
(Camfield & Morang, 1996). This action effectively bypasses a large volume of
sand to the downdrift shoreline (FitzGerald et al., 1978 cited in FitzGerald, 1988).
The July 1982 photo shows that the southern spit has been breached and by
June 1983 (Appendix 1, Figure 23), this shorter, more efficient southern flow path
has become the dominant channel.
In 1988, the inlet had returned to a similar, unstable northerly orientation (refer to
Appendix 1, Figure 28). In this photo, the southern spit has been breached and
the channel appears to be returning to a more efficient configuration. However,
there are no photos taken shortly after this to verify this hypothesis, so it is
difficult to determine whether the channel favoured this shorter flow path. The
next available photo is in late 1990 (Appendix 1, Figure 29), and shows the
channel to be in a similar northerly orientation. However, between October 1988
and November 1990, 181 570 m3 of nourishment sand was added to the beach
(refer to Appendix 2 for sand nourishment records). This is a considerable volume
of sand and may have been responsible once again for forcing the system out of
equilibrium. By 1991, the inlet moved back closer towards the training wall
Noosa River entrance channel dynamics
37
(Appendix 1, Figure 30), while by 1992 a direct middle channel to the sea had
been formed by the flood event in that year (Appendix 1, Figure 31).
The photo taken in May 1994 (Appendix 1, Figure 34) again shows the inlet to be
in an unstable northerly orientation. As previously mentioned, the excess sand
responsible for this channel migration would have been due to cyclones Fran and
Betsy in 1992. These events would have been responsible for transporting large
‘slugs’ of sand around the headland into Laguna Bay, before smaller swells
transported the material back onto the beach under normal conditions.
Unfortunately, there are no subsequent photos available until late 1997
(Appendix 1, Figure 35) so it is difficult to determine the immediate response of
the system after this unstable configuration was identified. By 1997 though, it had
resumed its more usual northeasterly orientation.
In the past year or so, the inlet throat has remained stable while the main channel
has migrated. Such behaviour is described by Model 3 (Figure 3) proposed by
FitzGerald et al. (1978 cited in FitzGerald, 1988). By comparing the inlet in
October 2001 and January 2002 (Figures 39 and 40 respectively), it can be noted
that although the inlet throat has remained stable, the ebb-tidal delta has been
breached resulting in migration of the channel. Such actions are responsible for
bypassing a large volume of sand contained in the ebb-tidal delta to the downdrift
shoreline and would be responsible for the southerly deflection of the channel
visible in 2002.
Noosa River entrance channel dynamics
38
7 Conclusions The third main objective of this project was to develop a conceptual model of the
behaviour of nourishment sand entering the system. Although the first two
objectives have been achieved and described in previous sections, the third has
not, due to the nonavailability of data to describe the processes that were
occurring. The analysis technique used here is effective and allows an accurate
description of system response to be determined. However, the lack of continuity
of the data set and the inability to correlate other important information (such as
dredging records and storm events) with the photos has made it difficult to fully
achieve the final objective.
The photographic surveys of the coast are performed at a minimum of every four
years. In some instances there is a photo missing that proves vital to the
description of the system response. In spite of this, a number of conclusions have
been made based on the available data. These conclusions are discussed below
in order of decreasing significance.
• Although the system remains in equilibrium (i.e. the volume of sand
supplied to Main Beach by nourishment activities is enough to fulfil the
longshore transport requirements), the northern channel does not
break through. The nourishment activities being performed supply
enough sand to maintain the ebb-tidal delta that protects the northern
spit from breaking through. The consequence of this will be that the
southern channel will remain the dominant flow path and the Noosa
Shire Council will have to continue to deal with bank erosion on the
southern side at Noosa Woods.
• A consistent feature of the system is the flood-tidal delta located in the
middle of the lagoon. Analysis of the aerial photographs indicates that
the system responds to changes in this delta and other features of the
‘active’ zone by transporting sand on flood tides to replace any material
that may have been removed. Figures 39 and 40 (Appendix 1) confirm
this by showing the system responding quickly in an attempt to fill the
holes created by a trial dredge performed in late 2001/early 2002.
Processes in the ‘active’ zone have visibly been influenced by these
activities. Removal of sediment from this region effectively decreases
frictional resistance to flow. In turn, this affects (increases) the hydraulic
gradient of the channel and encourages flow through the channel that
has been influenced by the dredging activities. This increased flow
Noosa River entrance channel dynamics
39
corresponds to an increase in scouring potential that may result in the
exploitation of any ‘weak spots’ in the system.
The breaching of the northern spit evident in the photo of 18 January
2002 (Appendix 1, Figure 40) may have been a result of this dredging.
The question raised by this hypothesis is what will happen if dredging
of the ‘active’ zone occurs on a much larger scale, as has been
suggested to continue beach nourishment activities. Based on
observations when this relatively small volume of sand (29 700 m3) was
removed from the ‘active’ zone in late 2001, if dredging on a larger
scale occurs, the hydraulic gradient will be affected even more. This
would correspond with larger flood-tidal flows being generated to
transport material into the ‘active’ zone to fill the holes. As a result,
there would be a considerable increase in scouring potential.
Therefore, large-scale dredging of the active zone may be the catalyst
for the current flow regime to change and may result in a switch of the
dominant channel location (from southern to northern). Although this
may be beneficial from the council’s point of view when relief in the
scouring of the southern bank would result, the fish breeding area on
the northern bank may be adversely affected and would result in a
decline in the fish reserves of the region. This would obviously have
some serious effects for fishers and many local businesses in the area.
The proposed new dredging scheme will fail to address the erosion
problems of Noosa. Although it will provide a plentiful supply of sand for
nourishment activities and a useable beach area for holidaymakers, it
will be rapidly removed as witnessed in the past. Indeed, it could be
expected that it will be removed at an even faster rate. The decreased
hydraulic resistance of the channel will encourage even larger flows
and the system will respond by attempting to fill the disturbance in the
‘active’ zone. It is therefore suggested that Noosa Council would
benefit more from investing in a scheme that addresses the underlying
problem and by trying to gain a better understanding of the processes
being dealt with than investing in the proposed new dredging scheme.
• As previously discussed, beach nourishment activities require a
thorough understanding of the hydraulic and morphological processes
that occur in the area of interest if they are going to achieve an optimal
solution (CUR, 1987). It has been identified that approximately 80 000
m3/yr of nourishment sand is required to maintain Main Beach (Jackson
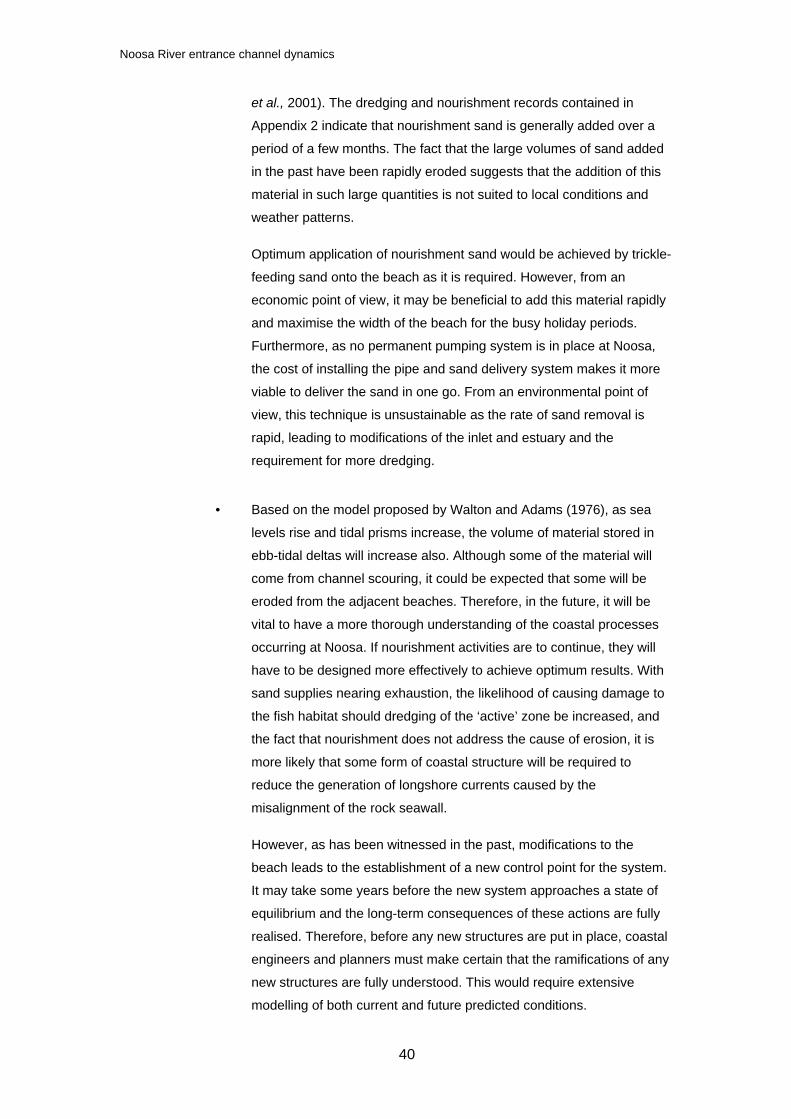
Noosa River entrance channel dynamics
40
et al., 2001). The dredging and nourishment records contained in
Appendix 2 indicate that nourishment sand is generally added over a
period of a few months. The fact that the large volumes of sand added
in the past have been rapidly eroded suggests that the addition of this
material in such large quantities is not suited to local conditions and
weather patterns.
Optimum application of nourishment sand would be achieved by trickle-
feeding sand onto the beach as it is required. However, from an
economic point of view, it may be beneficial to add this material rapidly
and maximise the width of the beach for the busy holiday periods.
Furthermore, as no permanent pumping system is in place at Noosa,
the cost of installing the pipe and sand delivery system makes it more
viable to deliver the sand in one go. From an environmental point of
view, this technique is unsustainable as the rate of sand removal is
rapid, leading to modifications of the inlet and estuary and the
requirement for more dredging.
• Based on the model proposed by Walton and Adams (1976), as sea
levels rise and tidal prisms increase, the volume of material stored in
ebb-tidal deltas will increase also. Although some of the material will
come from channel scouring, it could be expected that some will be
eroded from the adjacent beaches. Therefore, in the future, it will be
vital to have a more thorough understanding of the coastal processes
occurring at Noosa. If nourishment activities are to continue, they will
have to be designed more effectively to achieve optimum results. With
sand supplies nearing exhaustion, the likelihood of causing damage to
the fish habitat should dredging of the ‘active’ zone be increased, and
the fact that nourishment does not address the cause of erosion, it is
more likely that some form of coastal structure will be required to
reduce the generation of longshore currents caused by the
misalignment of the rock seawall.
However, as has been witnessed in the past, modifications to the
beach leads to the establishment of a new control point for the system.
It may take some years before the new system approaches a state of
equilibrium and the long-term consequences of these actions are fully
realised. Therefore, before any new structures are put in place, coastal
engineers and planners must make certain that the ramifications of any
new structures are fully understood. This would require extensive
modelling of both current and future predicted conditions.

Noosa River entrance channel dynamics
41
The design and modelling of an artificial reef to realign wave crests has
been investigated, but these have been rejected due to the risk of
human injury under certain weather conditions. The inability to arrive at
an optimum solution suggests that the system is still not fully
understood and more detailed modelling is required to gain a greater
understanding of the processes at work.
Noosa River entrance channel dynamics
42
References Bruun, P. (1979), Stability of tidal inlets – theory and engineering, Elsevier,
Amsterdam.
Bruun, P. (1990), ‘Beach nourishment – improved economy through better
profiling and backpassing from offshore sources’, Journal of Coastal
Research, 6 (2), pp. 265–277.
Camfield, F. E. & Morang, A. (1996), ‘Defining and interpreting shoreline change’,
Ocean & Coastal Management, Vol. 32, –o. 3, pp. 129–151.
Cato, N. (1989), The Noosa story (3rd ed.), Jacaranda Press, Hong Kong.
CUR (Centre for Civil Engineering Research, Codes and Specifications),
Rijkswaterstaat, and Delft Hydraulics (1987), Manual on artificial beach
nourishment, CUR, The Netherlands.
Cooper, N. J., Hooke, J. M. & Bray, M. J. (2001), ‘Predicting coastal evolution
using a sediment budget approach: a case study from southern England’,
Ocean & Coastal Management, 44, pp. 711–728.
Davis, R. A. (1994), The evolving coast, Scientific American Library, New York,
USA.
Geomorphology editorial, (2002), ‘The geomorphology of coastal environments’,
Geomorphology, 1207.
FitzGerald, D. M. (1988), ‘Shoreline erosional–depositional processes associated
with tidal inlets’, in: D. G. Aubrey, & L. Weischer (Eds), Hydrodynamics and
sediment dynamics of tidal inlets, Springer, New York, pp. 186–225.
Floyd, C. D. (1968), ‘River mouth training in New South Wales, Australia’,
Proceedings of eleventh conference on coastal engineering, pp. 1267–1281,
American Society of Civil Engineers, New York, USA.
Gao, S. & Collins, M. B. (1995), ‘On the physical aspects of the “design with
nature” principle in coastal management’, Ocean & Coastal Management,
Vol. 26, No. 2, pp. 163–175.
Jackson, A., Black, K. & Tomlinson, R. (1999), Recommendations for Noosa
Main Beach restoration and protection for Noosa Council, International
Coastal Management, Gold Coast, Australia.
Jackson, A., Black, K., Mead, S., Mathew, J. & Tomlinson, R. (2001), Noosa Main
Beach restoration and protection – summary of investigations and impact
assessment studies, International Coastal Management, Gold Coast,
Australia.
Kidson, C. (1963), ‘The growth of sand and shingle spits across estuaries’, in:
M. L. Schwartz (ed), Spits and bars, Dowden, Hutchinson & Ross,
Pennsylvania, USA, pp. 176–201.
Noosa River entrance channel dynamics
43
Liu, J. T. & Hou, Li-h (1997), ‘Sediment trapping and bypassing characteristics
of a stable tidal inlet at Kaohsiung Harbor, Taiwan’, Marine Geology, 140,
pp. 367–390.
Morton, R. A., Gibeaut, J. C. & Paine, J. G. (1995), ‘Meso-scale transfer of sand
during and after storms: implications of prediction of shoreline movement’,
Marine Geology, Vol. 126, pp. 161–179.
Oertel, G. F. (1988), ‘Processes of sediment exchange between tidal inlets,
ebb deltas and barrier islands’, in: D. G. Aubrey, and L. Weischer (eds),
Hydrodynamics and sediment dynamics of tidal inlets, Springer, New York,
pp. 297–318.
Short, A. D. (1999), Handbook of Beach and Shoreface Morphodynamics, John
Wiley and Sons, New York.
Trembanis, A. C. & Pilkey, O. H. (1999), ‘Comparison of beach nourishment
along the US Atlantic, Great Lakes, Gulf of Mexico, and New England
shorelines’, Coastal Management, Vol 27, pp. 329–340.
USACE (US Army Corps of Engineers) (1994), Coastal groins and nearshore
breakwaters, American Society of Civil Engineers, New York, USA.
USACE (US Army Corps of Engineers) (2001), Coastal engineering manual,
<http://bigfoot.wes.army.mil/cem001.html>, (accessed 24/3/02).
Walton, T. L. & Adams, W. D. (1976), ‘Capacity of inlet outer bars to store sand’,
Proceedings of the fifteenth coastal engineering conference, American
Society of Civil Engineers, Reston, VA, pp. 1919–1937.
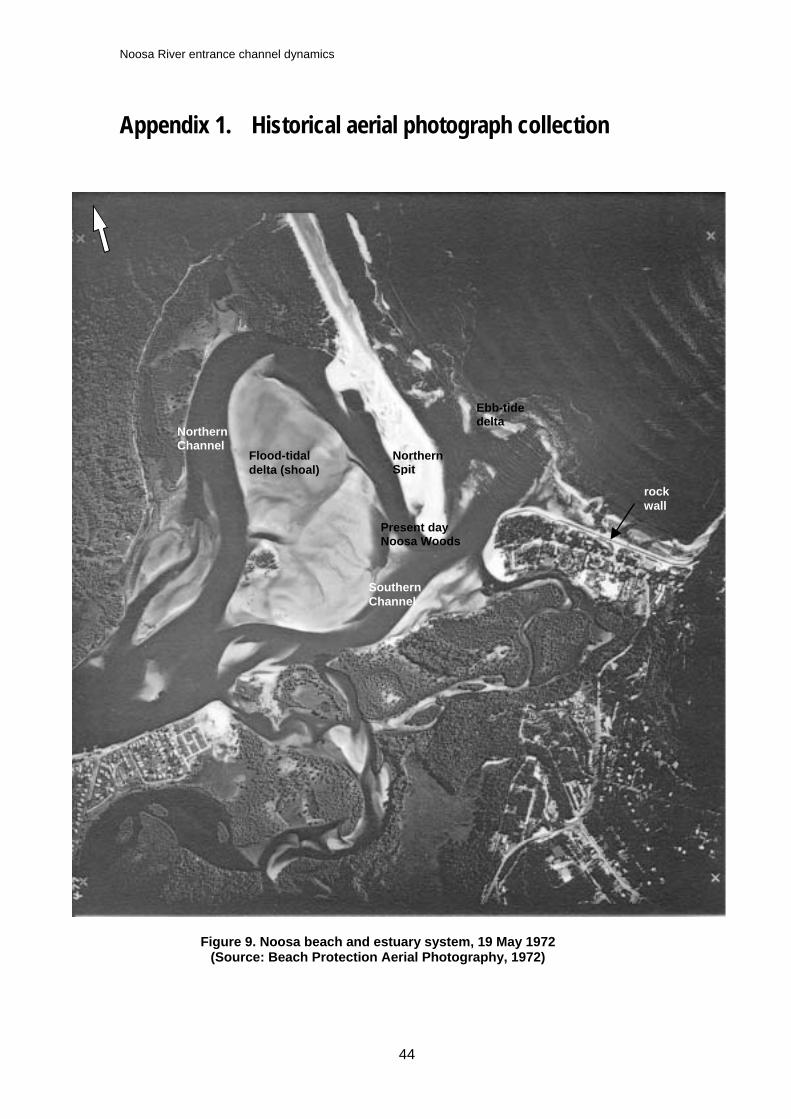
Noosa River entrance channel dynamics
44
Appendix 1. Historical aerial photograph collection
Figure 9. Noosa beach and estuary system, 19 May 1972
(Source: Beach Protection Aerial Photography, 1972)
rock wall
Southern Channel
Northern Spit
Northern Channel
Flood-tidal delta (shoal)
Present day Noosa Woods
Ebb-tide delta
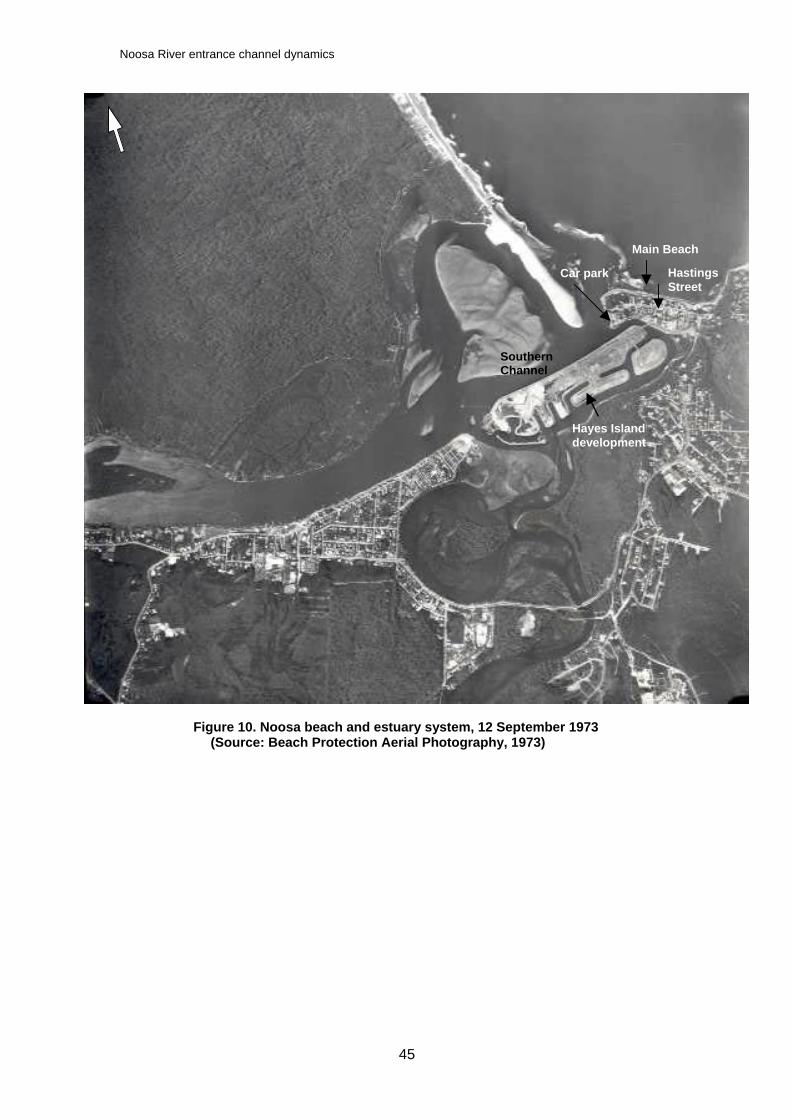
Noosa River entrance channel dynamics
45
Figure 10. Noosa beach and estuary system, 12 September 1973
(Source: Beach Protection Aerial Photography, 1973)
Hayes Island development
Southern Channel
Hastings Street
Car park
Main Beach
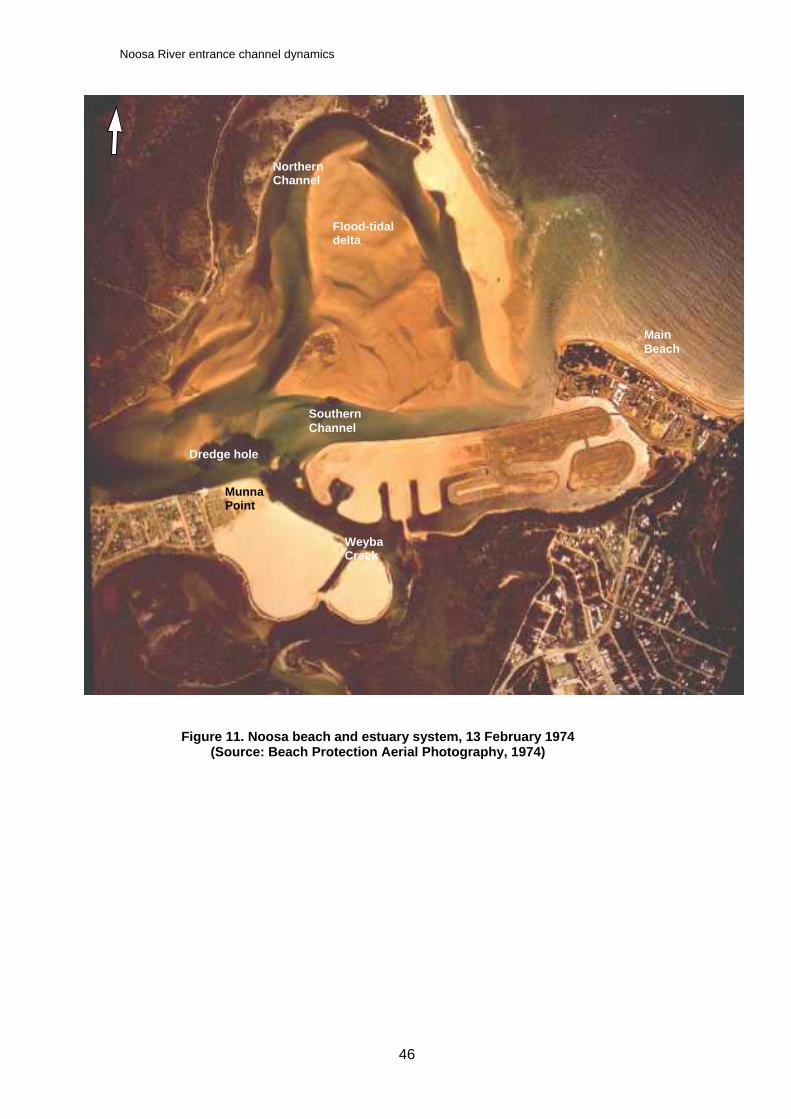
Noosa River entrance channel dynamics
46
Figure 11. Noosa beach and estuary system, 13 February 1974 (Source: Beach Protection Aerial Photography, 1974)
Main Beach
Munna Point
Weyba Creek
Northern Channel
SouthernChannel
Flood-tidal delta
Dredge hole
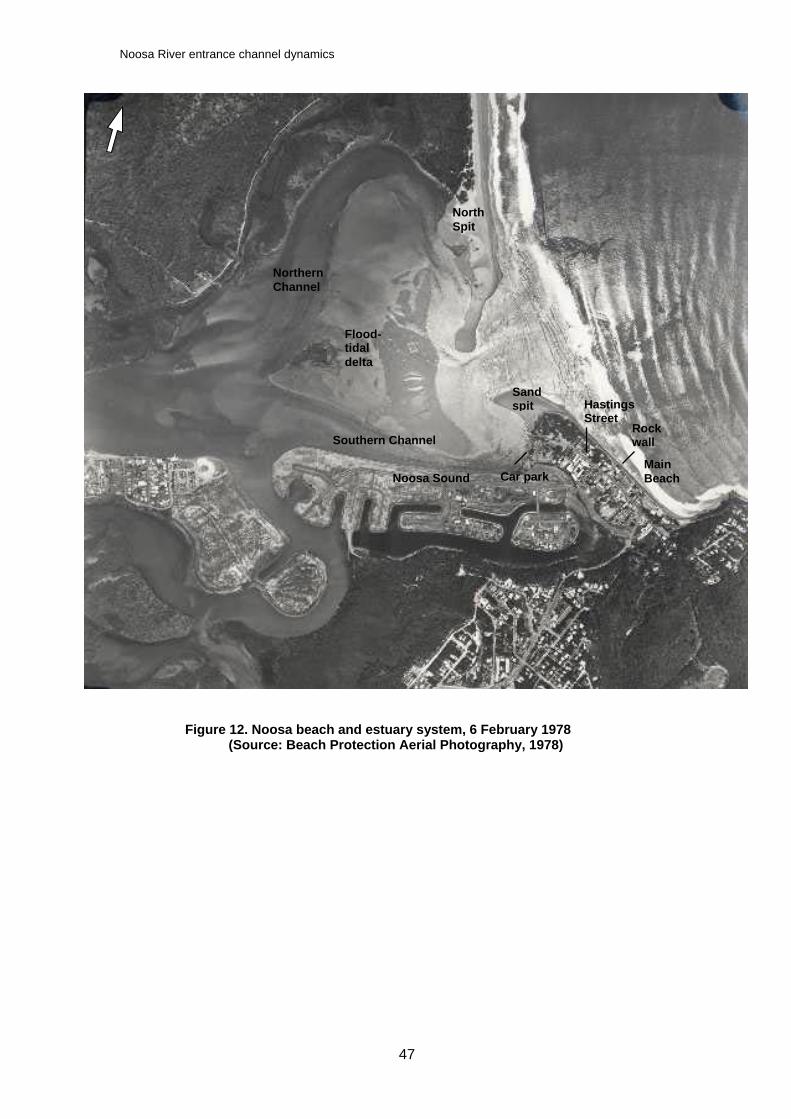
Noosa River entrance channel dynamics
47
Figure 12. Noosa beach and estuary system, 6 February 1978 (Source: Beach Protection Aerial Photography, 1978)
Hastings Street
Rock wall
Sand spit
Main Beach
Northern Channel
Southern Channel
Noosa Sound Car park
North Spit
Flood-tidal delta
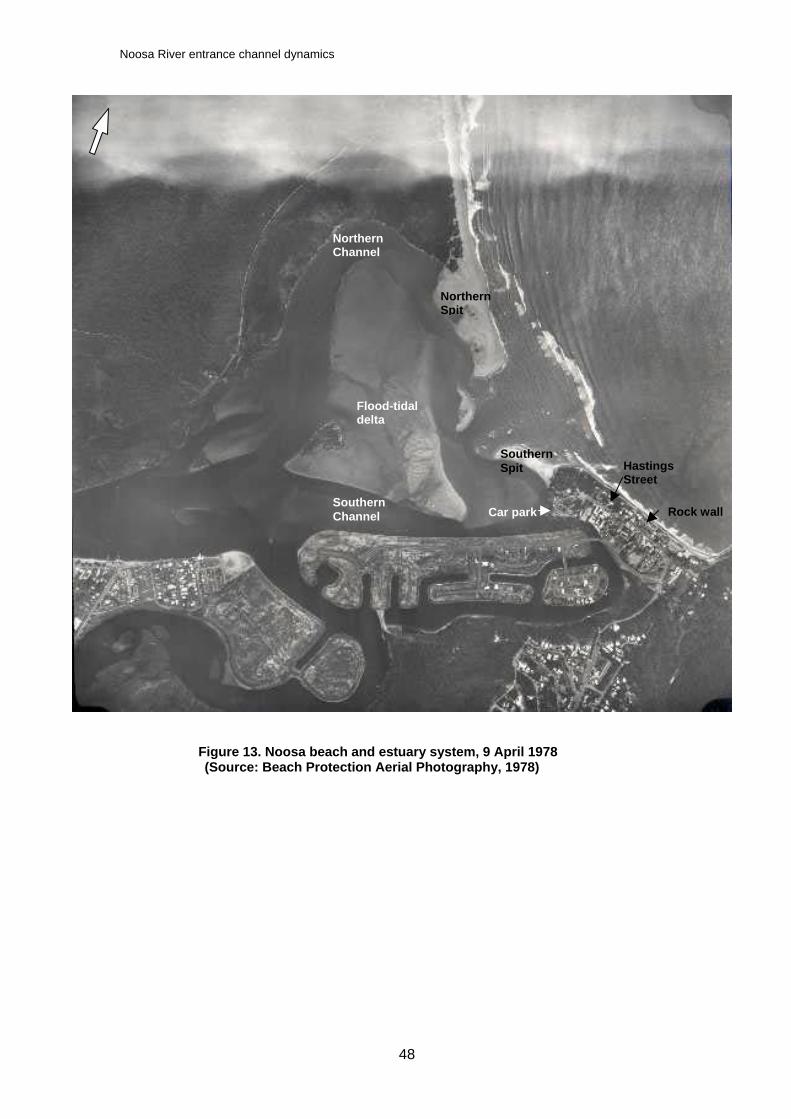
Noosa River entrance channel dynamics
48
Figure 13. Noosa beach and estuary system, 9 April 1978 (Source: Beach Protection Aerial Photography, 1978)
Hastings Street
Rock wall
Northern Channel
Southern Channel
Northern Spit
Southern Spit
Flood-tidal delta
Car park
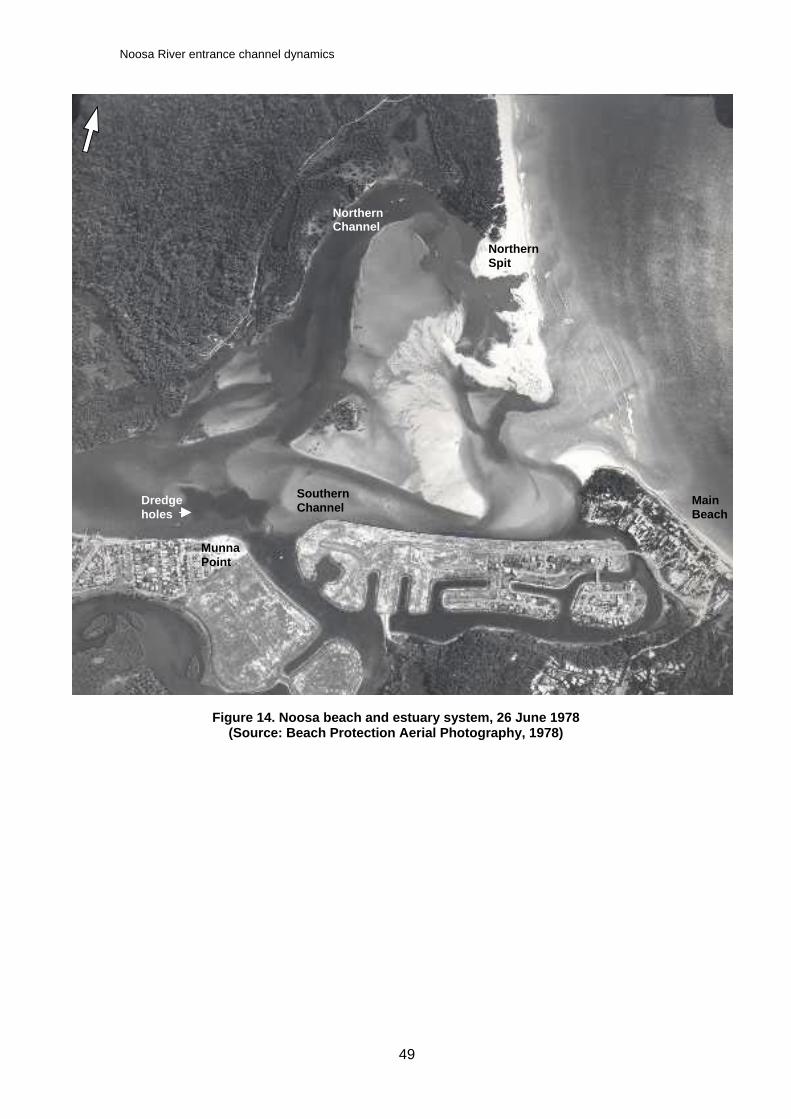
Noosa River entrance channel dynamics
49
Figure 14. Noosa beach and estuary system, 26 June 1978
(Source: Beach Protection Aerial Photography, 1978)
Main Beach
Munna Point
SouthernChannel
Northern Channel
Northern Spit
Dredge holes
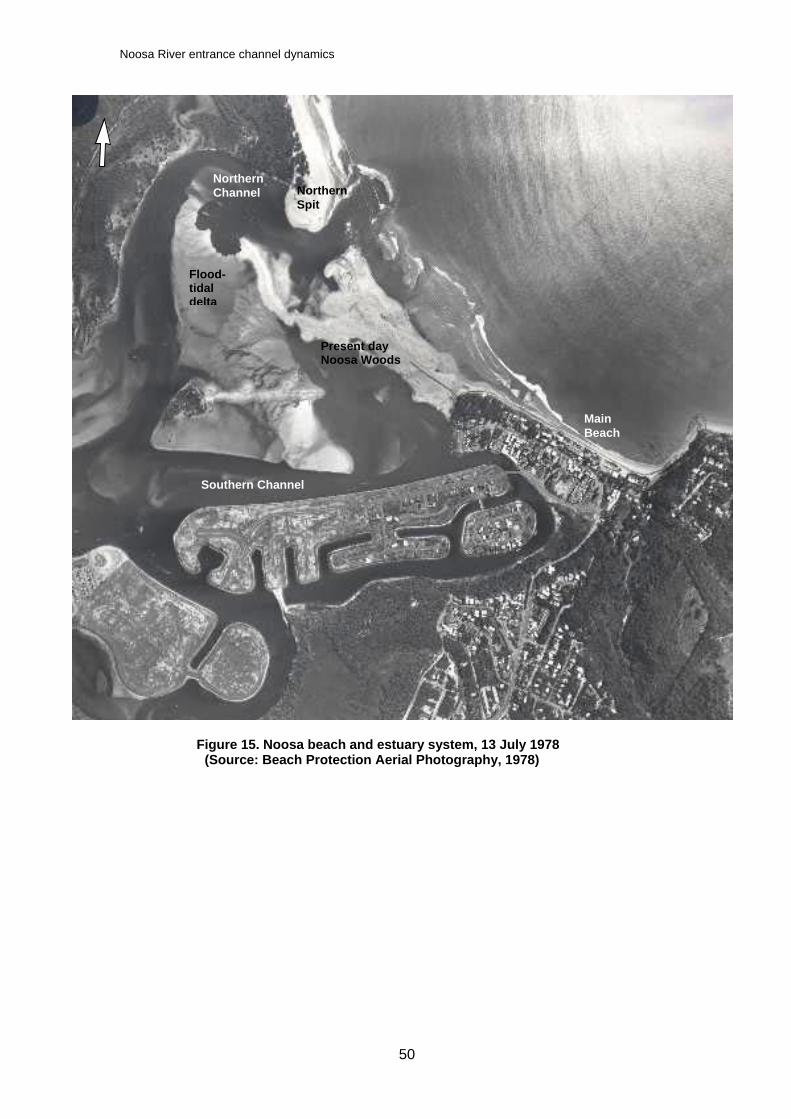
Noosa River entrance channel dynamics
50
Figure 15. Noosa beach and estuary system, 13 July 1978
(Source: Beach Protection Aerial Photography, 1978)
Main Beach
Northern Spit
Southern Channel
Present day Noosa Woods
Flood-tidal delta
Northern Channel
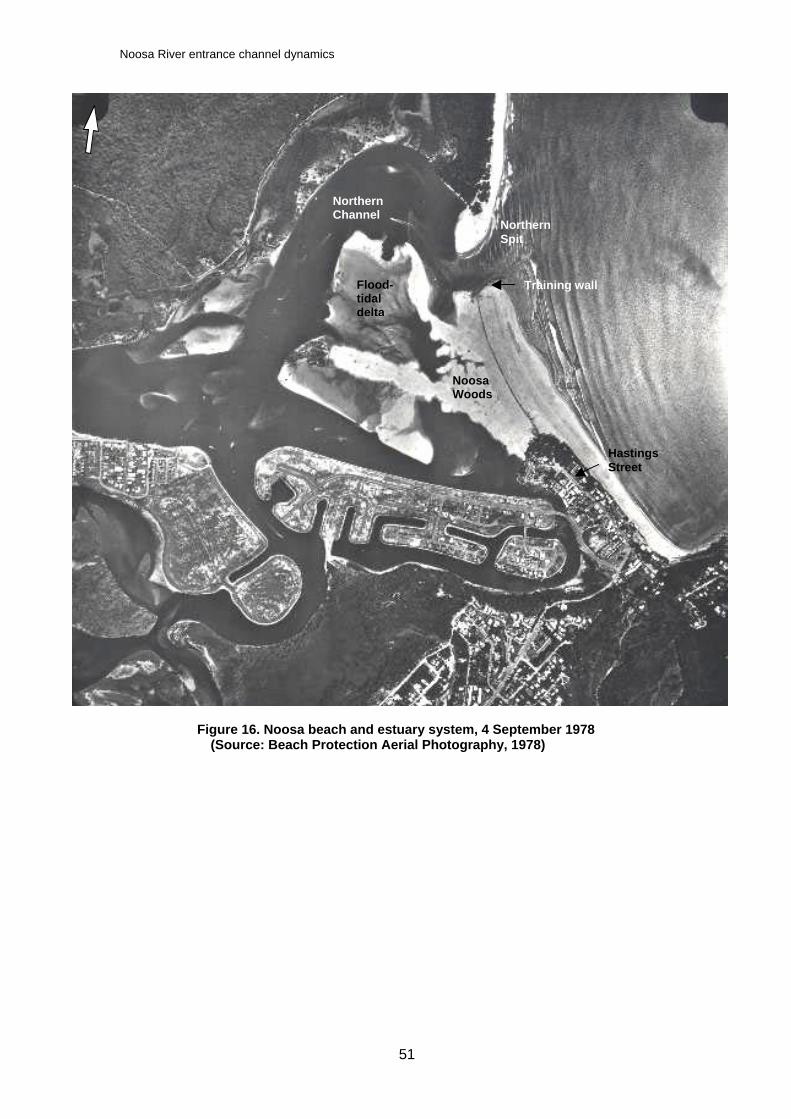
Noosa River entrance channel dynamics
51
Figure 16. Noosa beach and estuary system, 4 September 1978
(Source: Beach Protection Aerial Photography, 1978)
Training wall
Hastings Street
Noosa Woods
Flood-tidal delta
Northern Channel
Northern Spit
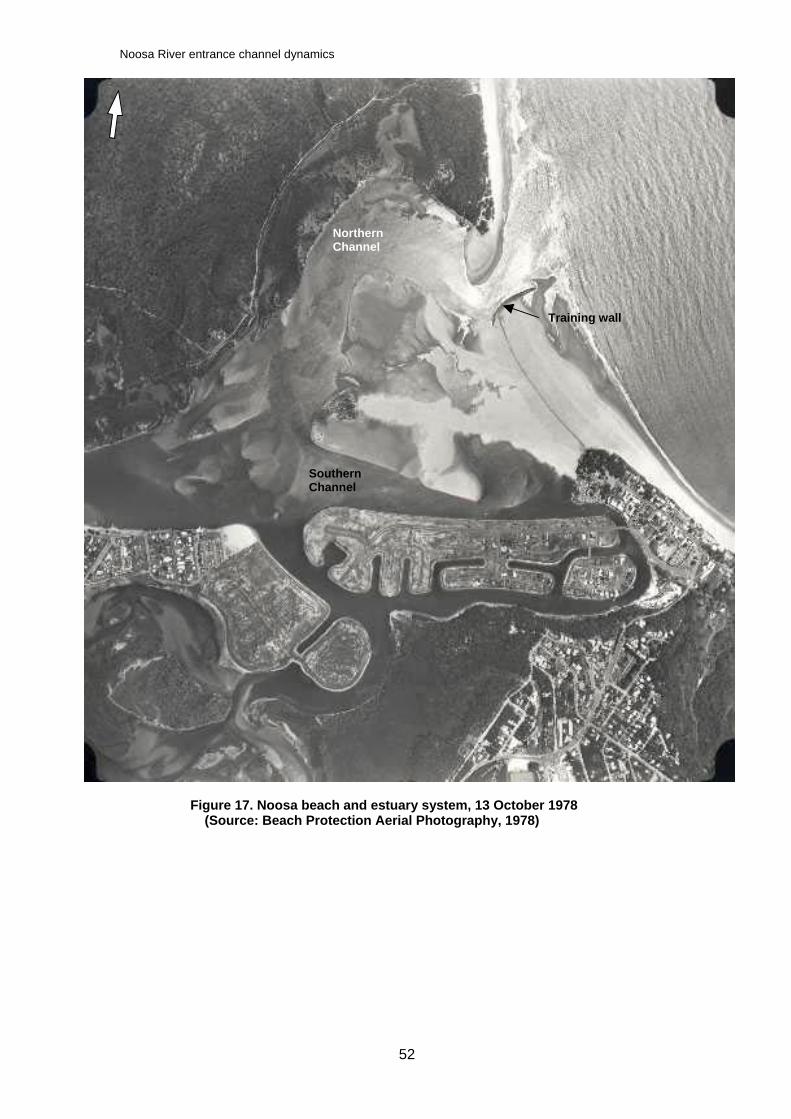
Noosa River entrance channel dynamics
52
Figure 17. Noosa beach and estuary system, 13 October 1978
(Source: Beach Protection Aerial Photography, 1978)
Training wall
Northern Channel
SouthernChannel
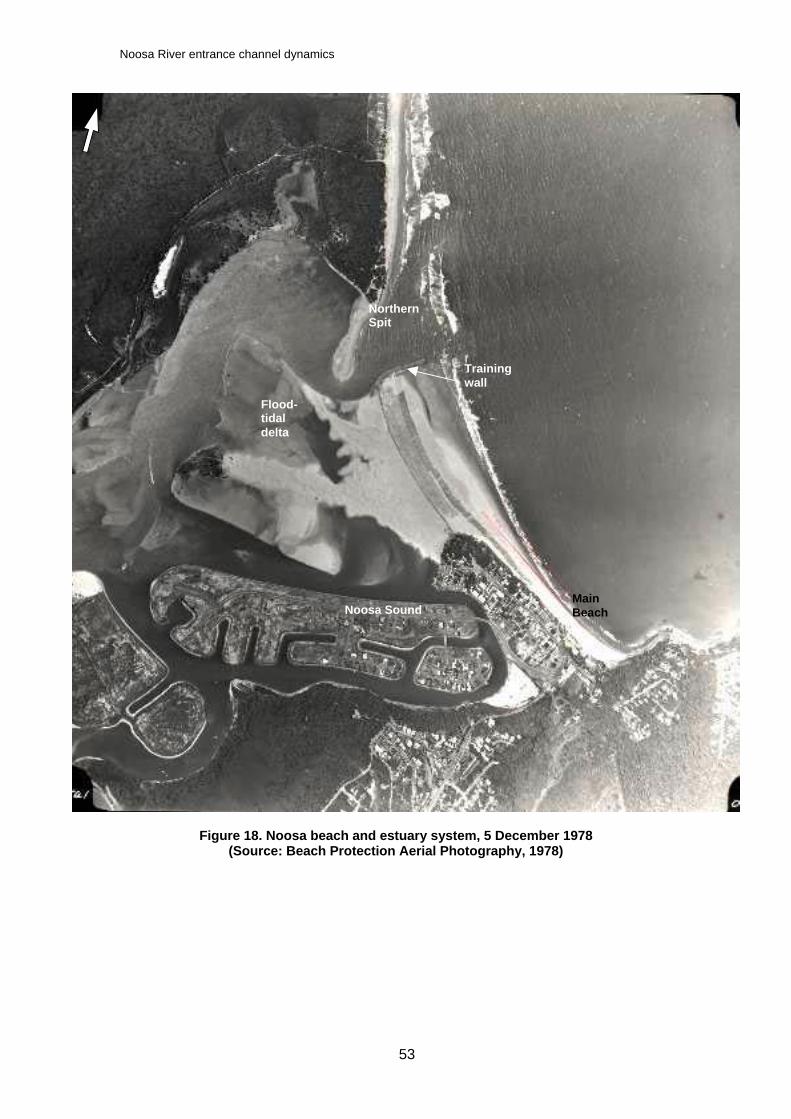
Noosa River entrance channel dynamics
53
Figure 18. Noosa beach and estuary system, 5 December 1978
(Source: Beach Protection Aerial Photography, 1978)
Main Beach
Training wall
Northern Spit
Noosa Sound
Flood-tidal delta
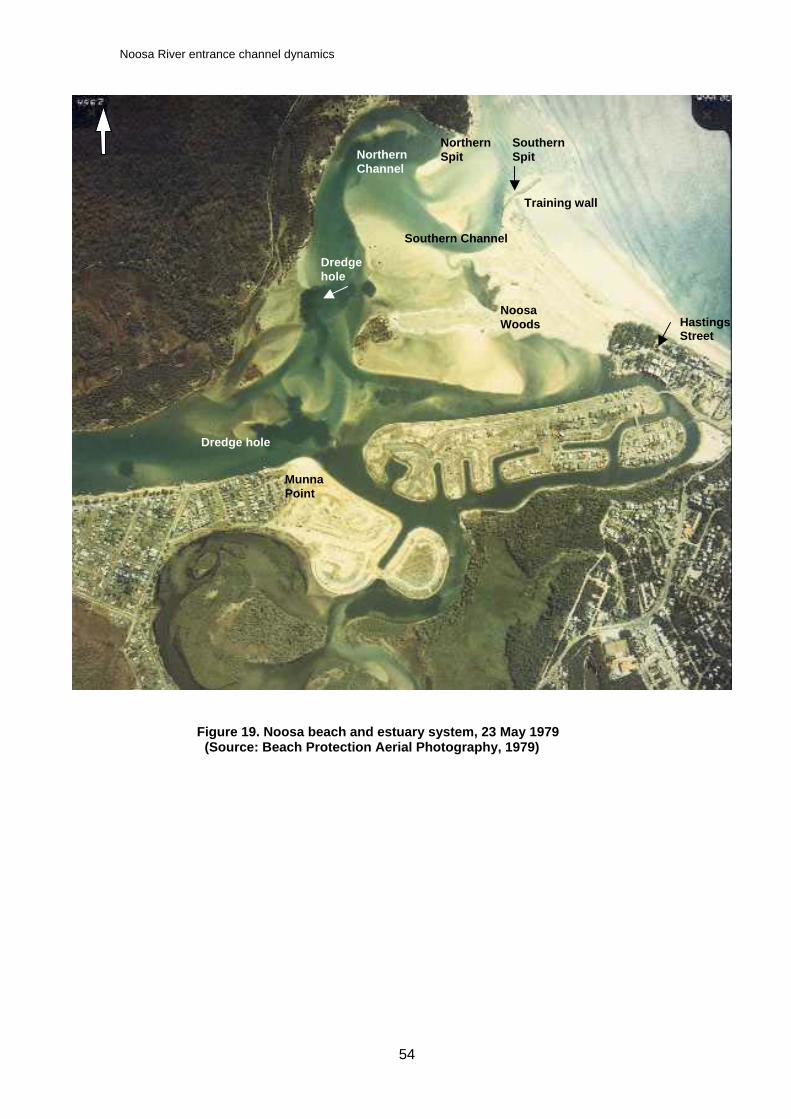
Noosa River entrance channel dynamics
54
Figure 19. Noosa beach and estuary system, 23 May 1979 (Source: Beach Protection Aerial Photography, 1979)
Training wall
Hastings Street
Southern Spit
Northern Spit
Southern Channel
Noosa Woods
Munna Point
Northern Channel
Dredge hole
Dredge hole
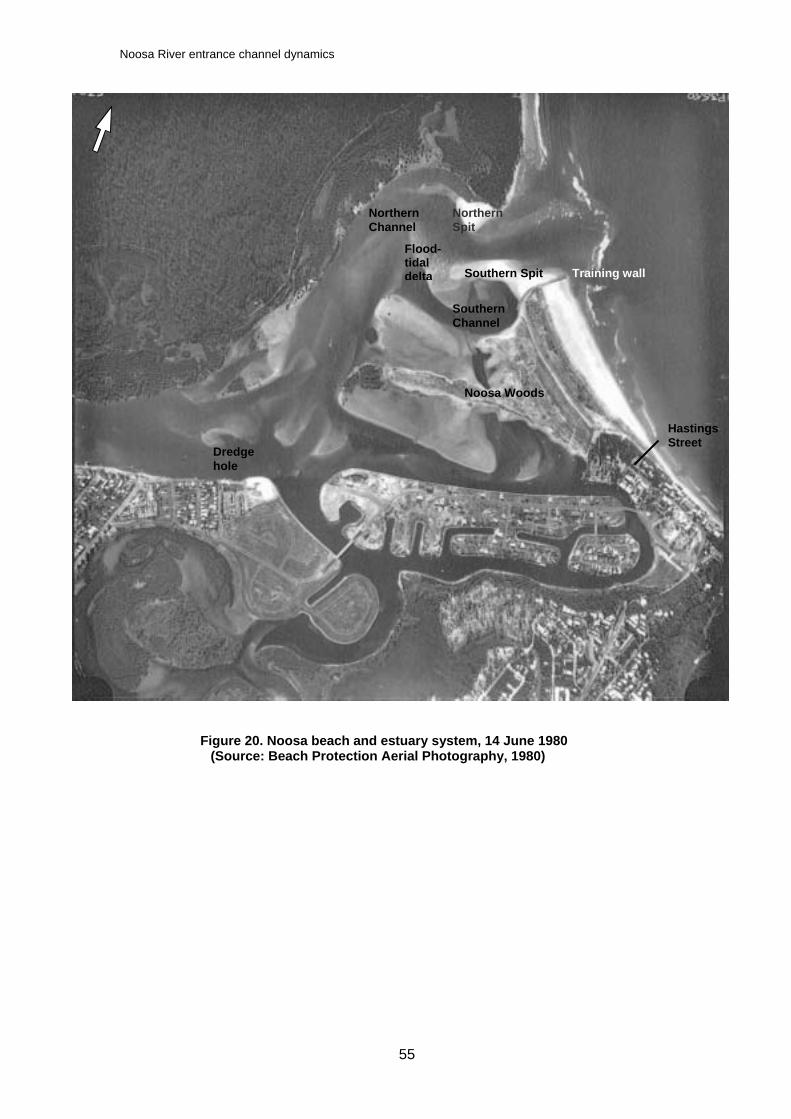
Noosa River entrance channel dynamics
55
Figure 20. Noosa beach and estuary system, 14 June 1980 (Source: Beach Protection Aerial Photography, 1980)
Hastings Street
Training wall Southern Spit
Flood-tidal delta
Southern Channel
Northern Channel
Northern Spit
Dredge hole
Noosa Woods
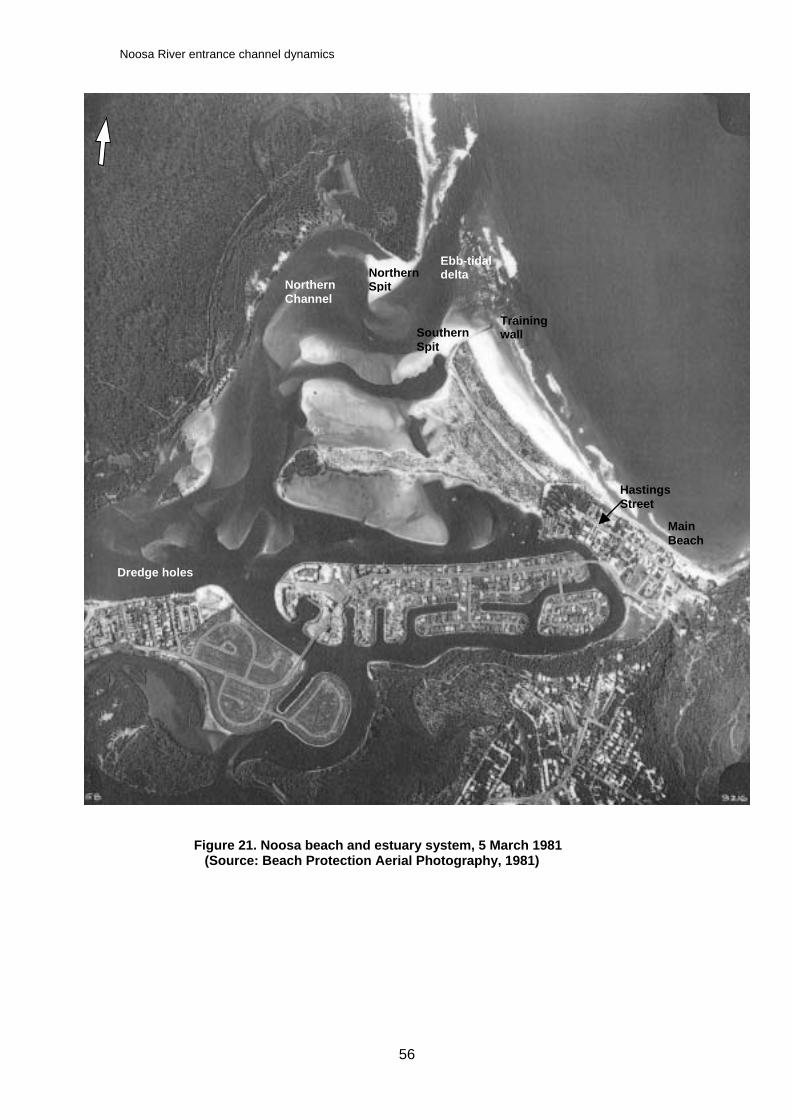
Noosa River entrance channel dynamics
56
Figure 21. Noosa beach and estuary system, 5 March 1981 (Source: Beach Protection Aerial Photography, 1981)
Main Beach
Training wall
Hastings Street
Northern Spit
Southern Spit
Northern Channel
Dredge holes
Ebb-tidal delta
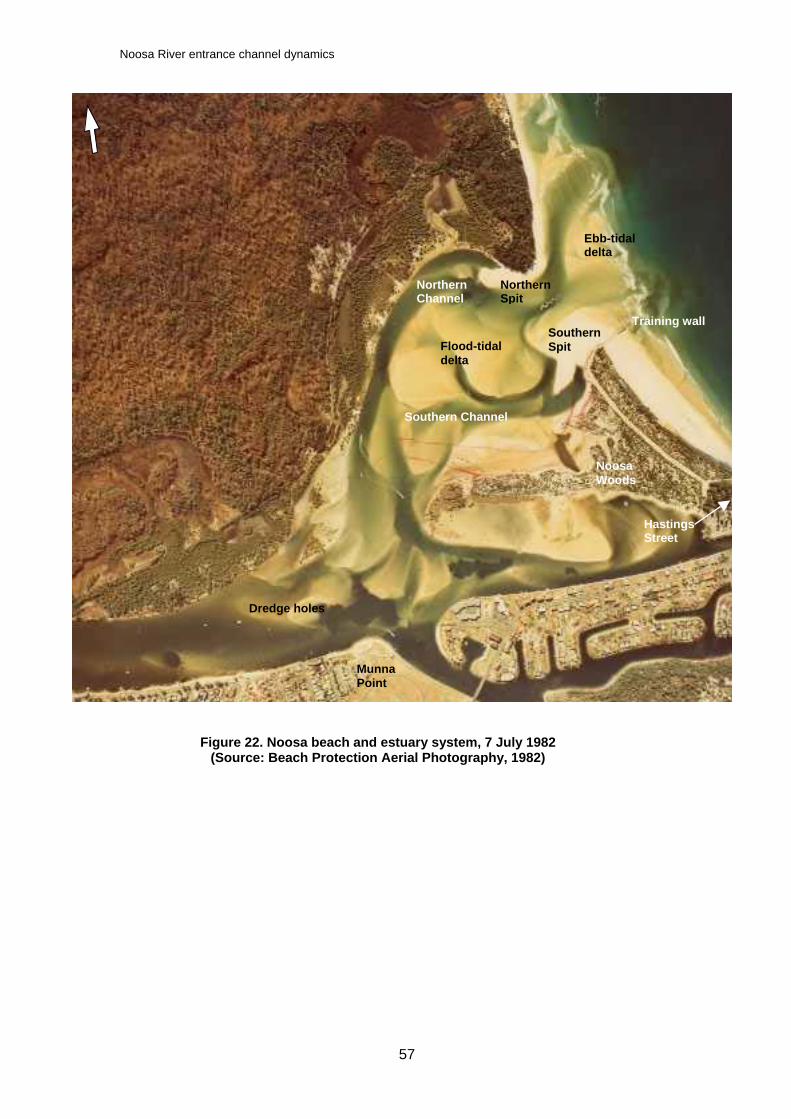
Noosa River entrance channel dynamics
57
Figure 22. Noosa beach and estuary system, 7 July 1982 (Source: Beach Protection Aerial Photography, 1982)
Training wall
Hastings Street
Southern Spit
Northern Channel
Northern Spit
Southern Channel
Munna Point
Flood-tidal delta
Dredge holes
Noosa Woods
Ebb-tidal delta
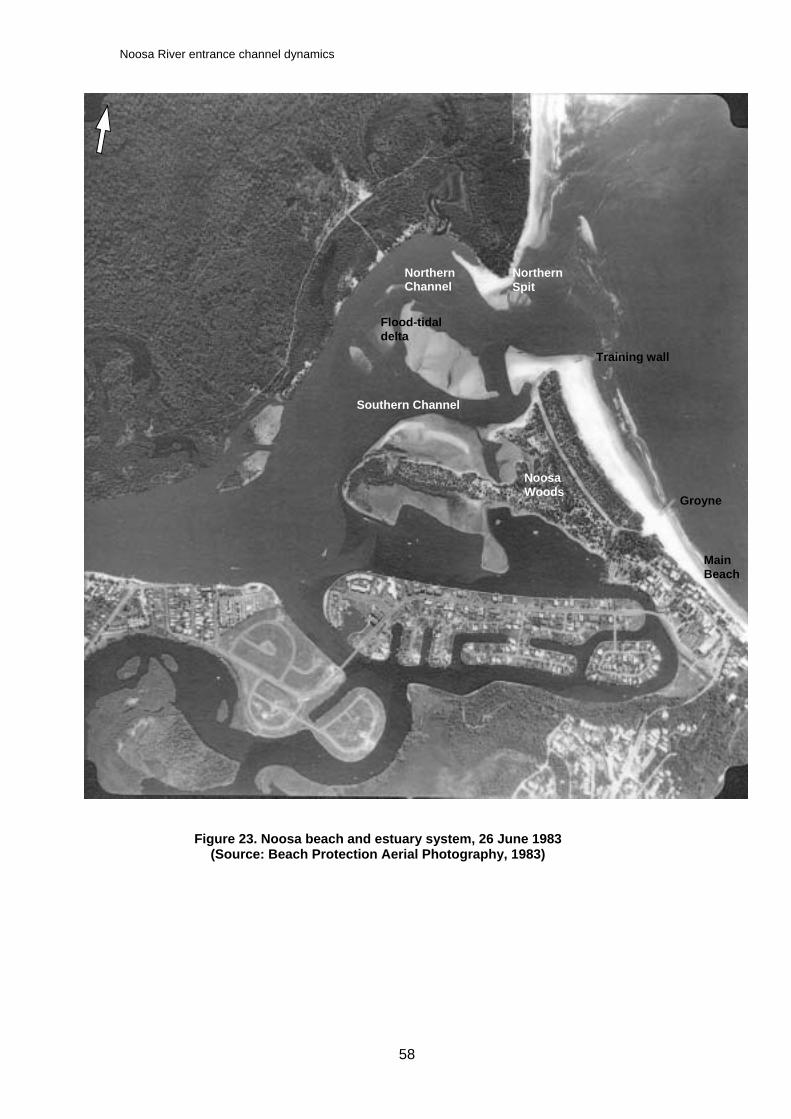
Noosa River entrance channel dynamics
58
Figure 23. Noosa beach and estuary system, 26 June 1983 (Source: Beach Protection Aerial Photography, 1983)
Main Beach
Groyne
Training wall
Southern Channel
Noosa Woods
Northern Channel
Northern Spit
Flood-tidal delta
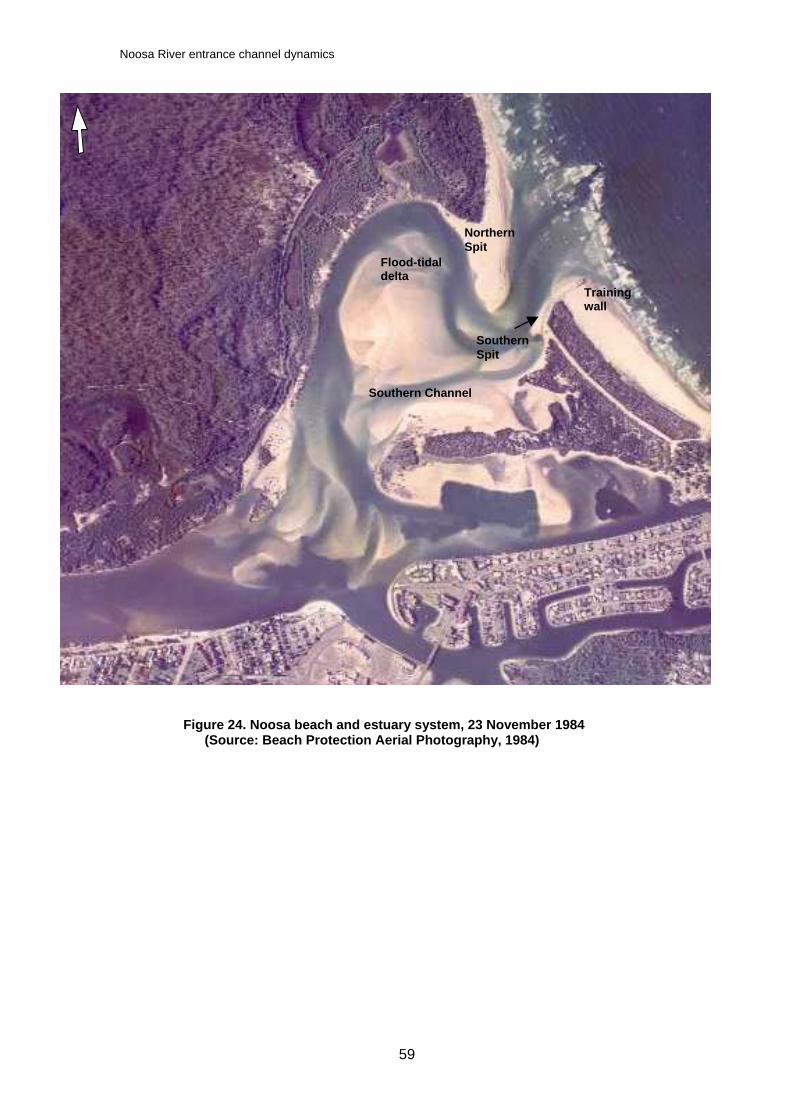
Noosa River entrance channel dynamics
59
Figure 24. Noosa beach and estuary system, 23 November 1984 (Source: Beach Protection Aerial Photography, 1984)
Training wall
Southern Channel
Northern Spit
Southern Spit
Flood-tidal delta
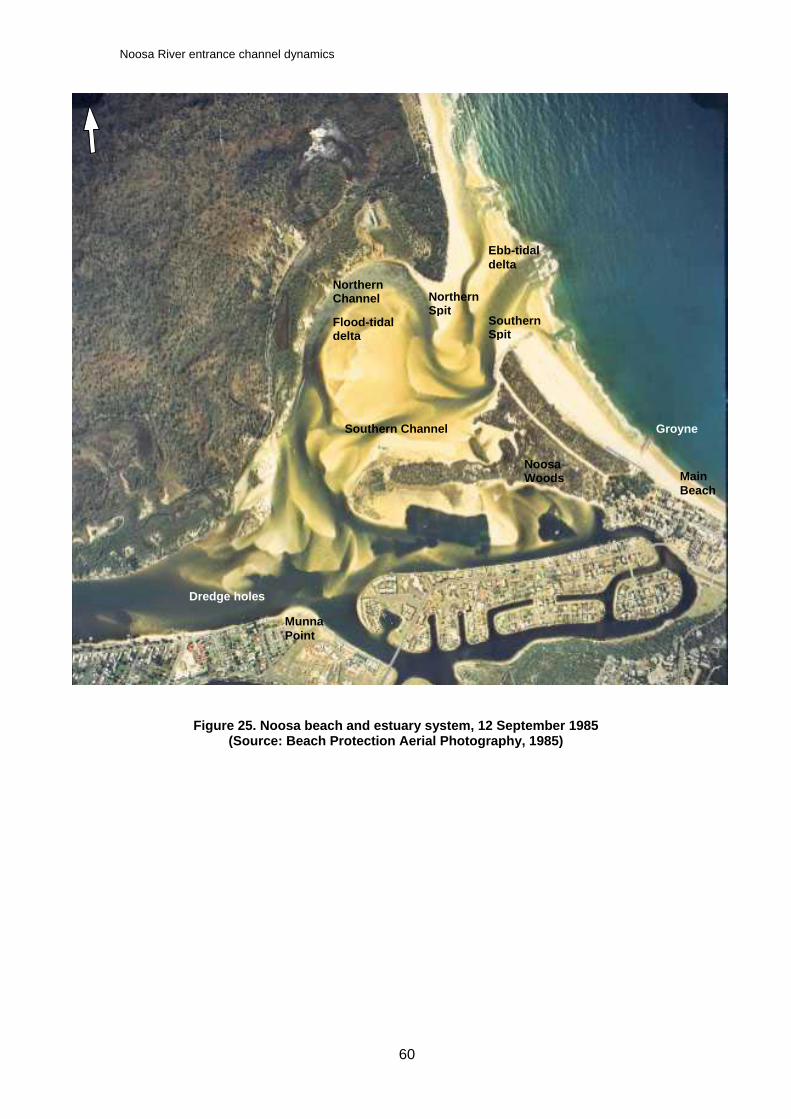
Noosa River entrance channel dynamics
60
Figure 25. Noosa beach and estuary system, 12 September 1985 (Source: Beach Protection Aerial Photography, 1985)
Main Beach
Groyne
Southern Spit
Ebb-tidal delta
Northern Spit
Noosa Woods
Northern Channel
Flood-tidal delta
Southern Channel
Munna Point
Dredge holes
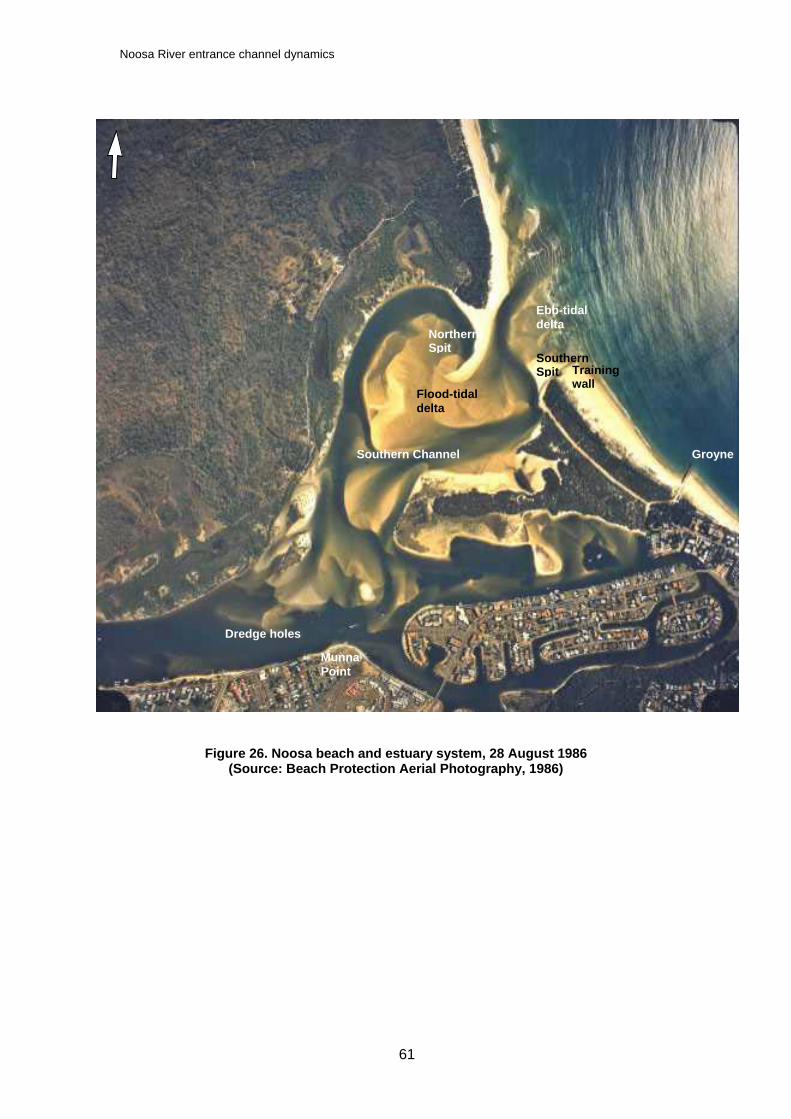
Noosa River entrance channel dynamics
61
Figure 26. Noosa beach and estuary system, 28 August 1986 (Source: Beach Protection Aerial Photography, 1986)
Groyne
Northern Spit
Flood-tidal delta
Southern Channel
Ebb-tidal delta
Southern Spit
Munna Point
Dredge holes
Training wall
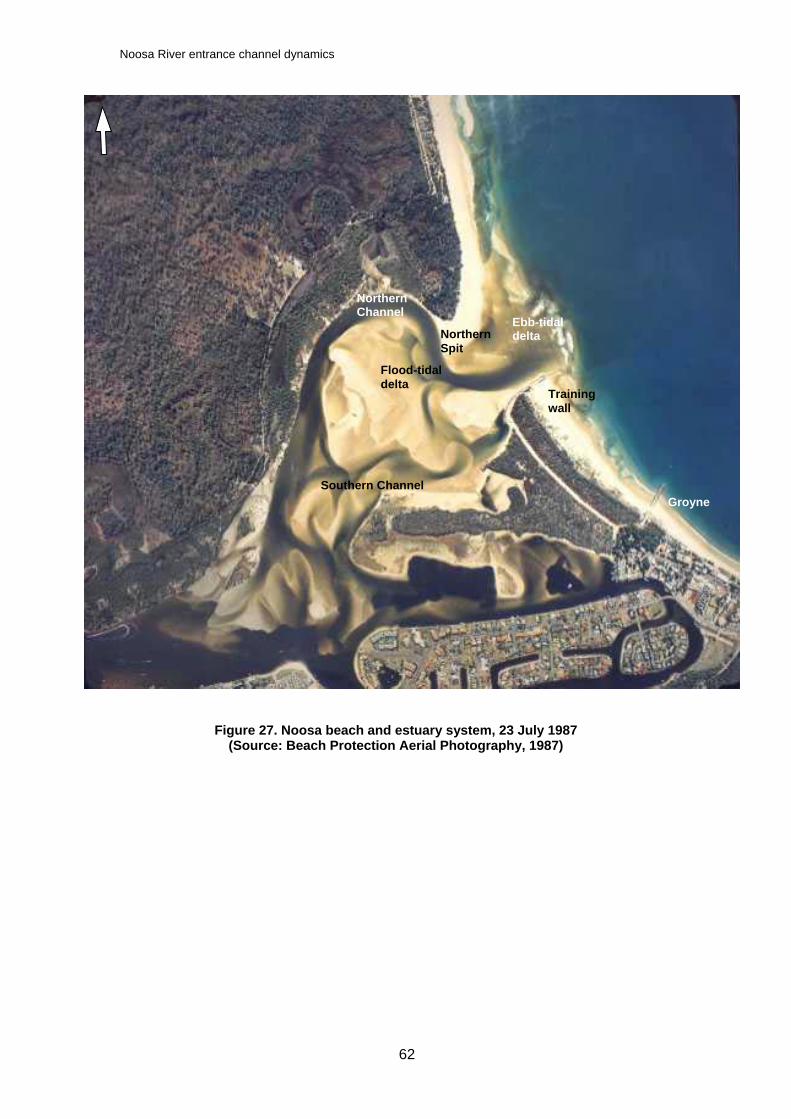
Noosa River entrance channel dynamics
62
Figure 27. Noosa beach and estuary system, 23 July 1987 (Source: Beach Protection Aerial Photography, 1987)
Groyne
Training wall
Ebb-tidal delta
Northern Channel
Northern Spit
Southern Channel
Flood-tidal delta
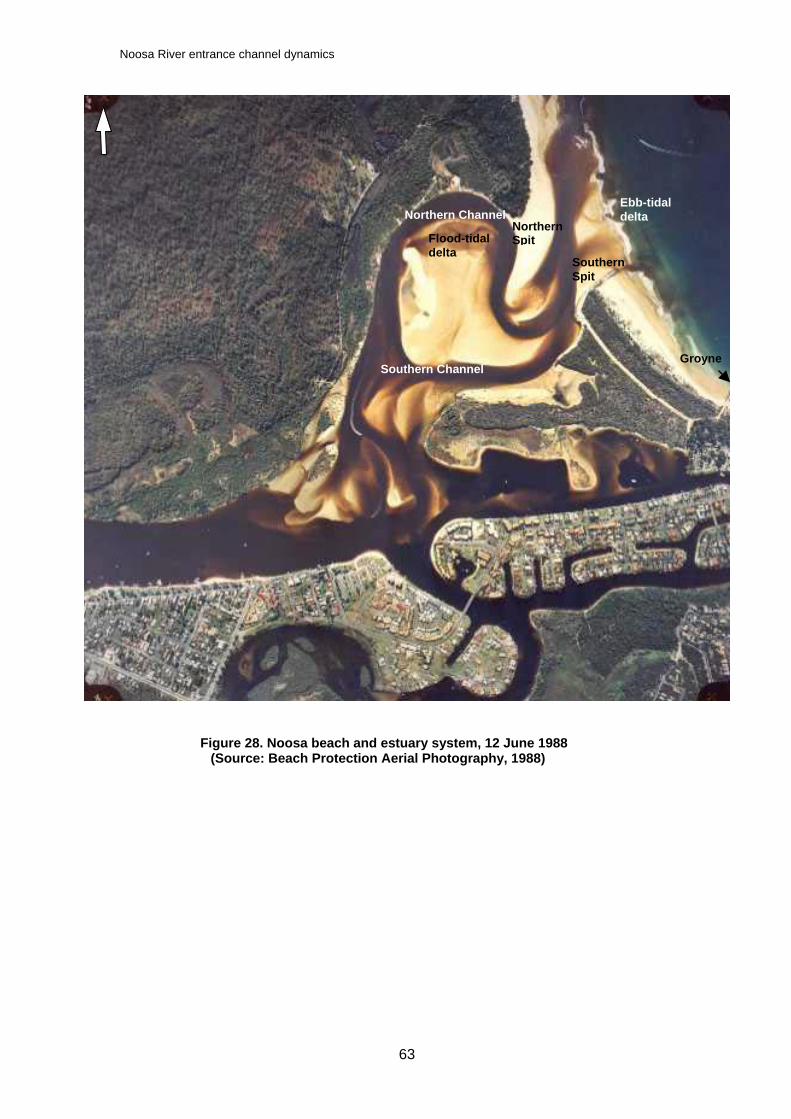
Noosa River entrance channel dynamics
63
Figure 28. Noosa beach and estuary system, 12 June 1988 (Source: Beach Protection Aerial Photography, 1988)
Groyne
Ebb-tidal delta
Southern Channel
Northern Channel
Southern Spit
Northern SpitFlood-tidal
delta
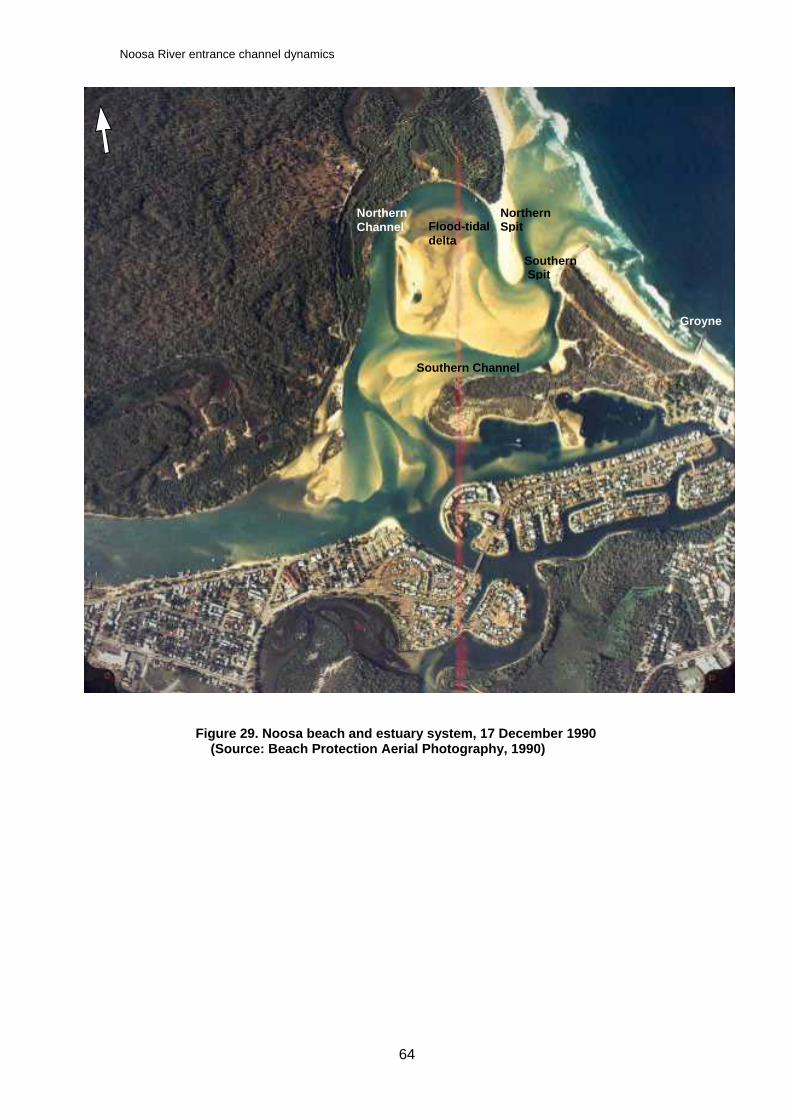
Noosa River entrance channel dynamics
64
Figure 29. Noosa beach and estuary system, 17 December 1990 (Source: Beach Protection Aerial Photography, 1990)
Groyne
Southern Channel
Northern Channel
Northern SpitFlood-tidal
delta Southern Spit
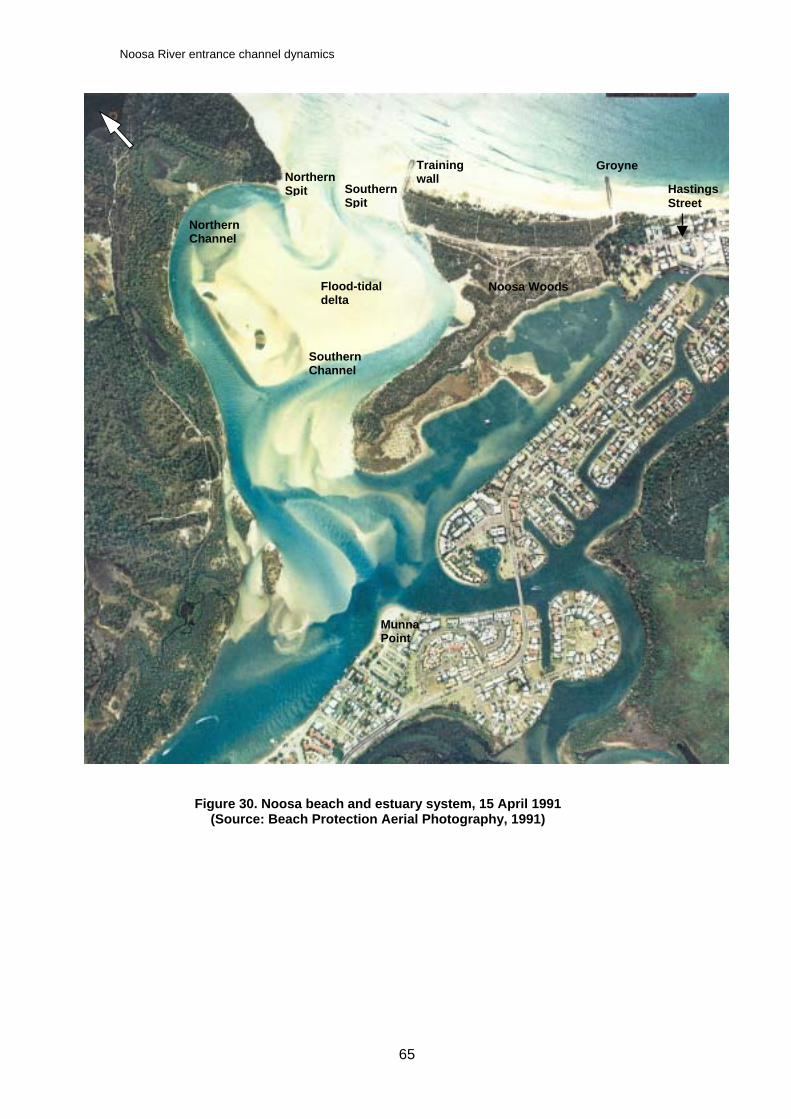
Noosa River entrance channel dynamics
65
Figure 30. Noosa beach and estuary system, 15 April 1991 (Source: Beach Protection Aerial Photography, 1991)
Hastings Street
Northern Channel
Northern Spit
Southern Channel
Noosa Woods
Southern Spit
Training wall
Groyne
Flood-tidal delta
Munna Point
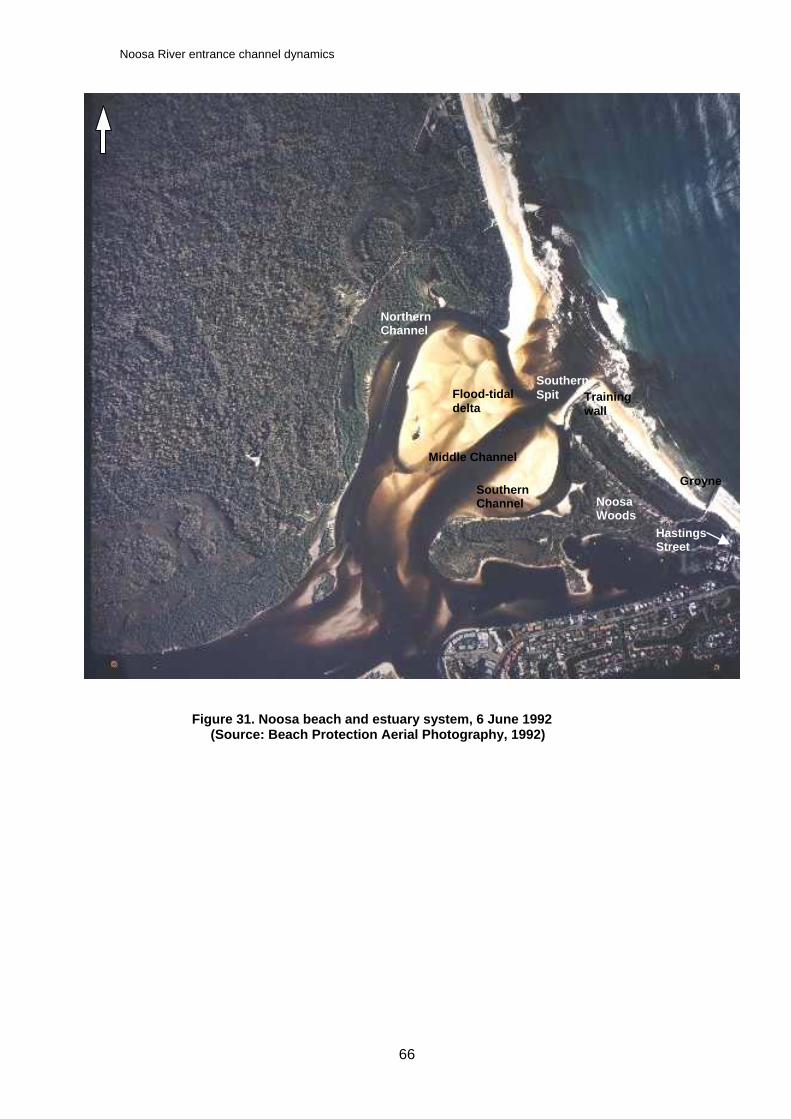
Noosa River entrance channel dynamics
66
Figure 31. Noosa beach and estuary system, 6 June 1992 (Source: Beach Protection Aerial Photography, 1992)
Hastings Street
Groyne
Training wall
Northern Channel
Southern Channel
Middle Channel
Flood-tidal delta
Noosa Woods
Southern Spit
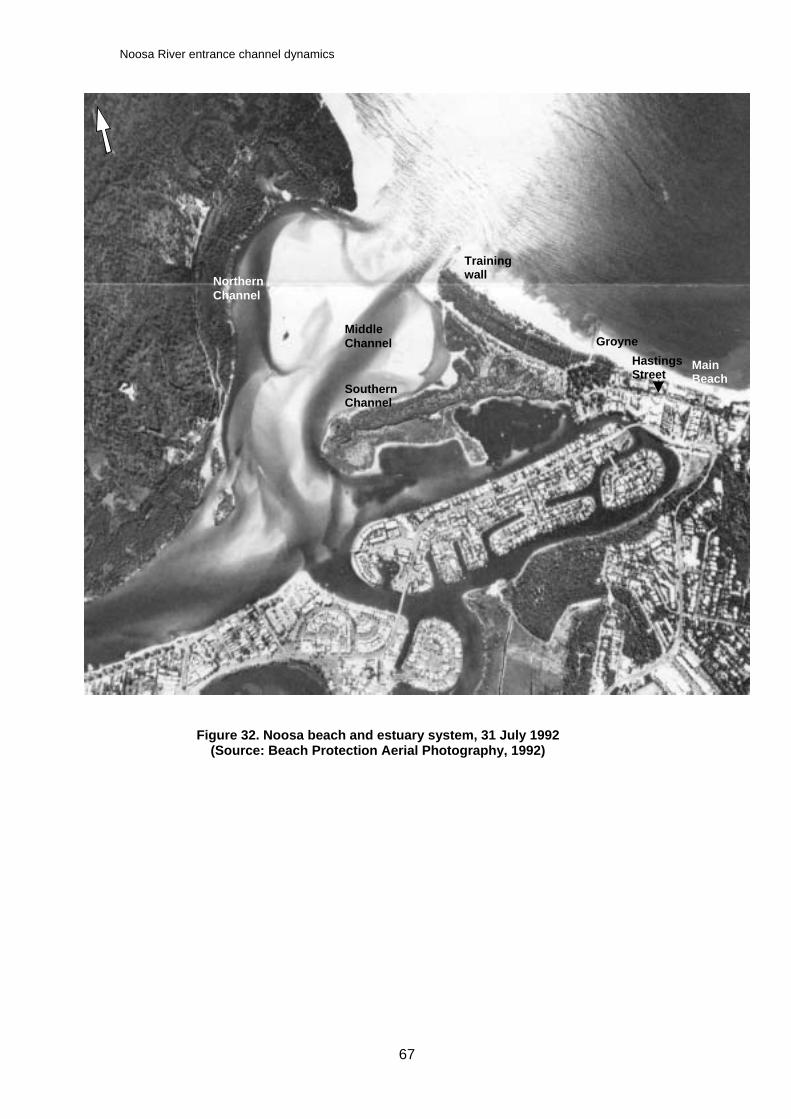
Noosa River entrance channel dynamics
67
Figure 32. Noosa beach and estuary system, 31 July 1992 (Source: Beach Protection Aerial Photography, 1992)
Main Beach
Training wall
Groyne Hastings Street
Northern Channel
Middle Channel
Southern Channel
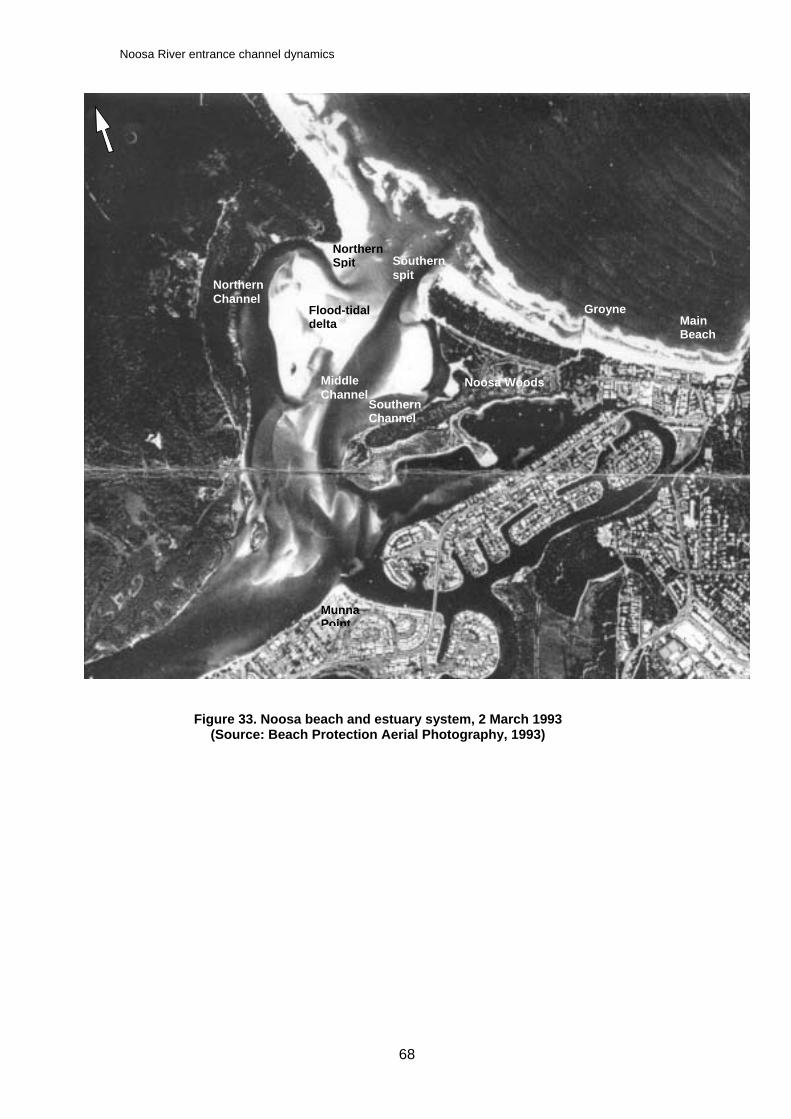
Noosa River entrance channel dynamics
68
Figure 33. Noosa beach and estuary system, 2 March 1993 (Source: Beach Protection Aerial Photography, 1993)
Main Beach
Groyne
Northern Spit Southern
spit Northern Channel
Middle Channel
Flood-tidal delta
Noosa Woods
Southern Channel
Munna Point
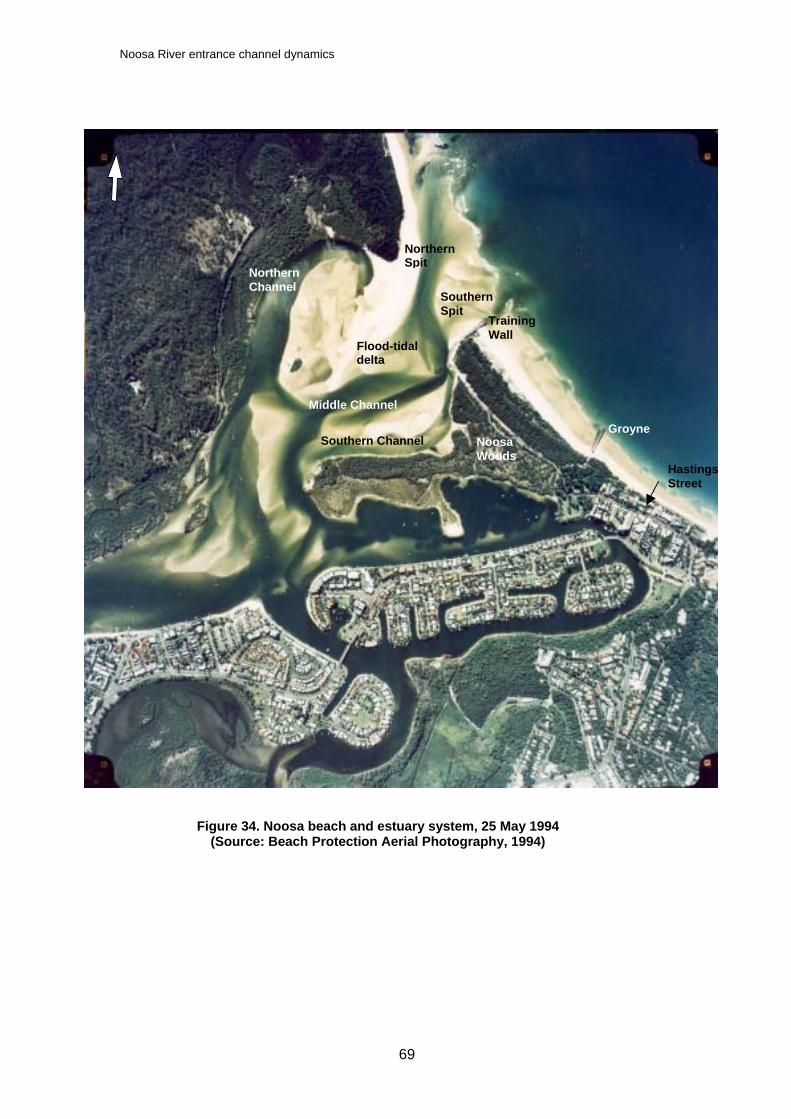
Noosa River entrance channel dynamics
69
Figure 34. Noosa beach and estuary system, 25 May 1994 (Source: Beach Protection Aerial Photography, 1994)
Hastings Street
Groyne
Training Wall
Northern Spit
Southern Spit
Northern Channel
Southern Channel
Flood-tidal delta
Middle Channel
Noosa Woods
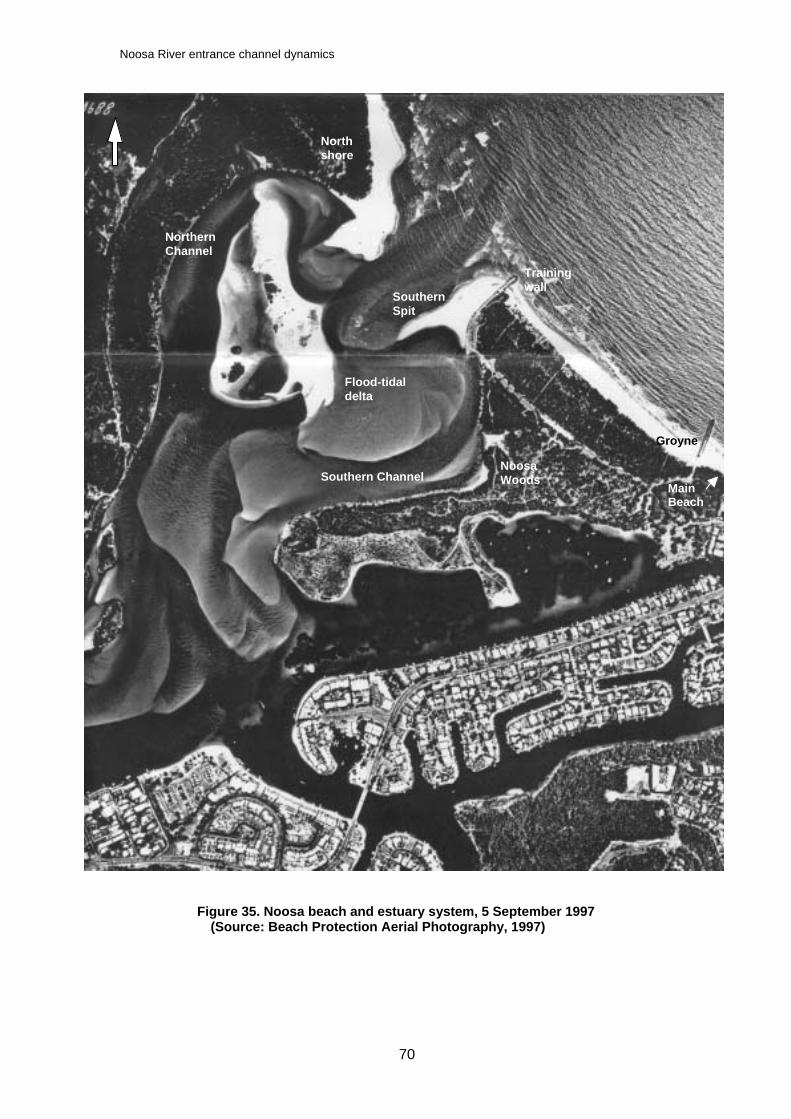
Noosa River entrance channel dynamics
70
Figure 35. Noosa beach and estuary system, 5 September 1997 (Source: Beach Protection Aerial Photography, 1997)
Main Beach
Training wall
Groyne
North shore
Northern Channel
Southern Spit
Noosa Woods
Flood-tidal delta
Southern Channel
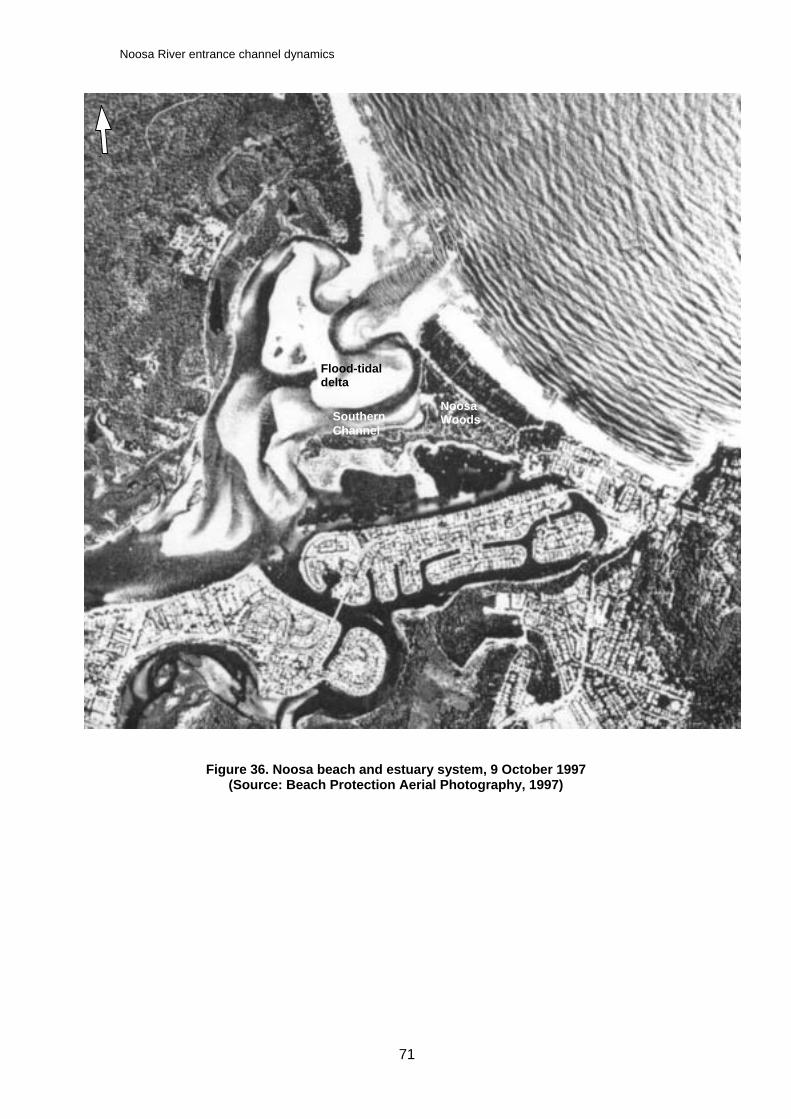
Noosa River entrance channel dynamics
71
Figure 36. Noosa beach and estuary system, 9 October 1997 (Source: Beach Protection Aerial Photography, 1997)
Southern Channel
Noosa Woods
Flood-tidal delta
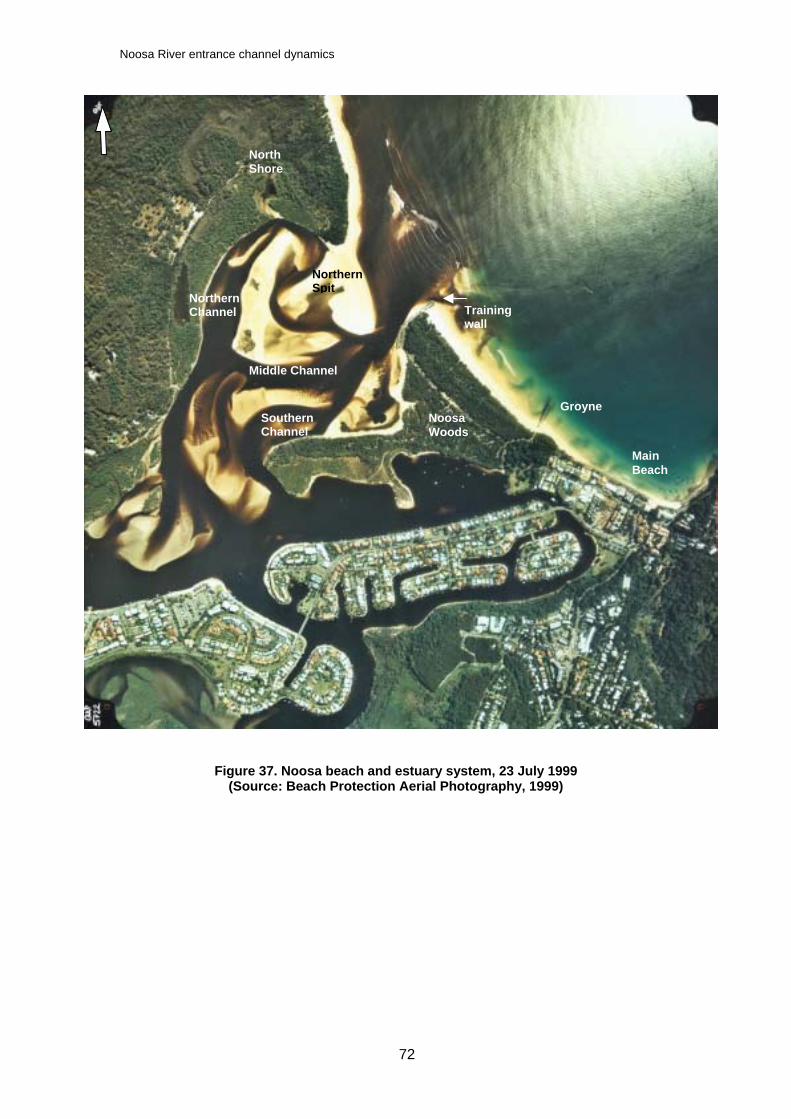
Noosa River entrance channel dynamics
72
Figure 37. Noosa beach and estuary system, 23 July 1999 (Source: Beach Protection Aerial Photography, 1999)
Main Beach
Groyne
Northern Channel
Northern Spit
Training wall
North Shore
Southern Channel
Noosa Woods
Middle Channel
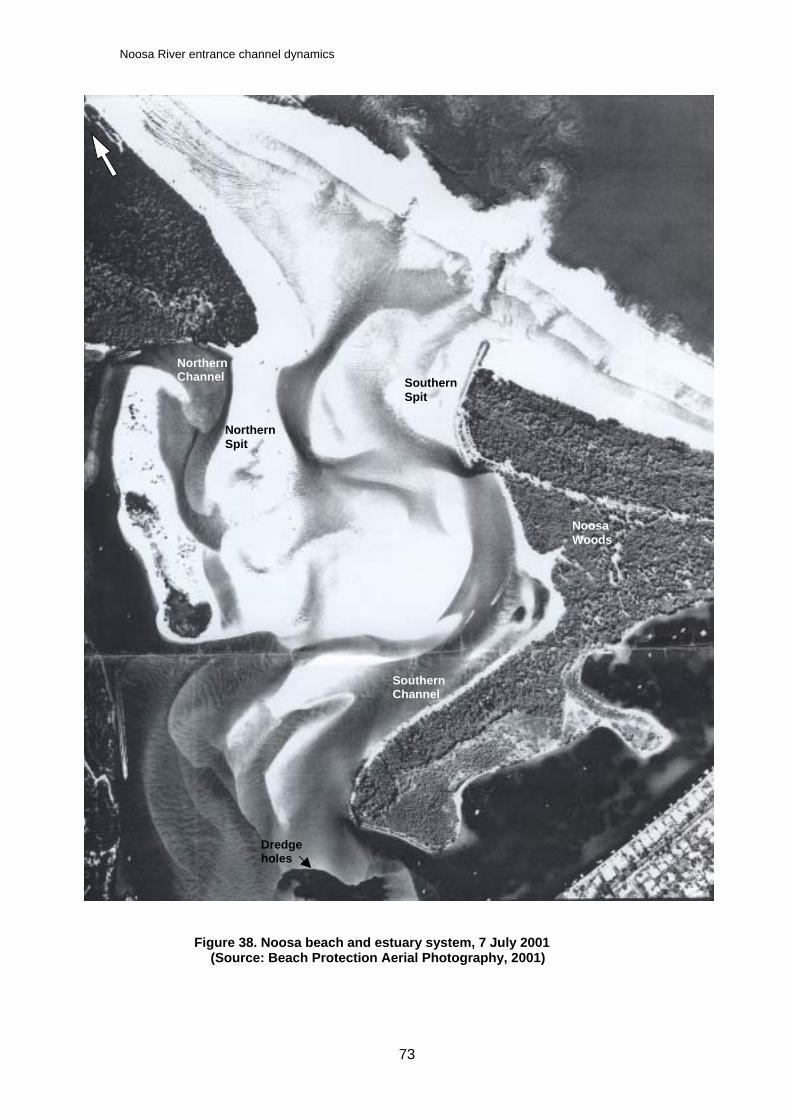
Noosa River entrance channel dynamics
73
Figure 38. Noosa beach and estuary system, 7 July 2001 (Source: Beach Protection Aerial Photography, 2001)
Southern Spit
Northern Channel
Southern Channel
Dredge holes
Northern Spit
Noosa Woods
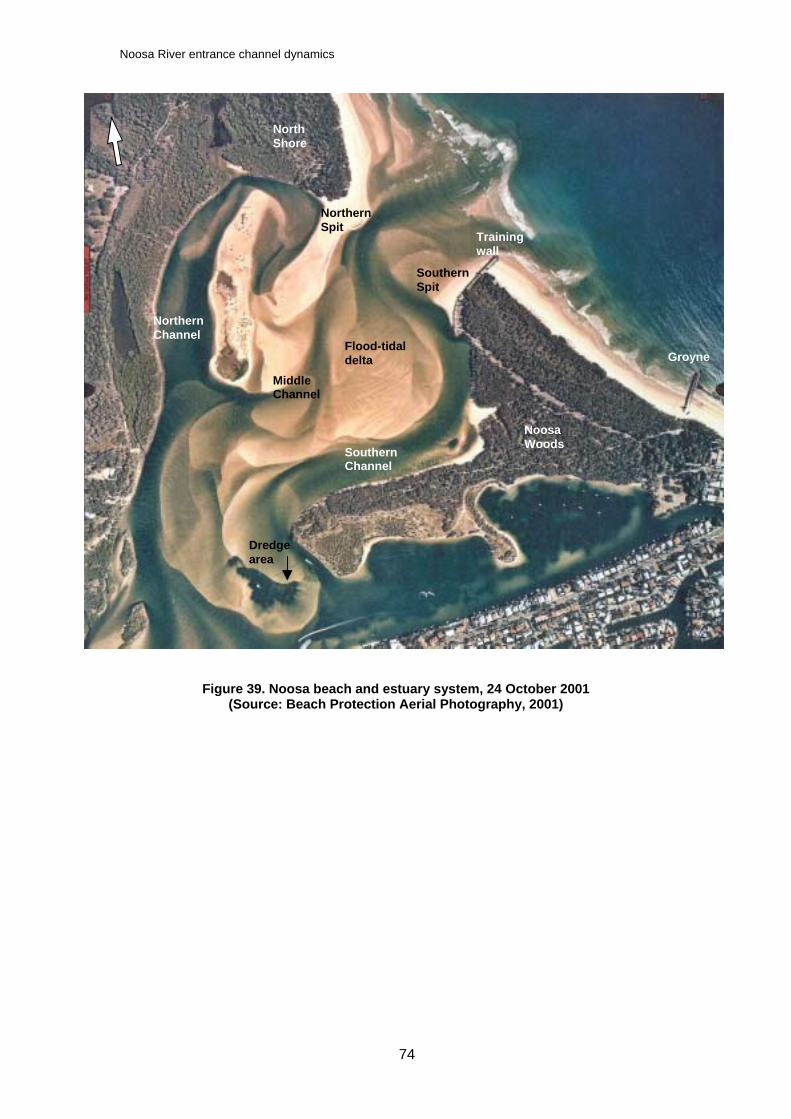
Noosa River entrance channel dynamics
74
Figure 39. Noosa beach and estuary system, 24 October 2001 (Source: Beach Protection Aerial Photography, 2001)
Training wall
Dredge area
Southern Spit
North Shore
Northern Spit
Northern Channel
Flood-tidal delta Groyne
Middle Channel
Southern Channel
Noosa Woods
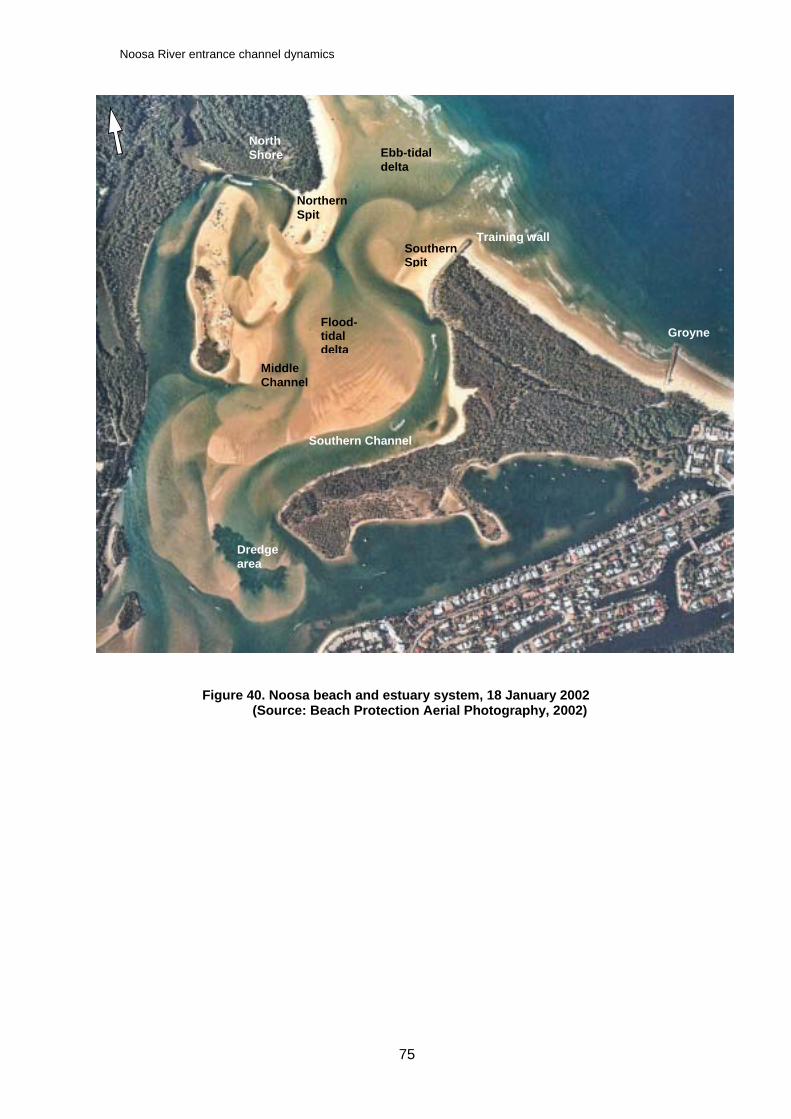
Noosa River entrance channel dynamics
75
Figure 40. Noosa beach and estuary system, 18 January 2002 (Source: Beach Protection Aerial Photography, 2002)
Training wall
Groyne
Southern Channel
Southern Spit
North Shore Ebb-tidal
delta
Northern Spit
Middle Channel
Flood-tidal delta
Dredge area
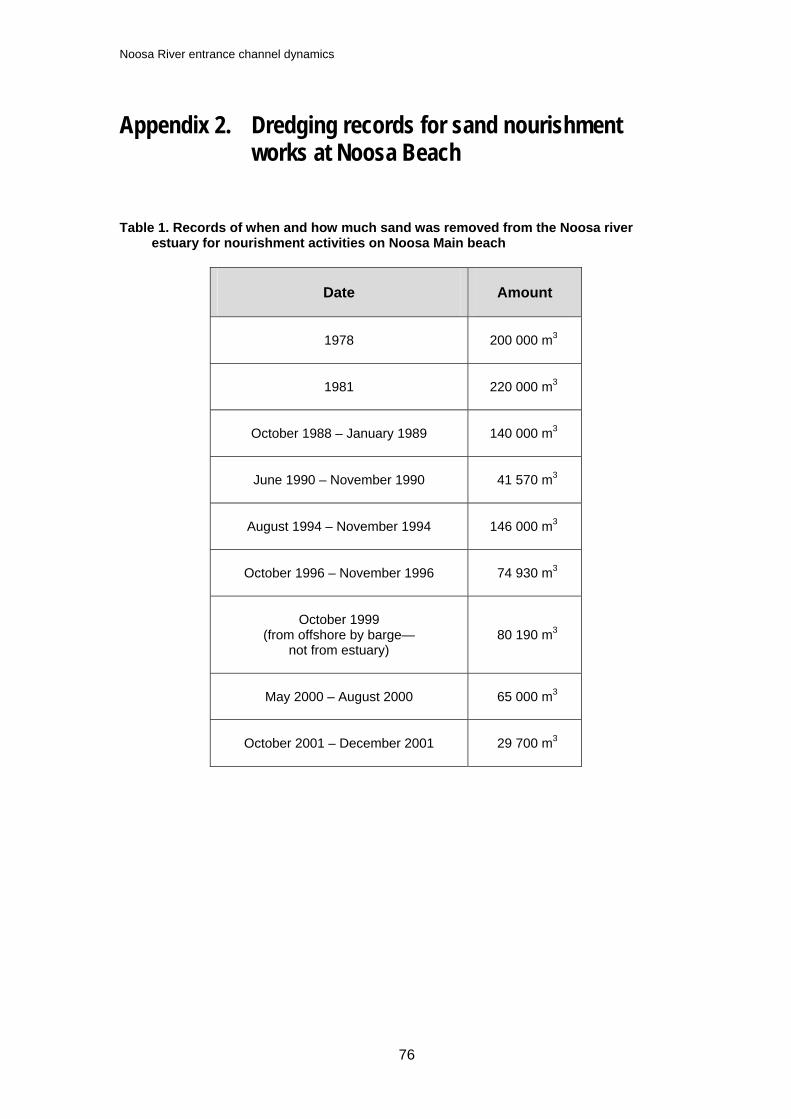
Noosa River entrance channel dynamics
76
Appendix 2. Dredging records for sand nourishment works at Noosa Beach
Table 1. Records of when and how much sand was removed from the Noosa river estuary for nourishment activities on Noosa Main beach
Date Amount
1978
200 000 m3
1981
220 000 m3
October 1988 – January 1989
140 000 m3
June 1990 – November 1990
41 570 m3
August 1994 – November 1994
146 000 m3
October 1996 – November 1996
74 930 m3
October 1999
(from offshore by barge— not from estuary)
80 190 m3
May 2000 – August 2000
65 000 m3
October 2001 – December 2001
29 700 m3