Embed Size (px)
Citation preview
NONWORD READING AS AN INDICATOR OF
ORTHOGRAPHIC LEARNING IN
THE ID POPULATION
by
SUSAN LOVEALL
A THESIS
Submitted in partial fulfillment of the requirements
for the degree of Master of Arts
in the Department of Psychology
in the Graduate School of
The University of Alabama
TUSCALOOSA, ALABAMA
2011

Copyright Susan J. Loveall 2011
ALL RIGHTS RESERVED
ii
ABSTRACT
Previous research has suggested that individuals with intellectual disability (ID) perform
worse in several areas of reading compared to mental age matched peers (see Conners, 2003 for
a review of the literature). However, it is unclear how they compare on measures of
orthographic processing, the visual aspect of reading. The leading approach to understanding
orthographic processing in word identification for typically developing (TD) children is the self-
teaching hypothesis (Jorm & Share, 1983; Share, 1995; 1999). The self-teaching hypothesis
suggests that word-specific orthographic representations are acquired as a result of phonological
recoding. By sounding out words, individuals incidentally pick up on the orthographic layout of
those words, achieving orthographic learning. The present study is a first test of the self-teaching
hypothesis for children with ID. The results indicate that both groups were able to self-teach.
This study has important implications for reading instruction. Specifically, instruction in
phonological recoding may have a double benefit for individuals with intellectual disabilities.
With more phonological recoding instruction they may be better at recoding and also gain
orthographic knowledge in the process.
iii
LIST OF ABBREVIATIONS AND SYMBOLS
F Fisher‟s F ratio: a ratio of two variances
M Mean: the sum of a set of measurements divided by the number of measurements
in the set
p Probability associated with the occurrence under the null hypothesis of a value as
extreme as or more extreme than the observed value
r Pearson product-moment correlation
t Computed value of t test
n Sample size for group
SD Standard deviation
> Greater than
< Less than
= Equal to
ID Intellectual disability
IQ Intelligence quotient
KBIT-2 Kaufman Brief Intelligence Test – 2nd
edition
MA Mental age
REP Repetition score
SOS Sound out score
TD Typically developing
VAS Visual analysis skill

iv
VMA Verbal mental age
WA Word-analysis
WAorth Word-analysis orthographic choice task
WAspell Word-analysis spelling test
WS Word-supply
WSorth Word-supply orthographic choice task
WSspell Word-supply spelling test
WISC-R Weschler Intelligence Scale for Children – Revised
WRMT-R Woodcock Reading Mastery Test - Revised
v
ACKNOWLEDGEMENTS
First, I would like to thank my advisor and thesis chairperson, Dr. Frances Conners, for
her insightful guidance and continuous support and encouragement. I would also like to thank
the other members of my committee, Drs. Ed Merrill and Jason Scofield, for their input and
assistance from the initial formulation of the idea and throughout the various stages of the
project. In addition to my committee, I would like to thank Dr. Julie Masterson, who allowed me
a better project by lending her spelling measure, as well as her time, energy and friendliness. I
would also like to thank my family and friends for their unfailing belief in and endless patience
with me. Finally, I would like to thank the Tuscaloosa County schools, Crossing Points, the
Exceptional Foundation, all of the participants and their families for their help in this research.
Their kindness and willingness to participate made this project both possible and enjoyable.

vi
CONTENTS
ABSTRACT ................................................................................................ ii
LIST OF ABBREVIATIONS AND SYMBOLS .................................. iii-iv
ACKNOWLEDGEMENTS .........................................................................v
LIST OF TABLES .................................................................................... vii
LIST OF FIGURES ................................................................................. viii
1. INTRODUCTION ...................................................................................1
2. METHODOLOGY ................................................................................12
3. RESULTS ..............................................................................................22
4. DISCUSSION ........................................................................................26
TABLES AND FIGURES .........................................................................32
REFERENCES ..........................................................................................38
vii
LIST OF TABLES
1. List of all nonword targets used in the present study and their phonetic
spellings..…………………………………………………………....…………. 32
2. Sample Descriptives .……………………………...………….…………..……. 33
3. Dependent Variable Descriptives ………………………………………....…… 34
4. Correlations Among Key Variables………………………………………..…... 37
viii
LIST OF FIGURES
1. Mean Orthographic Choice Task Scores by Group for Word-Analysis and
Word-Supply Conditions ………………….............……………………………35
2. Mean Spelling Tests by Group for Word-Analysis and Word-Supply
Conditions……………………………………………………………………….36

1
INTRODUCTION
Just as in the general population, reading ability and motivation to read varies in
individuals with intellectual disabilities (ID). Some individuals, especially those with ID, may
have a strong desire to read, but struggle a great deal learning to read. While extensive research
has examined reading development in typically developing (TD) children (Snow, Burns, &
Griffin, 1998), very little research has investigated reading skills within the ID population.
However, a call has been made from the President‟s Commission for People with Disability
declaring that the “acquisition of reading skills” in this population should be a top priority
(PCPID, 2004). The first step to aid in this intervention is to identify underlying strengths and
weaknesses in their reading ability.
Reading Skills in the ID Population
Despite its importance, reading is a difficult skill for children with ID to conquer. A
review of the literature (Conners, 2003) suggested that children with ID often match TD children
on early emerging reading skills, but show specific difficulty on later emerging reading skills.
For example, at a developmental level of 4-6 years, children with ID perform at or above their
level of sight word identification, letter identification, and letter sound correspondence (Blake,
Aaron, & Westbrook, 1969; Cawley & Parmar, 1995; Gickling, Hargis, & Alexander, 1981).
2
At a developmental level of 6-8 years, children with ID perform at or below their level, with
specific difficulty in phonological recoding and certain comprehension skills (Bos & Tierney,
1984; Cawley & Parmar, 1995; Jenkinson, 1992; Levitt, 1970, 1972), and at a developmental
level of 9 years and above, children with ID perform below their level in general (Nagle, 1993;
Sheperd, 1967; Wood, Buckhalt, & Tomlin, 1988).
Thus, Conners‟ (2003) review of the literature suggested that certain aspects of reading
may be more problematic than others for the ID population. For example, phonological recoding
appears to be one area of specific difficulty for children with ID. Phonological recoding is
reading by sounding out, a process sometimes called word attack. Even when building blocks,
such as letter-sound correspondences, are in place, children with ID seem to have difficulty with
phonological recoding (see Conners, Rosenquist, Sligh, Atwell, & Kiser, 2006). Strong
relationships have been found between performances on phonological recoding and overall
reading skill. Further, Wagner and Torgesen (1987) found that phonological awareness, which
develops at the same time or slightly before reading, plays a causal role in the acquisition of
reading skills.
Although there has been some attention to the study of phonological recoding in children
with ID, there has been little if any attention to orthographic recoding. Along with phonological
recoding, orthographic recoding is one of the main subskills of word identification. Orthographic
recoding is a visual component of reading. It involves recognizing specific letter patterns that
correspond to specific words, and requires knowledge of how letters tend to combine in one‟s
language. Without much research on orthographic recoding in the ID population, it is difficult to
determine if this is an area of difficulty for children with ID. Thus, the purpose of the present
study is to examine orthographic recoding by children with ID.
3
Self-teaching Hypothesis
The leading approach to understanding orthographic recoding in word identification for
TD children is the self-teaching hypothesis (Jorm & Share, 1983; Share, 1995; 1999). The self-
teaching hypothesis suggests that word-specific orthographic representations are acquired as a
result of phonological recoding. By sounding out words, individuals incidentally pick up on the
orthographic layout of those words, achieving orthographic learning. The present study is a test
of the self-teaching hypothesis for children with ID.
The self-teaching hypothesis has been supported in several empirical studies. In a classic
study, Share (1999) showed that when children sounded out words during reading, they learned
the orthographic features of those words. Share had second graders read aloud short texts (94-
170 words) with embedded nonword targets. Three days later, the children completed three
orthographic learning measures. The first was an orthographic choice test in which the
participants were to choose the learned nonword target from among four options. The three
alternate options included a homophone foil, a visually similar foil in which one letter was
replaced with another that looked very similar, and a transposition foil, in which two adjacent
letters were transposed. The second orthographic learning measure was a rapid naming test in
which the participants had to identify a series of words presented on a computer screen, some of
which were the nonword targets. The other words included homophones of the nonword targets
and real words. The third orthographic learning measure was a spelling test in which the
participants were to spell the nonword targets. In the orthographic choice task, participants
chose the nonword targets more often than alternate homophone, visually similar and
transposition foils.
4
In the rapid naming task, participants read the nonword targets more quickly than homophones
and real words, and in the spelling test, participants spelled the nonword targets more accurately
than alternate homophones.
In follow-up studies, Share (1999) showed that it was phonological recoding, and not
mere visual exposure to nonwords, that was essential to orthographic learning. Over multiple
experiments Share created conditions that limited opportunity for phonological recoding. He
presented the nonword targets very briefly (300 milliseconds) and had participants vocalize
concurrently by saying “DUBBA” over and over while the nonword target was presented. When
conditions of phonological recoding were diminished, participants‟ orthographic learning, as
measured by orthographic choice, rapid naming and spelling tests, was significantly reduced.
The self-teaching hypothesis has since been tested across a wider age range with a wider
variety of conditions and stimuli. Studies including children in grades one through five have
supported the self-teaching hypothesis (Cunningham, 2006; Share, 2004). Further, studies using
both nonword and real word targets have supported the hypothesis (Bowey & Miller, 2007;
Cunningham, 2006; de Jong & Share, 2007; Kyte & Johnson, 2005; Nation, Angell, & Castles,
2006), whether targets were presented in isolation or embedded within text (Nation et al., 2006),
and whether read aloud or silently (Bowey & Muller, 2005; de Jong & Share, 2007). Share
(2004) found that a single exposure of a target provided orthographic learning that was
maintained for up to a month. Individual-differences have also been found in self-teaching.
More advanced phonological recoders performed better on real word reading than poorer
phonological recoders, and the relation between phonological recoding and real word reading
was partially mediated by orthographic knowledge (Conners, Loveall, Moore, Hume and
Maddox, 2011).
5
In spite of the overwhelming evidence in favor of the self-teaching hypothesis, two
limitations have been noted by researchers. First, orthographic recoding may not be entirely
dependent on phonological recoding. Cunningham, Perry, Stanovich, and Share (2002; also
Cunningham, 2006; Share, 1999) found that previous general orthographic knowledge
contributed to orthographic learning after the influence of phonological recoding of the target
nonwords was removed. A second factor that could contribute to orthographic learning is
semantic information. Ouellette and Fraser (2009) found that fourth graders recognized and
spelled nonwords more accurately when they were presented in context with semantic
information than when they were presented in isolation.
A second limitation is that there appears to be a difference in self-teaching in shallow
versus deep orthographies. In shallow orthographies, such as Hebrew, there is a direct mapping
from letter to sound, and sounding out is very straightforward. In deep orthographies, such as
English or Dutch, the letter-sound mapping is more complex, and letter sounds can vary
depending on context (e.g., in English the letter c makes different sounds in cat, cell, and chop).
Although self-teaching is evident as early as first grade in deep orthographies, it may not emerge
until around the third grade in shallow orthographies (Share, 2004). This may be because in
shallow orthographies, letters always correspond to the same sound despite their placement in a
word. Since letters always make the same sound, individuals learning shallow orthographies do
not depend on orthographic knowledge as much as individuals learning deep orthographies;
therefore they may develop orthographic knowledge later than those who learn deep
orthographies.
The self-teaching hypothesis might predict that children with ID are particularly impaired
in orthographic learning because of their extreme difficulty with phonological recoding. Some

6
support for this idea was provided by Cunningham et al. (2002) and Share (1999). Cunningham
and colleagues found that target word recoding was positively correlated with orthographic
learning in TD 2nd
grade children. As mentioned previously, Share (1999) experimentally
manipulated the level of recoding accuracy in 20 second grade children by only briefly flashing
targets (300 ms) and by using irrelevant concurrent vocalization (participants repeated
“DUBBA” out loud until the target strings were replaced by a mask onscreen) during a lexical
decision task. Results showed that when recoding accuracy was reduced, orthographic learning
declined.
Although there is no research on the self-teaching hypothesis involving children with ID,
there are a few studies involving children with specific reading disability. As a group, these
children also have extremely poor phonological recoding. Thus, findings related to this group
may be relevant to children with ID. Contrary to the self-teaching hypothesis, some research has
shown that when compared to younger reading-level matched controls, older children with
reading disability tend to have equivalent or even superior orthographic recoding in spite of their
inferior phonological skills (Siegel, Share, & Geva, 1995; Share & Shalev, 2004; Stanovich &
Siegel, 1994).
Share and Shalev (2004) examined this apparent paradox within the self-teaching
paradigm. They developed two competing hypotheses to test against the self-teaching hypothesis
for children with reading disability. The compensatory processing hypothesis predicts better
orthographic skills in disabled readers than would be expected based on their level of
phonological recoding. This ability could be the result of a basic processing advantage in the
visual domain or an acquired processing style.
7
In other words, the compensatory processing hypothesis suggests that some other kind of
strength related to orthographic learning compensates for a weakness in phonological recoding.
The dissociation hypothesis predicts poorer orthographic learning in children with
reading disability than would be expected from their level of phonological recoding. It suggests
that the relationship between phonological recoding ability and orthographic learning may be
weaker for disabled readers than for normal readers. Therefore, a given level of recoding among
disabled readers does not result in as much orthographic learning as the same level of recoding
would in normal readers. Research by Ehri and Saltmarsh (1995) is consistent with this
hypothesis.
Ehri and Saltmarsh (1995) found that children with reading disability may perform more
poorly in orthographic learning than younger TD readers who are similar in phonological
recoding ability. Participants were taught to read simplified spellings of words (e.g. CRADL) in
a list format, allowing practice between 10 and 12 times over a two day period. Three days later
the participants were asked to name the original spellings (CRADL), homophonic spellings
(KRADL) and non-homophonic spellings (KRATL). They found that even though the two
groups were equivalent in phonological recoding, the children with reading disability needed
more trials to learn the simplified spelling. In addition, the typical readers read the target
spellings faster than the homophonic foils indicating good orthographic learning, while the older
disabled readers did not.
Share and Shalev (2004) tested the self-teaching hypothesis vs. the compensatory
processing hypothesis and the dissociation hypothesis using four groups of children - dyslexics,
garden-variety poor readers, a chronologically matched control group (all in grades 4-6) and a
reading level/mental age matched control group (Grade 2). Participants read aloud short stories
8
that contained embedded nonwords. Three days later, the participants completed three post-tests
evaluating orthographic learning. In support of the self-teaching hypothesis, dyslexics and
garden variety poor readers performed worse in orthographic learning than same-age typical
readers, and this difference was fully explained by differences in target word recoding accuracy.
However, in contrast to the self-teaching hypothesis, dyslexics and garden variety poor readers
performed better in orthographic learning than reading-level controls even though their target
word recoding accuracy was lower. None of the three hypotheses fully explained the data, so
Share and Shalev proposed a hybrid orthographic sensitivity hypothesis. The orthographic
sensitivity hypothesis proposes that given a critical volume of print experience, fundamental
changes in orthographic sensitivity can take place, leading children to acquire a specialized print-
specific processing skill. In this way, after years of print exposure, even disabled readers may
develop sensitivity to orthography of words, and when compared to younger, beginner readers,
they may show some advantage in orthographic learning of new words in spite of poorer
phonological recoding.
Thus, Ehri and Saltmarsh (1995) and Share and Shalev (2004) came to different
conclusions about orthographic learning by children with reading disability. Ehri and Saltmarsh
showed worse orthographic learning compared with typical readers who were similar in
phonological recoding; Share and Shalev showed better. The difference in study outcomes may
be due to the fact that one study was conducted in English (a deep orthography) and the other in
Hebrew (a shallow orthography) (see Share, 2008; Share & Shalev, 2004, for discussion).
Interestingly, neither study supported the self-teaching hypothesis.
It is important to note that in Share and Shalev‟s (2004) study, the poor readers included
dyslexics as well as “garden variety” poor readers. Dyslexics have a large discrepancy between
9
IQ, (which is typically equivalent with chronological-age matched peers) and reading (which is
especially poor when compared to their IQ). Garden variety poor readers show deficits in both
IQ and reading compared to their chronological age matched peers. However, garden variety
poor readers have a high enough IQ, above 70, that they are not considered ID. Both dyslexics
and garden variety poor readers showed the same pattern in Share and Shalev‟s study, so it is
possible that children with ID would show the same pattern as other poor readers (dyslexic or
garden variety), at least if they are tested in the same orthography. The present study tested the
self-teaching hypothesis in children with ID in the same orthography as those tested by Ehri and
Saltmarsh (1995).
Word-Analysis vs. Word-Supply
Although there is little to no research on orthographic learning as a reading skill in
children with ID, different error correction procedures have been researched to determine which
are more effective in facilitating reading accuracy. Word-supply and word-analysis are two
common forms of error correction. Word-supply is simply providing a word that someone
cannot read. For example, if reading the sentence, “The dog was having a wonderful day!” a
student did not recognize the word “wonderful”, the teacher would simply provide the correct
pronunciation of the word for the student. Word-analysis involves sounding out the word. In
this case, the teacher would instruct the student in sounding out the different phonemes of
“wonderful” until the student could put together the whole word.
Singh and Singh (1985) found that, although any error correction is more effective than
no correction, word-analysis is significantly more effective than word-supply in increasing
accuracy of word reading for children with ID. This suggests that children with ID do benefit
from the phonological recoding process in learning to read words (see also Neville & Vandever,
10
1973; Conners, et al., 2006). However, the effect needs to be replicated in the ID population, as
only two of four children in this study showed the effect. Additionally, in error correction studies
involving children with learning disabilities, word-analysis has not always been more effective
than word-supply (Meyer, 1982; Rose, McEntire, & Dowdy, 1982; Rosenberg, 1986).
Furthermore, because Singh and Singh did not compare children with and without ID, it is not
known if the children with ID were more or less efficient in orthographic learning compared to
developmental expectations.
Purpose of the current study and hypotheses
The current study tested the self-teaching hypothesis on children with ID by contrasting
word-supply and word-analysis techniques and comparing children with ID andTD children of
similar verbal age. In a 2 x 2 (Group x Nonword exposure condition) design, children from both
groups were exposed to one set of nonwords by word-analysis and a second set of nonwords by
word-supply. Approximately three to five days later, children completed tests of orthographic
learning.
Previous research has shown that children with ID are weak in semantic processing, or at
understanding the meaning of what is read, when compared to TD counterparts (Laing, Hulme,
Grant, & Karmiloff-Smith, 2001). To avoid disadvantaging children with ID, the current study
decontextualized targets by using list format rather than text-embedded format. Another
difference between groups is that the ID group would be older and would have had more
experience with print in general. To avoid disadvantaging children with TD, the current study
used nonword rather than real word targets.
According to the self-teaching hypothesis, children should show greater orthographic
learning when words are learned through word-analysis rather than through word-supply (the

11
self-teaching effect). Also, if the group with ID is poorer in phonological recoding, this group
should show a weaker self-teaching effect than the TD group. Further, the group differences in
self-teaching effect should be explained statistically by differences in target-word recoding
accuracy.
In addition to testing the self-teaching hypothesis, the proposed study explored three
other alternative hypotheses. Similar to the self-teaching hypothesis and consistent with the
results of Ehri and Saltmarsh (1995), the dissociation hypothesis predicts that children with ID
will show a smaller self-teaching effect than children with TD, meaning that they are less
efficient in orthographic learning. However, importantly, group differences in self-teaching
effect should remain significant even after controlling for target-word recoding accuracy. The
compensation hypothesis predicts a larger self-teaching effect in the ID group than in the TD
group. Children with ID might be better at visual types of learning that would help them acquire
orthography more efficiently. Finally, the orthographic sensitivity hypothesis predicts that
children with ID will show a larger orthographic learning effect that is not attributable to
differences in visual skills.
12
METHODOLOGY
Design
This study was conducted as a mixed two way design. The between-groups independent
variable was Group (ID vs. TD) and the within-groups independent variable was Nonword
Exposure Condition (word-analysis vs. word supply). There were two dependent variables meant
to measure orthographic learning - performance on orthographic choice tasks and performance
on spelling tasks.
Participants
Participants included 18 children with ID and 19 children who were TD. Participants
were recruited from local schools (for both ID and TD) and organizations for individuals with
intellectual and developmental disabilities (for ID). Participants with ID were identified by the
school and screened by asking teachers for those students they believed could finish the tasks.
Consent forms were then sent to parents, and assent was received from participants before
beginning testing.
Criteria for inclusion in the study were (1) a verbal mental age between 6 and 12 years on
the Kaufman Brief Intelligence Test, 2nd
edition (KBIT-2) and (2) the ability to sound out two
nonwords on the Word Attack subtest of the Woodcock Reading Mastery Test – Revised
(WRMT-R). The KBIT-2 was also used to get an estimate of participants‟ IQs and confirm or
disconfirm whether participants had ID. Participants received a small, school-appropriate prize
for participation in the study.
13
Participants with ID. Out of 27 participants with ID who were originally recruited for the
study, 18 met all criteria, were able to complete the study, and were included in data analysis. Of
those 18 participants, the age range was 13.17 – 33.83 years (M = 19.97; SD = 4.99), and the
verbal mental age range was 6.25 – 10.67 years (M = 8.87; SD = 1.30). Of the participants who
did not meet the eligibility criteria of the study and were therefore excluded from analyses, two
scored below the lower verbal mental age criterion of 6 years, four could not correctly sound out
two nonwords on the Word Attack subtest of the WRMT-R, one did not return to school, where
testing took place, after the first testing session, and two had IQ‟s above 70. The latter two were
identified by their teachers for inclusion in the study, but according to their IQ score, appeared
not to have an intellectual disability and were not included in data analysis.
TD Participants. Out of 25 TD participants recruited for the study, 19 met criteria, were
able to complete the study, and were included in data analysis. Of those ten, the age range was
7.25 – 9.67 years (M = 8.04; SD = .73), and the verbal mental age range was 6.25 - 12.67 years
(M = 8.72; SD = 1.72). Five TD participants scored outside of the verbal mental age range
needed for the study. Specifically, four participants scored below 6 years, one of whom also had
a low IQ, and one participant scored above 12 years. In addition to those five participants, one
participant was also lost because he was not available to complete the second testing session.
Materials
Kaufman Brief Intelligence Test 2. The Kaufman Brief Intelligence Test, 2nd
Edition (K-
Bit2) (Kaufman & Kaufman 2005) is a brief measure of verbal and non verbal intelligence. It is
individually administered, takes approximately 15-30 minutes, and is standardized for
individuals from 4 – 90 years of age. It yields verbal and nonverbal raw scores, verbal and
nonverbal standard scores and age equivalents, a composite of verbal and nonverbal standard
14
scores and an IQ Composite score. The verbal section consists of two subtests, Verbal
Knowledge and Riddles. These subtests measure verbal skills by assessing word knowledge,
range of general information, verbal concept formation, and reasoning ability.
Verbal Knowledge is the first verbal subtest given. It contains 60 items that measure
receptive vocabulary and information about the world. The participant is prompted by the
experimenter with a word or question and chooses one illustration or photograph out of six
possibilities that best shows the meaning of a word or question. This subtest calls on
participants‟ long-term memory storage, which the participant uses to recognize the illustrations.
This is a recognition test and does not require the participant to know or say the exact name of
any of the illustrations or photographs.
The second verbal subtest given is Riddles. It contains 48 items meant to measure verbal
comprehension, reasoning, and vocabulary knowledge. Investigators ask a riddle and
participants are asked to either point to a picture in Items 1-8 or give a single word answer in
Items 9-48 that answers the riddle, for example, “What is something round that you put cereal
in?” For both subtests, correct answers are awarded a score of 1 and incorrect answers a score of
0. The two verbal subtests each yield a raw score. These are combined to form one total score,
which can be converted into a verbal standard score, and/or used to calculate the participants‟
verbal age equivalences. The verbal standard score is also used to calculate overall IQ. This
study used the verbal age equivalence scores to match groups on verbal mental age. IQ was also
used to confirm or disconfirm that participants were TD or had an intellectual disability.
The nonverbal subtest is Matrices, and it is given after the verbal knowledge subtest and
before the riddles. It contains 46 items in three different sections of increasing complexity. In
the first section the participant is shown drawing and is asked to pick the corresponding object

15
out of five drawing choices. The second section contains analogies. Two side-by-side pairs of
objects or designs are shown. An object of one pair is missing, and the participant is to pick the
drawing that will complete the analogy. The third and most difficult section shows a square
array of drawings. Each row and each column has a pattern, that all of the objects correspond
with. The participant is to pick the drawing that completes the matrices. Correct answers are
awarded a score of 1 and incorrect answers receive a score of 0. This score serves as the
nonverbal score and in the current study as the visual analysis covariate. The present study used
the Matrices raw score as a measure of visual analysis skill.
For the participant ages in this study, the KBIT-2 has Spearman Brown split half
reliabilities ranging from .90 to .95 for the full test, .86 to .94 for the verbal section, and .81 to
.91 for the nonverbal section. The KBIT-2 also correlates with the Wechsler Intelligence Scale
for Children – Fourth Edition (WISC-IV) at .77 for the full test, .79 for the verbal sections, and
.56 for the nonverbal section (Kaufman & Kaufman, 2005).
Woodcock Reading Mastery Tests - Revised, Word Attack Subtest. The Woodcock
Reading Mastery Test – Revised (WRMT-R) (Woodcock, 1998) is designed to measure
intellectual abilities and academic achievement in populations of individuals from 2 to 90+ years.
It consists of six subtests and a two-part supplementary checklist. Different combinations of
tests, or clusters, allow the user to focus on specific classes of reading skills. For example, the
Basic Skills Cluster is composed of Word Identification and Word Attack. The subtests are used
to evaluate fluency in reading and math, as well as general and specific cognitive functioning.
The present study used the Word Attack subtest, which is specifically meant to measure
nonword reading ability. It contains 45 items of nonwords or very low frequency words in the
English language. Participants are presented the nonwords on an easel and are asked to

16
pronounce them (e.g. tat, op, rejune). Scoring is completed during testing based on basal and
ceiling levels. Scoring can be done one of two ways. The whole word can be scored as either
correct (1 point) or incorrect (0 points), or each phonic or structural component of each nonword
can be scored. The present study scores by whole nonword as either correct (1 point) or
incorrect (0 points). Raw scores were used as one measure of phonological recoding.
Reliability calculations for each reported grade or age level included all subjects in the
norming sample at that level. The WRMT-R Word Attack has Spearman Brown split half
reliabilities ranging from .92 to .99 for the full test and from .84-.94 for the Word Attack subtest.
WRMT-R‟s correlation with Woodcock-Johnson reading Tests ranged from .85-.91 for the full
test and .64-.90 for the Word Attack subtest (Woodcock, 1998).
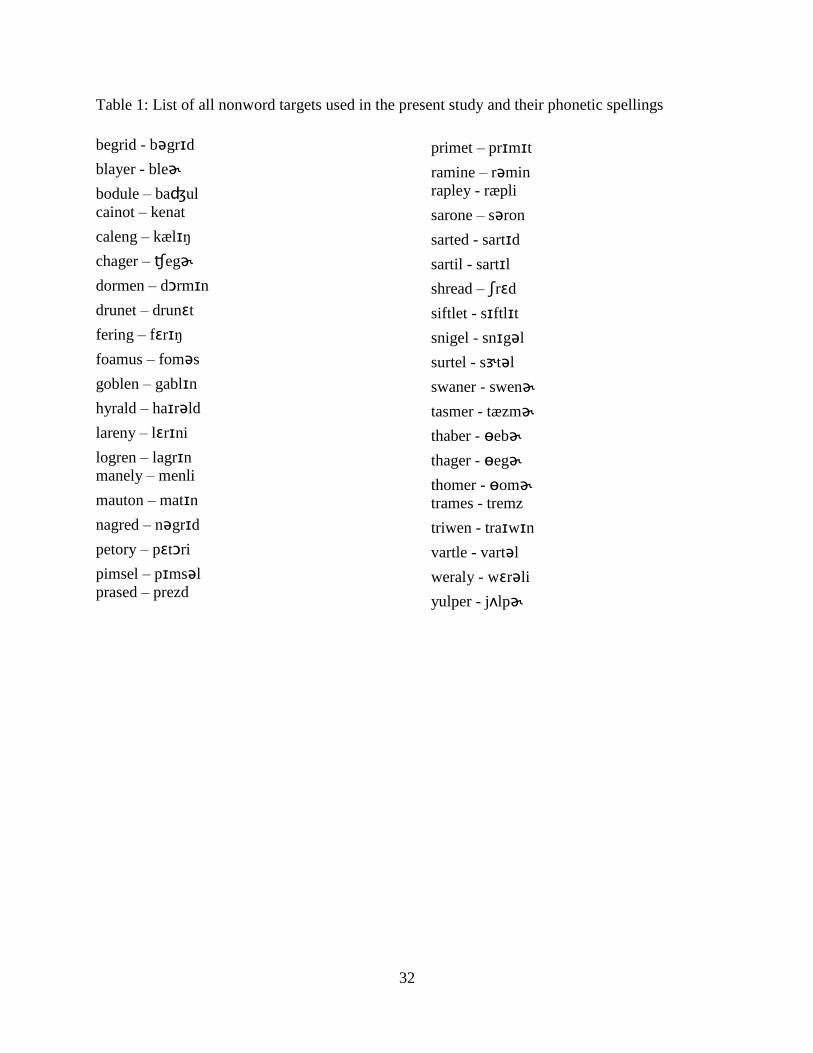
Nonword Learning Lists. A pool of 40 pronounceable nonwords (e.g. thomer, blayer,
swaner) were used, chosen from lists rated for spelling regularity and phonotactic frequency
(Massarro, Taylor, Venezsky, Jastrzembski & Lucas, 1980). The nonwords chosen for the
present study were those in the Regular/High frequency. Regularity indicated that the letter
strings used in each of the nonwords were phonologically legal and contained common vowel
and consonant spellings. High frequency indicated that the position for each letter was common
and was determined by summing the position-dependent frequency for each letter in a nonword.
See Table 2 for a list of the nonwords used in the present study and their phonetic spellings.
The 40 nonwords were divided randomly into two sets of 20 nonwords, with each set
divided into two lists of 10 nonwords. Each set was assigned to a participant. This procedure was
repeated until each participant had a unique set of two lists of 10 nonwords. For every participant
in the TD group, there was a participant in the ID with matching lists. One list was learned using
word-analysis (WA, sounding out) and the second list was learned by word-supply (WS). Lists
17
were counterbalanced across nonword exposure condition. The result was that all of the
nonwords were used in different random combinations across participants and in the same
combinations across the two groups. The only deviation from this was that for one participant in
the TD group there was no participant in the ID group with a matching list. This was because
there was one more participant in the TD group than in the ID group.
Orthographic Choice Task. The orthographic choice task included four nonword choices
for each target nonword learned and asked participants to choose the nonword they learned
previously (e.g., thomer thowmer thmoer thamer). One nonword was the learned target word
(e.g., thomer), one a pseudo-homophone, or phonologically similar nonword, with the same
sound (e.g., thowmer), one contained a transposition (e.g., thmoer), and one had a visually-
similar, but phonologically different spelling (e.g., thamer). The order of nonwords was
randomized. Correct recognition of the previously learned nonword was scored as 1, while
incorrect choices received a score of 0. Scores of 1 indicate orthographic learning; scores of 0
did not. Orthographic choice tasks for the word-analysis condition are referred to as WAorth,
and orthographic choice tasks for the word-supply conditions are referred to as WSorth.
Spelling Test. The spelling test asked participants to spell each of the learned nonwords,
after being presented verbally by an experimenter. The spelling measure developed by
Masterson and Apel (in press) was used to score participants‟ spelling tests. This measure allows
partial credit for spellings in which some elements are spelled correctly and others are spelled
incorrectly. Each element of a nonword is worth 3 possible points. Participants are awarded 3
points if the element had the correct spelling (e.g., t for t), 2 points if the spelling was legal but
incorrect based on the originally spelling (e.g., tt for t), 1 point if the spelling was illegal (e.g., b
for t), and 0 points if the element was not represented (e.g., nothing where t should be).
18
Masterson and Apel‟s (in press) spelling measure yields both an element and a word score for
each spelled word, or nonword in the present study. An element score takes the total number of
points earned for each nonword and divides it by the total number of elements. An overall
element score can also be computed for each spelling test by adding together the element scores
across all nonwords and dividing the total element score by the total number of elements.
Masterson and Apel‟s (in press) measure also yields a word score. Similar to the element
score, a word score is provided for each nonword and also for the entire spelling test. If a
nonword is spelled correctly it receives a word score of 3 points. If one or more elements of a
nonword is spelled incorrectly but legally (i.e. “doormen” for the nonword “dormen”), 2 points
are awarded. If a nonword has all elements represented, but one or more elements is incorrect
and illegal (i.e. “bormen” for “dormen”), it is awarded a word score of 1 point. If any elements
are not represented (i.e. “dormn” for “dormen”), the nonword is given a word score of 0.
Because the overall element score takes into account the element scores for each element
and averages them together, it awards partial credit and so is more sensitive than the word score.
Therefore, the overall element scores for each spelling test were used for analyses in the present
study. Spelling tests for the word-analysis condition are referred to as WAspell and spelling tests
for the word-supply conditions are referred to as WSspell. A reliability check revealed that two
independent scorers had very strong reliability in coding and scoring a subset of 20 spelling tests,
with no reliability under .90.
Procedure
The study involved two to three sessions, one to two sessions for standardized tests and
nonword learning and one session for testing. The study lasted approximately one hour for the
standardized testing and learning session(s) and approximately 20 minutes for the testing session.
19
Participants were told the purpose of the study was to help researchers learn how different
children read. Participants first completed the KBIT-2 and the WRMT-R Word Attack Subtest.
Participants then learned two lists of 10 nonwords. Each list corresponded with a “family of
creatures”. One family was a family of pretend water creatures and the other a family of pretend
space creatures. Participants were shown the families and told that each of the family members
had a funny name and that they were going to learn each of the family member‟s names. One list
was learned using word-analysis (sounding out) and the other list was learned using word-supply
(repetition). The order of nonword exposure condition was counterbalanced across participants
In the word-analysis condition, the investigator showed the participant a nonword and
said, “This is a family of pretend space creatures. They have funny names. I‟m going to show
you their names and I want you to try to sound them out slowly.” If the participant correctly
pronounced the nonword the first time the investigator said, “That‟s correct” repeated the
nonword and moved on. If the participant correctly, but slowly, sounded out the word, the
investigator then asked the participant to put the sounds together and say the whole nonword. If
the participant correctly identified the nonword, the investigator let him/her know that was
correct, repeated the nonword and moved on. If the participant incorrectly sounded out the
nonword, the investigator went go back to the nonword and asked the participant to sound it out,
phoneme by phoneme. If the participant incorrectly sounded out any phoneme, the investigator
immediately offered the correct pronunciation. After going through the nonword phoneme by
phoneme, the investigator asked the participant to put the sounds together and say the whole
nonword. If the participant correctly pronounced the nonword, the investigator said, “That‟s
right” repeated the nonword and moved on. If the participant incorrectly pronounced the
nonword, the investigator said, “That‟s not quite right. It‟s „_________‟. Now you say it,” and
20
then moved on. In this way, for every nonword, both the participant and investigator said the
correct pronunciation once, which was also held constant in the word-supply condition.
The word-analysis exposure condition yielded a “sound out score”. Each time a
participant attempted to sound out a nonword, he or she could earn up to two possible points. To
earn the full two points, the participant had to correctly sound out the nonword on the first
attempt without help from the researcher. To earn one point, the participant had to correctly
sound out the nonword on the second attempt and/or after receiving help. No points were
awarded if the participant did not correctly sound out the nonword on the second attempt. There
was a total of 100 points possible: ten nonwords worth two points, each learned five times.
Higher scores indicated more accurate phonological recoding of the target nonwords.
In the word-supply condition, the investigator simultaneously showed the participant a
nonword and told him/her how to pronounce it. “This is a family of pretend water creatures.
They have funny names. I‟m going to show you and tell you their names. After I say it I want
you to say it too.” The investigator then showed the word and said, “This is „thomer‟. Now you
say it.” Participants went through the lists until they reached 5 trials (Ehri & Saltmarsh, 1995).
The order of nonwords in each list was randomized for each participant and for each of the 10
learning trials.
The word-supply exposure condition yielded a” repetition score”. Each time a participant
needed a nonword repeated an additional time, an extra point was added to his or her repetition
score. Repetitions were a result of inattention, poor hearing and poor articulation. There was no
cap on the repetition score. Higher scores indicated more repetitions.
The testing session took place approximately 3-5 days later. Participants were given two
spelling tests and two orthographic choice tasks, one for each of the nonword lists they learned

21
previously. The spelling test was given before its corresponding orthographic choice task for the
same list, and the tests were given in the same order as the order that the lists were learned, (e.g.
if the word-analysis list was learned first, followed by the word-supply list, then participants
were tested on the word-analysis list first and the word-supply list second).
22
RESULTS
Preliminary Analyses
With all alphas set at .05 and all analyses two-tailed, an independent-samples t-test was
conducted to check group comparability on verbal mental age. There was no significant
difference between the ID group and the TD group t (35) = .28, p = .78 (two tailed). This
indicates that groups were appropriately matched on verbal mental age. Box plot analysis was
used to examine outliers on the six dependent variables. There was one outlier on the word
supply orthographic choice measure. This value was adjusted to fit the boxplot limit.
Kolmogorov-Smirnov tests of normality indicated that all six distributions were normal (p‟s >
.11). There did appear to be one outlier based on number of days between the learning and
testing sessions. Analyses were run both with and without that participant‟s data, and because the
outlier did not influence the results, it was included in the analyses. One participant with ID was
also notably older than the other participants; however, his age was not a statistical outlier was
therefore included in the analyses. There appeared to be no bivariate outliers. See Tables 2 and 3
for descriptives.
As expected, Word-Attack and sound out scores were positively correlated for both the
ID group r =.85, n = 18, p <.001and for the TD group r =.82, n = 19, p <.001. Both Word-Attack
and sound out scores also were positively correlated with the four orthographic measures, with
all r‟s > .59, p‟s < .01.

23
The four dependent, orthographic measures all intercorrelated as well, all r‟s > .39, p‟s < .05,
with the exception of word-analysis orthographic choice and word-supply spelling in the TD
group, which was marginally significant, r =.43, p <.07. See Table 3 for correlations.
Surprisingly, there were no differences between groups on Word Attack, t (35) = 1.11,
p = .27, and there were no differences between groups on sound out scores, t (35) = 1.13, p = .27.
There was also no significant differences between groups on visual analysis skill, t (35) = 1.31, p
= .20. However, there was a difference between groups on the repetition scores, t (23.90) = 3.11,
p < .05; partial eta squared = .23.
Because there was a significant difference between groups on the repetition score,
independent samples t-tests were conducted to compare groups on both word-supply dependent
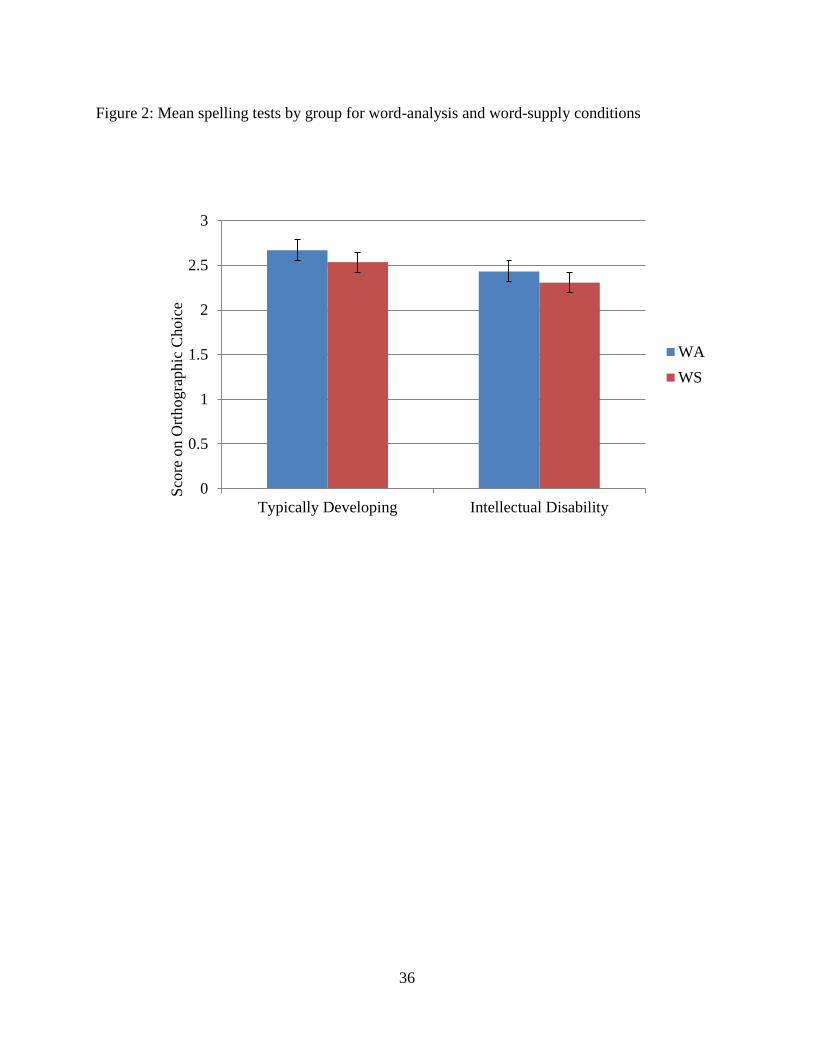
variables. On spelling there was a marginally significant difference in scores between the TD
group (M = 2.53, SD = .24) and the ID group M = 2.31, SD = .44; t (26.02) = 1.95, p =.06; partial
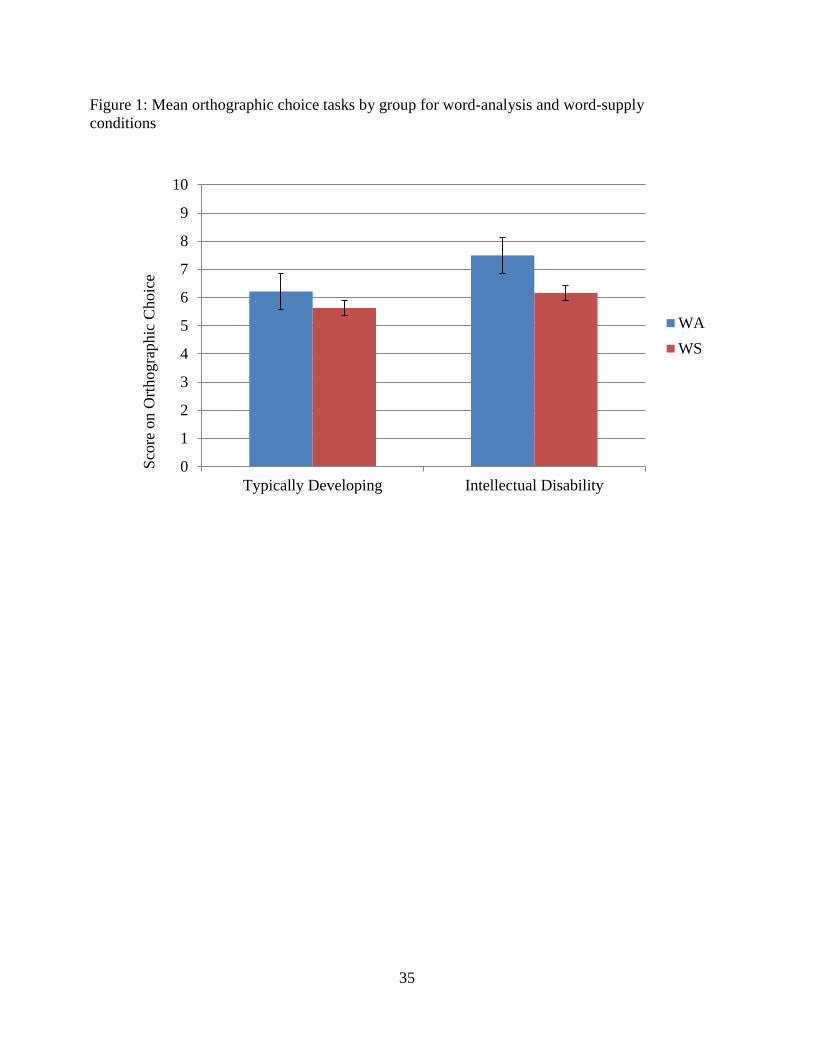
eta squared = .10. On orthographic choice there was no significant difference in scores between
the TD group (M = 5.63, SD = 2.01) and the ID group M = 6.17, SD = 2.85; t (35) = .66, p = .5;
partial eta squared =.01.
Independent samples t-tests were also conducted to compare groups on both
word-analysis dependent variables. On spelling there was a significant difference in scores
between the TD group (M = 2.67, SD = .19) and the ID group M = 2.43, SD = .41; t (23.73) =
2.23, p <.05; partial eta squared = .12. On orthographic choice there was a marginally significant
difference in scores between the TD group (M = 6.21, SD = 2.15) and the ID group M = 7.50, SD
= 2.09; t (35) = 1.85, p = .07; partial eta squared =.09.
24
Main Analyses
A 2 (Group) X 2 (Nonword Exposure Condition) mixed multivariate analysis of variance
was performed to investigate orthographic learning, with the dependent variables spelling and
orthographic choice. Preliminary tests showed no serious violations of the assumptions of
normality, linearity, homogeneity of variance-covariance matrices, or multicollinearity, and there
were no univariate or multivariate outliers. Order effect of condition was entered into the
equation, but did not have a significant impact and was therefore not included in the rest of the
analyses, F (2, 33) = .341, p =.71; Wilks‟ Lambda = .980.
There was a statistically significant effect of group on the combined dependent variables
F (2, 34) = 9.41, p < .05; Wilks‟ Lambda = .64; partial eta squared = .36. Within-group analyses
revealed a significant effect of nonword exposure condition F (2, 34) = 12.11, p < .001; Wilks‟
Lambda = .58; partial eta squared = .42. There was no group by nonword exposure condition
interaction F (2, 34) = .88, p = .43.
Between-groups univariate analyses revealed a significant difference between groups on
spelling, with the TD group performing significantly better than the ID group F (1, 35) = 4.78,
p < .05; partial eta squared = .12. There was no significant group difference, however, on
orthographic choice F (1, 35) = 1.78, p = .19; partial eta squared = .12.
Within-group univariate analyses supported the self-teaching hypothesis by revealing a
significant difference between nonword exposure conditions, with performance better in the
word-analysis condition than in the word-supply condition. This was true both for spelling,
F (1, 35) = 22.95, p < .001; partial eta squared = .40 and for orthographic choice,
F (1, 35) = 9.06, p < .05; partial eta squared = .21.
25
Paired-samples t-tests were conducted to evaluate whether each group individually
showed self-teaching on spelling and orthographic choice. For spelling, the ID group performed
significantly better in the word-analysis condition than in the word-supply condition,
t (17) = 3.17, p < .05; partial eta squared = .37. The ID group also showed self-teaching on the
orthographic choice measure, performing significantly better in the word-analysis condition than
in the word-supply condition, t (17) = 2.52, p < .05; partial eta squared = .27.
The TD Group also showed the self-teaching effect on the spelling measure, performing
significantly better in the word-analysis condition than in the word-supply condition,
t (18) = 3.62, p < .05, partial eta squared = .42. However, on the orthographic choice tasks,
while the TD group did perform slightly better in the word-analysis condition than in the word-
supply condition, the difference was not significant, t (18) = 1.60, p = .13.
Because the groups were not significantly different in phonological recoding ability,
measured by Word Attack and sound out scores, and were not significantly different on visual
analysis skill, these were not used as covariates in the analyses.
26
DISCUSSION
Self-teaching Hypothesis
The present study was designed to test the application of Jorm and Share‟s (1983) self-
teaching hypothesis to individuals with ID and verbal mental age-matched controls. This
hypothesis suggests that by sounding out words, individuals incidentally pick up on the
orthographic structure of those words, acquiring word-specific orthographic representations for
the phonologically recoded words. In the present study, self-teaching was indicated by
participants performing better in the word-analysis condition than in the word-supply condition.
By including a word-supply condition to contrast with the word-analysis condition, the
present study used a more stringent test of the self-teaching hypothesis for TD participants than
has been used in many previous self-teaching studies (Cunningham, 2002; Share, 1999; Share,
2004). While other studies often had participants sound out nonword targets and then tested
whether participants chose those nonword targets more often than other foils in a multiple choice
format, spelled them more accurately than other pseudohomophones, and named them faster than
other nonwords, it is unclear whether or not participants had actually been exposed to the
alternate foils they were to name and spell. The present study controlled for learning by exposure
by including a word-supply condition, in which participants were exposed to other nonword
targets, yet were not to sound them out.
27
Results showed a main effect of condition, with both groups performing significantly
better in word-analysis conditions than word-supply conditions. Results also indicated a main
effect of group, with the TD group performing significantly better than the ID group on spelling
measures. There was no significant group by condition interaction.
Based on previous studies‟ findings (see Conners, 2003 for a review), the ID group was
expected to perform worse than the TD group on measures of phonological recoding. However,
preliminary data analyses revealed that this was not the case. There were no group differences on
two separate measures of phonological recoding, Word Attack and sound out score. Further, the
groups were equivalent in verbal mental age, and there was no significant group difference on
visual analysis skill. This may have been because this study required participants to successfully
sound out two nonwords on the Word Attack to be eligible for the study. Any participants who
could not do so were not included in the study.
There were, however, significant differences between groups on the repetition score. In
the word-supply condition participants in the ID group needed more repetition of the nonword
targets than participants in the TD group to correctly pronounce the nonwords. This appeared to
be due to poorer articulation on the part of the participants with ID. Nevertheless, the ID
participants could have had an advantage over the TD participants in the word-supply condition
due to more exposure to the nonwords. However, there were no significant group differences on
either spelling or orthographic choice in the word supply condition. This could indicate that
repetition did not affect performance on the orthographic tasks. However, it is possible that if the
two groups had been limited to the same number of repetitions, the TD group would have
performed significantly better on word-supply measures. This, in turn could have resulted in a
smaller self-teaching effect in the TD group than in the ID group.
28
The present results do not support the compensatory processing hypothesis. This
hypothesis states that participants with ID have some kind of strength associated with
orthographic learning, such as a basic processing advantage in the visual domain or an acquired
processing style, to compensate for poor phonological recoding ability. For the present study,
this hypothesis predicted that participants with ID would perform worse than TD participants on
Word Attack and sound out score, but would compensate with a strength in orthographic
learning and perform equivalently or even better than the TD group on all the measures of
orthographic learning. Further, this strength in orthographic learning might be linked to visual
analysis. However, results of the study indicated that the groups were not significantly different
on phonological recoding measures, nor were they significantly different in visual analysis skill.
Because the groups were matched on phonological recoding, the revised compensatory
processing hypothesis would suggest that the ID group should perform even better on
orthographic learning measures. However, the ID group did not show significantly better
performance on orthographic measures. In fact, they performed significantly worse than the TD
group on spelling measures. Finally, the self-teaching effect was not significantly larger in the ID
group than in the TD group.
While previous research by Ehri and Saltmarsh (1995) seemed consistent with the
dissociation hypothesis, the present results do not support this hypothesis. The dissociation
hypothesis suggests that ID participants have a weakened link between phonological recoding
and orthographic learning. For the present study, this hypothesis predicted little difference
between word-supply and word-analysis conditions for participants with ID. It also suggested
that participants with ID could not acquire the same self-teaching effect as TD participants
without additional learning trials. However, the ID group performed significantly better in word-
29
analysis conditions than in word-supply conditions. Also, the number of trials was similar for
both groups in the word-analysis condition, and both groups showed orthographic learning.
The orthographic sensitivity hypothesis was also not supported by the present results.
This hypothesis suggests that after a critical volume of print experience, participants with ID
develop sensitivity to the orthography of words, leading to an acquired print-specific processing
skill. This hypothesis predicts that despite poor phonological recoding skills, participants with ID
have an advantage in orthographic processing. For the present study it predicted that participants
with ID would perform better than TD participants on both word-analysis and word-supply
orthographic learning measures. Although there was a trend in this direction for the orthographic
choice measure, this difference was nonsignificant and there was a significant difference in the
opposite direction for the spelling measure.
The self-teaching hypothesis was best supported by the present study‟s data. This
hypothesis suggests that phonological recoding leads to orthographic learning. The self-teaching
hypothesis predicted that, if participants with ID were poorer in phonological recoding ability,
they would be at a disadvantage in orthographic learning and therefore would show a smaller
difference between word-supply and word-analysis conditions. However, based on equivalent
phonological recoding abilities, the self-teaching hypothesis would predict that both groups
would show the same self-teaching effect, similarly performing better in word-analysis
conditions than in word-supply conditions. The results supported this hypothesis, with both
groups performing better in word-analysis than in word-supply conditions.
In addition to the self-teaching finding, multivariate analyses revealed an overall group
difference. Specifically, the TD group performed significantly better on spelling, but there were
no differences between groups on orthographic choice measures. The difference was primarily

30
carried by spelling in the word-analysis condition. This difference could have been the result of
the different cognitive loads that each task required. Orthographic choice was a recognition task,
while spelling involved recall and production. The spelling task, as a recall test, could have been
more taxing on working memory than the recognition-based orthographic choice task. The
spelling test required participants to listen to the word being repeated by the experimenter, hold
those sounds in memory, recall the nonword they learned previously, manipulate letters and
phonemes in their mind and write them all down.
Limitations and future directions
While the self-teaching hypothesis has previously been empirically tested for TD
individuals, this was the first demonstration of the self-teaching hypothesis in individuals with
ID. Now that self-teaching has emerged for list-learning, it would be an obvious and interesting
extension to see if it applies to paragraph reading. For the purposes of this study it made sense to
use nonwords in isolation, but it would be interesting to see how participants with ID would
perform if the nonwords had been embedded in paragraphs, as many self-teaching studies have
previously done (Bowey & Miller, 2007; Bowey & Muller, 2005; Cunningham, 2006; de Jong &
Share, 2007; Share, 1999; 2004; Share & Shalev, 2004).
Another interesting extension of this study would be to find out if orthographic learning
can aid in phonological recoding. The self-teaching hypothesis is direction specific, in that it
predicts that phonological recoding allows for orthographic learning. It would be interesting to
see if the direction could be reversed, and if orthographic processing could aid in phonological
learning. If, as the present study suggests, orthographic processing is a relative strength in ID,
and if orthographic processing could aid in phonological recoding, then it might help improve
overall reading abilities for children with ID.
31
For this first study, the mental age match design was used. Although this is a traditional
matching paradigm it has been criticized on several grounds. In future research a developmental
trajectory analysis (Thomas, Annaz, Ansari, Scerif, Jarrold, & Karmiloff-Smith, 2009) could
help explain how orthographic and phonological recoding skills compare over age between
individuals with ID and individuals with TD. Developmental trajectory analysis provides a
developmental perspective, detects atypical versus slow development, and helps avoid matching
issues, such as whether to match on chronological and/or mental age. It avoids the assumption
that the dependent variable develops at the same rate as the matching variable. Further, while the
traditional mental age match requires other variables to differ (e.g. chronological age), the
developmental trajectory allows for multiple matches. For example, in the present study the ID
group was significantly older than the TD group, had more years in school, and more print
exposure. A developmental trajectory study that accounted for experience could be very
informative.
Further, it would be beneficial to take into account the types of reading instruction and
spelling tests that different classrooms use, to see if there are differences between groups that
could be attributed to different learning environments. It would also be interesting to see if a
larger sample size would produce a significant interaction.
The self-teaching hypothesis suggests that phonological recoding may have a double
benefit: participants are able to sound out and gain orthographic processing at the same time. If
orthographic processing is in fact a relative strength in ID, one way to capitalize on this strength
would be to work on phonological recoding. According to the present study, increased phonics
instruction for participants with ID would aid in both orthographic learning and overall reading
skills.
32
Table 1: List of all nonword targets used in the present study and their phonetic spellings
begrid - bǝgrɪd
blayer - bleɚ
bodule – baʤul
cainot – kenat
caleng – kælɪŋ
chager – ʧegɚ
dormen – dɔrmɪn
drunet – drunɛt
fering – fɛrɪŋ
foamus – fomǝs
goblen – gablɪn
hyrald – haɪrǝld
lareny – lɛrɪni
logren – lagrɪn
manely – menli
mauton – matɪn
nagred – nǝgrɪd
petory – pɛtɔri
pimsel – pɪmsǝl
prased – prezd
primet – prɪmɪt
ramine – rǝmin
rapley - ræpli
sarone – sǝron
sarted - sartɪd
sartil - sartɪl
shread – ʃrɛd
siftlet - sɪftlɪt
snigel - snɪgǝl
surtel - sɝtǝl
swaner - swenɚ
tasmer - tæzmɚ
thaber - ɵebɚ
thager - ɵegɚ
thomer - ɵomɚ
trames - tremz
triwen - traɪwɪn
vartle - vartǝl
weraly - wɛrǝli
yulper - jʌlpɚ
33
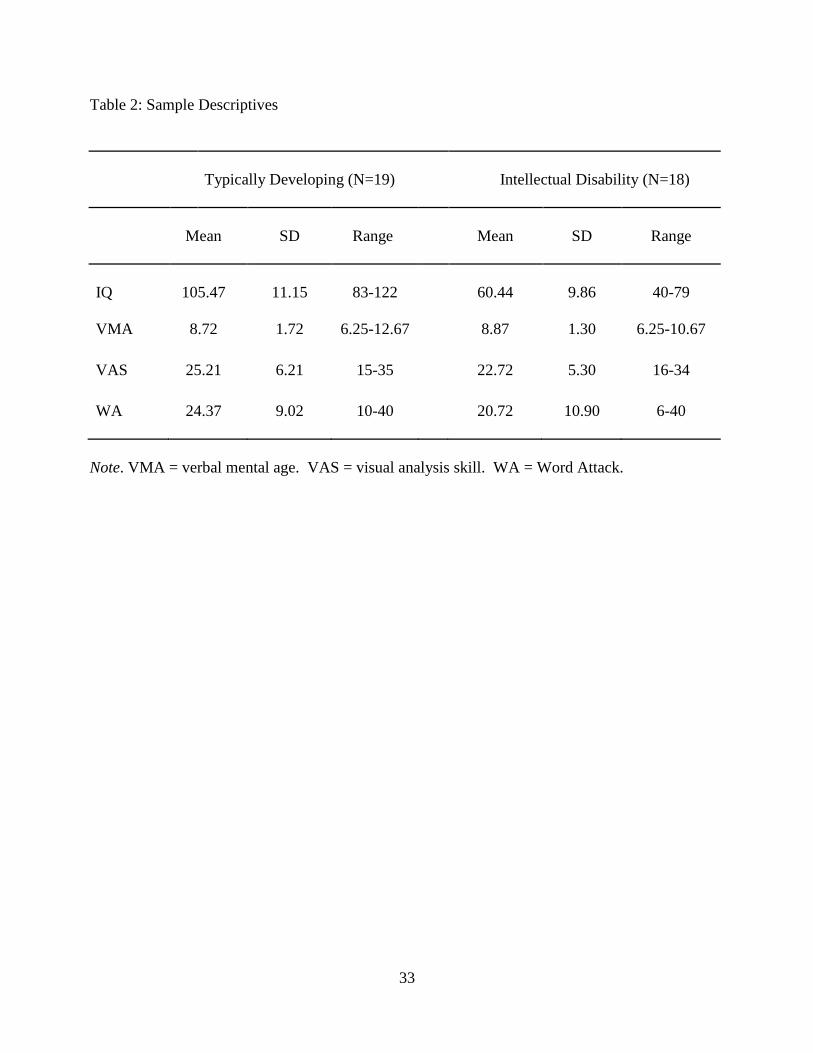
Table 2: Sample Descriptives
Typically Developing (N=19)
Intellectual Disability (N=18)
Mean
SD
Range
Mean
SD
Range
IQ
105.47
11.15
83-122
60.44
9.86
40-79
VMA 8.72 1.72 6.25-12.67 8.87 1.30 6.25-10.67
VAS 25.21 6.21 15-35 22.72 5.30 16-34
WA 24.37 9.02 10-40 20.72 10.90 6-40
Note. VMA = verbal mental age. VAS = visual analysis skill. WA = Word Attack.

34
Table 3: Dependent Variable Descriptives
Typically Developing (N=19)
Intellectual Disability (N=18)
Mean
SD
Range
Mean
SD
Range
SOS
73.84
14.76
43-95
67.33
20.14
26-97
REP 1.37 1.21 0-4 3.44 2.57 0-8
WAorth 6.21 2.15 2-10 7.50 2.09 3-10
WSorth 5.63 2.01 2-9 6.17 2.85 1-10
WAspell 2.67 .19 2.28-2.96 2.43 .41 1.65-3.00
WSspell 2.53 .24 2.02-2.91 2.31 .44 1.45-2.96
Note. SOS = sound out score. REP = repetition score. WAorth = word-analysis
orthographic choice task. WSorth = word-supply orthographic choice task. WAspell =
word-analysis spelling test. WSspell = word-supply spelling test.
35
Sco
re o
n O
rtho
gra
phic
Choic
e
0
1
2
3
4
5
6
7
8
9
10
Typically Developing Intellectual Disability
WA
WS
Figure 1: Mean orthographic choice tasks by group for word-analysis and word-supply
conditions
36
0
0.5
1
1.5
2
2.5
3
Typically Developing Intellectual Disability
WA
WS
Figure 2: Mean spelling tests by group for word-analysis and word-supply conditions
Sco
re o
n O
rthogra
phic
Choic
e
37
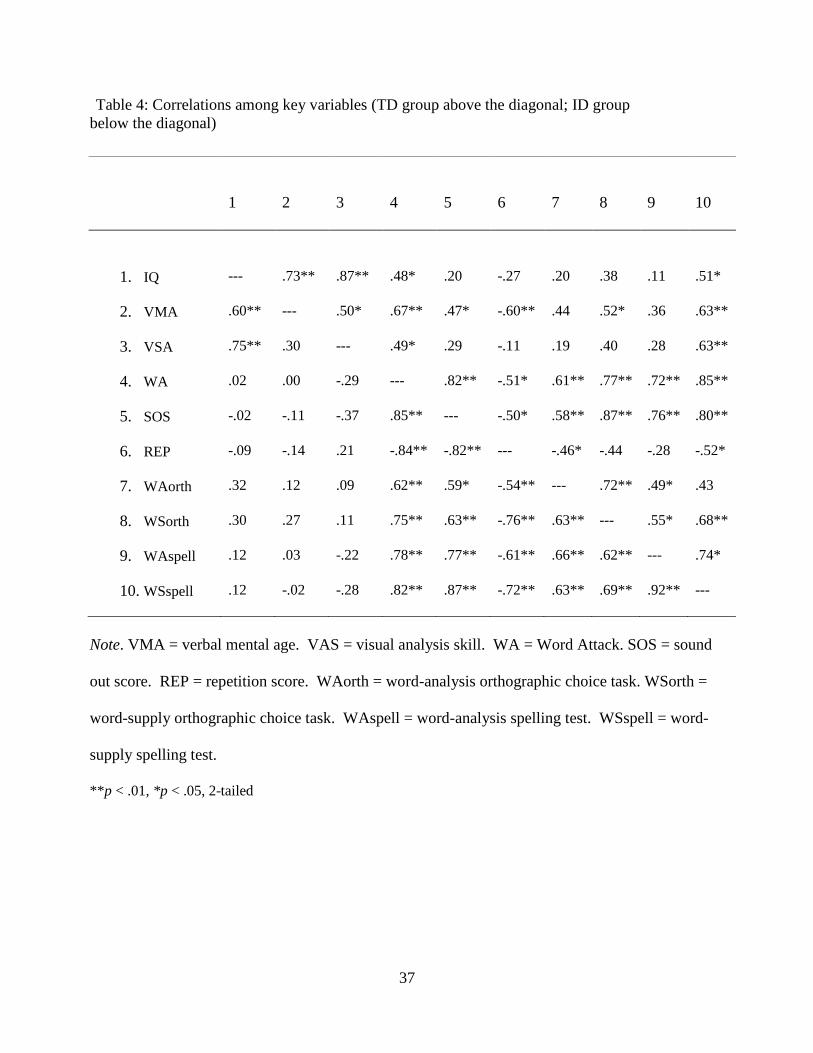
Table 4: Correlations among key variables (TD group above the diagonal; ID group
below the diagonal)
Note. VMA = verbal mental age. VAS = visual analysis skill. WA = Word Attack. SOS = sound
out score. REP = repetition score. WAorth = word-analysis orthographic choice task. WSorth =
word-supply orthographic choice task. WAspell = word-analysis spelling test. WSspell = word-
supply spelling test.
**p < .01, *p < .05, 2-tailed
1 2 3 4 5 6 7 8 9 10
1. IQ --- .73** .87** .48* .20 -.27 .20 .38 .11 .51*
2. VMA .60** --- .50* .67** .47* -.60** .44 .52* .36 .63**
3. VSA .75** .30 --- .49* .29 -.11 .19 .40 .28 .63**
4. WA .02 .00 -.29 --- .82** -.51* .61** .77** .72** .85**
5. SOS -.02 -.11 -.37 .85** --- -.50* .58** .87** .76** .80**
6. REP -.09 -.14 .21 -.84** -.82** --- -.46* -.44 -.28 -.52*
7. WAorth .32 .12 .09 .62** .59* -.54** --- .72** .49* .43
8. WSorth .30 .27 .11 .75** .63** -.76** .63** --- .55* .68**
9. WAspell .12 .03 -.22 .78** .77** -.61** .66** .62** --- .74*
10. WSspell .12 -.02 -.28 .82** .87** -.72** .63** .69** .92** ---

38
REFERENCES
Blake, K. A., Aaron, I. E., & Westbrook, H. R. (1969). Learning of basal reading skills by
mentally handicapped and non-mentally handicapped children. Journal of Research and
Development in Education, 2(2), 2-123.
Bos, C. S., & Tiernery, R. J. (1980). Inferential reading abilities of mildly mentally retarded and
nonretarded students. American Journal of Mental Deficiency, 89, 75-82.
Bowey, J. A. & Miller, R. (2007). Correlates of orthographic learning in third-grade children‟s
silent reading. Journal of Research in Reading, 30, 115-128.
Bowey, J. A. & Muller, D. (2005). Phonological recoding and rapid orthographic learning in
third-graders‟ silent reading: A critical test of the self-teaching hypothesis. Journal of
Experimental Child Psychology, 92, 203-219.
Cawley, J. F., & Parmar, R. S. (1995). Comparisons in reading and reading-related tasks among
students with average intellectual disability and students with mild mental retardation.
Education and Training in Mental Retardation and Developmental Disabilities, 30, 118-
129.
Conners, F. A. (2003). Reading skills and cognitive abilities of individuals with mental
retardation. International Review of Research in Mental Retardation, 27, 191-229.
Conners, F. A., Loveall, S. J., Moore, M. S., Hume, L. E., & Maddox, C. D. (2011). An
individual difference analysis of the self-teaching hypothesis. Journal of Experimental
Child Psychology, 108, 402-410.
Conners, F. A., Rosenquist, C. J., Sligh, A. C., Atwell, J. A., & Kiser, T. (2006). Phonological
reading skills acquisition by children with mental retardation. Research in Developmental
Disabilities, 27, 121-137.
Cunningham, A. E. (2006). Accounting for children‟s orthographic learning while reading test:
Do children self-teach? Journal of Experimental Child Psychology, 95, 56-77.
Cunningham, A. E., Perry, K. E., Stanovich, K. E., & Share, D. L. (2002). Orthographic learning
during reading: examining the role of self-teaching. Journal of Experimental Child
Psychology, 82, 185-199.
De Jong, P. F., & Share, D. L. (2007). Orthographic learning during oral and silent reading.
Scientific Studies of Reading, 11, 55-71.
39
Ehri, L. C., & Saltmarsh, J. (1995). Beginning readers outperform older disabled readers in
learning to read words by sight. Reading and Writing: An Interdisciplinary Journal, 7,
295-326.
Gickling, E. E., Hargis, C. H., & Alexander, D. R. (1981). The function of imagery in sight-word
recognition among retarded and nonretarded children. Education and Training of the
Mentally Retarded, 16, 259-262.
Jenkinson, J. C. (1992). The use of letter position cues in the visual processing of words by
children with an intellectual disability and nondisabled children. International Journal of
Disability, Development, and Education, 39, 61-76.
Jorm, A. F., & Share, D. L. (1983). Phonological recoding and reading acquisition. Applied
Psycholinguistics, 4, 103-147.
Kaufman, A. S., & Kaufman, N. L. (2004). Kaufman Brief Intelligence Test, Second Edition
Manual.Circle Pines: AGS Publishing.
Kyte, C. S. & Johnson, C. J. (2006). The role of phonological recoding in orthographic learning.
Journal of Experimental Child Psychology, 93, 166-185.
Laing, E., Hulme, C., Grant, J., & Karmiloff-Smith, A. (2001). Learning to read in Williams
Syndrome: Looking beneath the surface of atypical reading development. Journal of
Child Psychology and Psychiatry, 42, 729-739
Levitt, E. (1970). The effect of context on the reading of mentally retarded and normal children
at the first grade level. Journal of Special Education, 4, 70-78.
Levitt, E. (1972). Higher-order and lower-order reading responses of mentally retarded and
nonretarded children at the first-grade level. American Journal of Mental Deficiency, 77,
13-20.
Massaro, D. W., Taylor, G. A., Venezsky, R. L., Jastrzembski, J. E., & Lucas, P. A. (1980).
Letter and word perception: Orthographic structure and visual processing in reading.
Amsterdam: North-Holland.
Masterson, J., & Apel, K. (in press). The Spelling Sensitivity Score: Noting developmental
changes in spelling knowledge. Assessment for Effective Intervention.
Meyer, L. A. (1982). The relative effects of word-analysis and word-supply correction
procedures with poor readers during word-attack training. Reading Research Quarterly,
17, 544-555.
Nagle, R. J. (1993). The relationship between the WAIS-R and academic achievement among
EMR adolescents. Psychology in the Schools, 30, 37-39.
40
Nation, K., Angell, P., & Castles, A. (2006). Orthographic learning via self-teaching in children
learning to read English: Effects of exposure, durability, and context. Journal of
Experimental Child Psychology, 96, 71-84.
Neville, D., & Vandever, T. R. (1973). Decoding as a result of synthetic and analytic
presentation for retarded and nonretarded children. American Journal of Mental
Deficiency, 77, 533-537.
Ouellette, G., & Fraser, J. R. (2009). What exactly is a yait anyway: The role of semantics in
orthographic learning. Journal of Experimental Child Psychology, 104, 239-251.
PCPID (2004). A charge we have to keep: A road map to personal and economic freedom for
people with intellectual disabilities in the 21st century. Report of the President's
Committee for People with Intellectual Disability. Available at
http://www.acf.hhs.gov/programs/pcpid/docs/mr_2004_final.pdf
Reitsma, P. (1983). Word-specific knowledge in beginning reading. Journal of Research in
Reading, 6, 41-56.
Rose, T. L., McEntire, E., & Dowdy, C. (1982). Effects of two error-correction procedures on
oral reading. Learning Disability Quarterly, 5, 100-105.
Rosenberg, M. S. (1986) Error-correction during oral reading: A comparison of three techniques,
Learning Disability Quarterly, 9, 182-192.
Share, D. L. (1995). Phonological recoding and self-teaching: sine qua non of reading
acquisition. Cognition, 55, 151-218.
Share, D. L. (1999). Phonological recoding and orthographic learning: A direct test of the self-
teaching hypothesis. Journal of Experimental Child Psychology, 72, 95-129.
Share, D. L. (2004). Orthographic learning at a glance: On the time course and developmental
onset of self-teaching. Journal of Experimental Child Psychology, 87, 267-298.
Share, D. L. (2008). On the anglocentricities of current reading research and practice: The perils
of overreliance on an “outlier” orthography. Psychological Bulletin, 134, 584-615.
Share, D. L. & Shalev, C. (2004). Self-teaching in normal and disabled readers. Reading and
Writing: An Interdisciplinary Journal, 17, 769-800.
Sheperd, D. G. (1967). Selected factors in the reading ability of EMR boys. American Journal of
Mental Deficiency, 71, 563-570.
Siegel, L. S., Share, D. L., & Geva, E. (1995). Dyslexics have orthographic skills that are
superior to normal readers. Psychological Science, 6, 250-254.
41
Singh, J., & Singh, N. N. (1985). Comparison of word-supply and word-analysis error-correction
procedures on oral reading by mentally retarded children. American Journal of Mental
Deficiency, 90, 64-70.
Snow, C. E., Burns, M. S., & Griffin, P. (1998). Preventing reading difficulties in young
children. Washington, DC: National Academy Press.
Stanovich, K. E., & Siegel, L. S. (1994). Phenotypic performance profile for children with
reading disabilities: A regression-based test of the phonological-core variable-difference
model. Journal of Educational Psychology, 86, 24-53.
Thomas, M. S. C., Annaz, D., Ansari, D., Scerif, G., Jarrold, C., & Karmiloff-Smith, A. (2009).
Using developmental trajectories to understand developmental disorders. Journal of
Speech, Language, and Hearing Research, 52, 336-358.
Wagner, R. K., & Torgesen, J. K. (1987). The nature of phonological processing and its causal
role in the acquisition of reading skills. Psychological Bulletin, 101, 192-212.
Wood, T. A., Buckhalt, J. A., & Tomlin, J. G. (1988). A comparison of listening and reading
performance with children in three educational placements. Journal of Learning
Disabilities, 21, 493-496.
Woodcock, R. W. (1998). Woodcock Reading Mastery Tests - Revised Examiner's Manual.
Minneapolis, MN: NCS Pearson, Inc.