Embed Size (px)
Citation preview
NONTHERMAL PROCESSING OF MILK
By
LUZ DANIELA BERMÚDEZ
A dissertation submitted in partial fulfillment of the requirements for the degree of
DOCTOR OF PHILOSOPHY (Engineering Science)
WASHINGTON STATE UNIVERSITY Department of Biological Systems Engineering
MAY 2008
ii
To the Faculty of Washington State University:
The members of the Committee appointed to examine the dissertation/thesis of
LUZ DANIELA BERMÚDEZ find it satisfactory and recommend that it be accepted.
___________________________________
Chair
___________________________________
___________________________________
___________________________________
iii
ACKNOWLEDGEMENTS
I would like to express my gratitude to my advisor, Dr. Gustavo V. Barbosa-Cánovas for
giving me the chance to participate in his projects, which has allowed me to grow
professionally, and for his patience and advice during these four years. My gratitude also
goes to my committee members, Dr. Barry G. Swanson, Dr. Juming Tang and Dr. Ralph
Cavalieri, for their time, enthusiasm and interest in this research project.
I would like to thank Dr. Kees Versteeg and Dr. Raymond Mawson (Food Science
Australia) and Dr. Maria G. Corradini (University of Massachusetts) for their comments
and suggestions during this research. In addition, I greatly appreciate the financial
support from US Army Natick during the Pulsed Electric Fields research.
Indeed, this dissertation could not be possible without the very valuable help of all the
administrative and technical staff from Biological Systems Engineering at WSU, the staff
from the Francheschi Microscopy and Imaging Center, Frank Younce at the Pilot Plant,
Jeannie Bagby and Sharon Himsl.
I would like to thank my former professors and great friends Maru Bárcenas, Fidel
Vergara, José Angel Guerrero-Beltrán, Pedro and Monserrat Wesche for being as my
second family. I also express my gratitude to my friends in Pullman: Thank you for
sharing your life with me for the last four years. I am still learning many things from all
of you, and you have made my life very nice.

iv
My heartfelt gratitude to my mother, who understands that sometimes dreams are far
away from home, for her unwavering support and encouragement.
Finally, I wish to express my deepest gratitude to my former advisor and professor, Dr.
Jorge Welti-Chanes. Thank you for your friendship, steadfast support and advice,
patience, and enthusiasm. You always have been a great example of a good researcher for
me and you have shown me how to enjoy each project and research task.
v
NONTHERMAL PROCESSING OF MILK
Abstract
by Luz Daniela Bermúdez, Ph.D. Washington State University
May 2008
Chair: Gustavo V. Barbosa-Cánovas
Low frequency ultrasound at different intensities (24 kHz, 400 W, 120 μm) plus
heat (63ºC) was used to inactivate Listeria innocua in milk; the most intense treatment
was useful to pasteurization standards in shorter times. Inactivation kinetics did not
follow a first order model; Weibullian and four parameters model better fitted survivor
curves. Composition and physicochemical parameters of milk changed after sonication,
but are still within reported ranges for processed milk; e.g., protein content remained at
3%. Butter fat content was shown to be an important hurdle in cell inactivation with
ultrasound, as lower fat content resulted in faster and higher inactivation. Microscopy
studies performed with Transmission (TEM) and Scanning Electron Microscopy (SEM)
revealed that cell inactivation with ultrasound is caused by disruption of the cell
membrane, pore formation and break-down of cells. With SEM fat globules showed
smaller size (<1μm) after sonication, producing a whiter milk color and a more
homogenized and stable product matrix. Yogurt was processed with thermo-sonicated
milk, showing more compact structure with minor syneresis problems; microwave energy
was successfully used as a catalyst during long-term sample preparation for SEM,
reducing the required time.
vi
Pulsed electric fields (PEF) was used to inactivate spores of Bacillus cereus in
milk; processing conditions ranged from 0 to 240 pulses (2.5 μs), 20 to 40 kV/cm; room
temperature to 65ºC; recirculation/refrigeration systems and nisin (10 and 50 IU/ml) were
used selectively to reduce spore load in whole and skim milk. Spores showed resistance
to temperature, PEF and the presence of antimicrobials. After 40 kV/cm, 65ºC, 140
pulses (2.5 μs) 3.5 log reduction of spores were achieved. During processing, electrode
fouling was observed to generate arcing problems because of the presence of milk
deposits and bubble formation; the milk layer in the electrode was composed mainly of
protein, significantly reducing this milk component. Studies in strawberry flavored milk
and model systems using PEF were conducted to study the stability of coloring agent
Allura Red. HPLC showed the behavior of this dye, which has better stability when
combined with other additives and it is present in high concentrations in model systems.
vii
TABLE OF CONTENTS
ACKNOWLEDGEMENTS……………………………………………………………....iii
ABSTRACT……………………………………………………………………………….v
LIST OF TABLES………………………………………………………………………xxi
LIST OF FIGURES…………………………………………………………………..xxviii
INTRODUCTION……………………………………………………………………….40
CHAPTER ONE…………………………………………………………………………43
Thermal and nonthermal pasteurization of milk: a review
1. Introduction……………………………………………………………………...43
2. Pasteurization……………………………………………………………………45
2.1 Basic theory………………………………………………………………….45
2.2 Pasteurization process……………………………………………………….47
2.3 Vat pasteurization……………………………………………………………50
2.4 HTST pasteurization…………………………………………………………51
2.5 UHT pasteurization/sterilization……………………………………………..52
3. Nonthermal technologies………………………………………………………...55
3.1 Ultrasound …………………………………………………………………..56
3.1.1 Basic concepts of ultrasound technology…………………………….56
3.1.2 Power ultrasound…………………………………………………….56
3.1.3 Pasteurization of milk with power ultrasound……………………….57
viii
3.1.4 Enzymes……………………………………………………………...60
3.1.5 Nutritional properties………………………………………………...62
a) Proteins
b) Vitamins and minerals
3.1.6 Physicochemical characteristics……………………………………...64
a) Viscosity
b) Density
c) pH
d) Color
3.1.7 Processing of dairy products with ultrasound technology…………...68
3.1.7.1 Milk………………………………………………………………..68
a) Milk as beverage
b) Lactose free milk
c) Human milk
3.1.7.2 Yogurt……………………………………………………………..71
3.1.7.3 Cheese……………………………………………………………..73
3.1.8 Other uses of power ultrasound in the dairy industry………………..75
3.2 Pulsed electric fields: basic concepts………………………………………...76
3.2.1 Pasteurization of milk with Pulsed Electric Fields…………………..78
3.2.2 Enzymes……………………………………………………………...79
3.2.3 Nutritional properties………………………………………………...80
4. Final remarks…………………………………………………………………….81
References……………………………………………………………………………82

ix
Tables and figures……………………………………………………………………95
CHAPTER TWO……………………………………………………………………….102
Modeling the inactivation of Listeria innocua in raw whole milk when treated by thermo-
sonication
Abstract…………………………………………………………………………………102
1. Introduction……………………………………………………………………..103
2. Materials and methods………………………………………………………….107
2.1 Milk samples………………………………………………………………..107
2.2 Microbiological analysis……………...………………..…………………...108
2.2.1 Growth and inoculum of Listeria innocua cells….………………108
2.2.2 Enumeration of Listeria and mesophilic bacteria……..………….108
2.3 Thermal and thermo-sonication treatments……………...………………….109
2.3.1 Thermal treatment………………………………………………...109
2.3.2 Thermo-sonication treatments……………………………………109
2.4 Physicochemical characteristics……………………………………………...110
2.4.1 pH and titratable acidity …………………………………………110
2.4.2 Color…….………………………………………………………..110
2.5 Modeling and statistical analysis…………………………………………….111
3. Results and discussion………………………………………………………….112
3.1 Microbial inactivation………………………………………………………..112
3.2 Modeling……………………………………………………………………..114
x
3.2.1 First model: Weibull distribution…………………………………115
3.2.2 Four-parameter model……………………………………117
3.3 Physicochemical characteristics……………………..……………………….118
4. Conclusions…………………………………………………………………….120
References………………………………………………………………………………120
Tables and figures………………………………………………………………………127
CHAPTER THREE…………………………………………………………………….137
Composition properties, physicochemical characteristics and shelf-life of whole milk
after thermal and thermo-sonication treatments
Abstract…………………………………………………………………………………137
1. Introduction……………………………………………………………………..138
2. Materials and methods………………………………………………………….140
2.1 Milk samples………………………………………………………………..140
2.2 Thermo-sonication treatments……………………………………...............140
2.3 Proximal analysis…………………………………………………...............140
2.4 Microbiological analysis……………………………………………………141
2.5 Physicochemical analysis…………………………………………………...141
2.5.1 pH and titratable acidity ………………………………….141
2.5.2 Density and freezing point………………………………..142
2.5.3 Color ……………………………………………………..142
2.5.4 Storage life…………………….…………………………..143
xi
2.7 Statistical analysis....………………………………………………………..143
3. Results and discussion………………………………………………………….144
3.1 Proximal analysis……………………………………………………….144
3.1.1 Protein content……………………………………………144
3.1.2 Fat content………………………………………………...145
3.1.3 Added water………………………………………………145
3.1.4 Solids Non-Fat (SNF)…………………………………….146
3.2 Physicochemical properties……………………………………….........147
3.2.1 pH, acidity, density and freezing point…………………...147
3.2.2 Color……………………………………………………...148
3.3 Storage life……………………………………………………….……..150
3.3.1 Microbiological aspects…………………………………..150
3.3.2 pH and lactic acid content………………………………..152
3.3.3 Color……………………………………………………...153
3.3.3.1 Net change in color
3.3.3.2 Hue angle (h*)
3.3.3.3 Chroma/saturation index (C*)
4. Conclusions…………………………………………………………………156
References………………………………………………………………………………157
Tables and figures………………………………………………………………………163
xii
CHAPTER FOUR………………………………………………………………………174
Study of the mechanism of inactivation of Listeria innocua cells in whole milk under
thermo-sonication treatments using Scanning Electron Microscopy and Transmission
Electron Microscopy
Abstract…………………………………………………………………………………174
1. Introduction………………...……………………………………………….176
2. Materials and methods……………………………………………………...180
2.1 Listeria innocua cells……………………………………………….180
2.2 Milk samples………………………………………………………..180
2.3 Thermal and thermo-sonication treatments………………………...180
2.3.1 Ultrasound equipment……………………………….……180
2.3.2 Thermal treatment…………………………………….…..181
2.4 Sample preparation for electron microscopy……………………….181
2.4.1 Method with organic solvents …………………………...182
2.4.2 Freeze-Drying (FD) method……………………………...183
2.5 Scanning electron microscopy (SEM)……………………………...183
2.6 Transmission Electron Microscopy (TEM)………………………...183
3. Results and discussion……………………………………………………….184
3.1 SEM with HMDS dehydration……………………………………...184
3.2 Thermal treatment…………………………………………………..185
3.3 Thermo-sonication treatment……………………………………….186
3.4 SEM freeze drying………………………………………………….188
3.5 TEM………………………………………………………………...190
xiii
3.6 Possible mechanism of inactivation of cells under thermo-sonication
treatments…………………………………………………………………...192
4. Conclusions…………………………………………………………………..193
References………………………………………………………………………………194
Figures………………………………………………………………………………….197
CHAPTER FIVE……………………………………………………………………….210
Microstructure of fat globules in whole milk after thermo-sonication treatment
Abstract…………………………………………………………………………………210
1. Introduction…………..……………………………………………………..212
2. Materials and methods…………..………………………………………….214
2.1 Milk samples………………………………………………………..214
2.2 Thermal and thermo-sonication treatments………………………...215
2.2.1 Ultrasound equipment…………………………………….215
2.2.2 Heat treatment…………………………………………….215
2.3 Scanning electron microscopy……………………………………...216
2.3.1 Sample preparation
2.4 Color………………………………………………………………..217
2.5 Fat content……..……………………………………………………217
2.6 Statistical analysis…………………………………………………..218
3. Results and discussion……………………………………………………...218
3.1 Microstructure of milk: fat globules………………………………..218
xiv
3.2 Net Color Change and Fat Content…………...…………………….224
4. Conclusions…………………………………………………………………..225
References………………………………………………………………………………225
Tables and figures………………………………………………………………………233
CHAPTER SIX…………………………………………………………………………241
Study of butter fat content in milk on the inactivation of Listeria innocua ATCC 51742
by thermo-sonication
Abstract…………………………………………………………………………………241
1. Introduction……………………………………………………………………..242
2. Materials and methods………………………………………………………….244
2.1 Milk samples………………………………………………………..244
2.2 Listeria innocua analysis…………………………………………...244
2.2.1 Growth of Listeria innocua cells………………………....244
2.2.2 Enumeration of Listeria and mesophilic bacteria………...245
2.3 Thermo-sonication treatments……………………………………...245
2.4 Proximal analysis…………………………………………………..246
2.5 Physicochemical characteristics……………………………………246
2.5.1 pH and titratable acidity …………………………………246
2.5.2 Density and freezing point……………………………….247
2.5.3 Color……………………………………………………..247
2.5.4 Shelf-life studies…………………………………………………247
xv
2.7 Statistical analysis………………………………………………….248
3. Results and discussion………………………………………………………….248
3.1 Inactivation rate of Listeria innocua……………………………….248
3.2 Proximal analysis…………………………………………………..251
3.2.1 Butter fat content and protein……………………………251
3.2.2 Solids-non-fat……………………………………………252
3.3 Physical-chemistry characteristics………………………………….253
3.3.1 pH and acidity…………………………………………….253
3.3.2 Density …………………………………………………...254
3.3.3 Freezing point…………………………………………….255
3.3.4 Color…………….………………………………………..255
3.4 Shelf-life……………………………………………………………256
3.4.1 Total plate count………………………………………….257
3.4.2 pH…………………………………………………………257
3.4.3 Color……………………………………………………...259
4. Conclusion…..…………………………………………………………………...260
References………………………………………………………………………………260
Tables and figures………………………………………………………………………267
CHAPTER SEVEN…………………………………………………………………….283
Evaluation of the microstructure of thermo-sonicated yogurt with Scanning Electron
Microscopy using a shorter (new) sample preparation procedure
xvi
Abstract…………………………………………………………………………………283
1. Introduction……………………………………………………………………..285
2. Materials and methods………………………………………………………….286
2.1 Milk and yogurt samples……………………………………………286
2.2 Milk pasteurization…………………………………………………287
Thermo-sonication of milk…………………………………………287
2.3 Yogurt preparation………………………………………………….287
2.4 Microscopy studies…………………………………………………288
2.4.1 Sample preparation…………………………………………...228
2.4.1.1 HMDS dehydration……………………………………..288
2.4.1.2 Freeze-drying…………………………………………...289
2.4.1.3 Microwave dehydration………………………………...290
3. Results and discussion…………………………………………………….........291
3.1 HMDS dehydration…………………………………………………291
3.2 Freeze-drying……………………………………………………….292
3.3 Microwave dehydration…………………………………………….292
4. Conclusions……………………………………………………………………..295
References………………………………………………………………………………295
Figures…………………………………………………………………………………..298
xvii
CHAPTER EIGHT……………………………………………………………………..301
Inactivation of Bacillus cereus spores in milk using Pulsed Electric Fields-Enhanced
Thermal Pasteurization and nisin as a natural antimicrobial
Abstract…………………………………………………………………………………301
1. Introduction……………………………………………………………………..303
2. Materials and methods………………………………………………………….305
2.1 Milk samples………………………………………………………..305
2.2 Microbiological analysis……………………………………………305
2.2.1 Growth and inoculum of Bacillus cereus spores…………305
2.2.2 Enumeration of mesophilic bacteria and Bacillus cereus
spores……………………………………………………………….305
2.3 Nisin ………………………………………………………………..306
2.4 Pulsed electric field treatment………………………………………306
2.4.1 Experiments without recirculation/refrigeration cycles…..307
2.4.2 Experiments without recirculation/refrigeration cycles…..307
2.5 Thermal treatment…………………………………………………..308
3. Results and discussion………………………………………………………….308
4. Conclusions…………………………………………………………………….314
References………………………………………………………………………………314
Tables and figures………………………………………………………………………319
xviii
CHAPTER NINE……………………………………………………………………….327
Electrodepositing of Milk Materials during Pulsed Electric Fields Processing
Abstract…………………………………………………………………………………327
1. Introduction……………………………………………………………………..329
2. Materials and methods………………………………………………………….331
2.1 Samples……………………………………………………………. 331
2.2 PEF processing……………………………………………………...331
2.3 LactiCheckTM milk analyzer………………………………………..332
2.4 Color………………………………………………………………..332
2.5 pH and titratable acidity ……………………………………………333
2.6 Protein assay………………………………………………………..333
2.7 Statistical analysis…………………………………………………..334
3. Results and discussion………………………………………………………….335
3.1 Physicochemical and composition parameters of milk after PEF
processing…………………………………………………………………..335
3.2 Protein analysis……………………………………………………..337
4. Conclusions……………………………………………………………………..339
References………………………………………………………………………………339
Tables and figures………………………………………………………………………344
xix
CHAPTER TEN………………………………………………………………………...349
Determination of Allura Red (Red # 40) by Reverse-Phase High-Performance Liquid
Chromatography (RP-HPLC) and physicochemical changes in strawberry flavored milk
under Pulsed Electric Field Processing
Abstract…………………………………………………………………………………349
1. Introduction……………………………………………………………………..351
2. Materials and methods………………………………………………………….353
2.1 Milk samples and model systems…………………………………..353
2.2 Pulsed electric fields treatment……………………………………..354
2.3 Microbiological analysis……………………………………………355
2.4 pH …………………………………………………………………..355
2.5 Color………………………………………………………………..355
2.6 High Performance Liquid Chromatography (HPLC) analysis……...356
2.6.1 Materials …………………………………………………356
2.6.2 Allura Red Extraction…………………………………….356
2.6.3 Chromatographic conditions……………………………...357
2.7 Storage life………………………………………………………….357
3. Results and discussion………………………………………………………….358
3.1 pH …………………………………………………………………..358
3.2 Color………………………………………………………………..358
3.2.1 Net change of color……………………………………….360
3.2.2 Hue angle (h*)…………………………………………….360
3.2.3 Chroma (C*)………………………………………………361
xx
3.3 Microbiological counts……………………………………………..361
3.4 Concentration of Allura Red………………………………………..362
4. Conclusions……………………………………………………………………..364
References………………………………………………………………………………364
Tables and figures………………………………………………………………………367
CONCLUSIONS……………………………………………………………………….379
FUTURE RESEARCH…………………………………………………………………382
xxi
LIST OF TABLES
CHAPTER ONE
1. Heat resistance of selected microorganisms……..........................................................95
2. Standard time-temperature combinations for pasteurization processes……………….96
3. Inactivation of microorganisms by ultrasound in milk and buffer solutions………….97
4. Physicochemical properties of milk…………………………………………………...98
5. Microbial inactivation in milk and dairy products under PEF…………..…………….99
CHAPTER TWO
1. Inactivation of mesophilic bacteria in raw whole milk with thermal and thermo-
sonication treatments…………………………………………………………………...127
2. Parameters of the Weibull equation fitted to thermal inactivation and thermo-
sonication treatments for Listeria innocua in raw whole milk…………………………128
3. Parameters of the Sigmoid or four parameter model (equation 4) fitted to thermal
inactivation and thermo-sonication treatments of different intensity for Listeria innocua
in raw whole milk…………………………....................................................................129
4. Physical-chemical characteristics of milk samples before and after thermal and thermo-
sonication treatments…………………………………………………………………...130
xxii
CHAPTER THREE
1. Proximal analysis of raw milk, heat pasteurized milk and thermo-sonicated pasteurized
milk……………………………………………………………………………………..163
2. Physicochemical characteristics of raw milk, heat pasteurized milk and thermo-
sonicated pasteurized milk……………………………………………………………...164
CHAPTER FIVE
1. Color parameters, net change of color and fat content of raw whole milk, thermally
treated and thermo-sonicated milk……………………………………………………...233
CHAPTER SIX
1. Nutritional attributes reported and measured for four different butter fat content UHT
milk samples before and after thermal and thermo-sonication treatments……………..267
2. Physicochemical characteristics of different butter fat content milk samples (fat free,
1%, 2% and whole) before and after thermo-sonication (TS) treatments (63ºC, 120 μm by
30 min)……………………………….............................................................................268
CHAPTER NINE
1. Physicochemical and composition parameters of raw whole milk and PEF processed
milk……………………………………………………………………………………..344
xxiii
2. Color parameters and color functions of raw and PEF processed milk……………...345
CHAPTER TEN
1. List of ingredients and codification of samples used for the experiment....................367
2. Gradient program for HPLC analysis and determination of Allura Red in strawberry
flavored milk samples…………………………………………………………………..368
xxviii
LIST OF FIGURES
CHAPTER ONE
1. Color parameters (L, a, b) in raw, thermal treated and sonicated milk at different
intensities. L and a were significantly different from each other; b was not significantly
different…………………………………………………………………………………100
2. Dielectric rupture theory, E = electrical field strength, Ec = critical electrical field
strength………………………………………………………………………………….101
CHAPTER TWO
1. Inactivation of Listeria innocua in raw whole milk under thermal and thermo-
sonication treatments…………………………………………………………………...131
2. Weibull distribution fitted to thermal treatment survivor curve……………………..132
3. Four parameter model fitted to thermo-sonicated survivor data at 30% of amplitude
wave…………………………………………………………………………………….133
4. Weibull distribution fitted to survivor curve of thermo-sonication at 60% of amplitude
wave…………………………………………………………………………………….134
5. Weibull distribution fitted to survivor curve of thermo-sonication at 90% of amplitude
wave……………………………………………………………………………………135
6. Weibull distribution fitted to survivor curve of thermo-sonication at 100% of
amplitude wave…………………………………………………………………………136
xxix
CHAPTER THREE
1. Luminosity (L*) of Raw Milk (RM), Heat Pasteurized Milk (TT), and Thermo-
sonicated Milk at different ultrasound intensities (30%, 60%, 90% and 100%) during
storage…………………………………………………………………………………..165
2. The a* value of Raw Milk (RM), Heat Pasteurized Milk (TT), and Thermo-sonicated
milk at different ultrasound intensities (30%, 60%, 90% and 100%) during
storage…………………………………………………………………………………..166
3. The b* value of Raw Milk (RM), Heat Pasteurized Milk (TT), and Thermo-sonicated
milk at different ultrasound intensities (30%, 60%, 90% and 100%) during
storage…………………………………………………………………………………..167
4. Mesophilic growth behavior of Raw Milk (RM), Heat Pasteurized Milk (TT), and
Thermo-sonicated milk during storage at 4ºC, at different intensities (30%, 60%, 90%
and 100%)………………………………………………………………………………168
5. The pH behavior of Raw Milk (RM), Heat Pasteurized Milk (TT), and Thermo-
sonicated Milk at different amplitude intensities (30%, 60%, 90% and 100%) during
storage…………………………………………………………………………………..169
6. Lactic acid content (%) Of Raw Milk (RM), Heat Pasteurized Milk (TT), and Thermo-
sonicated milk at different amplitude intensities (30%, 60%, 90% and 100%) during
storage………………………………………………………………………………….170
7. Net Change of Color of Raw Milk (RM), Heat Pasteurized Milk (TT), and Thermo-
sonicated milk at different ultrasound intensities (30%, 60%, 90% and 100%) during
storage using raw milk color at time zero as control…………………………………...171
xxx
8. Hue Angle of Raw Milk (RM), Heat Pasteurized Milk (TT), and Thermo-sonicated
milk at different ultrasound intensities (30%, 60%, 90% and 100%) during
storage…………………………………………………………………………………..172
9. Chroma/Saturation index of Raw Milk (RM), Heat Pasteurized Milk (TT), and
Thermo-sonicated milk at different ultrasound intensities (30%, 60%, 90% and 100%)
during storage…………………………………………………………………………...173
CHAPTER FOUR
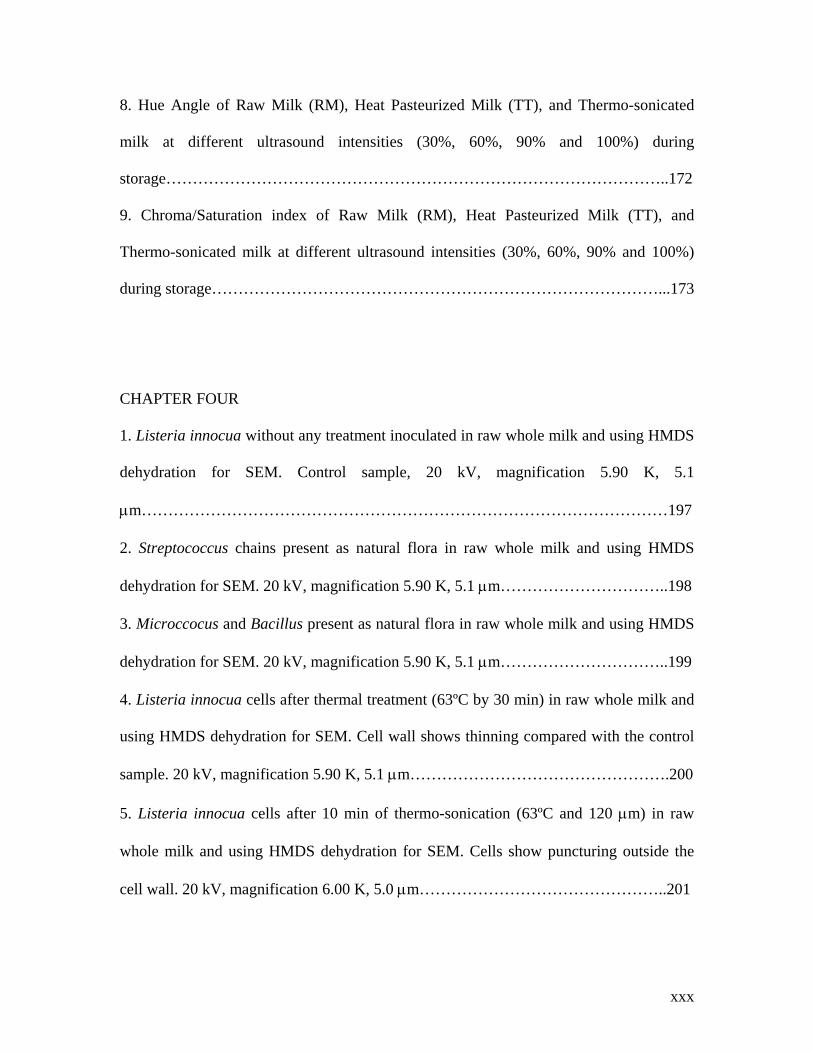
1. Listeria innocua without any treatment inoculated in raw whole milk and using HMDS
dehydration for SEM. Control sample, 20 kV, magnification 5.90 K, 5.1
μm………………………………………………………………………………………197
2. Streptococcus chains present as natural flora in raw whole milk and using HMDS
dehydration for SEM. 20 kV, magnification 5.90 K, 5.1 μm…………………………..198
3. Microccocus and Bacillus present as natural flora in raw whole milk and using HMDS
dehydration for SEM. 20 kV, magnification 5.90 K, 5.1 μm…………………………..199
4. Listeria innocua cells after thermal treatment (63ºC by 30 min) in raw whole milk and
using HMDS dehydration for SEM. Cell wall shows thinning compared with the control
sample. 20 kV, magnification 5.90 K, 5.1 μm………………………………………….200
5. Listeria innocua cells after 10 min of thermo-sonication (63ºC and 120 μm) in raw
whole milk and using HMDS dehydration for SEM. Cells show puncturing outside the
cell wall. 20 kV, magnification 6.00 K, 5.0 μm………………………………………..201
xxxi
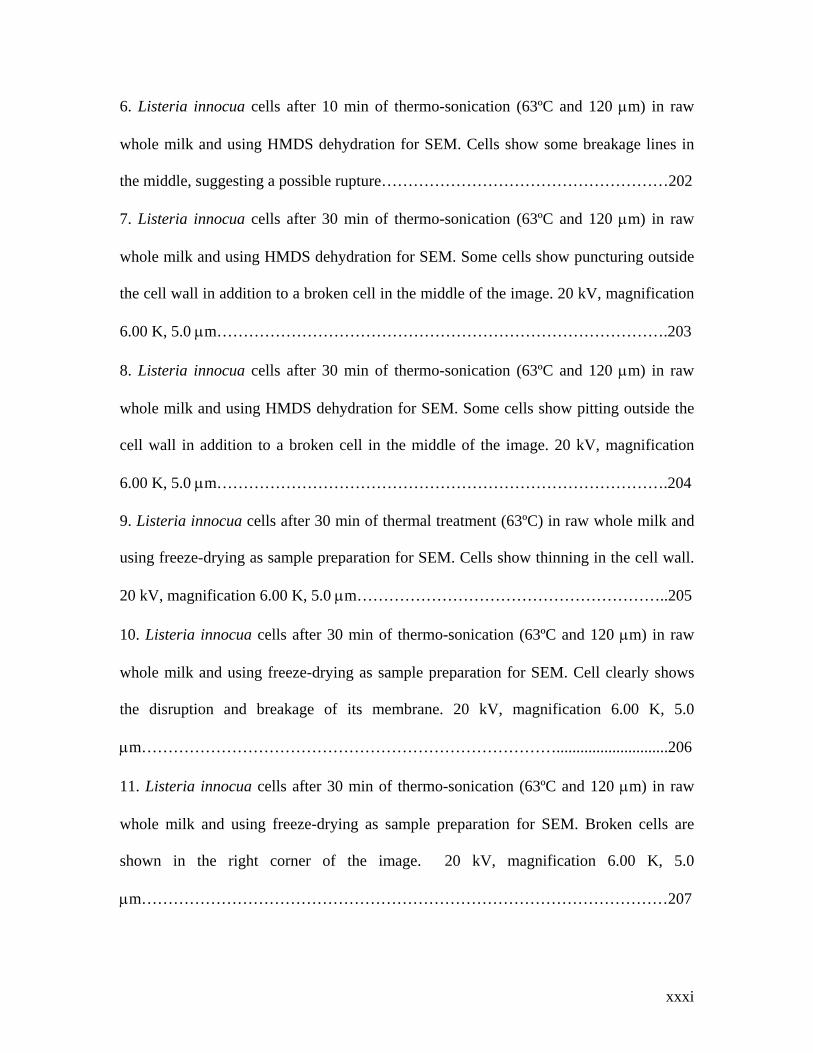
6. Listeria innocua cells after 10 min of thermo-sonication (63ºC and 120 μm) in raw
whole milk and using HMDS dehydration for SEM. Cells show some breakage lines in
the middle, suggesting a possible rupture………………………………………………202
7. Listeria innocua cells after 30 min of thermo-sonication (63ºC and 120 μm) in raw
whole milk and using HMDS dehydration for SEM. Some cells show puncturing outside
the cell wall in addition to a broken cell in the middle of the image. 20 kV, magnification
6.00 K, 5.0 μm………………………………………………………………………….203
8. Listeria innocua cells after 30 min of thermo-sonication (63ºC and 120 μm) in raw
whole milk and using HMDS dehydration for SEM. Some cells show pitting outside the
cell wall in addition to a broken cell in the middle of the image. 20 kV, magnification
6.00 K, 5.0 μm………………………………………………………………………….204
9. Listeria innocua cells after 30 min of thermal treatment (63ºC) in raw whole milk and
using freeze-drying as sample preparation for SEM. Cells show thinning in the cell wall.
20 kV, magnification 6.00 K, 5.0 μm…………………………………………………..205
10. Listeria innocua cells after 30 min of thermo-sonication (63ºC and 120 μm) in raw
whole milk and using freeze-drying as sample preparation for SEM. Cell clearly shows
the disruption and breakage of its membrane. 20 kV, magnification 6.00 K, 5.0
μm……………………………………………………………………............................206
11. Listeria innocua cells after 30 min of thermo-sonication (63ºC and 120 μm) in raw
whole milk and using freeze-drying as sample preparation for SEM. Broken cells are
shown in the right corner of the image. 20 kV, magnification 6.00 K, 5.0
μm………………………………………………………………………………………207
xxxii
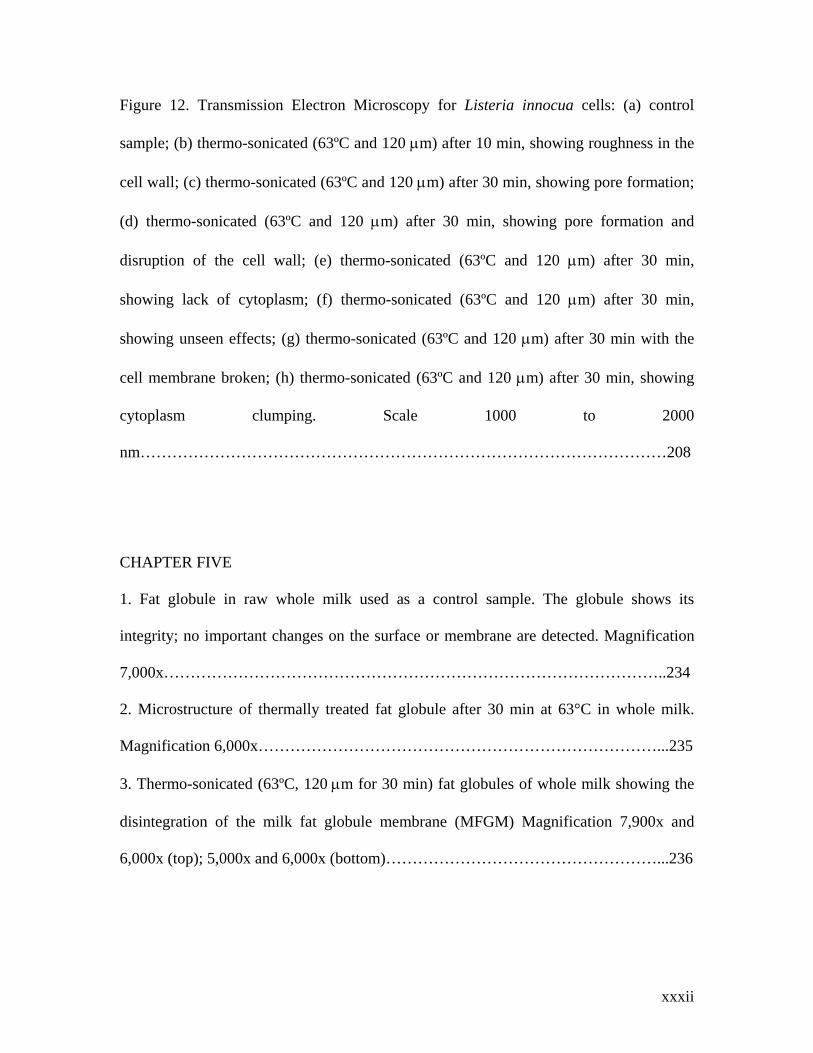
Figure 12. Transmission Electron Microscopy for Listeria innocua cells: (a) control
sample; (b) thermo-sonicated (63ºC and 120 μm) after 10 min, showing roughness in the
cell wall; (c) thermo-sonicated (63ºC and 120 μm) after 30 min, showing pore formation;
(d) thermo-sonicated (63ºC and 120 μm) after 30 min, showing pore formation and
disruption of the cell wall; (e) thermo-sonicated (63ºC and 120 μm) after 30 min,
showing lack of cytoplasm; (f) thermo-sonicated (63ºC and 120 μm) after 30 min,
showing unseen effects; (g) thermo-sonicated (63ºC and 120 μm) after 30 min with the
cell membrane broken; (h) thermo-sonicated (63ºC and 120 μm) after 30 min, showing
cytoplasm clumping. Scale 1000 to 2000
nm………………………………………………………………………………………208
CHAPTER FIVE
1. Fat globule in raw whole milk used as a control sample. The globule shows its
integrity; no important changes on the surface or membrane are detected. Magnification
7,000x…………………………………………………………………………………..234
2. Microstructure of thermally treated fat globule after 30 min at 63°C in whole milk.
Magnification 6,000x…………………………………………………………………...235
3. Thermo-sonicated (63ºC, 120 μm for 30 min) fat globules of whole milk showing the
disintegration of the milk fat globule membrane (MFGM) Magnification 7,900x and
6,000x (top); 5,000x and 6,000x (bottom)……………………………………………...236
xxxiii
4. Graphic representation of the changes in the MFGM in a fat globule after
homogenization (top) and general microstructure of milk after homogenization
(bottom)…………………………………………………………………………………237
5. Thermo-sonicated (63ºC, 120 μm for 30 min) fat globules in whole milk showing the
presence of casein micelles added to the main structure. Magnification 10,000x and
8,000x…………………………………………………………………………………...238
6. Microstructure of fat content in thermo-sonicated (63ºC, 120 μm for 30 min) showing
size reduction in fat globules and the presence of thousands of casein micelles.
Magnification 7,100x…………………………………………………………………...239
7. A comparison of the microstructure of fat globules after three different treatments
using Scanning Electron Microscopy (SEM): a) Thermally treated (63ºC) fat globule
structure, b) thermo-sonicated (63ºC, 120 μm) fat globule structure after 10 min of
treatment and c) thermo-sonicated (63ºC, 120 μm) fat globule after 30 min of treatment
in whole milk. Magnification a) 5,900x, b) 5,900x, c) 6,000x………………………...240
CHAPTER SIX
1. Inactivation of Listeria innocua ATCC 51742 using thermo-sonication treatments
(63ºC, 120 μm by 30 min) in four different butter fat content milks…...........................269
2. L value of different butter fat content milk samples (fat free, 1%, 2% and whole)
before (control) and after thermo-sonication (TS) treatments (63ºC, 120 μm by 30
min)……………………………………………………………………………………..270
xxxiv
3. a value of different butter fat content milk samples (fat free, 1%, 2% and whole) before
(control) and after thermo-sonication (TS) treatments (63ºC, 120 μm by 30
min)……………………………………………………………………………………..271
4. b value of different butter fat content milk samples (fat free, 1%, 2% and whole) before
(control) and after thermo-sonication (TS) treatments (63ºC, 120 μm by 30
min)……………………………………………………………………………………..272
5. Growth of mesophilic bacteria in milk with different butter fat content (fat free, 1%,
2% and whole) in control (C) and thermo-sonicated (TS) samples (63ºC, 120 μm by 30
min) stored under refrigerated conditions (4ºC)………………………………………..273
6. Growth of mesophilic bacteria in milk with different butter fat content (fat free, 1%,
2% and whole) in control (C) and thermo-sonicated (TS) samples (63ºC, 120 μm by 30
min) stored under ambient temperature (21ºC)…………………………………………274
7. pH evolution during storage life of thermo-sonicated (TS) and control (C) milk
samples with different butter fat content (fat free, 1%, 2%, and whole) under refrigerated
conditions (4ºC)………………………………………………………………………...275
8. pH evolution of thermo-sonicated (TS) and control (C) milk samples with different
butter fat content (fat free, 1%, 2%, and whole) during storage life under ambient
temperature (21ºC) conditions………………………………………………………….276
9. L value evolution during the storage life of thermo-sonicated (TS) and control (C) milk
samples with different butter fat content (fat free, 1%, 2%, and whole) under refrigerated
conditions (4ºC)………………………………………………………………………...277
xxxv
10. a value evolution during the storage life of thermo-sonicated (TS) and control (C)
milk samples with different butter fat content (fat free, 1%, 2%, and whole) under
refrigerated conditions (4ºC)……………………………………………………………278
11. b value evolution during the storage life of thermo-sonicated (TS) and control (C)
milk samples with different butter fat content (fat free, 1%, 2%, and whole) under
refrigerated conditions (4ºC)……………………………………………………………279
12. L value for thermo-sonicated (TS) and control (C) milk samples with different butter
fat content (fat free, 1%, 2%, and whole) during the storage life under ambient
temperature (21ºC) conditions………………………………………………………….280
13. a value for thermo-sonicated (TS) and control (C) milk samples with different butter
fat content (fat free, 1%, 2%, and whole) during the storage life under ambient
temperature (21ºC) conditions………………………………………………………….281
14. b value for thermo-sonicated (TS) and control (C) milk samples with different butter
fat content (fat free, 1%, 2%, and whole) during the storage life under ambient
temperature (21ºC) conditions………………………………………………………….282
CHAPTER SEVEN
1. Microstructure of commercial yogurt using HMDS as sample preparation technique
(top); microstructure of commercial yogurt using microwave dehydration as sample
preparation technique (bottom). In all the pictures the protein and fat structure can be
observed………………………………………………………………………………...298
xxxvi
2. Microstructure of thermo-sonicated yogurt using HMDS for sample preparation
technique showing clusters of yogurt in a more compact structure……………….........299
3. Microstructure of thermo-sonicated yogurt using microwave dehydration for sample
preparation, showing these images the internal composition and structure of this dairy
product, lactose crystals, protein structures and fat globules modified in their structure
because of the sonication……………………………………………………………….300
CHAPTER EIGHT
1. Inactivation of Bacillus cereus spores in skim milk using pulsed electric fields of 35
and 40 kV/cm without refrigeration (top); temperature profile for the same experiment
(bottom)………………………………………………………………............................319
2. Inactivation of Bacillus cereus spores in skim milk using pulsed electric fields of 35
and 40 kV/cm plus 40ºC as mild thermal treatment (top); temperature profile for the same
experiment (bottom)…………………………………………………………………….320
3. Inactivation of Bacillus cereus spores in skim milk using pulsed electric fields of 35
and 40 kV/cm plus 50ºC as thermal treatment (top); temperature profile for the same
experiment (bottom)…………………………………………………….........................321
4. Inactivation of Bacillus cereus spores in skim milk thermal treatments at 45ºC, 55ºC,
65ºC and 75ºC (top); temperature profile for the same experiment
(bottom)…………………………………………………………………………………322
xxxvii
5. Inactivation of Bacillus cereus spores in skim milk using pulsed electric fields of 30
and 40 kV/cm plus 55ºC as thermal treatment (top); temperature profile for the same
experiment (bottom)…………………………………………………………………….323
6. Inactivation of Bacillus cereus spores in skim and whole milk using pulsed electric
fields of 40 kV/cm plus 55ºC as thermal treatment (top); temperature profile for the same
experiment (bottom)…………………………………………………………………….324
7. Inactivation of Bacillus cereus spores in skim and whole milk using pulsed electric
fields of 30 and 40 kV/cm plus 65ºC as thermal treatment (top); temperature profile for
the same experiment (bottom)………………………………………………………….325
8. Inactivation of Bacillus cereus spores in skim (SM) and whole milk (WM) using
pulsed electric fields of 40 kV/cm plus 65ºC as thermal treatment and Low Concentration
(LC) of nisin (10 IU/ml) and High Concentration (HC) of nisin (50 IU/ml) (top);
temperature profile for the same experiment (bottom)…………………………………326
CHAPTER NINE
1. Standard curve of Bovine Serum Albumin…………………………………………..346
2. a) Fouling of the electrode after processing raw whole milk using PEF at 40 kV/cm,
240 pulses of 2.5 μs and 50ºC; b) Erosion of the stainless steel electrode after processing
using the above mentioned conditions of PEF treatment……………………………….347
3. Total protein content in milk, raw milk, PEF milk and the electrodeposited
material…………………………………………………………………………………348
xxxviii
CHAPTER TEN
1. Chemical structure of Allura Red (Red #40) with chemical name disodium (5Z) -5-[(2-
methoxy – 5 – methyl-4-sulfonatophenyl) hydrazinylidene] – 6 – oxonaphthalene -2-
sulfonate………………………………………………………………………………...369
2. Inlet and outlet temperatures of commercial flavored strawberry milk samples (N, L)
and the model systems (M1, M2) during the Pulsed Electric Fields processing
treatment………………………………………………………………………………..370
3. pH behavior during storage (4ºC) of untreated (C) and PEF treated (P) samples of
commercial strawberry flavored milk (N, L) and model systems (M1, M2)…………...371
4. a* color parameter for samples during storage (4ºC) of untreated (C) and PEF treated
(P) samples of commercial strawberry flavored milk (N, L) and model systems (M1,
M2)……………………………………………………………………………………...372
5. Net change of color (ΔE) for samples during storage (4ºC) for samples of commercial
strawberry flavored milk (N, L) and model systems (M1, M2)………………………...373
6. Hue angle for samples during storage (4ºC) of untreated (C) and PEF treated (P)
samples of commercial strawberry flavored milk (N, L) and model systems (M1,
M2)……………………………………………………………………………………...374
7. Chroma or saturation index for samples during storage (4ºC) of untreated (C) and PEF
treated (P) samples of commercial strawberry flavored milk (N, L) and model systems
(M1, M2)…………………………………………………………..................................375
8. Microbial growth for samples during storage (4ºC) of untreated (C) and PEF treated
(P) samples of commercial strawberry flavored milk (N, L) and model systems (M1,
M2)……………………………………………………………………………………...376
xxxix
9. Allura Red Concentration (mg/mL) for samples during storage (4ºC) of untreated (C)
and PEF treated (P) samples of commercial strawberry flavored milk (N, L) and model
systems (M1, M2)………………………………………………………………………377
40
INTRODUCTION
The search for new alternatives for pasteurizing and processing milk has led food
scientists and technologists to use preservation and processing factors other than heat in
order to ensure microbiological safety and to preserve quality characteristics of the food.
Most of the so-called nonthermal technologies are still undergoing research, with
encouraging results in many aspects. This dissertation deals with two of these emerging
technologies, the use of ultrasound and pulsed electric fields to pasteurize and process
milk.
Chapter One represents a review of state-of-the-art ultrasound and pulsed electric fields
technologies focused in milk pasteurization and the processing of dairy products such as
cheese and yogurt. The first part of this chapter assesses the basic theory of thermal
pasteurization, with the different processing variables of this method showing why the
use of heat has been used for years in the food industry to inactivate microorganisms.
Chapter Two presents inactivation studies of Listeria innocua as a surrogate for a
pathogenic microorganism in raw milk using the combination of mild thermal treatment
with different ultrasound intensities. The use of mathematical models to describe a non-
first-order kinetic of inactivation curves is addressed in this chapter. Composition and
physicochemical characteristics of thermo-sonicated milk with similar processing
conditions used during inactivation experiments are studied in Chapter Three.
41
Chapter Four presents some of the first studies of the possible mechanism of cell
inactivation because of the use of ultrasound. Transmission and Scanning Electron
Microscopy were used as a tool to analyze Listeria cell structure after sonication,
showing the disruption of the cell membrane, breakdown of cells and formation of pores
outside the cell wall.
Chapter Five deals with the structure of milk after thermo-sonication. Scanning Electron
Microscopy was useful to highlight changes, mainly in the fat globules structure, that
take place from the beginning to the end of the treatment with ultrasound. Smaller size,
rugged surface and disruption of the milk lipid globule membrane were found in the
images of sonicated fat globules.
Chapter Six represents the inactivation studies of the same surrogate microorganisms, but
using milk with different butter fat content, showing the obstacle that this component
represents for microbial inactivation, along with some of the physicochemical changes
and the shelf-life of milk after sonication.
With the acquired knowledge from the previous chapters, the processing of yogurt with
thermo-sonicated milk is shown in Chapter Seven; the study was also extended to provide
a comprehensive analysis of the microstructure of this yogurt using Scanning Electron
Microscopy, while at the same time developing an innovative and faster sample
preparation method for microscopy using microwave energy.
42
Chapter Eight shows the different combinations of electric field strengths, number of
pulses, temperature, kind of milk and presence or absence of nisin as an antimicrobial
factor in the inactivation of Bacillus cereus spores. Even with the most severe processing
conditions, spores were not totally inactivated in milk.
During previous spore inactivation studies, fouling of the electrode and arcing problems
were observed through pulsed electric fields processing, so Chapter Nine represents a
detailed study of milk composition and the components of the milk deposited into the
electrode after using the equipment under strong conditions to inactivate spores.
Finally, Chapter Ten shows the influence of pulsed electric fields during the processing
of strawberry flavored milk and the stability of this product and its coloring agent (Allura
Red) during storage. High Performance Liquid Chromatography was used to assess the
dye behavior during the experiments.
43
CHAPTER ONE
THERMAL AND NONTHERMAL PASTEURIZATION OF MILK:
A REVIEW
Daniela Bermúdez-Aguirre and Gustavo V. Barbosa-Cánovas
1. Introduction
Conventional methods of pasteurizing milk involve the use of elevated temperatures
regardless of treatment (batch, HTST or UHT pasteurization), and the quality of the milk
is affected because of the use of high temperatures. Consequences of thermal treatment
include a decrease in nutritional properties such as vitamins or denaturation of proteins,
and sometimes the flavor of milk is undesirably changed. These changes are produced
simultaneously that the goal of the pasteurization processed is achieved, which is to have
a microbiologically safe product free of pathogenic bacteria and to reduce the load of
deteriorative microorganisms and enzymes, resulting in a product with a longer storage
life.
During the processing of dairy products, milk must be pasteurized under specific
conditions to achieve the ideal characteristics of flavor, color, or texture for the final
product such as yogurt, cheese or ice cream, while at the same time maintaining the
microbiological limits established for these products.
Currently, food science and technology is providing new alternatives for
processing food with the aim of have fresh-like characteristics and reduce the decrease of
quality attributes, while at the same time producing a safe and stable product with low
cost and availability for consumers. One of these emerging technologies is ultrasound
44
(the use of ultrasonic waves applied to the food as an alternative to traditional thermal
treatment) to inactivate microorganisms and enzymes while producing fewer changes in
the product. Ultrasound technology is not new in food processing; this technology is
widely used, for example, in quality control when the range of high frequency of
ultrasound is used, this being a non-destructive technique. However, the use of ultrasound
at low frequencies to promote cell disruption and chemical reactions is now under study,
with many favorable results.
Another nonthermal technology that is studied in milk is Pulsed Electric Fields
(PEF) in which contact between the food and the electrical discharges between electrodes
allows reduction of the microbial and enzymatic activity in milk in microseconds with
important energy and money savings. Treatment of some pathogenic bacteria and
enzymes by PEF has been tested in milk with successful results, while studies related to
spore inactivation or in quality aspects such as nutritional characteristics or stability of
other dairy products under this technology are ongoing.
This chapter includes a summary of pasteurization technologies beginning with
the three commercially used time-temperature thermal processing technologies followed
by two sections in which nonthermal technologies for processing milk are discussed. The
nonthermal technologies that will be discussed are the use of ultrasound at low frequency
and also the so-called “power ultrasound.” A brief review of current progress in the
processing of some dairy products such as sonicated cheese and sonicated yogurt will
also be included, remarking on the advantages and potential of this technology for the
dairy industry. The second part will include discussion of state-of-art of the Pulsed
45
Electric Fields technology used in milk, the target pathogens tested in milk, as well as
enzymes and other milk related studies with PEF.
2. Pasteurization
2.1 Basic theory
Pasteurization is a thermal process applied to different foods with the goal of destroying
target non-spore pathogenic microorganisms (vegetative cells) such as Salmonella,
Coxiella burnetti, Escherichia coli, Listeria monocytogenes, or Mycobacterium
tuberculosis. Pasteurization extends the shelf-life of the product by reducing the initial
load of microorganisms (deteriorative) and inactivating key enzymes that could
deteriorate the quality of the food.
After pasteurization, some viable microorganisms remain in the product. These
microorganisms are thermoduric and thermophilic bacteria, and represent the
deteriorative genre of organisms. Thermoduric bacteria resist high temperatures, while
thermophilic bacteria need high temperature for optimal growth. Examples of
thermoduric bacteria are some species of Streptococcus and Lactobacillus; examples of
thermophilic bacteria are species of Bacillus and Clostridium (Jay, 1992). The presence
of these microorganisms is responsible for the spoilage of milk even under refrigeration.
Lactobacillus produce an increase of lactic acid in milk during storage, decreasing the pH
of milk and resulting in spoilage. Other heat resistant microorganisms and enzymes are
related to the proteolysis of milk during storage, generating undesirable changes in flavor,
taste and consistency. In other products such as juices, mayonnaise or mustard, spoilage
is related to other deteriorative microorganisms such as yeasts and molds; pasteurization
46
is an adequate method to inactivate or reduce the counts of these groups of non-
pathogenic bacteria. Generally, pasteurized products are stored under refrigerated
conditions to extend their freshness; shelf-life is limited to a few weeks (generally up to
two weeks), but freshness will depend on several factors, for example the quality of the
raw material, Good Manufacturing Practices after pasteurization, handling, transportation
and storage conditions, among others.
Some commercial and commonly pasteurized foods include milk, liquid eggs,
shell eggs, beer, wine, fruit and vegetables juices, ciders, vinegars, meat products such as
ham, oysters, honey, mustard, mayonnaise, water, and sous-vide and chilled foods. Many
more pasteurized products are consumed that are restricted to specific geographic areas
around the world.
The final microbiological quality of a food will depend on the initial quality of the
raw ingredients; for example, in the case of milk, in some industrialized nations raw milk
has an initial microbial load close to 103 cfu/ml; after pasteurization, which requires at
least a 5 log reduction of the bacterial load to fulfill legal and sanitary regulations, the
microbial quality of pasteurized milk will be excellent, because the counts of mesophilic
bacteria will probably be smaller than can be detected with conventional and standard
microbiological assays, and pathogenic bacteria will not be present in the product.
According to standards in the United States, Grade A raw milk may not exceed 300,000
cfu/ml, and in the European Community the bacterial count should be smaller than
100,000 cfu/ml. In the United States, milk after pasteurization should contain less than
20,000 cfu/ml (Jensen et al., 1995). Nevertheless, in sub-developed countries the initial
count of mesophilic bacteria is sometimes as high as 105 or 106 cfu/ml, and although the
47
inactivation of high loads of microorganisms is provided by pasteurization, small counts
of bacteria can remain in the product, shortening the shelf-life even under refrigerated
conditions. The reason of these elevated counts in some countries is related to the health
of the animal and the use of incorrect sanitary practices during milking, which generates
cross-contamination by adding bacteria from the cow, the ground, the milker and the
milking equipment. This is why the storage life of pasteurized milk is different around
the world. Similar principles apply to other products such as juices; if sanitary practices
are not observed throughout production, pasteurization might be not adequate to
guarantee a long storage life.
2.2 Pasteurization process
Pasteurization, as mentioned previously, is the heating of foods (mainly beverages) under
specific time-temperature conditions to destroy disease microorganisms. The first
pasteurization process carried out by Louis Pasteur used temperatures ranging from 55°C
to 60ºC. He noticed that when heated some products such as wine or vinegar to a certain
temperature and then held the products for a length of time, fermentation was stopped
and no spoilage was observed in the products in the following days. These experiments
were conducted from 1860-1864, and Pasteur realized that food spoilage was produced
by certain microorganisms. This is probably the first time in food microbiology that
spoilage was attributed to specific organisms and not to unknown substances as was
thought previously. Pasteur related human diseases to the production of some substances
generated by fermentation of foods such as wine or beer, but he found that if he boiled
the product, quality characteristics such as flavor often disappeared. Because of that,
48
Pasteur used lower temperatures below the boiling point (100ºC) just to stop the
fermentation of the product. He applied the process to products such as beer (Satin,
1996). Lewis and Heppell (2000) describe how Pasteur developed the first type of
pasteurization using a long time and low temperature batch system when he realized that
tuberculosis was produced by microorganisms present in milk. In 1880, in Germany,
pasteurization was used commercially to extend the shelf-life of milk, and Soxhlet was
the first person to recommend the pasteurization of milk to avoid diseases related to
pathogenic microorganisms associated with milk. Gradually, pasteurization was
transferred to other countries despite being confronted by obstacles such as being
considered a method to hide or mask undesirable conditions of milk related with low
quality. The first pasteurization system in America was used in New York by Charles
North in 1907 and this was also a batch system matching Pasteur’s conditions. By the
1920s, pasteurization had become a common method to extend the shelf-life of milk in
Canada and the United States, although in some countries of Europe it was not yet
accepted. Not until 20 years later, in England and Wales, did pasteurization start to
become a common way to process milk, although at the present time in some parts of the
United Kingdom raw milk is permitted to be sold if it is accordance with Satin (1996). In
Scotland, the establishment of regulations to pasteurize milk began in 1983.
It is amazing that pasteurization, as practiced since 1860, which has shown such
positive effects in the control of human diseases caused by pathogenic bacteria mainly
present in milk, is not regulated in the entire world. Some reasons for this for this
resistance are related to loss of quality of the product in flavor and taste, but according to
Pasteur’s principle, pasteurization should be used to inactivate microorganisms related to
49
fermentation and food spoilage, while avoiding boiling the product to maintaining quality
characteristics. However, microorganisms have become more thermally resistant, and the
presence of some of these that commonly should not be present in specific foods, the so-
called emerging pathogens, are forcing the food industry to maintain very high
temperatures, and even to use sterilization conditions in products such as milk and juices.
Recent outbreaks all over the world show how some microorganisms have adapted to
survive even in products that do not offer an ideal growth medium.
Target microorganisms in pasteurization include vegetative cells of pathogenic
bacteria, yeast and molds. The heat resistance and conditions of inactivation for these
genres are shown in Table I. In the food industry there are three main types of
pasteurization processes, which differ mainly in their combinations of time and
temperature. Although the International Dairy Foods Association (IDFA) in 2006 defined
eight pasteurization processes, the three most commercially used and well known
processes—old or conventional pasteurization, High Temperature Short Time (HTST)
and Ultra-High Temperature (UHT) pasteurization/sterilization—will be covered in this
chapter. The five remaining types of pasteurization mentioned by IDFA are cited here.
The common name is Ultra Pasteurization (UP), which refers to thermal treatments
between 89ºC (191ºF) and 100ºC (212ºF) in various intervals of time in seconds and
microseconds. In Table II, the conventional and most common combination time-
temperature parameters of pasteurization are presented.
50
2.3 Vat pasteurization
Vat pasteurization is a very old process that was used successfully in the middle of the
19th century. Vat pasteurization is often called batch pasteurization, low temperature long
time (LTLT), or holding pasteurization because of the conditions during the processing.
Generally, the process is performed in a vat with a jacket in which hot water, steam, or
another heating source is incorporated to heat the food contained inside the vat. The fluid
food is pumped into the vat and heated quickly until the temperature rises; in this
pasteurization process 63ºC is the required temperature, which must be held for at least
30 minutes. Continuous agitation with an industrial stirrer is required during the process
in order to ensure uniform heat transfer to each particle of the food. Time elapsed before
reaching the required temperature is known as the heating come-up time and is not
considered part of the holding time. After 30 minutes the product must be cooled inside
the vat or pumped to a plate or tubular heat exchanger to cool to avoid the growth of
surviving bacteria and to proceed to the packaging process, e.g., to bottling or cartoning.
After pasteurization it is important to observe Good Manufacturing Practices (GMP) to
avoid post-contamination of the product and to extend its shelf-life. Some of the
disadvantages of vat pasteurization are characteristics of the batch process; like many
other operations in food processing, high production is limited to the number of available
vats and space in the industry. However, this pasteurization is widely used by small
farmers and dairy industries to pasteurize milk.
51
2.4 HTST pasteurization
High Temperature Short Time (HTST) pasteurization is the most commonly used method
to pasteurize food in many countries, mainly because this process reduces the time
compared to vat pasteurization, and it uses lower temperatures than UHT sterilization,
avoiding some of that technology’s undesirable effects on the quality of the product.
HTST process is commonly carried out at 72ºC for 15 s; in some countries, such as
Canada, the time of treatment is longer, and usually 16 s is employed as the official
holding time at 72°C. HTST pasteurization is a continuous process that takes place in a
heat exchanger (commonly in a plate heat exchanger). The fluid food is pumped from a
tank to the regeneration system in which the product is pre-heated to around 60°C to
65ºC. After that, the food is transported to the main heating unit in which the required
temperature is reached with heat transfer from hot water flowing through the plates.
Temperature is maintained constant at 72ºC inside each point of the product for the
holding time of at least 15 s. It is common to exceed the residence time to ensure the
safety of the product. After that, food is sent to the refrigeration system to cool the
product, at the first stage from 32°C to 9ºC, then in the last section to 4ºC and then on to
the packaging system. The flow rate must be maintained constant to deliver the same
temperature-time process to all of the food. The advantage of HTST versus vat
pasteurization is the time, which is shortened from 30 min to 15 s, so larger volume can
be produced in the same installation with considerable energy savings.
52
2.5 UHT pasteurization/sterilization
Ultra High Temperature (UHT) pasteurization/sterilization is an alternative pasteurization
process; not only is it focused on the inactivation of vegetative cells of pathogenic
microorganisms, but also the goal of this process is to destroy most of the
microorganisms (mainly heat resistant spores) in acidic foods and milk. A high
temperature (138ºC) is used, which is greater than the sterilization temperature used in
canning (121ºC). But, as will be discussed later, this process can be conducted under
regular sterilization conditions, even in canned foods such as milk. The official time of
treatment recognized in the United States is at least 2 s, although some authors mention
that the time should be at least one second at 138ºC. Other countries require 4 s and
temperatures of 140ºC, depending on the regulations. UHT pasteurization can be
performed in plate or tubular heat exchangers in which the main medium of heat transfer
is steam, or by direct injection of steam. This last option in some countries has many
restrictions, because the saturated steam will be in direct contact with the food, diluting
the product and releasing the vapor with a very fast cooling process. Often these types of
pasteurization and cooling processes are called flash pasteurization and flash cooling
because of the very rapid decrease and increase of temperature. Restrictions are focused
on the total elimination and quality of the steam. This process requires just a few seconds
to sterilize the product (usually milk), and thus avoids spoilage under non-refrigerated
conditions. After pasteurization, an aseptic packaging system is required to extend the
storage life even more. An important critical control point in UHT sterilization is to avoid
post-contamination of the product. Following usual UHT sterilization processing, the
product can have a shelf life of two or three months without refrigeration and without
53
aseptic packaging, but by using UHT, the shelf life is longer. According to data from
Tetra Pack Company (2006), UHT sterilized products can have a storage life of at least
six months without the use of refrigeration or preservatives. For that reason, some of
those products can retain their color, texture, taste and nutritional value.
The process of UHT plus aseptic packaging is carried out in a closed system
under aseptic conditions. The UHT pasteurized product goes directly to the packaging
machine in which the packaging material is previously sterilized with ultraviolet light,
hydrogen peroxide, and heat to remove any residue to achieve a dry and sterile container.
Furthermore, there is no air space in the package and the packing material is maintained
far away from light. Aseptic containers are made mainly of paper combined with layers
of aluminum foil and polyethylene, although some reports (Metha, 1980) show that
aseptic systems are available to fill containers such as cans, cartons and bottles.
Independent of the time-temperature combination for pasteurization, the use of aseptic
packaging is increasing in the food industry. In prepared food, UHT pasteurization is
conducted in conjunction with indirect systems to avoid micro-structural damage when
the steam is forced to pass through the product, which will likely affect the food texture.
Nevertheless, even though the process of UHT pasteurization is used to extend the
shelf life of milk for two or three months, or even longer when an aseptic packaging
system is used in combination, the main inconvenience of the process is an undesirable
change of the flavor of the product, generating a burned or cooked taste and undesirable
appearance. Despite that drawback, UHT milk is highly consumed is some countries in
different presentations according to the butter fat content and even the use of some
artificial flavorings like chocolate, strawberry and vanilla flavors. In some cases, the
54
addition of the flavorings is an attempt to mask the burned flavor and to create better
acceptability by consumers.
It is important to mention the difference between sterilized milk and UHT
sterilized milk. In many reports, websites, books and research articles the term UHT milk
is not specified, and confusion is generated because of the ambivalence of the word.
Currently, consumers may recognize UHT milk as pasteurized milk with long storage life
and, depending on the country, UHT milk may be called sterilized milk, ultra-pasteurized
milk, aseptic milk or shelf-stable milk, among others. But, according to Lewis and
Heppell (2000), there is sterilized milk that was popular some years ago in the United
Kingdom and which is still common in other European countries such as France, Italy,
Belgium and Spain. This “sterilized” milk is bottled in glass containers that are sealed
with cork or foil caps and subjected to a conventional sterilization process to destroy
microorganisms and spores. Bottles are sterilized in a retort at high temperatures from
110ºC to 116ºC and held at that temperature for 20 to 30 min. This is close to the
traditional sterilization temperature of 121.1ºC (250ºF), although heat transfer is much
faster in a liquid than in a solid or a liquid containing particles. This is one reason why
the temperature of sterilization for milk is lower than 121ºC. Obviously, after this very
long process, the quality of the milk drastically decreases; color, taste, and denaturation
of proteins and vitamin content are affected. In UHT pasteurized milk, few
caramelization reactions take place, changing the flavor and color in only a few seconds.
Although the target microorganism in conventional sterilization is the Clostridium
botulinum spores that find their optimum pH in low-acid food (pH > 4.5), this
microorganism is rarely found in milk. Generally, sterilization processes in milk are
55
focused on the inactivation of thermoduric and thermophilic bacteria and their heat
resistance spores, such as Bacillus stearothermophilus and Bacillus cereus.
Mehta (1980) mentions that the term “UHT-pasteurization” was used in North
America since 1965 and officially accepted by the U.S. Public Health Service relating to
the process in which milk is heated at 137.8ºC for at least 2 sec. According to Mehta
(1980), UHT milk is not sterile, but exhibits longer storage life than milk processed by
conventional pasteurization methods.
3. Nonthermal technologies
To reduce undesirable effects associated with thermal processing on quality factors, food
scientists and food engineers are looking for alternatives for processing and preserving
food products. Some of the novel technologies are using preservation factors other than
elevated temperatures to preserve food. Some of these factors are the use of high
hydrostatic pressure, electricity, sound, or light. For milk and dairy products, some of the
nonthermal processes that have been explored are high pressure, ultrasound and pulsed
electric fields.
56
3.1 Ultrasound
3.1.1 Basic concepts of ultrasound technology
Ultrasound is an emerging technology under research in the food engineering field. There
are two broad ranges of application of ultrasound according to the frequency: high
frequency uses from 2 to 10 MHz, and low frequency or power ultrasound uses
frequencies from 20 to around 100 kHz. The main difference between these technologies
is the physical effect generated in the medium. When ultrasound at high frequency is
applied to a food, a non-destructive effect is generated and the different parameters of
this technology, such as the attenuation coefficient, relate important information, e.g., the
structure or internal properties of the product. However, when the ultrasound is supplied
at low frequency, the passage of sound waves through a liquid medium causes the
vibration of molecules, generating physical effects into the food. Ultrasound at low
frequency is the technique that is used for disrupting purposes.
3.1.2 Power ultrasound
Power ultrasound is responsible for physical disruption in some materials, such as cells,
and also for promoting chemical reactions in liquid media. This type of ultrasound is used
in processes in which the breakage of cells or material is required for selected goals, such
as inactivation of microorganisms, extraction of components from cells or tissues, or
when a chemical reaction must be sped up or stopped, for example to accelerate or
inactivate the enzymatic activity in a food.
57
Power ultrasound is characterized by the use of low frequencies, continuous mode
of operation, and high power levels such as 10 and 10 000 W/cm2 (Carcel et al., 1998).
The main effect of power ultrasound is called cavitation, the generation of thousands of
bubbles during the passage of sound waves through the medium. These bubbles have
cycles of implosion and explosion that generate micro-currents and micro-climates. Each
time bubbles collapse, increases in temperature and pressure are produced in the medium.
The intensity of the cavitation will depend on the temperature, pressure, amplitude of the
ultrasound wave, medium composition, etc.
This part of the chapter will focus on the applicatoion of ultrasound technology in
the dairy industry and advantages and disadvantages.
3.1.3 Pasteurization of milk with power ultrasound
Pasteurization is used in milk with the main goal of inactivating pathogenic bacteria,
reducing the number of deteriorative microorganisms and reducing enzymatic activity.
This food contains a rich medium for bacterial growth: proteins, fat, carbohydrates,
minerals, vitamins and a high percentage of water make it an excellent substrate for the
growth of bacteria, not only natural flora, but also the pathogenic bacteria that can exist
in the environment and be a prosperous medium for enzymatic activity (Pelczar and Reid,
1972). However, through time, the concept of pasteurization changed with new
technologies and the presence of more resistant microorganisms. The original concept of
pasteurization was based on the time-temperature relation to inactivate the most heat-
resistant pathogen in milk, Mycobacterium tuberculosis. However, more than thirty years
ago, the relationship of time-temperature changed because of the discovery of a new
58
bacterium transmitted to humans via milk ingestion, generating Q fever: Coxiella burnetti
(Pelczar and Reid, 1972).
Nowadays, pasteurization of milk is also based on some microorganisms that have
been shown to be more heat resistant and which have been found in several recent
infamous outbreaks in the dairy industry. These outbreaks are related to the
contamination of food after processing and during handling and transportation, but also to
inadequate and insufficient thermal treatment conditions during processing. The new
emerging pathogens are under study with different technologies. Motarjemi and Adams
(2006) briefly define the emerging pathogens, including the microorganisms that have
recently appeared and those that are increasing in incidence. Many foodborne outbreaks
are reported in the food industry (Mohan Nair et al., 2005; Ko and Grant, 2003; Kozak et
al., 1996; Klima and Montville, 1995) related to the presence of pathogenic bacteria due
to underprocessing or post-pasteurization contamination. Listeria monocytogenes is one
of the leading foodborne pathogenic microorganisms generating problems in the food
industry, followed by Salmonella, Escherichia coli 0157:H7, Clostridium botulinum,
Campylobacter and Staphylococcus aureus (Banasiak, 2005). Listeria monocytogenes
was discovered in the early part of the last century, but in the 1980s there was a large
increase in the incidence of this microorganism in food, making it one of the most
important food pathogens found in raw and processed meat, dairy products, vegetables
and seafood (McLauchlin, 2006). However, the facilities of the dairy industry are often a
good source for Listeria contamination; soil, water, and even the cows can transmit the
bacteria to unprocessed and processed products.
59
Several studies were conducted with ultrasound to inactivate bacteria such as
Saccharomyces cerevisiae (Tsukamoto et al., 2004a, b; Guerrero et al., 2005),
Escherichia coli (Furuta et al., 2004; Ananta et al., 2005; Ugarte-Romero et al., 2006),
Listeria monocytogenes (Mañas et al., 2000; Ugarte-Romero et al., 2007), Salmonella
(Cabeza et al., 2004), and Shigella (Ugarte-Romero et al., 2007) in different media, but
only a few were carried out on milk (Table III). Microorganisms such as Staphylococcus
aureus, Bacillus subtilis (Carcel et al., 1998), Salmonella typhimurium (Wrigley and
Llorca, 1992), Escherichia coli (Zenker et al., 2003), Listeria monocytogenes (Pagán et
al., 1999; Earnshaw et al., 1995) and total count plate and coliforms (Villamiel et al.,
1999) were tested in milk under sonication.
Results of inactivation studies under sonication are favorable, showing a positive
effect from the use of sound waves to inactivate cells. For example, in studies performed
with Listeria monocytogenes in skim milk, the decimal reduction value was reduced from
2.1 min (D60ºC) from thermal treatment up to 0.3 min when ultrasound was applied in
combination with elevated temperature (D60ºC&US) (Earnshaw et al., 1995); this treatment
is called thermo-sonication. When pressure is used in combination with ultrasound
(mano-sonication), important reductions are achieved in the inactivation of Listeria
monocytogenes in skim milk. Using ambient pressure and temperature, the decimal
reduction value under the processing conditions of ultrasound in this study was 4.3 min;
increasing the pressure to 200 kPa led to a reduction of the D value to 1.5 min; and using
two times the previous pressure (400 kPa) brought the D value to 1.0 min. When the
temperature was increased above 50ºC, the lethality of ultrasound on Listeria cells was
enhanced (Pagán et al., 1999).
60
Zenker et al. (2003) studied the inactivation of Escherichia coli K12DH5α in
UHT milk using thermal treatment at 60ºC and combining an equivalent thermal
treatment with ultrasound, reducing the D value from 77 s to 23 s. These results are
examples of the additive effect of the combination between ultrasound and elevated
temperatures, leading to microbial inactivation.
It is important to highlight that ultrasound has the capability to pasteurize milk,
but not to sterilize it. According to the FDA, a pasteurization process is one that achieves
at least 5 log reductions of most pathogenic microorganisms, whereas sterilization is a
process that achieves at least 12 log reduction of the target microorganism, using in both
cases different time-temperature parameters. Ultrasound, at this moment, regardless of
the use of different temperatures, amplitudes or pressures has been shown to be a viable
process only to pasteurize some liquid foods.
3.1.4 Enzymes
Few experiments are reported on enzyme inactivation by ultrasound in milk. Ultrasound
has the ability to accelerate chemical reactions because of an increase in mass transfer
(Wang et al., 1996) or denaturation of proteins, stopping or decreasing the enzymatic
activity. The main chemical reactions activated with power ultrasound can be classified
as generation of free radicals, single electron transfer, and electron transfer catalysis. The
generation of free radicals is the mechanism related to denaturation of proteins because of
the effect on disulphur bonds (Sinisterra, 1992). The main studies conducted in enzyme
inactivation in milk with ultrasound are related to its curdling properties. Previous
research was conducted to study the activity of clotting enzymes of milk under
61
sonication. Chymosin, pepsin, and fungal enzymes (proteases) were sonicated in milk and
buffer solutions, with enzymes from fungi microorganisms showing the highest
resistance. As the sonication time was increased, the curdling activity of chymosin
decreased and the buffered media showed a protective effect on the enzymatic
denaturation. The presence of H2O2 was reported in the solutions after sonication because
of the action of ultrasound to generate free radicals (Raharintsoa et al., 1977). When raw
and reconstituted milk were used as media to test clotting enzymes after sonication,
reconstituted milk showed less curdling capacity (Raharintsoa et al., 1978). These were
some of the first studies in enzymatic inactivation with ultrasound at 27 kHz; non-
pressure or temperature values were reported at this time. However, as ultrasound
technology developed, new variables were combined to enhance the effect of cavitation.
Other studies that used ultrasound at 20 kHz and 25ºC for 80 min found an increase in the
yield and activity of chymosin extraction, reducing the processing time considerably and
offering an alternative to the high demand of chymosin for the cheese-making industry
(Kim and Zayas, 1989). Another application of ultrasound is manothermosonication,
which was applied to study inactivation of lipoxygenase, peroxidase, polyphenol oxidase,
lipase and protease. Chymosin and pepsin (important in milk coagulation) were studied
under sonication with an apparent decrease of the activity in model systems, but when
chymosin was mixed with milk, the inactivation was almost null, and the change in
coagulation time was minimal (Villamiel and de Jong, 2000; Raharintsoa et al., 1978). In
general, the proteolytic activity of chymosin, pepsin and fungal enzymes decreases with
sonication as reported by Villamiel et al. (1999).
62
Protease and lipase, enzymes related to quality problems during the storage of
milk under refrigerated conditions were also studied after manothermosonication. Both
enzymes are released from Pseudomonas fluorescens, and when ultrasound is applied in
combination with temperature (110 to 140ºC) and pressure (650 kPa), enzyme
inactivation was more favorable than when using only heat (Carcel et al., 1998).
3.1.5 Nutritional properties
a) Proteins
Some changes are reported in protein content in milk after sonication. Indeed,
emerging technologies are under research to improve the quality of the product and to
minimize damage to the product. However, the advantages that these new technologies
offer are several, not just in the final product, but also as a component for further food
processing products in addition to minimal changes in nutritional properties.
For example, in skim milk there is an increase of antioxidant activity when the
product is subjected to sonication, probably because of the action of cavitation in the
disruption of the quaternary and tertiary structure of the proteins (Villamiel and de Jong,
2000).
Some studies performed with raw whole milk under thermo-sonication showed a
significant difference (p<0.05) between the crude protein of thermally treated (63ºC)
samples and thermo-sonicated (63ºC plus ultrasound) samples compared with untreated
milk. A synergistic effect was reported in milk when heat plus ultrasound were used
together in the inactivation of enzymes and the study of the potential denaturation of
63
proteins, i.e. alkaline phosphatase, γ-glutamyltranspeptidase and lactoperoxidase, α-
lactalbumin, β-lactoglobulin at temperatures of 61ºC, 70ºC and 75.5ºC. However, under
these processing conditions, casein content did not show any important change (Villamiel
and de Jong, 2000). The use of higher temperatures (greater than 60ºC) in combination
with ultrasound is responsible for the denaturating effect in proteins; in a contrasting
study with skim milk, when it was thermo-sonicated at temperatures below 50ºC, the
soluble protein content was not different from the control (Wrigley and Llorca, 1992).
One of the keys to processing milk under thermo-sonication is to find the ideal
conditions for microbial inactivation, while at the same time generating the minimal
denaturation of protein content; more studies must be performed with this technology,
focusing on protein denaturation.
b) Vitamins and minerals
Scarce information exists related to the vitamin or mineral content of milk after
sonication. Indeed, one of the most important parameters after milk treatment with
ultrasound is protein content because of its caloric and nutritional importance in the
human diet. However, milk also contains important vitamins such as riboflavin and
niacin, and minerals such Ca, P, Na, K or Cl (Walstra et al., 2006).
One of the few studies related to milk after sonication concerned the calcium
content after treatment at 27 kHz. The soluble Ca ultra-filterable value changed from
0.420 g/l in raw milk to 0.460 g/l in processed milk regardless of the time of sonication,
whereas the non-sedimentable Ca changed from 0.482 g/l (untreated milk) up to 0.504 g/l
64
after 60 min of sonication. According to the authors, this change of Ca in milk is not
significant (Raharintsoa et al., 1978).
3.1.6 Physicochemical characteristics
Some important physicochemical characteristics in milk are those that will show
whether a new process changes the flow behavior or chemistry of milk in a significant
way. Although many of the studies with ultrasound in milk were conducted to study the
microbial inactivation of target bacteria, there are some available data related to
physicochemical properties such as viscosity, density, pH and color. Table IV presents a
comparison between fresh or raw milk, pasteurized milk with conventional thermal
treatment and sonicated skim and whole milk.
a) Viscosity
Viscosity can be defined as the resistance of a liquid to flow related to the
attraction forces between the molecules of a liquid. The viscosity reported for fresh milk
is 1.9 mPa*s (Table IV). However, as can be observed in the same table, skim milk (low
pasteurized) shows a lower value because of the absence of fat content. As the viscosity
value is higher, the liquid flows slowly, so in this case, the fresh milk will flow slowly
because of the fat content, while the skim milk will flow faster, being mainly a solution
of proteins and minerals. There is a difference between the viscosity of the fresh milk and
sonicated milks, with viscosity decreasing from 1.9 mPa*s to 1.76 and 1.77 mPa*s,
regardless of the butter fat content. One possible explanation for this decrease could be
65
the effect of homogenization that the ultrasound generates in the fat content, making the
milk more fluid because of the smaller size of the fat globules. However, the viscosity for
both sonicated milks is in the range for beverage milk.
b) Density
Density is the ratio between the mass of an object per given unit of volume; in
other words, density is the measure of how the molecules of a substance are packaged
together to occupy a certain volume. According to Table IV, the density of whole milks,
both fresh and sonicated, is very similar (1029 and 1025 kg/m3, respectively), whereas
skim milks, low pasteurized and sonicated are also in the same range (1035 and 1033
kg/m3, respectively). In summary, density is a property of milk that does not change in an
important way during sonication, regardless of the butter fat content.
c) pH
The pH of milk is a useful parameter to express the degree of acidity of milk.
Although it is not a routinely measured parameter in milk, this parameter provides
information about the degree of lactic acid that milk contains at specific times. The
reported pH of fresh milk is 6.7, is seen in Table IV, although this value can change
slightly because of many situations related to the milk source, such as the kind of
mammal, season, feeding, etc.
Sonicated milk showed lower pH after treatment, 6.5 and 6.6 for skim and whole
milk, respectively. However, these values do not represent a significant change in the pH
66
of milk. There are some possible explanations as to why pH decreases in milk after
sonication. Explanations are proposed for water; considering that milk has a high
percentage of water, these theories may be extrapolated to milk.
One of the former theories concerning chemical changes in a sonicated medium
was related to formation of free radicals from water molecules (Tsukamoto et al., 2004a,
2004b). Water molecules are divided into free radicals such as OH- and H+, and Sochard
et al., (1997) mention the presence of radicals O- between the most abundant components
of the sonolysis of water after treatment. Sonolysis is the breakage of water molecules
into free radicals because of the violent cavitation generated by the sound waves in a
liquid medium. These free radicals are responsible for lowering the pH of the medium,
but are not necessarily the only factor that increases the acidity of the solution. Studies
reported by Supeno (2000) showed how the sonication of aqueous solutions in the range
of ultrasound frequency from 41 to 3217 kHz generated the highest production of nitrite
and hydrogen peroxide as primary products in the liquid at 360 kHz, with the successive
generation of nitrate as a product of the oxidation of nitrite.
Walstra et al. (2006) mention that the decrease of pH in milk could be due to the
hydrolysis of phosphoric esters because of enzymatic action. Ultrasound is responsible
for promoting the activity of some enzymes, and cavitation probably accelerates some
chemical reactions, lowering the pH. However, at this time, there are no available data to
exactly determine the reason for slightly lower pH in milk after sonication.
67
d) Color
One of the main characteristics of milk is color; consumers look for the
conventional white color, and some studies show that the whiter the milk, the higher the
consumer preference. After sonication cavitation modifies the color of milk, because it
will also affect the final color of other dairy products, such as cheese or yogurt.
Sonicated milk showed a significant change in luminosity after treatment in
comparison with raw and thermal treated milk. Depending on the extent of cavitation,
milk was whiter as the intensity was increased. In addition to L value, a value changed
significantly in thermo-sonicated milk, having an important contribution to the blue
region, whereas b value did not change significantly between the raw, thermal and
thermo-sonicated milk (Bermúdez-Aguirre et al., 2005). The reason for this is the
reduction of fat globule size (Ertugay et al., 2004). The color of milk is due to the fat
globules in the milk which scatter the light, making it a white fluid; however, when these
globules undergo cavitation, their size is reduced and the agglomerate of the globules
become more homogeneous, modifying the light reflection and resulting in whiter milk.
In Figure 1, the variation in color parameters (L, a, b) between raw milk, thermal treated
milk and sonicated milk at selected intensities is shown. L and a are the parameters that
changed significantly with respect to the raw milk, whereas b did not change in any
important way.
The whiter color and homogenization of sonicated milk is maintained during the
storage life of the milk. Some studies showed that even after 16 d under refrigerated
conditions, the whiter color remained and no problems related with gelation or syneresis
were observed (Bermúdez-Aguirre et al., 2005).
68
Indeed, sonication offers many advantages at the time that milk is being
pasteurized; white color is enhanced and homogenization allows milk to have a better
appearance through the storage life. All of these positive effects are generated during the
one-step thermo-sonication process.
3.1.7 Processing of dairy products with ultrasound technology
3.1.7.1 Milk
a) Milk as beverage
At this time, ultrasonicated milk is not commercially available. Because of all the new
technologies, a series of experiments must be conducted to show the efficacy of the
technology and to achieve the sanitary, microbiological and governmental regulations in
each country. However, sonicated milk could be a potential product that offers many
advantages to the consumer as a beverage or to the dairy industry as an ingredient of
other products.
Milk as a beverage after sonication exhibits many advantages compared to heat
treated milk or conventional pasteurized products. Color, homogenization and appearance
are better. Furthermore, for milk processors, homogenization and pasteurization can take
place in one step instead of two (homogenization and further pasteurization), ensuring
better stability throughout storage.
Although only a few experiments were carried out in milk stability during storage,
quality problems such as syneresis, “sweet-curdling” because of the enzymatic action
69
(protease and lipase from Bacillus spores), oxidation, etc. could be minimized or avoided
with ultrasound.
b) Lactose free milk
A common health problem is the intolerance of lactose by a large part of the population.
Lactase, the enzyme responsible for metabolizing lactose in milk, is segregated in low
levels in some people, depending mainly on ethnicity. Lactose free milk is successfully
commercialized in many countries for lactose intolerant consumers. This milk without
lactose can be produced by fermentation of lactose-hydrolyzed milk or by the
simultaneous addition of β-galactosidase and lactic acid bacteria (Carcel et al., 1998;
Wang et al., 1996). These bacteria produce β-galactosidase which hydrolyzes the lactose
in fermented milk (Villamiel et al., 1999).
Ultrasound has the capability of raising the reaction activity of cells or to
stimulate a new action into the cells, for example in sterol synthesis with baker’s yeasts
or in lactose-hydrolyzed fermented milk. Using ultrasound in the processing of lactose
free milk, the lactose hydrolysis was around 55%; using traditional methods to produce
lactose free milk (fermentation), hydrolysis was around 36% (Wang et al., 1996). In
general, studies demonstrated that hydrolysis of lactose by ultrasound can be enhanced by
up to 20% compared with conventional methods (Villamiel et al., 1999; Toba et al.,
1990). β-Galactosidase is released from lactobacillus, shortening fermentation time
considerably and hydrolyzing the lactose (Carcel et al., 1998).
70
c) Human milk
Sometimes newborns need to be fed by a source of milk other than human milk directly
from their own mothers, because of illness problems or early childbirth. In such special
cases, newborns are fed with stored milk that was previously pasteurized, homogenized
and frozen or lyophilized. However, when the babies are fed with this milk using a
feeding tube (gavage or ostomy tube), almost 47% of the fat content that is added to the
tube is lost from the milk (Dhar et al., 1995; Carcel et al., 1998). But not only is the fat in
milk lost, but also lost are liposoluble vitamins, proteins and minerals, leading to a high
degree of nutritional losses. When sonication is used to homogenize the milk, the final
product is much more stable because of the reduction of fat globules and the longer
maintenance of the emulsion, which considerably reduces nutrient losses in milk
(Martínez et al., 1992).
Some current experiments in human milk homogenization demonstrated that
using sonication at temperatures below 45ºC reduces fat losses during feeding because of
an increase in lipolytic activity, which at the same time protects immunoprotective
substances such as immunoglobulin A (IgA) and immunoglobulin G (IgG) and
lactoferrin. Temperatures higher than 55ºC totally inhibited the lipolytic activity and the
bacteria load, but also decreased the IgA and IgG (Martínez et al., 1992), which is not
convenient for newborns.
Thus, one of the many alternatives that ultrasound offers is the homogenization of
human milk at low temperatures, providing a better consistency and avoiding the loss of
vitamins, minerals, proteins and fat, an important component in the caloric diet for
newborns.
71
3.1.7.2 Yogurt
Regular yogurt is a very common and demanded dairy product. Although yogurt may be
processed at home, nowadays there are many commercially available varieties of yogurt.
Addition of special flavors, fruits, cereals or specific beneficial bacteria are examples of
current products. However, one of the biggest issues in yogurt production is the presence
of lactose in the milk that is used to process it; the segment of the population that is
intolerant to lactose needs to find a better option for yogurt consumption. Hydrolyzed
lactose yogurt is focused on consumers with zero tolerance to lactose, providing at the
same time a sweetener effect without calories. As in the case of lactose free milk,
fermented milk to process yogurt can be prepared by ultrasound, releasing the β-
galactosidase from the starter bacteria and hydrolyzing the lactose (Carcel et al., 1998;
Toba et al., 1990). The conventional processing of yogurt requires a long time. In order to
allow fermentation to take place, a starter culture is added to milk, and lactic acid
production starts to lower the pH of the product. After some hours, when lactic acid
reaches the desirable value for yogurt (0.65 – 0.70%), fermentation is stopped by
immediately cooling the product. Fermentation times are also reduced in sonicated yogurt
because of faster acid production and pH drop enhanced by the use of ultrasound.
Cavitation stimulates acid production because of the release of intracellular enzymes
from microorganisms. Lactose exists inside the cells of the starter culture for yogurt, and
the enzyme β-galactosidase increases its activity because the ultrasound hydrolyzes this
sugar and accelerates acid production (Wu et al., 2001).
Some common quality problems of yogurt are related to the separation of the
serum from the main matrix containing the protein and fat; this phenomenon is known as
72
syneresis. This problem occurs during the transportation and/or storage of the product
and is a non-desirable characteristic of yogurt. Some studies were performed using
manothermosonication of milk (12 s, 20 kHz, 2 kg pressure and 40ºC) to process yogurt,
and the final characteristics of the product were improved. For example, viscosity was
much better in sonicated yogurt and fermentation time was reduced when milk was
previously homogenized with ultrasound. The final structure of manothermosonicated
yogurt was stronger than the control because of a better interaction of the components of
the network. Casein micelles captured serum and fat globules, showing a significant
difference (p < 0.05) in the water holding capacity between the control and the
manothermosonicated samples, releasing 18.8% and 14.8% of serum, respectively.
Rheological parameters of sonicated yogurt such as penetration and relaxation forces,
texture profile analysis parameters, consistency, flow behavior, yield stress, storage
modulus (G’) and loss modulus (G’’), among others, were improved in the product after
the use of ultrasound in milk and prior to the fermentation process (Vercet et al., 2002).
Similar studies were conducted in milk used to process yogurt, with ultrasound alone
without pressure; results of this study showed good homogenization of the yogurt,
reduction in fermentation time and important and general improvements in water holding
capacity, viscosity and reduction of syneresis (Wu et al., 2001).
The result of having better water holding capacity and minimum syneresis could
be explained by examining the microstructure and physicochemical points of view.
Cavitation is responsible for the disruption of fat globules and decreases the size of fat
globules while at the same time conferring a new surface. All these globules together
represent a bigger surface area than the original surface area, and in this new area there
73
will be new attached casein micelles (Wu et al., 2001) because of the action of the
cavitation regrouping the milk components. These micelles are hydrophilic, binding
water molecules in the new structure, leading to a more compact network of proteins, fat
globules and water (serum), presenting better water holding capacity, better structure and
a low degree of syneresis.
Indeed, ultrasound technology offers many advantages in yogurt processing.
Some of the common quality defects such as syneresis could be reduced considerably,
and better rheological properties for the consumer can be achieved after the use of
ultrasound.
3.1.7.3 Cheese
Cheese is one of the most demanded products around the world. Each year, the cheese
industry reports considerable sales increases; in 2003 cheese production in the United
States was more than 8,600 pounds of cheese. Varieties of this dairy product with the
highest demand include Cheddar, colby, monterrey jack, mozzarella, and ricotta (Miller
et al., 2007). The main processing steps of cheese making include clotting or curdling of
the milk, removal of whey, acid production, salting, shaping and ripening (Walstra et al.,
2006). The essential step during cheese processing is the formation of the curd that
occurs by enzymatic and microbial activity. Many environmental conditions such as
temperature, enzyme concentration and microbial load are very important during the
process to generate a firm curd at a specific time. One of the desirable aspects in cheese
making is to reduce the curdling time and increase the yield, because the final yield of
74
cheese is around 10%. New technologies are being tested in cheese making in order to
improve these aspects while at the same time improving the overall quality of cheese.
When sonication was applied to milk to study the proteolytic activity of the
enzymes related to curdling, the main observable effect was that ultrasound speeds up the
hardening of the curd, and the final product showed a better firmness because of the
activity on the chymosin, pepsin and other related enzymes (Villamiel et al., 1999).
Chymosin is the main enzyme related to the curdling formation in the cheese making
industry. This enzyme is produced naturally in the stomach of bull calves, and the
conventional extraction of the enzyme with salted and acid solution takes a long time and
the quality and yield are not favorable after the process. Chymosin has a proteolytic
activity in liquid milk, coagulating the protein and conferring a solid-like coagulated gel
(Kim and Zayas, 1991). When ultrasound (20 kHz) was used to enhance the extraction,
the yield extract and enzyme activity was increased considerably, but also extraction
times were much shorter than without sonication. The reason for that could be attributed
to the destruction of cellular structure because of the action of ultrasound, increasing the
activity of the substances contained in the cells and the migration of proteins and
minerals from the cells to the solution (Carcel et al., 1998). The activity of the chymosin
increased with sonication while the nitrogen content of the extract decreased at the same
time (Kim and Kayas, 1991).
Other uses of power ultrasound in the cheese making industry are in the flavor
arena. Proteolysis is the main process that takes place during cheese ripening, and it can
be divided into two main phases: the primary phase in which the residues of chymosin
interact with the casein in the curd, and the secondary phase in which proteins and
75
polypeptides are broken into amino acids by enzymatic action released from bacteria
(Engels and Visser, 1996). When Lc. Lactis subsp. cremoris was sonicated, a “cell free
extract” was obtained by cell disruption (Engels and Visser, 1996) and the extraction of
peptides and amino acids was easier; these components were used in the development of
flavor of the cheese (Villamiel et al., 1999).
In addition to all of these benefits of ultrasound technology, the process of “queso
fresco” (a typical product from Hispanic countries) made with sonicated milk showed
better characteristics, such as whiter color, better texture (hardness), higher water holding
capacity, higher yield and, in general, better acceptance by consumers. This is one area
that deserves further research in ultrasound technology.
3.1.8 Other uses of power ultrasound in the dairy industry
Ultrasound offers a great variety of uses in the industry; the specific case of applications
for the dairy industry is wide enough to satisfy different requirements in processing and
preservation. Some additional examples of the use of ultrasound in the dairy industry are
described below.
The topic of edible films is interesting for many researchers in food preservation
worldwide; however, some specific characteristics of the films are required to be used in
food, as well as their mechanical properties. Milk proteins are used for manufacturing
edible films, and their mechanical properties were improved by using sonication in the
process of elaboration of films based on sodium caseinate and whey proteins (Carcel et
al., 1998).
76
Other uses of power ultrasound reported in literature are related to cleaning
operations. Power ultrasound was used to disperse cumulus of bacteria in raw milk, and
to clean cheese moulds in the cheese-making industry (Villamiel et al., 1999).
3.2 Pulsed electric fields: Basic concepts
The use of electricity to pasteurize milk started in the early 1900s, and some research
reports the use of electric discharge through carbon electrodes and raising milk
temperature up to 70ºC in order to inactivate bacteria. This first electrical process to
pasteurize milk was named Electropure (Vega-Mercado et al., 1999), and inactivated
bacteria such as Tubercle bacilli, Escherichia coli and other thermal resistant
microorganisms (Barbosa-Cánovas et al., 1999). Today, electricity is applied into
microorganisms not only to destroy them, but also to facilitate electroporation,
electrofusion and food preservation (Barbosa-Cánovas et al., 1999).
Pulsed electric fields (PEF) technology consists of the passage of a liquid food
through a chamber with high voltage electrodes that will transfer an electric current into
the food. The intensity will depend on the electric field strength or the voltage applied
between electrodes (Ruhlman et al., 2001). PEF treatment is the application of short
pulses (from micro to milliseconds) of selected electric field intensity (10 – 80 kV/cm).
When an electric field is applied to the cell, a transmembrane potential across the
membrane is induced, but when this potential exceeds the natural potential of the cell (1
V), the expansion of existing pores or the formation of new pores in the cell membrane
occurs, with an imminent increase of the cell permeability. This phenomenon is called
electroporation, and this process is based on dielectric rupture theory (Figure 2). This
77
theory establishes that when electric fields are applied within the cell, there is an
accumulation of positive and negative charges at the membrane, and when the threshold
value is exceeded pores are formed with a posterior breakage of the cell membrane.
Some studies reported that this process can be reversible in some cases, but other
collateral effects have also been observed, such as shrinkage of the cytoplasmic
membrane, the formation of pearl chains and cell fusion (electrofusion). Physical and
electrical properties of the food, as well as some specific characteristics of the
microorganism, will be important to the success of the process. For example, electrical
conductivity, density, specific heat, pH, ionic strength and viscosity of the product are
some of the basic parameters considered before processing the product (Ruhlman et al.,
2001). Milk is considered in PEF technology as one of the most electrically conductive
liquid foods (Zhang et al., 1995). Processing parameters to be controlled during PEF
treatment are electric field intensity, treatment time, frequency (when it is increased, the
treatment time is decreased), processing temperature (higher temperature enhances PEF
inactivation), specific energy, and pulse wave shape (most lethal is the square wave),
among others (Barbosa-Cánovas et al., 1998; Bendicho et al., 2002a; Vega-Mercado et
al., 1997).
The use of pulsed electric fields to process food has many advantages compared
with traditional pasteurization methods, such as treatment times of microseconds,
important energy and cost savings, as well as minimal changes in food quality, such as
color, flavor or nutritive value of the product (Ruhlman et al., 2001).
78
3.2.1 Pasteurization of milk with Pulsed Electric Fields
Some microorganisms are successfully inactivated in milk using electric field strengths at
refrigerated temperatures, achieving important reductions and retaining the quality of
milk. Some of these microorganisms in milk and other dairy products, shown in Table V,
represent pathogenic, surrogate and deteriorative organisms present in milk. Escherichia
coli, Salmonella dublin, Lactobacillus brevis, Bacillus subtilis, Staphylococcus aureus
and Saccharomyces cerevisiae are some of the tested microorganisms in milk and related
products. Different processing conditions tested and media such as milk, skim milk,
SMUF (simulated milk ultra filtrated) and yogurt were subjected to PEF treatment with
important log reductions. However, as in other technologies, there are some
microorganisms that exhibit persistent resistance to inactivation, in this case with PEF;
some of these resistant microorganisms are Corynebacterium spp. and Xanthomas
malthophilia in inoculated raw skim milk (Odriozola-Serrano et al., 2006).
The factors that can affect the degree of inactivation by PEF related to the
microorganism, which can be called biological factors, are:
a) Genre
b) Species
c) Size
d) Shape
e) Growth stage
Other factors to influencing inactivation are the intrinsic resistance of the
microorganism, growth conditions, cell concentration and recovery conditions, if the cell
79
is partially injured (Barbosa-Cánovas et al., 1998; Pagán and Mañas, 2006; García et al.,
2007; García et al., 2005).
Some advantages that PEF offers to conventional treatments of pasteurization of milk
are:
a) Sensorial and nutritional properties are not or minimally degraded during the
process, showing fresh-like characteristics.
b) It is a safe process because no dangerous chemical reactions have been detected.
c) PEF requires minimal energy and has greater energy efficiency compared to
thermal treatments (PEF requires 90% less than HTST).
d) PEF processing costs less than conventional treatments as well as the low
maintenance (i.e. no steam required) after the initial acquisition of the equipment.
e) The shelf-life of the products can be extended considerably compared to
conventional pasteurization
(Barbosa-Cánovas et al., 1998; Zhang, 2007).
3.2.2 Enzymes
Under conventional thermal treatment, enzymes are slightly inactivated and most of the
native enzymes in milk remain active. This is one cause for milk spoilage even when this
product is subjected to pasteurization. Depending on many factors, enzyme inactivation
can be feasible with the use of pulsed electric fields; some of these factors are the enzyme
itself, the medium of treatment and the processing conditions. However, general
conditions to inactivate enzymes are more severe than those to inactivate
microorganisms, and the process is more effective when temperature is applied at the
80
same time of the PEF treatment (Martínez et al., 2007). There are only a few reports of
enzyme studies under PEF in milk (Odriozola-Serrano et al., 2006; Bendicho et al.,
2002a). Some of the milk enzymes that were tested under selected PEF treatments are
peroxidase, alkaline phosphatase, plasmin, lactoperoxidase, protease and lipase (Van
Loey et al., 2002). However, in all of these studies total inactivation is not reported under
selected processing conditions (Martínez et al., 2007).
Two of the above mentioned enzymes are inactivated in high percentages.
Plasmin from bovine milk treated in SMUF in a continuous system at 30 kV/cm with 50
pulses of 2 μs and 15ºC was inactivated 90% after treatment. Alkaline phosphatase in raw
milk which was inactivated 96% after 18.8 kV/cm, 20 pulses (2 μs) and 22ºC. Protease
and lipase activity in raw milk was to 60% under selected processing conditions (Van
Loey et al., 2002).
3.2.3 Nutritional properties
As a relatively new technology, studies in nutritional properties of milk after PEF
processing are scarce; most of the reports are focused on microbial inactivation and only
a few examine enzyme inactivation. Although some of these reports include brief studies
on sensorial quality such as taste and flavor of milk, few are related to nutritional
properties such as vitamin or protein content after PEF processing. One of the few reports
was conducted on vitamin content in milk after processing with electric field strengths.
Water-soluble vitamins (riboflavin, thiamin and ascorbic acid) and fat-soluble vitamins
(cholecalciferol and tocopherol) were analyzed after 400 μs at 18.3 to 27.1 kV/cm, and
81
changes were not reported for vitamin contents in milk after processing, although there
were some variations in ascorbic acid (Bendicho et al., 2002b).
4. Final remarks
Ultrasound offers many advantages in dairy processing. Although this is a new
technology that is still being tested at the lab and pilot plant scale, sonication has the
potential to be scaled up to the industry level in order to take advantage of its properties.
Inactivation of bacteria and enzymes is possible with ultrasound, achieving pasteurization
standards and conferring better quality attributes to milk. Beverage milk, yogurt and
cheese were processed successfully under ultrasound activity, and other dairy products
such as cream or ice cream could make use of the beneficial effects of sonication on
texture and rheological characteristics to improve their quality as well. Whereas pulsed
electric fields technology is more advanced with regard to legal aspects, most of the
research conducted with milk and pathogenic bacteria and enzymes demonstrates positive
results that could allow approval from regulatory agencies for use as a pasteurization
method for milk, saving energy, time, and money and providing fresh-like characteristics
in the final product. Research on the development of new and better dairy products with
PEF treated milk provides a huge world of opportunities for the food scientist.
82
References
Ananta, E., Voigt, D., Zenker, M., Heinz, V., and Knorr, D. 2005. Cellular
injuries upon exposure of Escherichia coli and Lactobacillus rhamnosus to high-intensity
ultrasound. Journal of Applied Microbiology. 99: 271-278.
Banasiak, K. (2005). News. Food Technology, 59(11), 13-14.
Barbosa-Cánovas, G.V., Góngora-Nieto M.M., Pothakamury U.R., and Swanson
B.G. 1999. Preservation of Foods with Pulsed Electric Fields. Academic Press. San
Diego, CA.
Barbosa-Cánovas, G.V., Pothakamury U.R., Palou E., and Swanson B.G. 1998.
Nonthermal Preservation of Foods. Marcel Dekker, New York. pp: 73-112.
Bendicho, S., Barbosa-Cánovas, G.V., and Martín, O. 2002a. Milk processing by
high intensity pulsed electric fields. Trends in Food Science and Technology. 13: 195-
204.
Bendicho, S., Espachs, A., Arántegui, J., and Martín, O. 2002b. Effect of high
intensity pulsed electric fields and heat treatments on vitamins of milk. Journal of Dairy
Research. 69:113-123.
83
Bermúdez-Aguirre, D., Mobbs, T. Versteeg, K., and Barbosa-Cánovas, G.V.
2005. Physicochemical and nutritional properties of thermosonicated milk. IFT Annual
Meeting. Book of abstracts. New Orleans, LA.
Bermúdez-Aguirre, D., and Barbosa-Cánovas, G.V. 2008. Study of butter fat
content in milk on the inactivation of Listeria innocua ATCC 51742 by thermo-
sonication. Innovative Food Science and Emerging Technologies. 9(2): 176-185.
Cabeza, M.C., Ordóñez, J.A., Cambero, I., De la Hoz, L., and García, M.L. 2004.
Effect of thermoultrasonication on Salmonella enterica Serovar Enteridits in distilled
water and intact shell eggs. Journal of Food Protection. 67 (9): 1886-1891.
Carcel, J.A., Benedito, J., SanJuan, N., and Sánchez, E. 1998. Aplicación de los
ultrasonidos en las industrias de productos lácteos y derivados. Alimentación, Equipos y
Tecnología. 135-141.
Dhar, J., Davidson, A.G.F., Martinez, F.E., Barr, S., Desai, I.D., and Nakai, S.
1995. Ultrasonication, lyophilization, freezing and storage effects on fat loss during
mechanical infusion of expressed human milk. Journal of Food Science. 60 (2): 375-377,
394.
Dunn, J.E., and Pearlman, J.S. 1987. Methods and apparatus for extending the
shelf life of fluid food products. U.S. Patent 4, 695, 472.

84
Earnshaw, R.G., Appleyard, J., and Hurst, R.M. 1995. Understanding physical
inactivation processes: Combined preservation opportunities using heat, ultrasound and
pressure. International Journal of Applied Microbiology. 28: 197-219.
Engels, W.J.M., and Visser, S. 1996. Development of cheese flavor from peptides
and amino acids by cell-free extracts of Lactococcus lactis subsp. cremoris B78 in a
model system. Netherlands Milk & Dairy Journal. 50: 3-17.
Ertugay, M.F., Şengül, M., and Şengül, M. 2004. Effect of ultrasound treatment
on milk homogenization and particle size distribution of fat. Turkish Journal of
Veterinary and Animal Sciences. 28: 303-308.
Furuta, M., Yamaguchi, M., Tsukamoto, T., Yim, B., Stavarache, C.E., Hasiba K.,
and Maeda, Y. 2004. Inactivation of Escherichia coli by ultrasonic irradiation.
Ultrasonics sonochemistry. 11 (2): 57-60.
García, D., Gómez, N., Mañas, P., Raso, J., and Pagán, R. 2007. Pulsed electric
fields cause bacterial envelopes permeabilization depending on the treatment intensity,
the treatment medium pH and the microorganism investigated. International Journal of
Food Microbiology. 113: 219-227.
85
García, D., Gómez, N., Raso, J. and Pagán, R. 2005. Bacterial resistance after
pulsed electric fields depending on the treatment medium pH. Innovative Food Science
and Emerging Technologies. 6:388-395.
García, M.L., Burgos, J., Sanz, B., and Ordoñez, J.A. 1989. Effect of heat and
ultrasonic waves on the survival of two strains of Bacillus subtilis. Journal of Applied
Microbiology. 67(6):619-628.
Guerrero, S., Tognon, M., and Alzamora, S.M. 2005. Response of Saccharomyces
cerevisiae to the combined action of ultrasound and low weight chitosan. Food Control.
16: 131-139.
Gupta, R.P., and Murray, W. 1989. Pulsed high electric field sterilization. Seventh
IEEE Pulsed Power Conference. Monterey, California 11-14 June.
Holdsworth, S.D. 1997. Thermal Processing of Packaged Foods. Blackie
Academic & Professional. London, United Kingdom.
IDFA. 2006. International Dairy Foods Association.
http://www.idfa.org/facts/milk/pasteur.cfm
Jay, J. 1992. Modern Food Microbiology. 4th Ed. Van Nostrand Reinhold
Company. New York.
86
Jensen, R.G., Blanc, B., and Patton, S. 1995. Particulate Constituents in Human
and Bovine Milk. In “Handbook of Milk Composition”. R.G. Jensen, Ed. Academic Press.
San Diego, California, pp: 50-80.
Kim, S.M., and Zayas, J.F. 1989. Processing parameters of chymosin extraction
by ultrasound. Journal of Food Science. 54(3):700-703.
Kim, S.M., and Zayas, J.F. 1991. Comparative quality characteristics of chymosin
extracts obtained by ultrasound treatment. Journal of Food Science. 56(2): 406-410.
Klima, R.A., and Montville, T.J. 1995. The regulatory and industrial responses to
listeriosis in the USA: A paradigm for dealing with emerging foodborne pathogens.
Trends in Food Science and Technology, 6, 87-93.
Ko, S., and Grant, S.A. 2003. Development of a novel FRET method for detection
of Listeria or Salmonella. Sensors and Actuators, B96, 372-378.
Kozak, J., Balmer, T., Byrne, R., and Fisher, K. 1996. Prevalence of Listeria
monocytogenes in foods: Incidence in dairy products. Food Control, 7(4-5), 215-221.
Lee, B.H., Kermasha, S., and Baker, B.E. 1989. Thermal, ultrasonic and
ultraviolet inactivation of Salmonella in thin films of aqueous media and chocolate. Food
Microbiology. 6 (3): 143-152.
87
Lewis, M., and Heppell, N. 2000. Continuous Thermal Processing of Foods.
Pasteurization and UHT Sterilization. An Aspen Publication. Gaithersburg, MD.
Mañas, P., Pagán, R., and Raso, J. 2000. Predicting lethal effect of ultrasonic
waves under pressure treatments on Listeria monocytogenes ATCC 15313 by power
measurements. Journal of Food Science. 65(4): 663-667.
Martínez, F.E., Davidson, A.G.F., Anderson, J.D., Nakai, S., Desai, I.D., and
Radcliffe, A. 1992. Effects of ultrasonic homogenization of human milk on lipolysis,
IgA, IgG, lactoferrin and bacterial content. Nutrition Research. 12: 561-568.
Martínez, P.E., Martín-Belloso, O., Rodrigo, D., and Sanpedro, F. 2007. Impact of
pulsed electric fields on food enzymes and shelf-life. In “Food Preservation by pulsed
electric fields”, H.L.M. Lelieveld, S. Notermans and S.W.H. de Haan. CRC Press, Boca
Ratón, FL. pp: 212-246.
McLauchlin, J. 2006. Listeria. In Emerging Foodborne Pathogens, Y. Motarjemo
and M. Adams, Eds. CRC Press, Boca Ratón, FL. pp: 406-428.
Metha, R.S. 1980. Milk Processed at Ultra-High-Temperatures: A Review.
Journal of Food Protection. 43 (3): 212-225.
88
Miller, G.D., Jarvis, J.K., and McBean, L.D. 2007. Handbook of dairy foods and
nutrition. CRC Press. Boca Ratón, FL.
Mohan Nair, M.K., Vasudevan, P., and Venkitanarayanan, K. (2005).
Antibacterial effect of black seed oil on Listeria monocytogenes. Food Control, 16, 395-
398.
Motarjemi, Y., and Adams, M. 2006. Introduction. In Emerging Foodborne
Pathogens, Y. Motarjemo and M. Adams, Eds. CRC Press, Boca Ratón, FL.
Odriozola-Serrano, I., Bendicho-Porta, S., and Martín-Belloso, O. 2006.
Comparative study on shelf-life of whole milk processed by high-intensity pulsed electric
field of heat treatment. Journal of Dairy Science. 89:905-911.
Pagán, R., and Mañas, P. 2006. Fundamental aspects of microbial membrane
electroporation. In: “Pulsed electric field technology for the food industry”, J. Raso and
V. Heinz, Eds. Springer, New York. pp:73-94.
Pagán, R., Mañas, P., Alvarez, I., and Condón, S. 1999. Resistance of Listeria
monocytogenes to ultrasonic waves under pressure at sublethal (manosonication) and
lethal (manothermosonication) temperatures. Food Microbiology. 16: 139-148.
89
Pelczar, M.J., and Reid, R. D. 1972. Microbiology. McGraw-Hill. New York,
USA. pp: 783-807.
Pothakamury, U.R., Monsalve-González, A., Barbosa-Cánovas, G.V., and
Swanson, B.G. 1995. Inactivation of Escherichia coli and Staphylococcus aureus in
model food systems by pulsed electric fields technology. Food Research International.
28(2):167-171.
Qin, B.L., Zhang, Q., Barbosa-Cánovas, G.V., Swanson, B.G., and Pedrow, P.D.
1994. Inactivation of microorganisms by pulsed electric fields with different voltage
wave-forms. IEEE Transaction on Dielectics and Electrical Insulation. 1(6) : 1047-1057.
Raharintsoa, C., Gaulard, M.L, and Alais, C. 1977. Étude de l’action des ultrasons
cavitants sur quelques enzymes coagulants. Le lait. 569-570.
Raharintsoa, C., Gaulard, M.L., and Alais, C. 1978. Effet des ultrasons cavitants
sur la coagulation du lait par les enzymes. Le lait. 559-574.
Ruhlman, K.T., Jin, Z.T., and Zhang, Q.H. 2001. Physical properties of liquid
foods for Pulsed Electric Field Treatment. In “Pulsed electric fields in food processing”,
G.V. Barbosa-Cánovas and Q.H. Zhang, Eds. Technomic Publishing, Inc., Lancaster, PA.
pp:45-56.
90
Satin, M. 1996. Food Irradiation. 2nd Ed. Technomic Publishing Company.
Lancaster, Pennsylvania.
Sinisterra, J.V. 1992. Application of ultrasound to biotechnology: An overview.
Ultrasonics. 30(3): 180-185.
Sochard, S., Wilhelm, A.M., and Delmas H. 1997. Modeling of free radicals
production in a collapsing gas-vapor bubble. Ultrasonics Sonochemistry. 4:77-84.
Supeno, P.K. 2000. Sonochemical formation of nitrate and nitrite in water.
Ultrasonics Sonochemistry, 7, 109-113.
Tetra Pak. 2006. http://www.tetrapak.com
Toba, T., Hayasaka, I., Taguchi, S., and Adachi, S. 1990. A new method for
manufacture of lactose-hydrolysed fermented milk. Journal of the Science of Food and
Agriculture. 52: 403-407.
Tsukamoto, I., Constantinoiu, E., Furuta, M., Nishimura, R., and Maeda, Y.
2004a. Inactivation effect of sonication and chlorination on Saccharomyces cerevisiae.
Calorimetric analysis. Ultrasonics Sonochemistry, 11, 167-172.
91
Tsukamoto, I., Yim, B., Stavarache, C.E., Furuta, M., Hashiba, K., and Maeda, Y.
2004b. Inactivation of Saccharomyces cerevisiae by ultrasonic irradiation. Ultrasonics
Sonochemistry, 11, 61-65.
Ugarte-Romero, E., Feng, H., and Martin, S.E. 2007. Inactivation of Shigella
boydii 18 IDPH and Listeria monocytogenes Scott A with power ultrasound at different
acoustic energy densities and temperatures. Journal of Food Science. 72(4): M103-M107.
Ugarte-Romero, E., Feng, H., Martin, S.E., Cadwallader, K.R., and Robinson, S.J.
2006. Inactivation of Escherichia coli with power ultrasound in apple cider. Journal of
Food science. 71(2): E102-E108.
Utsunomiya Y., and Kosaka Y. 1979. Application of supersonic waves to foods.
Journal of the faculty of Applied Biological Science, Hiroshima University. 18 (2): 225-
231.
Van Loey, A., Verachtert, B., and Hendrickx M. 2002. Effects of high electric
field pulses on enzymes. Trends in Food Science and Technology. 12: 94-102.
Vega-Mercado, H., Góngora-Nieto, M.M., Barbosa-Cánovas, G.V., and Swanson,
B.G. 1999. Nonthermal preservation of liquid foods using pulsed electric fields. In
“Handbook of Food Preservation”. M. S. Rahman, Ed., Marcel Dekker, Inc. New York;
pp: 487-520.
92
Vega-Mercado, H., Martín-Belloso, O., Qin, B.L., Chang, F.J., Góngora-Nieto,
M.M., Barbosa-Cánovas, G.V., and Swanson, B.G. 1997. Non-thermal food preservation:
Pulsed electric fields. Trends in Food Science and Technology. 8: 151-157.
Vercet, A., Oria, R., Marquina, P., Crelier, S., and Lopez-Buesa, P. 2002.
Rheological properties of yogurt made with milk submitted to manothermosonication.
Journal of Agricultural and Food Chemistry. 50: 6165-6171.
Villamiel, M., and de Jong, P. 2000. Influence of high-intensity ultrasound and
heat treatment in continuous flow on fat, proteins, and native enzymes of milk. Journal of
Agricultural and Food Chemistry. 48: 472-478.
Villamiel, M., van Hamersveld, E.H., and de Jong, P. 1999. Review: Effect of
ultrasound processing on the quality of dairy products. Milchwissenschaft. 54(2):69-73.
Walstra, P., Wouters, J.T.M., and Geurts, T.J. 2006. Dairy Science and
Technology. 2nd Ed. CRC Press, Taylor and Francis. Boca Ratón, FL.
Wang, D., Sakakibara, M., Kondoh, N., and Suzuki, K. 1996. Ultrasound-
enhanced lactose hydrolysis in milk fermentation with Lactobacillus bulgaricus. Journal
of Chemical Technology and Biotechnology. 65: 86-92.
93
Wrigley, D.M., and Llorca, H.G. 1992. Decrease of Salmonella typhimurium in
skim milk and egg by heat and ultrasonic wave treatment. Journal of Food Protection. 55
(9): 678-680.
Wu, H., Hulbert, G.J., and Mount, J.R. 2001. Effects of ultrasound on milk
homogenization and fermentation with yogurt starter. Innovative Food Science and
Emerging Technologies. 1: 211-218.
Zenker, M., Heinz, V., and Knorr, D. 2003. Application of ultrasound-assisted
thermal processing for preservation and quality retention of liquid foods. Journal of Food
Protection. 66 (9): 1642-1649.
Zhang, H. 2007. Pulsed electric field processing. Nonthermal processing of foods.
Pre-Meeting Short Course IFT. Chicago, IL.
Zhang, Q., Barbosa-Cánovas, G.V., and Swanson, B.G. 1995. Engineering aspects
of pulsed electric field pasteurization. Journal of Food Engineering. 25:261-281.
Zhang, Q., Chang, F.J., Barbosa-Cánovas, G.V., and Swanson, B.G. 1994a.
Inactivation of microorganisms in semisolid foods using high voltage pulsed electric
fields. Lebensmittel-Wissenschaft & Technologie. 27(6):538-543.

94
Zhang, Q., Qin, B.L., Barbosa-Cánovas, G.V., and Swanson, B.G. 1994b.
Inactivation of E. coli for food pasterurization by high-intensity-short duration pulsed
electric fields. Journal of Food Processing and Preservation. 19:103-118.
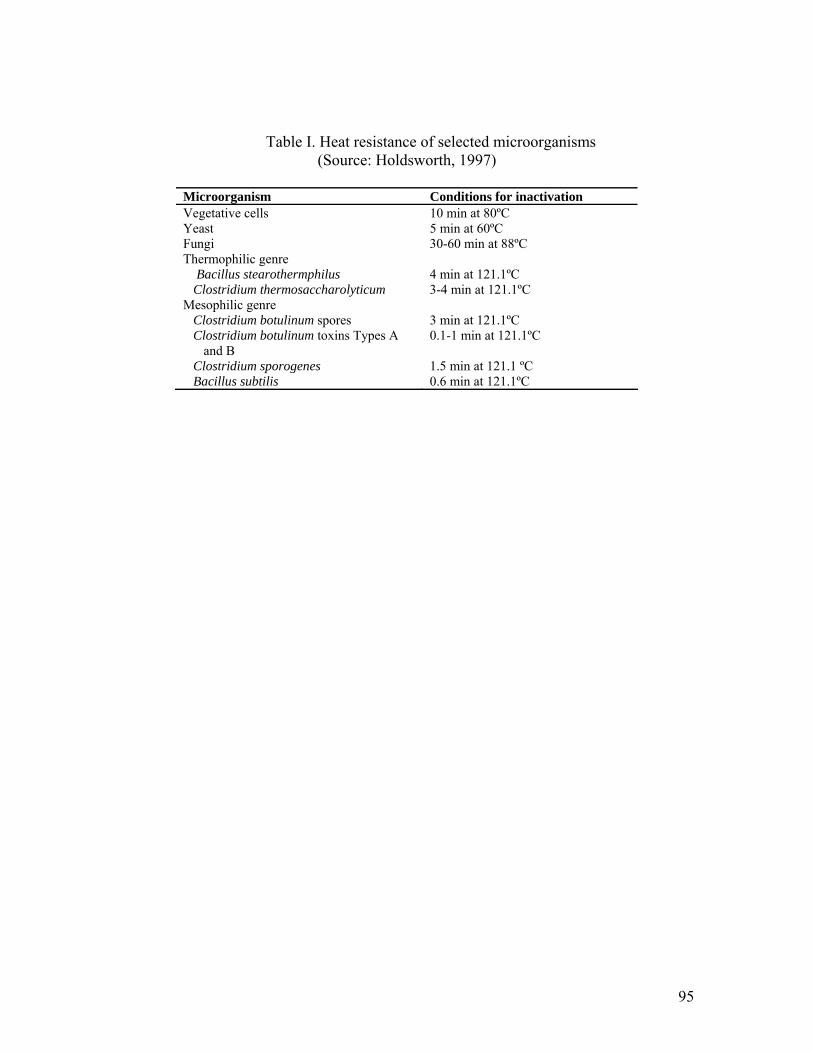
95
Table I. Heat resistance of selected microorganisms (Source: Holdsworth, 1997)
Microorganism Conditions for inactivation Vegetative cells 10 min at 80ºC Yeast 5 min at 60ºC Fungi 30-60 min at 88ºC Thermophilic genre Bacillus stearothermphilus 4 min at 121.1ºC Clostridium thermosaccharolyticum 3-4 min at 121.1ºC Mesophilic genre Clostridium botulinum spores 3 min at 121.1ºC Clostridium botulinum toxins Types A
and B 0.1-1 min at 121.1ºC
Clostridium sporogenes 1.5 min at 121.1 ºC Bacillus subtilis 0.6 min at 121.1ºC
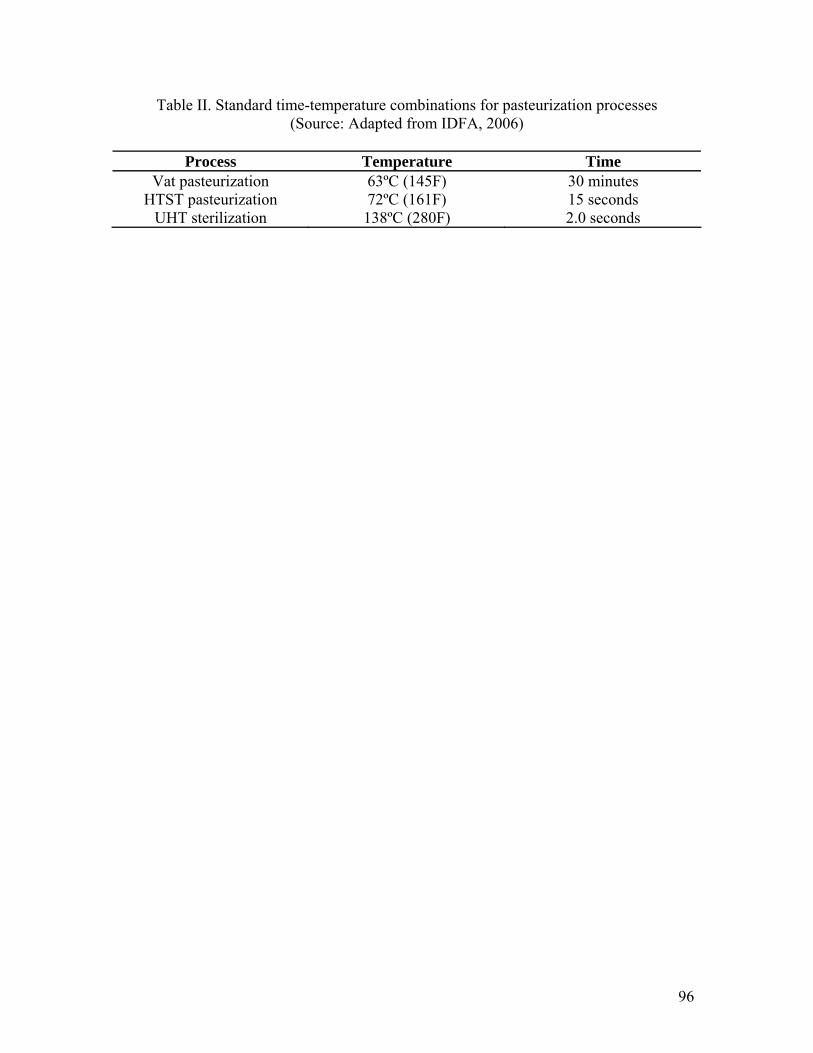
96
Table II. Standard time-temperature combinations for pasteurization processes (Source: Adapted from IDFA, 2006)
Process Temperature Time
Vat pasteurization 63ºC (145F) 30 minutes HTST pasteurization 72ºC (161F) 15 seconds
UHT sterilization 138ºC (280F) 2.0 seconds
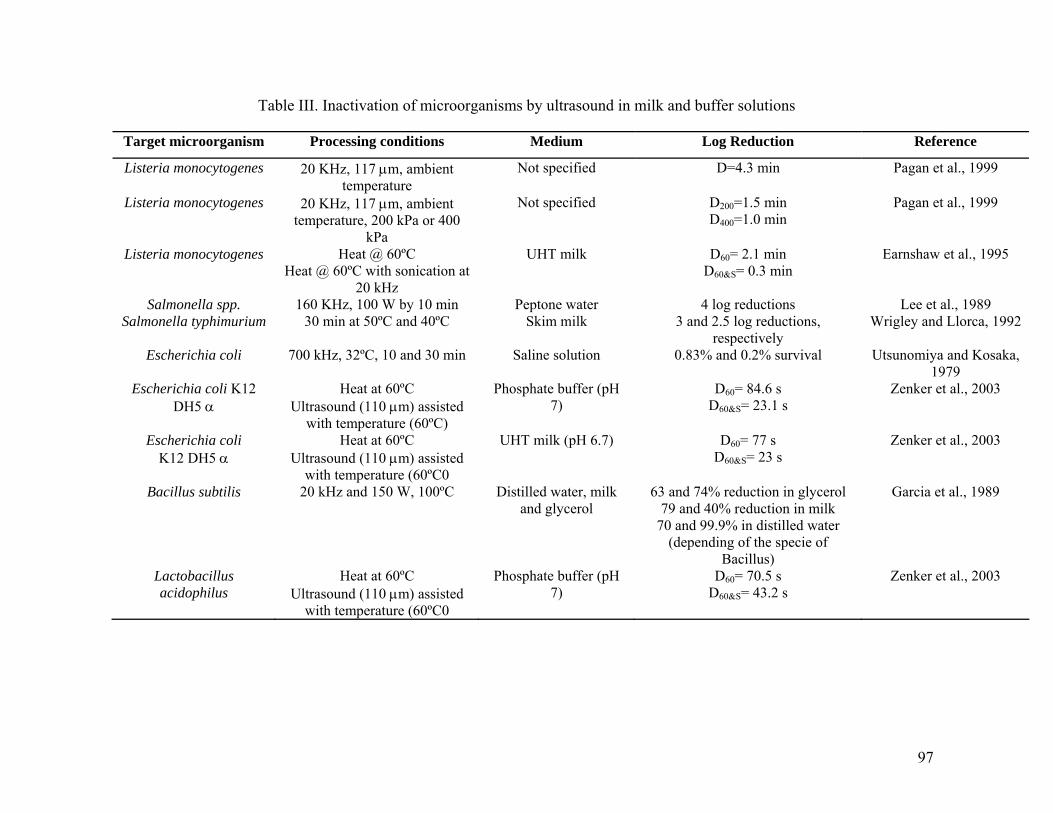
97
Table III. Inactivation of microorganisms by ultrasound in milk and buffer solutions
Target microorganism Processing conditions Medium Log Reduction Reference
Listeria monocytogenes 20 KHz, 117 μm, ambient temperature
Not specified D=4.3 min Pagan et al., 1999
Listeria monocytogenes 20 KHz, 117 μm, ambient temperature, 200 kPa or 400
kPa
Not specified D200=1.5 min D400=1.0 min
Pagan et al., 1999
Listeria monocytogenes Heat @ 60ºC Heat @ 60ºC with sonication at
20 kHz
UHT milk D60= 2.1 min D60&S= 0.3 min
Earnshaw et al., 1995
Salmonella spp. 160 KHz, 100 W by 10 min Peptone water 4 log reductions Lee et al., 1989 Salmonella typhimurium 30 min at 50ºC and 40ºC Skim milk 3 and 2.5 log reductions,
respectively Wrigley and Llorca, 1992
Escherichia coli 700 kHz, 32ºC, 10 and 30 min Saline solution 0.83% and 0.2% survival Utsunomiya and Kosaka, 1979
Escherichia coli K12 DH5 α
Heat at 60ºC Ultrasound (110 μm) assisted
with temperature (60ºC)
Phosphate buffer (pH 7)
D60= 84.6 s D60&S= 23.1 s
Zenker et al., 2003
Escherichia coli K12 DH5 α
Heat at 60ºC Ultrasound (110 μm) assisted
with temperature (60ºC0
UHT milk (pH 6.7) D60= 77 s D60&S= 23 s
Zenker et al., 2003
Bacillus subtilis 20 kHz and 150 W, 100ºC Distilled water, milk and glycerol
63 and 74% reduction in glycerol 79 and 40% reduction in milk
70 and 99.9% in distilled water (depending of the specie of
Bacillus)
Garcia et al., 1989
Lactobacillus acidophilus
Heat at 60ºC Ultrasound (110 μm) assisted
with temperature (60ºC0
Phosphate buffer (pH 7)
D60= 70.5 s D60&S= 43.2 s
Zenker et al., 2003
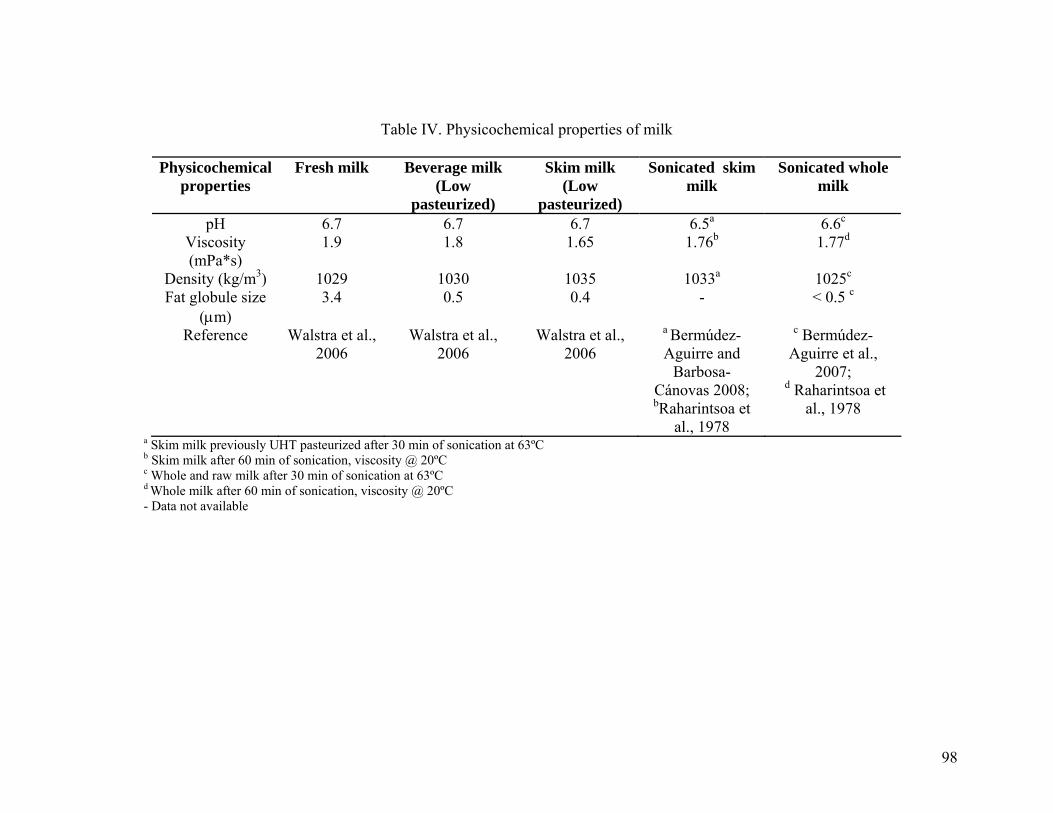
98
Table IV. Physicochemical properties of milk
Physicochemical properties
Fresh milk Beverage milk (Low
pasteurized)
Skim milk (Low
pasteurized)
Sonicated skim milk
Sonicated whole milk
pH 6.7 6.7 6.7 6.5a 6.6c Viscosity (mPa*s)
1.9 1.8 1.65 1.76b 1.77d
Density (kg/m3) 1029 1030 1035 1033a 1025c Fat globule size
(μm) 3.4 0.5 0.4 - < 0.5 c
Reference Walstra et al., 2006
Walstra et al., 2006
Walstra et al., 2006
a Bermúdez-Aguirre and
Barbosa-Cánovas 2008; bRaharintsoa et
al., 1978
c Bermúdez-Aguirre et al.,
2007; d Raharintsoa et
al., 1978
a Skim milk previously UHT pasteurized after 30 min of sonication at 63ºC b Skim milk after 60 min of sonication, viscosity @ 20ºC c Whole and raw milk after 30 min of sonication at 63ºC d Whole milk after 60 min of sonication, viscosity @ 20ºC - Data not available
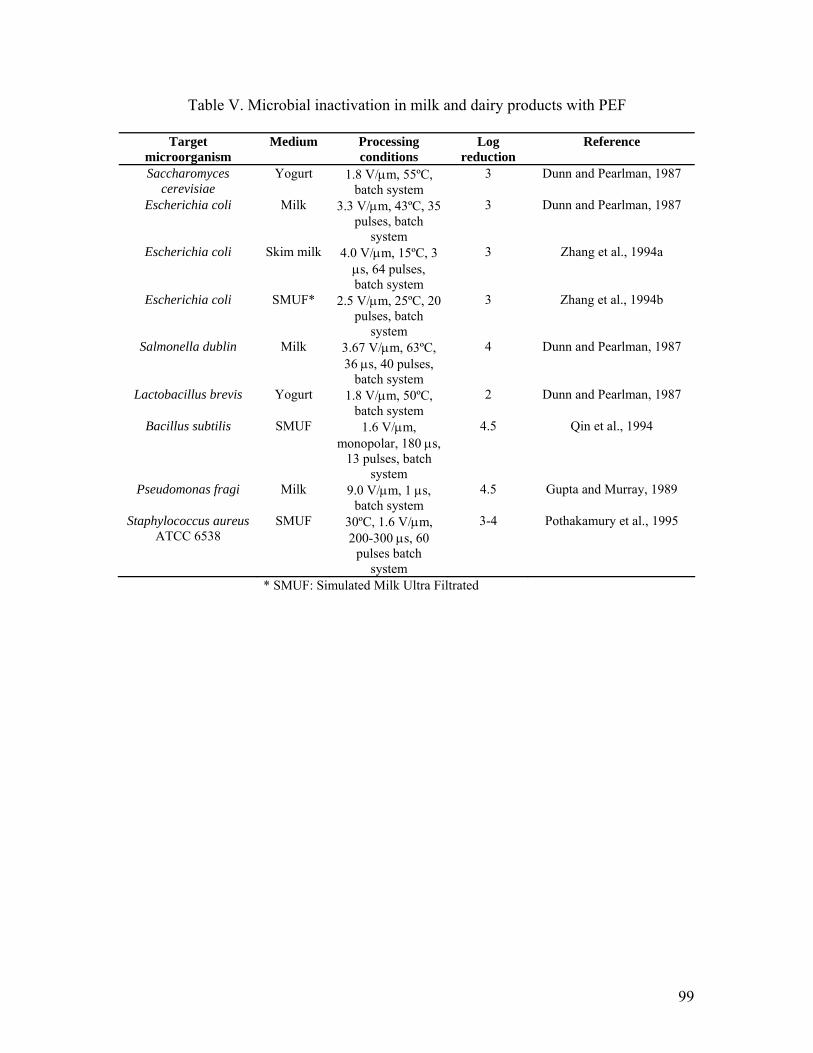
99
Table V. Microbial inactivation in milk and dairy products with PEF
Target microorganism
Medium Processing conditions
Log reduction
Reference
Saccharomyces cerevisiae
Yogurt 1.8 V/μm, 55ºC, batch system
3 Dunn and Pearlman, 1987
Escherichia coli Milk 3.3 V/μm, 43ºC, 35 pulses, batch
system
3 Dunn and Pearlman, 1987
Escherichia coli Skim milk 4.0 V/μm, 15ºC, 3 μs, 64 pulses, batch system
3 Zhang et al., 1994a
Escherichia coli SMUF* 2.5 V/μm, 25ºC, 20 pulses, batch
system
3 Zhang et al., 1994b
Salmonella dublin Milk 3.67 V/μm, 63ºC, 36 μs, 40 pulses,
batch system
4 Dunn and Pearlman, 1987
Lactobacillus brevis Yogurt 1.8 V/μm, 50ºC, batch system
2 Dunn and Pearlman, 1987
Bacillus subtilis SMUF 1.6 V/μm, monopolar, 180 μs,
13 pulses, batch system
4.5 Qin et al., 1994
Pseudomonas fragi Milk 9.0 V/μm, 1 μs, batch system
4.5 Gupta and Murray, 1989
Staphylococcus aureus ATCC 6538
SMUF 30ºC, 1.6 V/μm, 200-300 μs, 60
pulses batch system
3-4 Pothakamury et al., 1995
* SMUF: Simulated Milk Ultra Filtrated
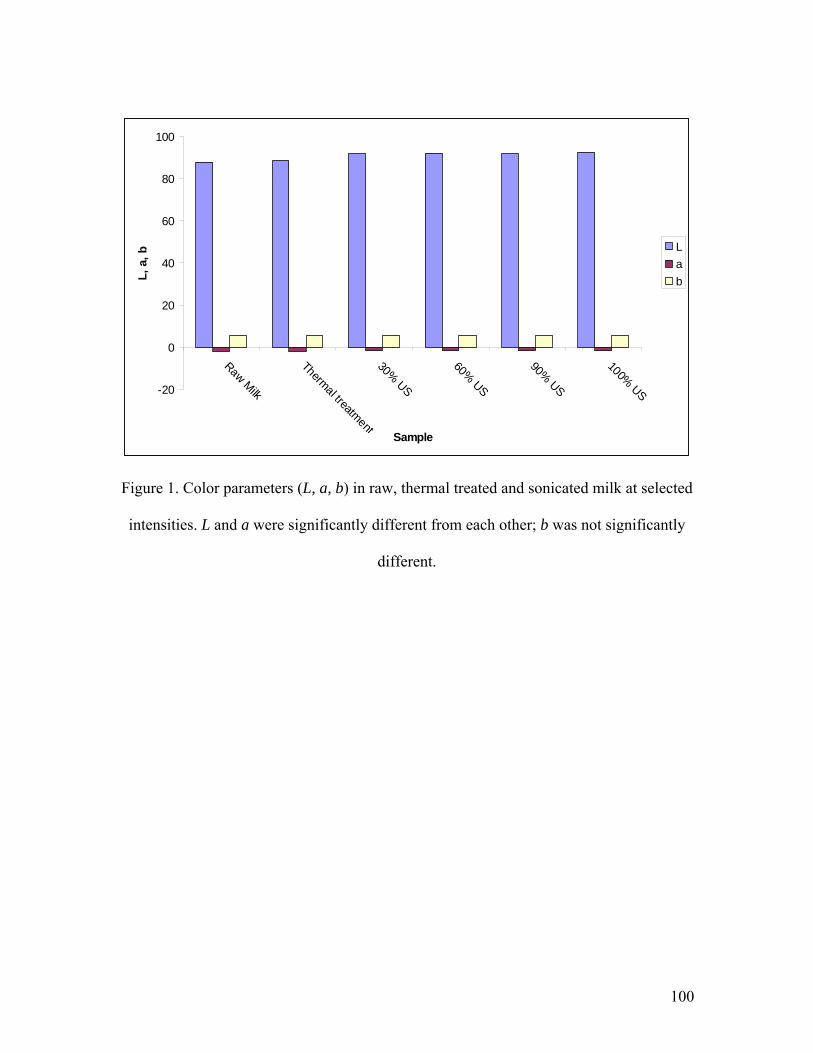
100
-20
0
20
40
60
80
100
Raw Milk
Thermal treatment
30% US
60% US
90% US
100% US
Sample
L, a
, b
Lab
Figure 1. Color parameters (L, a, b) in raw, thermal treated and sonicated milk at selected
intensities. L and a were significantly different from each other; b was not significantly
different.
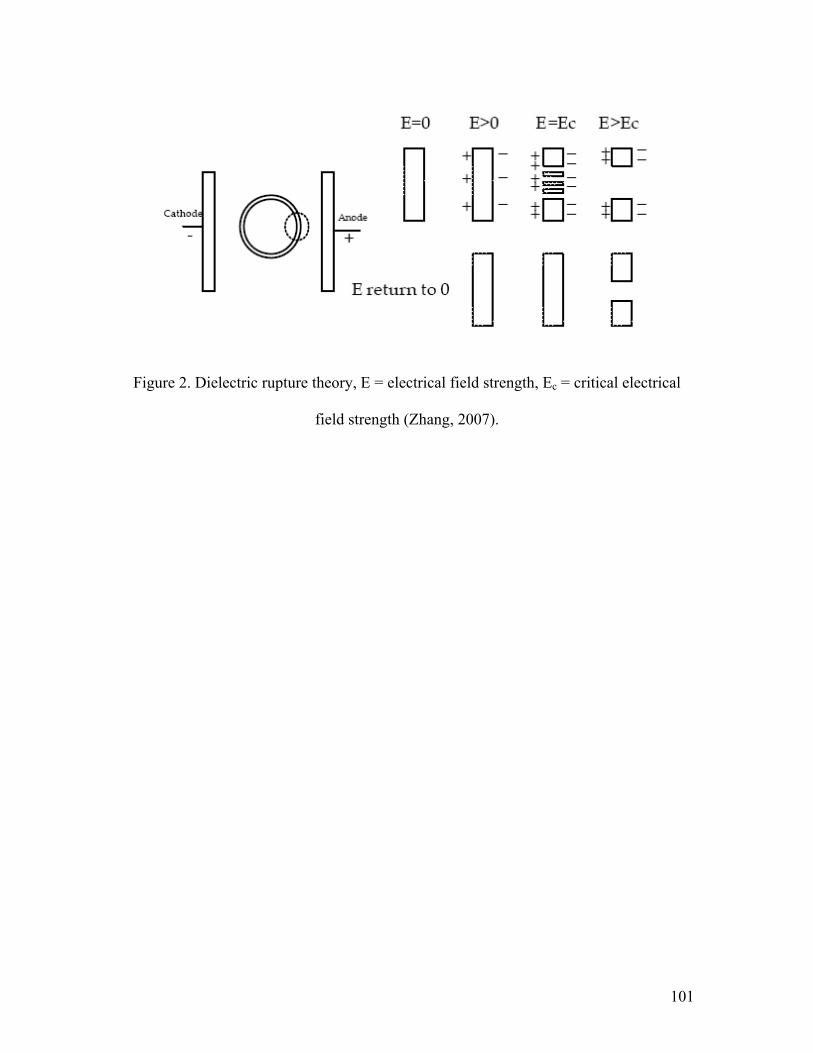
101
Figure 2. Dielectric rupture theory, E = electrical field strength, Ec = critical electrical
field strength (Zhang, 2007).
102
CHAPTER TWO
MODELING THE INACTIVATION OF Listeria innocua IN RAW WHOLE MILK
WHEN TREATED BY THERMO-SONICATION
Daniela Bermúdez-Aguirre, Maria G. Corradini, Raymond Mawson
and Gustavo V. Barbosa-Cánovas
Abstract
Ultrasound was used to pasteurize milk and to study inactivation of Listeria innocua.
Five systems were evaluated in an ultrasonic processor (24 kHz, 120 μm, 400 W). Tested
amplitudes of ultrasonic waves were 0%, 30%, 60%, 90% and 100%, with a constant
temperature of 63ºC and treatment time of 30 min. pH, acidity and color were measured.
After 10 min of treatment, thermal pasteurization achieved 0.69 log-reduction. Using
ultrasound at 60, 90 or 100% in combination with temperature, a 5 log-reduction was
obtained after 10 min. For thermal treatment, a 5.3 log-reduction was reached after 30
min. The heat and the toughest thermo-sonication survival curves were best fitted using a
Weibullian model. However, an alternative-four parameter model was selected for the
mildest thermo-sonication treatment (30%). pH was slightly lower (6.64), acidity was
increased (0.141%) and color of samples were whiter (92.37) as the intensity of thermo-
sonication increased.
103
1. Introduction
Throughout the world, milk is a common product that is highly consumed, regardless its
source. Raw milk is still consumed in rural communities in some underdeveloped
countries despite the health risks associated to this practice. Pasteurization of milk is the
most effective technique to destroy pathogenic bacteria, to inactivate some enzymes and
to extend the shelf-life of the product. However, with the higher temperatures used during
inactivation of pathogenic bacteria, in conventional processes using plate heat
exchangers, many quality factors, such as flavor and nutritional content are affected. For
this reason, it is necessary to look for alternative technologies to pasteurize milk avoiding
the thermal treatment adverse effects, while still assuring food safety. According to
United States’ standard, bacterial count in Grade A raw milk may not exceed 300,000
cfu/ml, and in the European Community the bacterial count should be lower than 100,000
cfu/ml. After pasteurization, in the United States the milk should contain less than 20,000
cfu/ml (Jensen, Blanc & Patton, 1995). When milk has a microbial population between
500,000 and 10,000,000 cfu/ml, it is clear that hygienic practices have failed (Paci,
1953). Above 50ºC, inactivation of sensitive enzymes in milk begins. During
conventional high temperature, short time pasteurization (HTST) at 71.8ºC for 15 s, two
of the main enzymes in milk, milk lipase and alkaline phosphatase, are inactivated
(Keenan & Patton, 1995). In addition to nutritional properties, sensorial characteristics of
milk are very important for consumer acceptance; one of these characteristics is color.
Whiteness in milk has been shown to have a positive influence on consumer preference.
White color of milk is due to the presence of fat globules and casein micelles, which
scatter the light (Owens, Brewer & Rankin, 2001; Phillips, McGiff, Barbano & Lawless,

104
1995). In order to pasteurize food without the use of high temperature, some alternative
nonthermal technologies have been proposed, such as high hydrostatic pressure, pulsed
electric fields, ultrasound or ultraviolet treatment; some of them appear to be viable. But
to date, only high hydrostatic pressure has been approved by the USDA for use in food
products such as juices and other liquid beverages and pulsed electric fields and
ultraviolet treatment for some specific juices.
Ultrasound is a novel technology in food engineering that is currently being
tested, focusing on microbial and enzymatic inactivation; but ultrasound as a technique to
destroy bacteria is not new and is widely used laboratory method for cell lysis. Examples
closer to food processing include the application of ultrasound to inactivate bacteria in
milk targeting coliform microorganisms Staphylococcus aureus, Bacillus subtilis and
Salmonella typhimurium; enzymes that have been studied include peroxidase, lipase and
protease (Villamiel, van Hamersveld & de Jong, 1999; Carcel, Benedito, SanJuan &
Sánchez, 1998). Other microorganisms tested in different media and studied under
sonication conditions include some species of Salmonella (Cabeza, Ordoñez, Cambero,
De la Hoz & García, 2004; Lee, Kermasha & Baker, 1989; Wrigley & Llorca, 1992);
Escherichia coli (Furuta et al., 2004; Ugarte-Romero, Feng, Martin, Cadwallader &
Robinson, 2006); Saccharomyces cerevisiae (Guerrero, López-Malo & Alzamora, 2001;
Guerrero, Tognon & Alzamora, 2005); Listeria monocytogenes (Pagán, Mañas, Alvarez
& Condón, 1999); among others. Many foodborne outbreaks have been reported in the
food industry (Mohan Nair, Vasudevan & Venkitanarayanan, 2005; Ko & Grant 2003;
Kozak, Balmer, Byrne & Fisher, 1996; Klima & Montville, 1995) related to
underprocessing and consequently survival of pathogenic bacteria or post-pasteurization
105
contamination. Listeria monocytogenes is one of the leading foodborne pathogenic
microorganisms generating problems in the food industry, followed by Salmonella,
Escherichia coli 0157:H7, Clostridium botulinum, Campylobacter and Staphylococcus
aureus (Banasiak, 2005). Listeria monocytogenes can survive under a broad range of
temperatures (1ºC to 45ºC) and pH (4.1 to 9.6) conditions. Affected products include raw
milk, pork, raw poultry, ground beef, and some vegetables (Jay, 1992), cheese, seafood,
and fruits (Mohan Nair, Vasudevan & Venkitanarayanan, 2005). In addition to being a
widespread bacterium in the environment, L. monocytogenes can compete with other
microorganisms, grow at refrigeration temperatures, and survive freezing and high salt
concentrations (Kornacki, 2005). In the United States, 2,500 cases of listeriosis from
food are reported every year; 500 of them end in death, not to mention associated severe
economic losses. One of the main sources of Listeria is recontamination of food in the
processing environment (Kornacki, 2005; Kozak, Balmer, Byrne & Fisher, 1996). Dairy
products are more likely to be contaminated with Listeria because of the conditions in the
production facilities, the environment (animals and farms) and storage temperatures
(Kozak, Balmer, Byrne & Fisher, 1996).
Thermal inactivation of microorganisms is usually assumed to follow first order
kinetics; this assumption is based on the idea that all cells or spores have the same
sensitivity to heat (Peleg & Cole, 1998; McKellar & Lu, 2004; Hassani, Álvarez, Raso,
Condón & Pagán, 2005). If so, the typical relationship between the number of
microorganisms (N) and the treatment time (t) is shown in equation (1), where k
represents the reaction constant:

106
kNdtdN
=− (1)
Several studies (e.g. van Boekel, 2002) have shown that the survival curves of some
microorganisms under different conditions of inactivation have downward or upward
concavities and that the first order kinetics or a linear relationship between N and t is not
followed for a number of reasons. McKellar and Lu (2004) classify the explanations for
nonlinear behavior throughout thermal inactivation into limitations in the experimental
procedure (variability in heating procedures, mixed cultures or populations, clumping,
protective effect of dead cells, method of enumeration, poor statistical design) and normal
features of the inactivation process (heat sensitivity, heat adaptation, heat transfer)
(Chung, Wang & Tang, 2007). Mathematical models to describe the death of
microorganisms in foods have been proposed since the 1920s; log normal distributions
have been used since 1942 in an attempt to explain the nonlinearity in survival curves
(McKellar & Lu, 2004). Several equations have been proposed to characterize the growth
and inactivation behavior of bacteria. For example, for Listeria monocytogenes, logistic
and log-logistic equations have been used to model heat sensitivities (Peleg & Cole,
1998). But seldom any particular model has been proposed to address the nonthermal
inactivation of Listeria monocytogenes (Buchanan, Golden, Whiting, Phillips & Smith,
1994). A model proposed by Peleg and Cole (1998) based on Weibull distribution has
been proven very useful to fit survival curves with upward or downward concavities or
linear trends. This equation has been used to model inactivation data from some emerging
technologies such as high pressure or pulsed electric fields that do not follow a first order
kinetics (Hassani, Álvarez, Raso, Condón & Pagán, 2005; Rodrigo, Ruíz, Barbosa-
107
Cánovas, Martínez & Rodrigo, 2003). Emerging technologies such as high pressure,
pulsed electric fields, microwave and ohmic heating now face the challenge of producing
fresh-like products, while at the same time ensuring food microbiology safety (Peleg &
Cole, 1998; Gaze 2005).
In this study, the inactivation of Listeria innocua ATCC 51742 as a surrogate of
Listeria monocytogenes was tested in raw whole milk because of its importance in dairy
products. The objective of this research was to evaluate the use of different ultrasound
intensities in combination with heat treatment in the inactivation of Listeria cells
compared with conventional batch pasteurization in raw whole milk, and to evaluate
some quality characteristics such as pH, acidity and color. At the same time, adequate
mathematical models were sought to describe the inactivation of bacteria under this
emerging technology.
2. Materials and methods
2.1. Milk samples
Raw and whole cow’s milk was obtained from Washington State University’s Creamery
(Pullman, WA). Milk was kept in refrigeration at 4ºC until it was used. Characterization
of raw milk and thermal and thermo-sonicated milk included pH, lactic acid content and
color. The initial microbial load (mesophilic bacteria) and the absence of Listeria cells
were tested for raw milk.
108
2.2. Microbiological analysis
2.2.1. Growth and inoculum of Listeria innocua cells
Two ml of thawed Listeria innocua cells (ATCC 51742) (one ml of microorganism
grown in the early stationary phase plus one ml of sterile glycerol) stored at -21ºC were
added to 100 ml Tryptic Soy Broth (TSB, Bacto: Becton, Dickinson and Co., Sparks,
MD) with 0.6% Yeast Extract (YE, Bacto, Becton, Dickinson and Co., Sparks, MD).
Microorganisms were kept in a bath shaker at 37ºC and 218 rpm until they reached the
early stationary phase, approximately after 11 hr. Milk samples were inoculated with
Listeria innocua ATCC 51742 in a ratio of 1:100 (bacteria:milk) (V/V).
2.2.2. Enumeration of Listeria and mesophilic bacteria
Serial dilutions were made in Peptone water (0.1%) with samples taken from thermal,
thermo-sonicated and raw milk to evaluate the microbial load of mesophiles. After that,
samples were pour-plated in Plate Count Agar (Difco, Becton, Dickinson and Co.,
Sparks, MD), dishes were incubated at 35ºC for 48 h, and bacteria were counted. For
Listeria innocua, after the serial dilutions, samples were pour-plated in Tryptic Soy Agar
(TSA Difco, Becton, Dickinson and Co., Sparks, MD) with 0.6% of Yeast Extract (Bacto,
Becton, Dickinson and Co., Sparks, MD). Dishes were incubated at 35ºC for 48 h, and
then bacteria loads were counted.
109
2.3. Thermal and thermo-sonication treatments
2.3.1. Thermal treatment
The thermal treatment was carried out in a double-walled vessel of 500 ml with an
internal diameter of 8 cm and a depth of 13.5 cm. Equal volumes of milk were used for
each treatment, and the temperature of the medium was kept at 63 ± 0.5ºC with the use of
a heating bath maintained at 65ºC to allow heat transfer. Temperature was monitored by a
pre-calibrated thermocouple. A magnetic stirrer was used inside of the vessel to assure
the homogeneity of the samples throughout the treatment. Samples were taken every 2
min of treatment for microbiological analysis and transferred to tubes with peptone water.
After 30 min of thermal treatment, samples were transferred to sterile bottles and held at
4ºC until they were used for color measurements and pH and acidity content.
2.3.2. Thermo-sonication treatments
500 ml of raw whole milk were placed in a double-walled vessel (500 ml) that served as a
treatment chamber.
An ultrasonic processor (Hielscher USA, Inc., Ringwood, NJ, model UP400S),
400 W, 24 kHz, 120 microns with a 22 mm diameter probe introduced into the vessel. A
magnetic stirrer was used inside the treatment chamber to assure homogeneity of the
samples. Ultrasonication was carried out at 30%, 60%, 90% and 100% (40μm, 72 μm,
108 μm and 120 μm, respectively) of amplitude of the ultrasound wave and 63 ± 0.5 ºC
of temperature. Temperature was set up and kept constant via a refrigerated bath (VWR
Scientific Model 1166, Niles IL). A thermocouple was used in the treatment chamber to
monitor the temperature (63 ± 0.5ºC) throughout the experiments. As in the case of
110
thermal treatment samples were taken every 2 min of thermo-sonication and transferred
to tubes with peptone water to perform microbiological analysis. After 30 min, the
samples were transferred to sterile bottles and held at 4ºC until they were used for color
measurements and physicochemical analysis.
2.4. Physicochemical characteristics
2.4.1. pH and titratable acidity
pH was determined by direct immersion with a potentiometer (Orion Research, Inc.,
Boston, MA). Following that step, titratable acidity was determined using a
potentiometer. Ten ml of raw or processed milk were poured into a beaker with 20 ml of
distilled water with constant agitation. Milk was titrated at room temperature with a 0.1 N
NaOH solution. The end point was reached when the potentiometer showed 8.3. Acidity
was expressed as a percentage of lactic acid (1 ml of 0.1 N NaOH = 0.009 g of lactic
acid). The experiments were preformed in triplicate.
2.4.2. Color
Lightness to darkness (L*) (100 to 0), redness(+) to greenness(-) (a*), and yellowness(+)
to blueness(-) (b*) color parameters were determined using a Minolta CM-2002
spectrophotometer (Minolta Camera Co., Osaka, Japan) in the reflection mode. Twenty
ml of raw and thermo-ultrasonicated milk samples were poured into sterile plastic bags.
A white ceramic plate was used for standardizing the instrument (L* = 93.4, a* = -0.67,
b* = 0.78). Two bags were used for each system, and each measurement was performed
in triplicate.
111
2.5. Modeling and statistical analysis
Non-linear models, chosen on the basis of the general appearance of the survival curves,
were used to characterize the inactivation data of Listeria innocua cells.
Firstly, the experimental data was fitted with the Weibullian model, shown in
equation (2):
ntbN
tNLog *)(
0
−= (2)
where N(t) and N0 are the momentary and initial microbial counts respectively, t is the
treatment time, b is a rate parameter related to the velocity of inactivation of the
microorganism (min-1) and n is a shape factor; a measure of the semilogarithmic survival
curve’s concavity.
A four-parameter mathematical model [equation (3)] was used to describe
sigmoidal survival curves
2121
0
)( nn tktkN
tNLog = (3)
where k1, k2, n1 and n2 are constants.
All models were fitted using Mathematica® (Wolfram Research, Champaign, IL), and
the statistical analysis was conducted with Microsoft Excel®.
112
3. Results and discussion
3.1. Microbial inactivation
In Figure 1 microbial inactivation for thermal and thermo-sonication treatments is
depicted. The graph corresponds to the inactivation of Listeria innocua in which the
effect of conventional batch pasteurization (63ºC and 30 min) is observed; after
completing the total treatment time, 5.3 log reductions are achieved. In this case, as
observed in Figure 1, an almost linear relationship between the number of survivors and
treatment time is generated with just the thermal treatment, only a slight upward
concavity is observed. In this case, the first order kinetics could be considered as a
modeling option in order to obtain the D values for Listeria inactivation. Nevertheless, in
thermo-sonication treatments, different behaviors are observed through inactivation; with
the mildest thermo-sonication treatment (30%), cells maintain a constant period of
inactivation at the first stage that lasts from 10-20 min of treatment. This lapse of time
seems to be a crucial time for inactivation and weakening of the cells; at the end of the
treatment, the inactivation of more than a 5 log reduction is achieved. In the case of
stronger thermo-sonication treatments (intensities of 60, 90 and 100%), a similar
behavior can be observed through inactivation; after 10 minutes of treatment, more than a
5 log reduction is obtained, although in the case of treatment at 60% of amplitude wave at
the end of the process, there is a point outside of the inactivation trend, known as a “tail.”
Tailing is related with the presence of “artifacts” during the process, but also with the
mechanism of inactivation or resistance. The term “artifact” refers to anything that
interferes with the linear survival curve. The expression of heat shock proteins due to the
induction of heat resistance is one of the attributed causes of tailing (McKellar & Lu,
113
2004; Chung, Wang & Tang, 2007). The presence of subpopulations that are genetically
more resistant is another cause of tailing (Buchanan, Golden, Whiting, Phillips & Smith,
1994). In this case, the last point of treatment at 60% of ultrasound intensity could be
due to a protective effect from the dead cells, clumping or even the medium, because this
milk contains more than 3.5% butter fat content. If survival cells were clumped and
surrounded by dead cells, or even protected by the fat globules of milk, after 20 min this
clump could be broken and release live cells, generating the tailored shape of the curve.
For the last two thermo-sonication treatments (90 and 100%), it is clear that the
combination of ultrasound, acting together with heat in the inactivation of cells, reduces
the treatment time from 30 min to 10 min, compared with thermal treatment, which could
be an advantage in many aspects of processing. It is important to highlight the fact that
ultrasound is considered as a nonthermal technology because the main lethality effect in
cells is related to preservation factors other than heat. In this case, heat is probably
facilitating inactivation by weakening the cell, but the key reason is the effect of
cavitation, generated by ultrasound, which promotes cell disruption.
In Table 1, the inactivation of mesophilic bacteria is shown. The results observed
for the combined treatments (ultrasound & heat) are similar to those observed for Listeria
cells. Ultrasound in this case applied at 60, 90 or 100% intensity in addition to the
conventional thermal treatment (63ºC); speeds up the inactivation rate. All of these
treatments reduce the natural flora of raw milk by 3 log - reductions in the first 10
minutes of treatment compared to batch pasteurization, in which, after 10 minutes, only
about 1.89 log - reductions are achieved. For the treatment performed at the lowest
ultrasound intensity (30%), an “activation shoulder” is shown to “increase” the
114
population of microorganisms. The reason for the shoulder could be attributed to the
presence of dormant spores in the initial population of milk, followed by the stimulation
of the cells due to sonication, generating a higher number of mesophiles compared with
the initial population. According to the literature, low intensity ultrasound has been used
in the stimulation of living cells and enzymes (Knorr et al., 2004; Chemat & Hoarau,
2004). But even though power ultrasound was used as an inactivation factor in this work,
it is questionable whether 30% ultrasonication was enough to activate the spores, to
promote their growth in the first minutes of treatment and to injure the cells at the end of
the treatment. Earnshaw, Appleyard & Hurst (1995) mention that as the amplitude of the
ultrasound wave is increased, the intensity of cavitation also increases. This “tailing,” as
observed for treatment at 30%, corresponds to the linear type of “activation shoulder”
according to Corradini and Peleg (2003).
3.2. Modeling
As mentioned previously, thermal processing is based on assumptions of linear
relationships between survival fractions and time. In this work, an important focus is the
modeling of the destruction rate of Listeria innocua, because the pathogenic
microorganism is of great interest in food science due to its wide range of growth
conditions, especially in refrigerated products. Currently, there is scarce information in
predictive microbiology related to ultrasound inactivation. Because of the recent interest
in that technology for food preservation the inactivation data for Listeria innocua was
chosen to be fitted with some available models.
115
Using the thermal treatment data for Listeria inactivation, it behaves in a nearly
linear fashion a D value can be calculated (5.43 min), and the fit of the model (data not
shown) is r2 0.9298. Deviations in the linearity of inactivation of Listeria cells is related
to heat shock, that is heat damage and repair mechanisms of the microorganism (Hassani,
Álvarez, Raso, Condón & Pagán, 2005). In order to compare the effectiveness of all
treatments, D values cannot be calculated in the thermo-sonication processes because of
the non-linearity of the plots. Applying first order kinetics to sonication curves would
violate the basic concepts of thermal processing theory. In order to achieve a
mathematical approach to explain and describe the behavior of Listeria cells under
thermo-sonication treatments, various mathematical equations were fit to the data. The
distributions shown for each treatment are the best fit for each one.
3.2.1. First model: Weibull distribution
In Figure 2 the thermal treatment curve is fitted using equation (2) as a model. The values
of the model’s parameters, namely b and n for this model are shown in Table 2. For heat
inactivation of Listeria innocua, the shape factor n is 1.73 and the rate parameter b is
0.016. For the toughest thermo-sonication treatment (100%), the shape factor n was lower
(0.23), and the rate parameter b was higher (2.7). If n < 1, the shape of the survival curve
is concave upwards (tailings), while when n > 1, the shape is concave downward
(shoulders). Both shape factors show a concavity downward in the survival curves, being
more prominent in thermal treatment. Some survival curves of Listeria monocytogenes
under elevated temperature conditions and chemical agents also showed downward
concavity. The fitted model at 62ºC had b equal to 1.722 and n of 0.900 (Peleg &

116
Penchina, 2000). Ugarte-Romero, Feng, Martin, Cadwallader and Robinson (2006)
reported an n value of 1.95 for heat-treated Escherichia coli at 55ºC in apple cider and a
range of shape factors (n) from 0.547 to 0.720 of the same bacteria subjected to thermo-
sonication (20 kHz and 0.46 W/ml) from 40ºC to 60ºC. “Shoulders” in survival curves of
bacteria subjected to different treatments are reported by many authors using the Weibull
model; for example, Escherichia coli under treatment of Pulsed Electric Fields had n
values from to 0.052 to 0.72 (Rodrigo, Barbosa-Cánovas, Martínez & Rodrigo, 2003) and
from 0.483 to 0.579 (Álvarez, Virto, Raso & Condón, 2003); thermal inactivation of
spores had n values from 0.97 to 2.03 (Fernández, Salmerón, Fernández & Martínez,
1999). The rate parameter b shows the velocity of inactivation of the cells, and according
to the data derived from the model, the inactivation is faster in thermo-sonication than in
thermal treatment, confirming the positive effect of sound waves on inactivation rate.
Some references (Ugarte-Romero, Feng, Martin, Cadwallader & Robinson, 2006) show
that by increasing the temperature, ultrasound is more effective and faster than thermal
treatment alone for inactivation, according to the b values reported, increasing the lethal
effect of the treatment (Álvarez, Virto, Raso & Condón, 2003; Rodrigo, Barbosa-
Cánovas, Martínez & Rodrigo, 2003). According to the MSE for that research, the
Weibull model best fitted the survival curve obtained during the thermo-sonication at
90%. Concavity in survival curves is attributed to the properties of the primary
distribution of the lethal effects in addition to the accumulative effect of the heat or lethal
agent in the cells. A downward concavity might be related to weakening of the cells
because of the exposure to the lethal agent and the speeding up of the destruction rate of
them (Peleg & Penchina, 2000).
117
This behavior, as shown in Figure 3, corresponds to the mildest thermo-sonication
inactivation (30%) of Listeria innocua, although this data for sonication does not fit very
well according to the Weibull model. The shape of the survival curve shows two trends:
an upward concavity followed by a downward concavity, which can be described as
sigmoid shaped. For that reason, a second model was proposed in order to describe the
inactivation behavior.
3.2.2. Four-parameter model
In Figure 3 the sigmoid shape of the thermo-sonicated (30%) inactivation of Listeria
innocua is shown. This curve shows a first stage that has an upward concavity at the
beginning of the treatment, followed by a change toward a downward concavity at the
end of the inactivation. The upward concavity at the beginning is a clear indication that
the weakest cells are inactivated in the first minutes of treatment, followed by an almost
stable period in the middle of the treatment in which the toughest cells are showing
resistance. However, those cells are accumulating damage from the heat and ultrasound
effects, ending in a faster inactivation because of the increase of the damage. This type of
survival curve is common, but not typical (Peleg & Penchina, 2000).
In Figures 4, 5 and 6 the survival curves corresponding to higher intensities of thermo-
sonication (60%, 90% and 100%) are shown. Weibull equation can be fitted to these data
with good results as shown in Table 2. However the four parameter model can also be
used. There is a transition between sigmoid shape to upward concavity as the intensity is
increased. Fitting equation (3) to the survivors data at 60%, 90% and 100%, k2 become 0,
so equation (2) and (3) are equivalent because k2tn2 is zero. The fitted parameters for
118
these three survival curves are shown in Tables 2 and 3. As the intensity of the treatment
increases, k1 also is higher; meanwhile, for n1 the value decreases with higher intensities.
k1 is related to the inactivation rate (min); in this case, as the intensity of the ultrasound
increases, the rate decreases, although the difference is just a few seconds, meaning that
they are similar treatments. The expected trend was the decrease of k1 as the intensity was
increased, as reported in other inactivation studies, such as with the increase of
temperature in the inactivation of Clostridium botulinum spores (Peleg & Penchina,
2000) and Bacillus stearothermophilus (Corradini & Peleg, 2003). k2 values show that
with higher intensity, the upward concavity is decreased. Some references have shown
this equation fitted to heat inactivation data of Clostridium botulinum spores without a
defined trend in k2 parameter as the temperature was increased (Peleg & Penchina, 2000),
but also without a defined trend in the survival curves of Bacillus stearothermophilus
because of the scattering of the data and the few parameters evaluated (Corradini &
Peleg, 2003).
3.3. Physicochemical characteristics
In Table 4 the initial and final conditions of pH, acidity and color parameters are reported
for all systems. The pH of milk decreased regardless of the treatment, from the initial
value of 6.80 to 6.74 for heat treated milk and 6.64 (average) for the thermo-sonicated
milk. Respectively, acidity was increased in samples from 0.109% (raw milk) to 0.126%
(thermal) and 0.141% (thermo-sonicated). According to Neville and Jensen (1995), the
physical-chemical properties reported for bovine milk are pH in the range of 6.22 to 6.77,
119
and the titratable acidity as 0.16 ± 0.02. Both pH and acidity of thermo-sonicated milk are
inside the range considered as permissible for milk quality standards.
According to the color data shown in Table 4, thermo-sonicated milk has an
important change in luminosity as ultrasound intensity is increased. L values increased as
the amplitude of the sound wave was higher, that is the intensity of the cavitation inside
the medium was stronger. The reason for that is the homogenization that the sonication is
generating in the fat content of the milk; this increase in the luminosity was appreciated
by sight as a whiter color. The heated milk had a similar luminosity as that in the raw
milk. In apple cider treated with thermo-sonication treatments, the L value slightly
increased after the process in comparison with the original product (Ugarte-Romero,
Feng, Martin, Cadwallader & Robinson, 2006). Also, some studies have shown that as
the fat content in milk is increased, the samples are whiter (Phillips, McGiff, Barbano &
Lawless, 1995); in the case of the present experiment, the reason for higher L values is
the possible breakage of fat globules in milk due to the disruption of membranes
generated by ultrasound, releasing the triacylglycerols content of the globules and making
the fat content more “available.” According to the a values, the milk is closer to the
greenness region of the Hunter’s color scale; specifically, the heated milk and the b
values are very similar among all of the samples, indicating that there is an important
yellow contribution to the color of milk. The most yellow sample is raw milk in all color
measurements, a higher standard deviation was observed in raw milk because of the non
homogenization of the product; even though the sample was agitated before each
analysis, the presence of some fat clumps was observed.
120
4. Conclusions
Ultrasound is a viable technology to inactivate pathogenic bacteria in milk in shorter
times without important changes in the pH and acid lactic content, along with better
appearance and homogenization. Modeling of survival curves of thermal and thermo-
sonicated bacteria showed good fit with the Weibull distribution and the four parameter
model, but no extrapolation could be conducted because of the uncertainty of the data
trends shown in many research works. This modeling is just one of the first attempts to
find some mathematical equations that may describe the inactivation rates of bacteria
under an emerging technology such as ultrasound.
References
Álvarez, I., Virto, R., Raso, J., & Condón, S. (2003). Comparing predicting
models for the Escherichia coli inactivation by pulsed electric fields. Innovative Food
Science and Technologies, 4, 195-202.
Banasiak K. (2005). News. Food Technology, 59(11), 13-14.
Buchanan, R.L., Golden, M.H., Whiting, R.C., Phillips, J.G., & Smith, J.L.
(1994). Nonthermal Inactivation Models for Listeria monocytogenes. Journal of Food
Science, 59(1), 179-188.
121
Cabeza, M.C., Ordóñez, J.A., Cambero, I., De la Hoz, L., & García, M.L. (2004).
Effect of thermoultrasonication on Salmonella enterica Serovar Enteritidts in distilled
water and intact shell eggs. Journal of Food Protection, 67(9), 1886-1891.
Carcel, J.A., Benedito, J., SanJuan, N., & Sánchez, E. (1998). Aplicación de los
ultrasonidos en las industrias de productos lácteos y derivados. Alimentación. Equipos y
Tecnología. 135- 141.
Chemat, F., & Hoarau, N. (2004). Hazard analysis and critical control point
(HACCP) for an ultrasound food processing operation. Ultrasonics sonochemistry, 11,
257-260.
Chung, H.J., Wang S. & Tang, J. 2007. Influence of heat transfer with tube
methods on measured thermal inactivation parameters for Escherichia coli. Journal of
Food Protection. 70(4): 851-859.
Corradini, M.G., & Peleg, M. (2003). A theoretical note on estimating the number
of recoverable spores from survival curves having an “activation shoulder”. Food
Research International. 36(9-10), 1007-1013.
Earnshaw, R.G., Appleyard, J., & Hurst, R.M. (1995). Understanding physical
inactivation processes: Combined preservation opportunities using heat, ultrasound and
pressure. International Journal of Food Microbiology, 28, 197-219.
122
Fernández, A., Salmerón, C., Fernández, P.S., & Martínez, A. (1999). Application
of a frequency distribution model to describe the thermal inactivation of two strains of
Bacillus cereus. Trends in Food Science & Technology, 10, 158-162.
Furuta, M., Yamaguchi, M., Tsukamoto, T., Yim, B., Stavarache, C.E., Hasiba,
K., & Maeda, Y. (2004). Inactivation of Escherichia coli by ultrasonic irradiation.
Ultrasonics sonochemistry, 11(2), 57-60.
Gaze, J. (2005). A review: Microbiological aspects of thermally processed foods.
Journal of Applied Microbiology, 98, 1381-1386.
Guerrero, S., López-Malo, A., & Alzamora, S.M. (2001). Effect of ultrasound on
the survival of Saccharomyces cerevisiae: Influence of temperature, pH and amplitude.
Innovative Food Science & Emerging Technologies, 2, 31-39.
Guerrero, S., Tognon, M., & Alzamora, S.M. (2005). Response of Saccharomyces
cerevisiae to the combined action of ultrasound and low weight chitosan. Food Control,
16, 131-139.
Hassani, M., Álvarez, I., Raso, J., Condón, S., & Pagán, R. (2005). Comparing
predicting models for heat inactivation of Listeria monocytogenes and Pseudomonas
aeruginosa at different pH. International Journal of Food Microbiology, 100, 213-222.
123
Jay, J. (1992). Modern Food Microbiology. 4th Ed. New York: Van Nostrand
Reinhold.
Jensen, R.G., Blanc, B., & Patton, S. (1995). Particulate Constituents in Human
and Bovine Milk. In R.G. Jensen, (Ed.), Handbook of Milk Composition (pp. 50-80). San
Diego, California: Academic Press.
Keenan, T.W., & Patton, S. (1995). The Structure of Milk: Implications for
Sampling and Storage. In R.G. Jensen (Ed.), Handbook of Milk Composition (pp. 5-50).
San Diego, California: Academic Press.
Klima, R.A., & Montville, T.J. (1995). The regulatory and industrial responses to
listeriosis in the USA: A paradigm for dealing with emerging foodborne pathogens.
Trends in Food Science and Technology, 6, 87-93.
Knorr, D., Zenker, M., Heinz, V., & Lee, D. (2004). Applications and potential of
ultrasonics in food processing. Trends in Food Science and Technology, 15, 261-266.
Ko, S., & Grant, S.A. (2003). Development of a novel FRET method for detection
of Listeria or Salmonella. Sensors and Actuators, B96, 372-378.
Kornacki, J.L. (2005). Controlling Listeria in the food processing environment.
Food Technology, 59(11), 36-42.
124
Kozak, J., Balmer, T., Byrne, R., & Fisher, K. (1996). Prevalence of Listeria
monocytogenes in foods: Incidence in dairy products. Food Control, 7(4-5), 215-221.
Lee, B.H., Kermasha, S., & Baker, B.E. (1989). Thermal, ultrasonic and
ultraviolet inactivation of Salmonella in thin films of aqueous media and chocolate. Food
Microbiology, 6(3), 143-152.
McKellar, R.C., & Lu, X. (2004). Primary Models. In R.C. McKellar & X. Lu
(Eds.), Modeling microbial responses in food. (pp. 21-62). Boca Ratón, Fl.: CRC Press.
Mohan Nair, M.K., Vasudevan, P., & Venkitanarayanan, K. (2005). Antibacterial
effect of black seed oil on Listeria monocytogenes. Food Control, 16, 395-398.
Neville M.C., & Jensen, R.G. (1995). The Physical Properties of Human and
Bovine Milk. In R.G. Jensen (Ed.), Handbook of Milk Composition (pp. 81-85). San
Diego, California: Academic Press.
Owens, S.L., Brewer, J.L., & Rankin, S.A. (2001). Influence of bacterial cell
population and pH on the color of nonfat milk. Lebensmittel-Wissenschaft und-
Technology, 34, 329-33.
Paci, C. (1953). L’emploi des ultra-sons pour l’assinissement du lait. Lait, 33,
610-615.
125
Pagán, R., Mañas, P., Álvarez, I., & Condón, S. (1999). Resistance of Listeria
monocytogenes to ultrasonic waves under pressure at sublethal (manosonication) and
lethal (manothermosonication) temperatures. Food Microbiology, 16, 139-148.
Peleg, M., & Cole, M.B. (1998). Reinterpretation of microbial survival curves.
Critical Reviews in Food Science and Nutrition, 38(5), 353-380.
Peleg, M., & Penchina, C.M. (2000). Modeling microbial survival during
exposure to a lethal agent with varying intensity. Critical Reviews in Food Science and
Nutrition. 40(20), 159-172.
Peleg, M., Corradini, M.G. & Normand, M.D. (2004). Generating microbial
survival curves during thermal processing in real time. Journal of Applied Microbiology.
98 (2), 406-417.
Phillips, L.G., McGiff, M.L., Barbano, D.M., & Lawless, H.T. (1995). The
influence of fat on the sensory properties, viscosity, and color of lowfat milk. Journal of
the Dairy Science, 78, 1258-1266.
Rodrigo, D., Barbosa-Cánovas, G.V., Martínez, A., & Rodrigo, M. (2003).
Weibull distribution function based on an empirical mathematical model for inactivation
of Escherichia coli by pulsed electric fields. Journal of Food Protection, 66(6), 1007-
1012.
126
Rodrigo, D., Ruíz, P., Barbosa-Cánovas, G.V., Martínez, A., & Rodrigo M.
(2003). Kinetic model for the inactivation of Lactobacillus plantarum by pulsed electric
fields. International Journal of Food Microbiology, 81, 223-229.
Ugarte-Romero, E., Feng, H., Martin, S.E., Cadwallader, K.R., & Robinson, S.J.
(2006). Inactivation of Escherichia coli with power ultrasound in apple cider. Journal of
Food Science, 71(2), E102-E108.
van Boekel, M.A.J.S. (2002). On the use of the Weibull model to describe thermal
inactivation of microbial vegetative cells. International Journal of Food Microbiology.
72, 159-172.
Villamiel, M., van Hamersveld, E.H., & de Jong, P. (1999). Review: Effect of
ultrasound processing on the quality of dairy products. Milk Science International, 54 (2),
69-73.
Wrigley, D.M., & Llorca, H.G. (1992). Decrease of Salmonella typhimurium in
skim milk and egg by heat and ultrasonic wave treatment. Journal of Food Protection,
55(9), 678-680.
127
Table 1. Inactivation of mesophilic bacteria in raw whole milk with thermal and thermo-
sonication treatments
Treatment time (min)
Thermal treatment
30% 60% 90% 100%
0 0 0 0 0 0 10 -1.89 0.53 -2.98 -3.23 -3.13 20 -4.00 0.87 -3.38 -3.37 -3.45 30 -3.75 -3.86 -4.25 -3.62 -3.58
128
Table 2. Parameters of the Weibull equation fitted to thermal inactivation and thermo-sonication treatments for Listeria innocua in raw whole milk
Thermal
treatment 30% 60% 90% 100%
B 0.016 - 2.4 2.9 2.7 N 1.73 - 0.28 0.21 0.23
MSE 0.0614 - 0.152 0.048 0.069
129
Table 3. Parameters of the Sigmoid or four parameter model (equation 4) fitted to thermal inactivation and thermo-sonication treatments of different intensity for Listeria innocua
in raw whole milk
Thermal treatment
30% 60% 90% 100%
K1 0.016 1.45x10⁻⁹ 2.4 2.9 2.7 N1 1.73 6.37 0.28 0.21 0.23 K2 0 0.995 0 0 0 N2 - 0.196 - - -
MSE 0.0614 0.124 0.152 0.048 0.069
130
Table 4. Physical-chemical characteristics of milk samples before and after thermal and
thermo-sonication treatments
Sample pH Acidity (%)* L A b Control (raw milk) 6.80 ± 0.04 0.109 ± 0.012 87.82 ± 0.18 -1.70 ± 0.13 5.91 ± 0.25 Thermal treatment 6.74 ± 0.06 0.126 ± 0.008 88.25 ± 0.67 -1.97 ± 0.07 5.61 ± 0.06
30% 6.64 ± 0.02 0.142 ± 0.014 91.92 ± 0.36 -1.67 ± 0.03 5.54 ± 0.05 60% 6.66 ± 0.05 0.141 ± 0.009 91.99 ± 0.34 -1.57 ± 0.04 5.65 ± 0.06 90% 6.65 ± 0.02 0.136 ± 0.012 92.02 ± 0.37 -1.63 ± 0.04 5.61 ± 0.05 100% 6.61 ± 0.01 0.146 ± 0.009 92.37 ± 0.20 -1.55 ± 0.02 5.64 ± 0.09
* Expressed as lactic acid
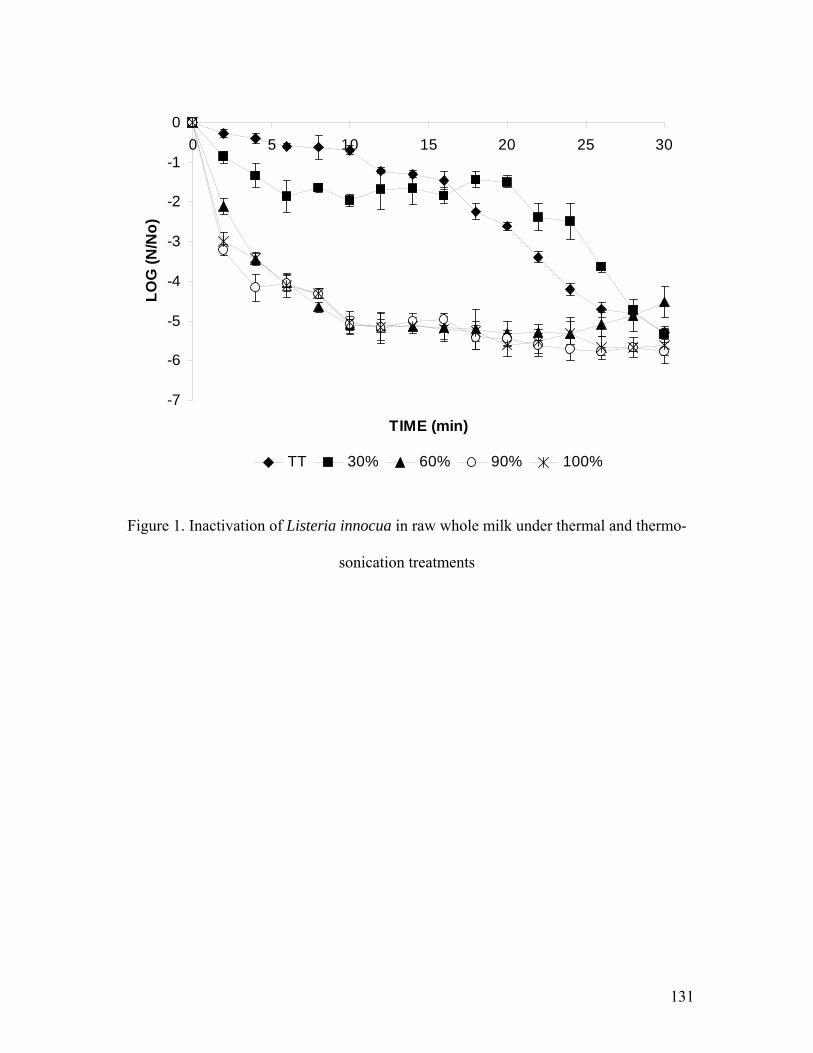
131
-7
-6
-5
-4
-3
-2
-1
00 5 10 15 20 25 30
TIME (min)
LOG
(N/N
o)
TT 30% 60% 90% 100%
Figure 1. Inactivation of Listeria innocua in raw whole milk under thermal and thermo-
sonication treatments
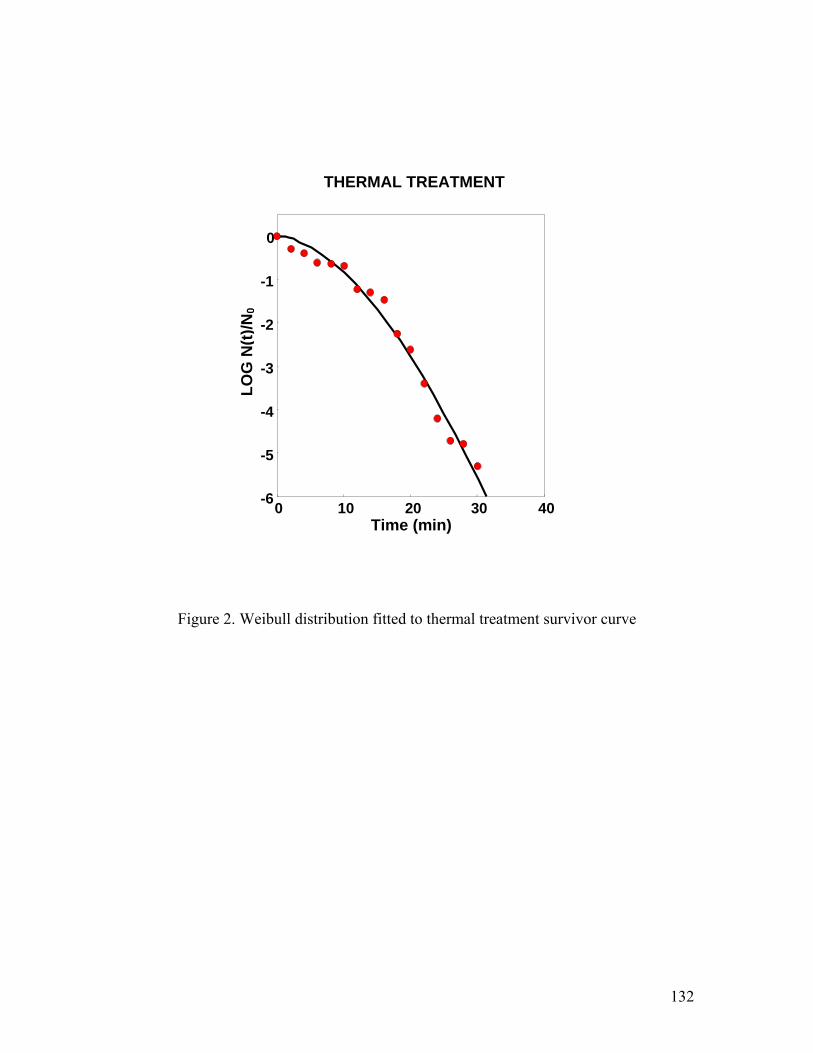
132
Figure 2. Weibull distribution fitted to thermal treatment survivor curve
0 10 20 30 40
0
-1
-2
-3
-4
-5
-6
THERMAL TREATMENT
LOG
N(t)
/N0
Time (min)
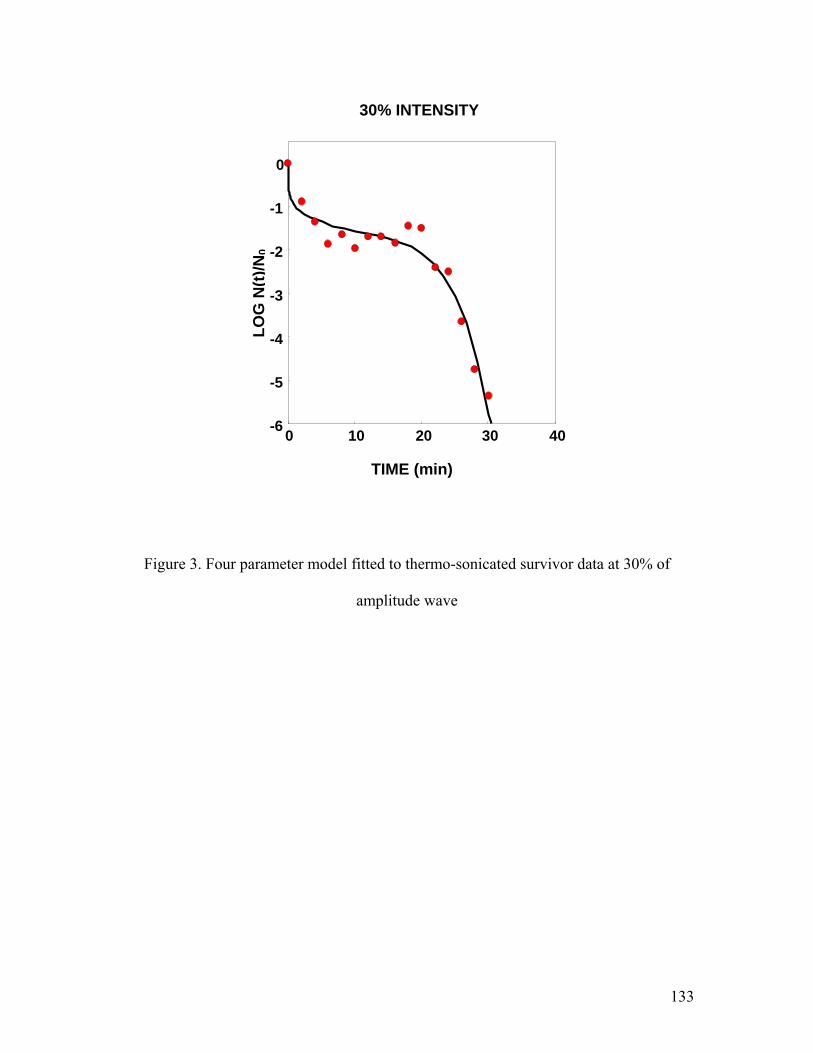
133
Figure 3. Four parameter model fitted to thermo-sonicated survivor data at 30% of
amplitude wave
0 10 20 30 40
0
-1
-2
-3
-4
-5
-6
TIME (min)
30% INTENSITY
LOG
N(t)
/N0
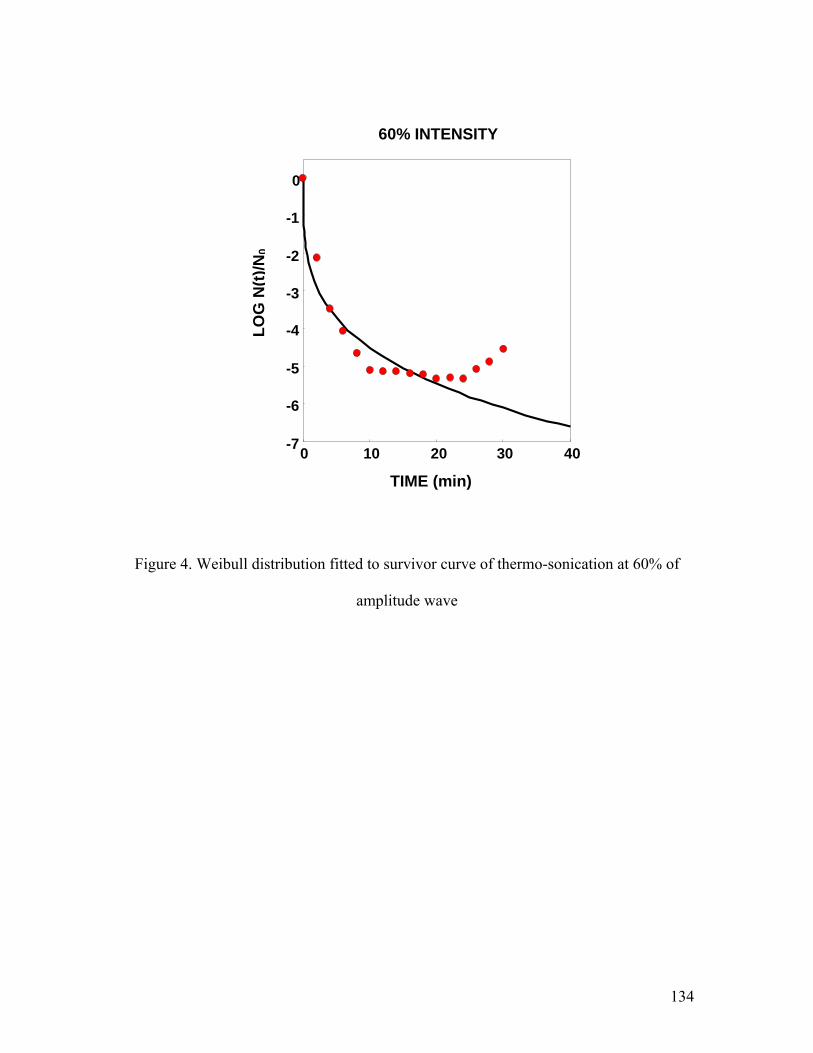
134
Figure 4. Weibull distribution fitted to survivor curve of thermo-sonication at 60% of
amplitude wave
0 10 20 30 40
0
-1
-2
-3
-4
-5
-6
-7
TIME (min)
60% INTENSITY
LOG
N(t)
/N0

135
Figure 5. Weibull distribution fitted to survivor curve of thermo-sonication at 90% of
amplitude wave
0 10 20 30 40
0
-1
-2
-3
-4
-5
-6
-7
TIME (min)
LOG
N(t)
/N0
90% INTENSITY
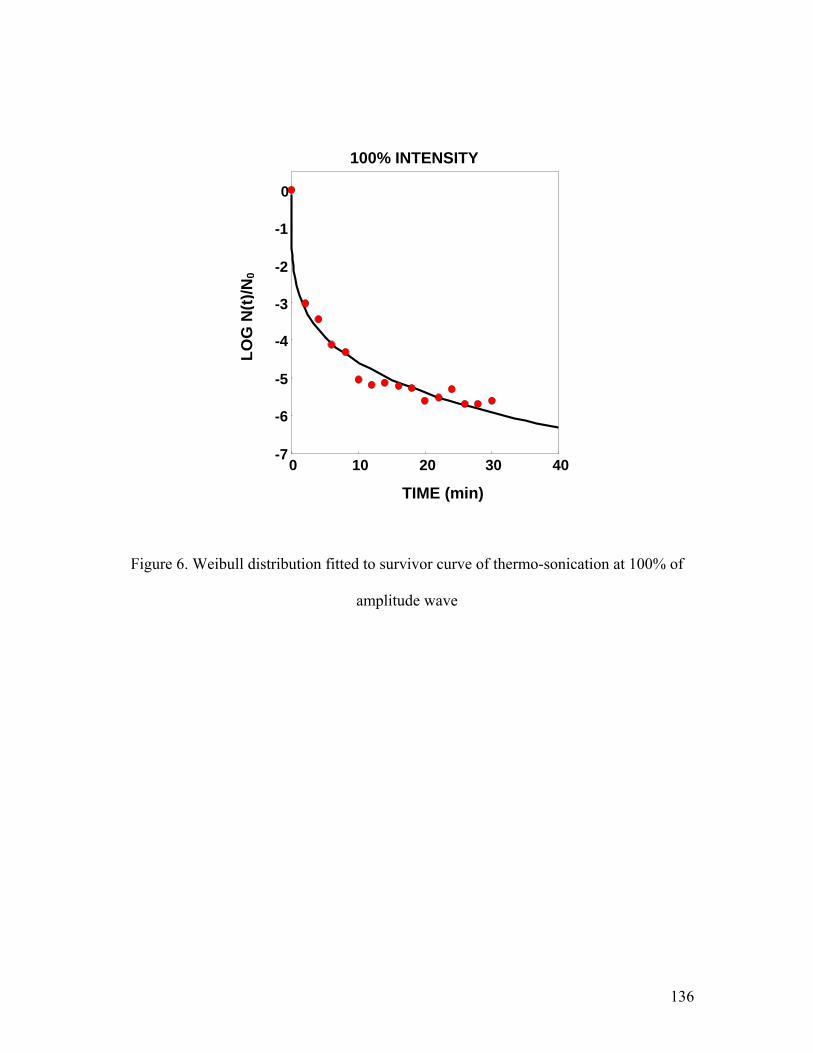
136
Figure 6. Weibull distribution fitted to survivor curve of thermo-sonication at 100% of
amplitude wave
0 10 20 30 40
0
-1
-2
-3
-4
-5
-6
-7
LOG
N(t)
/N0
TIME (min)
100% INTENSITY
137
CHAPTER 3
COMPOSITION PROPERTIES, PHYSICOCHEMICAL CHARACTERISTICS
AND SHELF-LIFE OF WHOLE MILK AFTER THERMAL AND THERMO-
SONICATION TREATMENTS
Daniela Bermúdez-Aguirre, Raymond Mawson, Kees Versteeg and
Gustavo V. Barbosa-Cánovas
Abstract
Raw whole milk (RM) was pasteurized with thermal (TT) and thermo-sonication (US)
treatments. Batch pasteurization was used for TT and 36 μm, 72 μm, 108 μm and 120 μm
of the ultrasound wave intensity (24 kHz, 400W). In addition, the heat conditions were
applied together for US. Apparent protein content of US milk decreased; butter fat
content was increased by US treatment. Proximal analysis showed the presence of added
water in US milk and a decrease of non-fat solids, whereas pH was decreased for US
milk, lactic acid was increased and density was decreased from RM to US; also, the color
of US milk was whiter. The tested parameters for the TT samples were often intermediate
between RM and US samples. Statistical analysis showed a significant difference (p <
0.05) among all treatments. After 16 d, US samples (4ºC) did not show mesophilic
growth higher than 2 log; pH, acidity and color remained constant.
138
1. Introduction
Nonthermal technologies offer advantages in the final product besides microbiological
safety. The products obtained are fresh-like, and losses in color, flavor and nutrients are
minimal. Technologists and industries are interested in novel nonthermal technologies
such as high pressure, pulsed electric fields, ultrasound, high intensity light, and
irradiation, among others (Knorr et al. 2002). Conventional methods to pasteurize milk
include the use of low temperature and long-time application (63ºC for 30 min), High
Temperature Short Time (HTST) (72ºC for 15 sec), and Ultra High Temperature (UHT)
pasteurization (138ºC for 2-4 sec), which is referred to in some countries as UHT
sterilization. Regardless of treatment, the microbiological safety of the milk is ensured,
but the quality of milk is decreased to some degree due to the combination of the time-
temperature processes acting together. Protein denaturation, vitamin destruction, enzyme
inactivation, Maillard reaction and production of lysinoalanine are some of the common
chemical changes that take place in milk following traditional heat pasteurization
methods (Efigênia et al. 1997). The consumer looks for special sensorial characteristics
of milk such as appearance, aroma, texture and flavor (Phillips et al. 1995) along with, of
course, the important protein source that milk represents. During conventional
pasteurization, heat affects the chemical structures of water-soluble vitamins and
proteins, e.g. denaturization of whey proteins (Mehta 1980).
Most novel nonthermal technologies present a uniform temperature distribution in
the food and, as a consequence, the intensity of the process is reduced and the quality of
the food is increased (Knorr et al. 2002). For some humans, such as newborns, milk
represents not only a source of protein, but also of fat, vitamins, minerals and sugars;
139
often, milk is the only caloric source for infants. Proximal analysis of bovine milk shows
the following composition: 3.4% protein (2.8% casein), 3.7% fat, 4.6% lactose and 0.7%
ash (Jensen 1995). The white color of milk is due to the presence of fat globules and
casein micelles that disperse light in the visible spectrum (Owens et al. 2001). Some of
the appearance characteristics of milk based on butter fat content include transparency,
gloss, and whiteness, which have been evaluated from 0 to 4% of fat content (Phillips et
al. 1995). The energy generated by ultrasound can be absorbed or reflected by colloidal
milk proteins and fat globules (Villamiel and de Jong 2000). Some sensory studies have
shown that there is a correlation between the parameters of color L*, a* and b* with
perceived color and mouthfeel (Phillips et al. 1995). Some of the factors that are
responsible for the alteration of the quality of pasteurized milk during storage include the
quality of the raw milk, the effectiveness of the treatment, contamination after
pasteurization, storage temperature and packaging material (Zygoura et al. 2004).
The objective of this work was to study the proximal composition (protein, butter
fat content, added water, solids non-fat) and physicochemical characteristics (pH, lactic
acid content, freezing point, density, color) of milk samples after different thermal and
thermo-sonication treatments as a viable option for pasteurizing milk. The shelf-life of
these milk samples under refrigerated conditions was evaluated with respect to
microbiological and physicochemical aspects.
140
2. Materials and Methods
2.1 Milk samples
Raw cow’s milk was obtained from the Washington State University Creamery. Raw
milk was characterized by the following parameters: pH, acidity, color, proximal analysis
(butter fat, protein, added water, solids non-fat, density and freezing point) and the initial
microbial load. Milk was kept under refrigerated conditions (4ºC) until used.
2.2 Thermo-sonication treatments
An ultrasonic processor (Hielscher USA, Inc., Ringwood, NJ; model UP400S, 400 W, 24
kHz, 120 μm) with a 22 mm diameter probe was used. A 500 ml double-walled vessel
was used as a treatment chamber (8 cm internal diameter and 13.5 cm depth).
Temperature was kept constant via a refrigerated bath (VWR Scientific Model 1166,
Niles, IL). A thermocouple was used in the treatment chamber to monitor the temperature
(63 ± 0.5ºC) throughout the experiments. Five systems were tested, in which the
temperature was constantly maintained (63ºC ± 0.5ºC), while five different amplitudes of
ultrasonic waves (0% - 0 μm; 30% - 36 μm; 60% - 72 μm; 90% - 108 μm; 100% - 120
μm) were used. Amplitude was 0% in conventional batch pasteurization (63ºC by 30
min); that is, no sonication was applied. The treatment time for each system was 30 min.
2.3 Proximal analysis
Analysis of butter fat and protein content, added water and solids non-fat were carried out
using a LactiCheck™ LC-01 Milk Analyzer (Page & Pedersen, International Ltd.,
Hopkinton, MA). The performance of this equipment was based on high frequency
141
ultrasound. The milk analyzer was validated to determine butter fat content (Gerber) and
protein (Kjeldahl) in milk, according to the Association of Analytical Chemists (AOAC
1986) methodology. The equipment was previously calibrated with raw cow’s milk, and
samples were adjusted to room temperature (20ºC). Each sample was analyzed in
triplicate. No previous preparation was required for the thermo-ultrasonicated samples.
2.4 Microbiological analysis
The initial load of microorganisms was evaluated for raw milk. Plate Count Agar (Difco
Becton, Dickinson and Co., Sparks, MD) was used for mesophiles aerobes. Serial
dilutions were made with peptone water before pouring samples into dishes, which were
then incubated at 35°C for 48 h.
For the thermal and thermo-sonication treatments, the microbial counts were
evaluated after 5 min of treatment, and the final count after 30 min of treatment was used
as initial load of microorganisms for the storage life. Serial dilutions were made with
peptone water, by pouring samples into Plate Count Agar (Difco ®). Dishes were
incubated at 35ºC for 48 hr.
2.5 Physicochemical analysis
2.5.1 pH and titratable acidity
The pH was determined by direct immersion of the electrode with a potentiometer (Orion
Research Inc., Boston, MA), and titratable acidity was also determined using a
potentiometer. Ten ml of raw or processed milk was poured into a beaker with 20 ml of
distilled water, undergoing constant agitation. Milk was titrated at room temperature with

142
0.1 N NaOH solution. The end point was reached when the potentiometer showed 8.3.
Acidity was expressed as a percentage of lactic acid (1 ml of 0.1 N NaOH = 0.009 g of
lactic acid). Each sample was again measured in triplicate.
2.5.2 Density and freezing point
Density and freezing point were evaluated in each milk sample after the different
treatments and compared with the raw milk used as a control. A LactiCheck™ LC-01
Milk Analyzer (Page & Pedersen, International Ltd., Hopkinton, MA) was used for this
purpose. It was calibrated with raw milk and samples were analyzed at 20ºC. Each
sample was analyzed in triplicate.
2.5.3 Color
Lightness to darkness (L*) (100 to 0), redness(+) to greenness(-) (a*), and yellowness(+)
to blueness(-) (b*) color parameters were determined using a Minolta CM-2002
spectrophotometer (Minolta Camera Co., Osaka, Japan) in the reflection mode. Twenty
ml of raw and thermo-ultrasonicated milk samples were poured into sterile plastic bags.
A white ceramic plate was used for standardizing the instrument (L* = 93.4, a* = -0.67,
b* = 0.78).
The net color difference was evaluated with the following equation, using the
parameters L*, a* and b* and comparing the different treatments with the raw milk from
the beginning to end of storage life.
( ) ( ) ( )2*2*2** baLE Δ+Δ+Δ=Δ
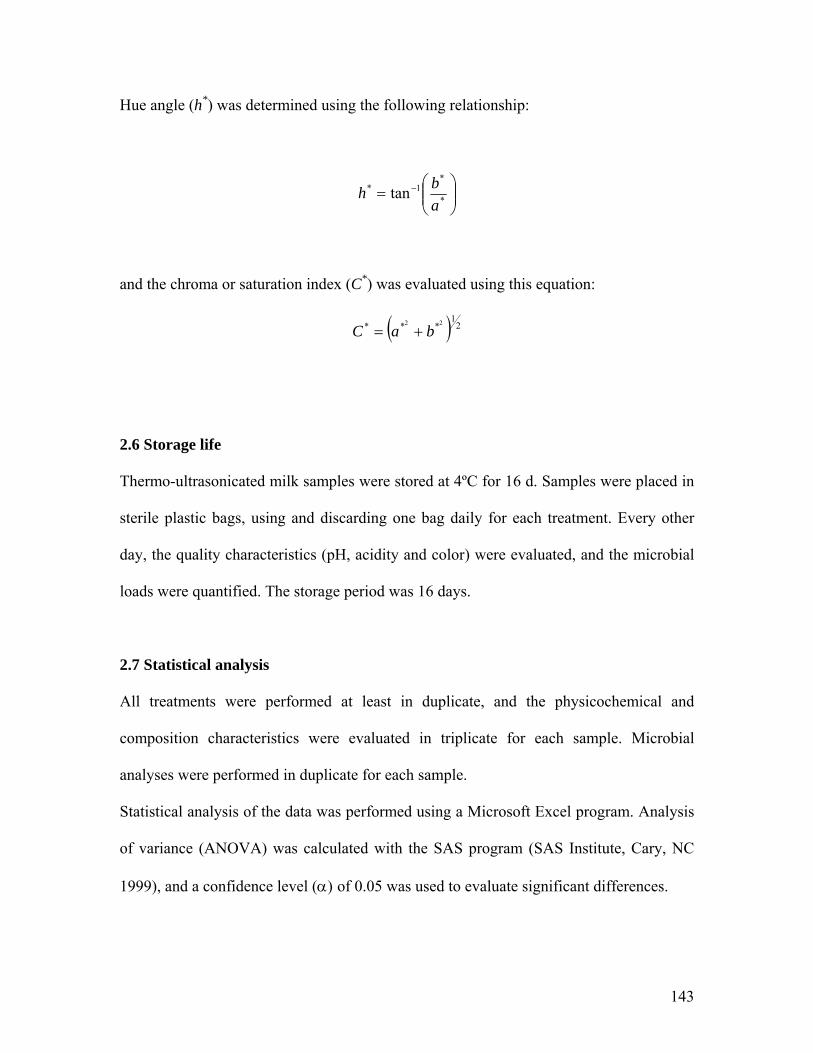
143
Hue angle (h*) was determined using the following relationship:
⎟⎟⎠
⎞⎜⎜⎝
⎛= −
*
*1* tan
abh
and the chroma or saturation index (C*) was evaluated using this equation:
( ) 21
*** 22
baC +=
2.6 Storage life
Thermo-ultrasonicated milk samples were stored at 4ºC for 16 d. Samples were placed in
sterile plastic bags, using and discarding one bag daily for each treatment. Every other
day, the quality characteristics (pH, acidity and color) were evaluated, and the microbial
loads were quantified. The storage period was 16 days.
2.7 Statistical analysis
All treatments were performed at least in duplicate, and the physicochemical and
composition characteristics were evaluated in triplicate for each sample. Microbial
analyses were performed in duplicate for each sample.
Statistical analysis of the data was performed using a Microsoft Excel program. Analysis
of variance (ANOVA) was calculated with the SAS program (SAS Institute, Cary, NC
1999), and a confidence level (α) of 0.05 was used to evaluate significant differences.
144
3. Results and discussion
3.1 Proximal analysis
Proximal analysis was performed in thermo-sonicated milk to evaluate the possible
changes (i.e. protein denaturation) in milk composition after treatments.
3.1.1 Protein content
Thermo-ultrasonicated milk samples showed an apparent decrease in protein content
(Table 1). Raw milk had 3.28% protein and thermal pasteurized milk had 3.55% protein,
while samples of milk pasteurized with ultrasound showed a final value of 3.02% protein
content. Similar values have been reported for raw milk (3.27%) and thermal pasteurized
milk at temperatures over 72ºC (3.35%), as shown in previous experiments (Rynne et al.
2004). In accordance with the statistical analysis, there was a significant difference (p<
0.05) in protein content among all samples from different treatments. The average
decrease of protein content after thermo-sonication in milk samples was around 0.26%.
The decrease can be attributed to the use of elevated temperature plus ultrasound;
however, studies of protein content in milk after sonication are scarce. In one study,
denaturation of whey protein occurred in ultrasonicated milk and the effect increased
when heat and ultrasound were used together. Sonication is responsible for the
modification of the tertiary and/or quaternary structures of casein, but does not
completely alter the micelle (Villamiel and de Jong 2000). In this study, protein content
after sonication was around 3.02%, which is inside the range of protein content for cow's
milk intended for human consumption. However, further studies of protein content are
145
recommended to specifically analyze the type of protein denaturized by ultrasound and
possible modifications to its structure.
3.1.2 Fat content
Butter fat analysis showed an increase of butter fat in the thermo-ultrasonicated milk
samples (Table 1). The raw milk had a high butter fat content of 4.04%; meanwhile,
thermal treated and thermo-ultrasonicated milk samples showed a higher butter fat
content; the former contained 4.22% butter fat, while the average content in the latter was
around 4.25%. Significant difference (p < 0.05) was found between the butter fat contents
in all samples, meaning that the intensity of cavitation has a proportional effect in the
breakage of globules and release of triacylglycerols. Cavitation is the main mechanism
for homogenization of fat globules in milk treated with ultrasound. Breakage of large fat
globules is produced during cavitation, making the butter fat more available for analytical
quantification. In cow's milk, over 95% of the butter fat content corresponds to fat
globules, and 95% of the globule lipids are triacylglycerols (Keenan and Patton 1995).
When heat is used in combination with ultrasound, smaller fat globule sizes are achieved
(Villamiel and de Jong 2000). Through this size reduction, the fat globules release their
contents to the medium, resulting in the triacylglycerols generating a higher butter fat
content for the sonicated samples, as shown in Table 1.
3.1.3 Added water
The added water values in milk samples are shown in Table 1; this parameter has long
been related with milk quality; the addition of water in milk is considered as adulteration
146
of the product, and it is intrinsically related to the freezing point. The highest recorded
value for the sonicated milk samples was 4.92%, which represents a significant difference
(p < 0.05) compared with the raw and heat treated milk samples. This parameter suggests
the denaturation of proteins, because release of water must occur during thermo-
sonication due to the rearrangement of macromolecules, such as proteins. Also, the
production of some chemical reactions may generate water molecules in the medium.
With higher intensities of cavitation, higher apparent added water content is generated in
the medium. From the point of view of quality, the apparent addition of water is not a
desirable characteristic. However, an in-depth chemical analysis of milk after sonication
is recommended in order to study the possible breakage and chemical activity in milk
after treatment.
3.1.4 Solids Non-Fat (SNF)
The solids non-fat (SNF) present in milk include protein (casein and whey protein),
carbohydrates (lactose), minerals (calcium and phosphorus), and some soluble vitamins,
such as riboflavin (IDFA 2006). The content of SNF in milk samples is shown in Table 1.
Raw milk has an SNF content of 9.15%, while heat pasteurized milk shows a higher
value (9.50%), probably because the pasteurization process results in a slight
concentration due to water evaporation. In thermo-sonicated samples, inverse behavior
was demonstrated. There was an apparent reduction of the solids non-fat content to
8.03% for the highest ultrasound intensity. This result could be due to a new and
complete regrouping of some components; if the ultrasound is generating a
homogenization effect in milk, disrupting fat globules and creating new microstructures,
147
the solids non-fat could be adhering to the new fat matrices, reducing the apparent fat
content.
3.2 Physicochemical properties
3.2.1 pH, acidity, density and freezing point
In Table 2, physicochemical properties are shown for all milk samples. The first
parameter, pH, was evaluated in raw milk and in the thermal and thermo-ultrasonicated
samples after 30 min of treatment. Clearly, after treatment with ultrasound, the pH of the
samples was lower than for either raw milk or heated milk; nevertheless, the average
value (6.64) is in the range acceptable for commercial milk. Decrease of pH could be
because of the enzymatic action promoted by the cavitation producing the hydrolysis of
esters (Walstra et al. 2006). Titratable acidity (expressed as lactic acid) increased from
0.109% to 0.141% (average) after sonication, but this value is also within the reported
range. This increase in the acidity could be attributed to two facts. The first fact relates to
lipolysis, because of the enzymatic action on triglycerides (Walstra et al., 2006) which is
enhanced by ultrasound and the release of fat free acids to the medium. The second result
could be due to the formation of nitrite, hydrogen peroxide and nitrate in milk after
sonication; some studies have shown the formation of these products in aqueous media at
different frequencies and ultrasound intensities (Supeno 2000). The physicochemical
properties reported for bovine milk are: pH in the range of 6.22 to 6.77; specific gravity
between 1.021 and 1.037, and titratable acidity of 0.16 ± 0.02 (Neville and Jensen 1995).
Agnihotri and Pal (1996) reported a pH from 6.40 to 6.68 for goat's milk. Density
148
decreased in raw milk from 1.0303 g/cm3 to 1.0257 g/cm3 (100%), probably because of
the homogenization achieved with ultrasound treatment, making a more fluid product.
The freezing point of the milk samples is shown in Table 2. Raw milk showed a
value of -0.5160ºC; the equipment was calibrated in accordance with that value. Some of
the reported values in the literature are in the range -0.520ºC to -0.531ºC, depending on
the country (Slaghuis 2001). The freezing point values after sonication are shown in
Table 2; the average value was -0.5317ºC. In this case, there was no tendency related to
the intensity of the treatments.
The addition of water in milk was discussed previously, and the depression of the
freezing point data after thermo-sonication matched very well, confirming that the
freezing point temperature is a very useful measurement in quality assessment as it shows
if water has been added to the milk.
The statistical analysis performed for each physicochemical property (pH, lactic
acid content, density and freezing point) evaluated in this section showed a significant
difference (p < 0.05) between each treatment, meaning that thermo-sonicated milk has
completely different and new properties compared to the raw and heat treated fluids.
3.2.2 Color
Color parameters after thermal treatment and the different sonication treatments are
shown in Figures 1, 2 and 3, corresponding to time zero during storage life in each plot.
Raw milk and heated milk showed lower luminosity (87.77 and 88.59, respectively)
compared to the sonicated samples, which showed an increase in this value (from 91.69
to 92.37). All samples processed with ultrasound showed higher L* values; thus, with the
149
increase of cavitation (corresponding to higher ultrasonic wave amplitudes and stronger
treatments) the luminosity increases; the resulting color improvement is due to the
enhanced homogenization of milk. Similar results were observed by Ertugay et al.
(2004); excellent homogenization occurred in milk due to the reduction of fat globule
size with the highest ultrasound power used and a long treatment time (10 min).
Ultrasonic treatment plus temperature of 60ºC reduced the fat globule size to 1 μm. Large
changes in particle size are enough to modify light reflection (Owens et al. 2001). The
size of fat globules, distribution of milk proteins, and the Maillard reaction are
responsible for the color of milk. Whitening in milk can occur because of the
denaturation and coagulation of soluble protein in milk, increasing the opaque particles
(Mehta 1980); all of these reasons may account for changes in the color of milk before
and after sonication.
Color parameter a* changed from -1.81 (in raw milk) to -1.92 (in thermally
treated milk) and to -1.59 (in thermo-sonicated milk), meaning that the unprocessed
product has a higher contribution in the green region than the treated milk. The b* value
readings were very close to each other: raw milk (5.68), thermal treatment (5.60) and
thermo-sonicated (5.58 to 5.64), which is related to an approximately equal contribution
from the yellowness region. This similarity was confirmed by statistical analysis; the b*
value was the only color parameter that did not show a significant difference (p < 0.05)
between each milk treatment.
150
3.3 Storage life
3.3.1 Microbiological aspects
In Figure 4 the mesophilic bacteria growth behavior in the different samples is shown.
The growth of mesophiles is very fast in raw milk, starting with approximately 103
cfu/ml. After 5 d there was a 5.4-log growth, and after 9 d the growth had reached 6.7 log
cycles. Similar results are reported by Zygoura et al. (2004), who found an initial load of
mesophilic bacteria of 4.65 log cfu/ml in raw milk. After 7 d of storage at 4ºC the counts
were between 6.56 and 7.16 log cfu/ml, very close to the allowable limit (106 – 107
cfu/ml). The initial count of mesophilic bacteria in this experiment is very important
because it determines the final quality of the product and the storage life length.
According to U.S. standards, Grade A raw milk may not exceed 300 000 cfu/ml, and in
the European community the bacterial count should be lower than 100 000 cfu/ml. After
pasteurization, in the United States, milk should contain less than 20 000 cfu/ml (Jensen
et al. 1995). The raw milk used in this experiment achieves the standards reflecting good
sanitary practices; after pasteurization with heat and ultrasound, microbial loads were
reduced to 102 cfu/ml (data not shown), which is also under the established limit.
Thermal treated milk showed a slight increase of bacteria through storage life; as
can be seen in Figure 4, the refrigerated conditions retarded the growth of
microorganisms compared with raw milk. After 16 d the microbiological count for the
heat treated product was 5.8 log cycles. The behavior of the bacteria in thermo-sonicated
milk showed an interesting increase/decrease of cells under storage conditions. The
lowest amplitudes (30% and 60%) showed a decrease in the bacteria population during
151
storage. This decrease could be attributed to many factors, such as the progressive dying
off of injured cells that were not totally inactivated during the sonication.
In some inactivation studies the effect of the amplitude of the ultrasound wave has
been shown to be a crucial parameter related to the degree of inactivation and, hence,
with the degree of injury to the cells. Lower amplitudes do not generate enough
inactivation, and in other cases these amplitudes can even promote cell growth (Knorr et
al. 2004; Chemat and Hoarau 2004). Higher amplitudes do generate total inactivation and
the possibility of cell recovery after treatment is scarce. In addition, the action of
ultrasound in an aqueous medium generates the sonolysis of water, which is the breakage
of water molecules, H+ and OH-, and other free radicals, and their recombination. These
radicals and new compounds could show a bactericidal effect in cells (Tsukamoto et al.
2004a, 2004b; Furuta et al. 2004). The mechanism of inactivation in cells due to
ultrasound cavitation seems to be the formation of pores outside the cell membrane,
disruption of cell structures, and breakage of cells (Bermúdez-Aguirre and Barbosa-
Cánovas 2006; Ugarte-Romero et al. 2006). Thus, the reason for possible “inactivation”
of cells during storage life for 30% and 60% of treatments is a combination of cells
injured and free radical formation.
Treatment time (30 min) did not inactivate more mesophiles, but was long enough
to injure cells with the characteristics described above. The presence of radicals and new
compounds could be acting as bactericidal agents freely entering the inside cell structures
and making these cells unavailable for microbial counts during storage. The disruption of
the tertiary and quaternary structures of the casein generated by ultrasound seems to be
the cause of the increase in the antioxidant activity of milk (Villamiel and de Jong 2000).
152
This antioxidant activity produced in milk via sound waves could also act as a natural
antimicrobial.
With 90% treatment intensity there was a decrease in the growth of mesophiles
during storage life until day 16. The initial count was 2 log cycles, finishing with counts
of less than 1 log cycle. The highest intensity (100%) showed a maximum growth of 1
log cycle at the beginning of storage, followed by a decrease of the microorganism’s
viability during the remaining storage life. The decrease of the cell growth could be due
to the adverse conditions of the cell environment, in addition to cell injury through
cavitation, making it impossible for cell recovery in the medium after treatment.
In all samples of sonicated milk, no more than 2 log cycles of growth was
detected up to 16 d at 4ºC, making ultrasound a viable alternative to pasteurized milk,
with longer storage life than for heat treated milk. Ultrasonic technology deserves further
research; for example, the study of psychrotrophic bacteria and enzyme behavior
throughout storage life could provide valuable information about the stability of milk. In
addition, encouragingly, e.g. after 16 d of storage, milk samples did not show visible
spoilage signs from enzymatic or microbiological origin.
3.3.2 pH and lactic acid content
Although pH and acid lactic content are not routinely evaluated as quality indicators of
milk's storage life, it is important to monitor them as they are an indirect measure of the
microbiological growth of lactobacillus, which is responsible for acid production in milk.
Lactic acid is measured by titratable acidity and it is often used to determine bacterial
growth in fermentation or contamination processes (Neville and Jensen 1995). The pH
153
behavior of different milk samples is shown in Figure 5. The raw milk value drastically
decreased after 5 d at 4ºC; meanwhile, the heat treated and thermo-sonicated samples
stayed almost constant after 16 d. Similar behavior was observed for all samples with
regard to lactic acid content, as shown in Figure 6. The pH and acidity values for both
thermal and thermo-sonicated milk samples are within the range reported for cow's milk
by Neville and Jensen (1995): 6.22 – 6.77 and 0.16 ± 0.02, even after 16 d of storage.
3.3.3 Color
Thermo-sonicated milk maintained a very homogeneous color throughout its storage life.
The luminosity of samples observed after sonication was a very white fluid. After storage
at 4ºC for more than 16 d, the color remained in the samples. Even in the sample treated
at 100%, the L* value increased, as seen in Figure 1. Raw and heat treated samples
always showed lower luminosity, and L* values decreased with the passage of time
because of the different physicochemical reactions and microbiological growth that took
place in the milk during storage. One chemical reaction that occurs during processing and
storage is the Maillard reaction because of the presence of lactose and caseins and whey
proteins. When milk is heated, the aldehyde group of lactose is bound with the ε-amino
group of lysyl residues from proteins generating brown pigmented products such as
pyrazines and melanoidins (Gaucher et al. 2008), and continues to develop during
storage. This color can be observed in the heat treated samples in Figure 3, with an
increase of the b* values. Also, when solutions of D-glucose and lactose are treated with
ultrasound, one of the main products is malonaldehyde (Heusinger 1986; O’Brien 1997)
in addition to the known free radicals OH- and H+ from the lysis of water molecules. In
154
neutral solutions, the amount of malonaldehyde is not very high (2-5 x 10⁻⁷ g/ml)
compared with alkaline solutions (Heusinger 1986), indicating that in sonicated milk the
amount of malonaldehyde is probably not very high because of the pH of milk (6.6).
However, the effect of pH on the Maillard reaction in milk has been related with the
amount of H+ ions that depress and OH- ions that enhance discoloration (Patton 1995). As
previously mentioned, during the sonication of solutions, the generation of other free
radicals, besides H+ and OH-, is produced (Supeno 2000), which could have a
discoloration effect that would prevent the browning pigments generated. This is because
of the heat treatment applied together with ultrasound, which diminishes the brown color
in milk and retains a lower b* value in the samples.
Whiteness in milk is a very important characteristic for the consumer, which can
often increase sales (Owens et al. 2001). One advantage of thermo-sonicated milk for the
consumer is a whiter color after treatment and during storage. The color parameter a*,
which is related with the redness (+) or greenness (-) of the sample, remained constant in
the thermo-sonicated milk after 16 d of storage, as shown in Figure 2. However, in the
case of thermal treatment and raw milk, the values were more negative, indicating a green
contribution to the milk color. Samples that were sonicated showed a constant value in
the storage time and the value was in the yellowness (+) area; but again the samples with
thermal pasteurization and raw milk showed an increase of the b* value as storage time
passed. Finally, the combination of green and yellow colors indicated the spoilage aspect
of milk because of the different chemical reactions taking place, such as the separation of
whey and the growth of bacteria.

155
Gelation and bitterness occur during the storage of milk because of proteolysis;
this phenomenon is related to the resistance of some heat-stable enzymes and
microorganisms that survive after pasteurization (Valero et al. 2001). Occurrence of
gelation signifies the end of storage life, and this process is the result of the formation of
hydrophobic bonding between casein and lactose (Mehta 1980). Gelation was observed in
the raw milk sample and was initially observed in the heat treated milk. No visible
changes, such as separation of phases in the thermo-sonicated milk, were observable after
16 d of storage at 4ºC; regardless of the intensity of the treatment, the samples displayed
very good appearance.
When milk is homogenized after processing at temperatures lower than normal,
sediment formation is reduced (Mehta 1980). In this experiment at temperature of 63ºC,
which is conventionally used in batch pasteurization, no sedimentation was observed in
thermo-sonicated samples.
3.3.3.1 Net change in color
A very useful parameter to evaluate the differences in color is the net change in color; in
this research, this mathematical function was used to evaluate the difference in the color
of milk samples after sonication of raw milk. The values were also calculated throughout
storage life showing an important difference between raw milk and the other samples. In
Figure 7, the net change in color for all tested samples is shown. Even the raw milk,
compared with its initial value, showed a change in color during storage. However, when
comparing the raw product with the sonicated product, the difference was more
noticeable after treatment. Results were also statistically compared, showing that there is
156
a significant difference (p < 0.05) among the net change in color for the different
treatments.
3.3.3.2 Hue angle (h*)
The hue angle for all samples is shown in Figure 8; according to the Hunter color scale,
h* is a quality indicator; it allows classification of the product as: reddish (0º), yellowish
(90º), greenish (180º) and bluish (270º). Raw and thermally treated milk samples showed
at time zero a yellowish color, with some degree of reddish, but presenting variations
during storage. However, sonicated milk samples kept almost a constant hue angle
between 73º and 75º from the beginning to end of storage time, regardless of intensity of
treatment.
3.3.3.3 Chroma/saturation index (C*)
Regarding the chroma C* of milk samples, this value that indicates the degree of
saturation, purity or intensity of color, which remained almost constant after all
treatments (Figure 9). However, during storage life, C* was slightly increased for the raw
and heated milk samples because of the enzymatic reactions and microbiological growth
that were taking place in the samples, thus intensifying the color. Meanwhile, thermo-
sonicated samples maintained a constant saturation index.
4. Conclusions
Ultrasound technology offers the chance to produce a safe and stable product from the
microbiological point of view for more than 16 d at 4ºC. Despite the apparent slight
157
decrease in protein content, other characteristics are improved, such as a better
availability of butter fat content, and better color, appearance and homogenization. Minor
changes in other physical-chemical characteristics of thermo-sonicated milk allow the
product to be available, not just as a beverage, but also as a potential ingredient for the
dairy industry by improving and developing new products.
References
Agnihotri, M.K., and Pal, U.K. 1996. Quality and shelf-life of goat milk Paneer in
refrigerated storage. Small ruminant research. 20: 75-81.
A.O.A.C. 1986. Official Methods of Analysis. Association of Official Analytical
Chemists. USA.
Bermúdez-Aguirre, D., and Barbosa-Cánovas, G.V. 2006. Mechanism of
inactivation for thermo-sonicated Listeria innocua ATCC 51742 in whole milk using
scanning and transmission electron microscopy. IFT Annual Meeting, 54-A-38. Orlando,
FL.
Chemat, F., and Hoarau, N. 2004. Hazard analysis and critical control point
(HACCP) for an ultrasound food processing operation. Ultrasonics Sonochemistry. 11:
257-260.
Efigênia, M., Povoa, B., and Moraes-Santos, T. 1997. Effect of heat treatment on
the nutritional quality of milk proteins. International Dairy Journal. 7: 609-612.
158
Ertugay, M.F., Şengül, M., and Şengül, M. 2004. Effect of ultrasound treatment
on milk homogenization and particle size distribution of fat. Turkish Journal of
Veterinary and Animal Sciences. 28: 303-308.
Furuta, M., Yamaguchi, M., Tsukamoto, T., Yim, B., Stavarache, C.E., Hasiba,
K., and Maeda, Y. 2004. Inactivation of Escherichia coli by ultrasonic irradiation.
Ultrasonics Sonochemistry. 11 (2): 57-60.
Gaucher, I., Mollé, D., Gagnaire, V., and Gaucheron, F. 2008. Effects of storage
temperature on physico-chemical characteristics of semi-skimmed UHT milk. Food
Hydrocolloids. 22: 130-143.
Heusinger, H. 1986. Formation and polymerization of malonaldehyde during
irradiation of aqueous solutions of D-glucose and lactose with ultrasound. Carbohydrate
Research. 154: 37-48.
IDFA (International Dairy Foods Association). 2006. http://www.idfa.org/,
Accessed on April 10, 2006.
Jensen, R.G. 1995. Introduction. In Handbook of Milk Composition. R.G. Jensen,
Ed. pp: 1-3, Academic Press. San Diego, CA.
159
Jensen, R.G., Blanc, B., and Patton, S. 1995. Particulate constituents in human
and bovine milk. In Handbook of Milk Composition. R.G. Jensen, Ed. pp: 50-80,
Academic Press. San Diego, CA.
Keenan, T.W., and Patton, S. 1995. The structure of milk: Implications for
sampling and storage. In Handbook of Milk Composition. R.G. Jensen, Ed. pp: 5-50,
Academic Press. San Diego, CA.
Knorr, D., Ade-Omowaye, B.I.O., and Heinz, V. 2002. Nutritional improvement
of plant foods by non-thermal processing. Proceedings of the Nutrition Society. 61: 311-
318.
Knorr, D., Zenker, M., Heinz, V., and Lee, D. 2004. Applications and potential of
ultrasonics in food processing. Trends in Food Science and Technology. 15: 261-266.
Mehta, R.S. 1980. Milk processed at ultra-high –temperatures- A Review. Journal
of Food Protection. 43 (3): 212-225.
Neville, M.C., and Jensen, R.G. 1995. The physical properties of human and
bovine milk. In Handbook of Milk Composition. R.G. Jensen, Ed. pp: 81-85, Academic
Press. San Diego, CA.
160
O’Brien, J. Reaction chemistry of lactose: non-enzymatic degradation pathways
and their significance in dairy products. In Advanced Dairy Chemistry. Vol. 3. P.F. Fox,
Ed. pp: 155-231, Chapman & Hall. London, UK.
Owens, S.L., Brewer, J.L., and Rankin, S.A. 2001. Influence of bacterial cell
population and pH on the color of nonfat milk. Lebensmittel-Wissenschaft und-
Technologie. 34: 329-333.
Patton, S. 1955. Browning and associated changes in milk and its products: a
review. Journal of Dairy Science. 38(5): 457-478.
Phillips, L.G., Mcgiff, M.L., Barbano, D.M., and Lawless, H.T. 1995. The
influence of fat on the sensory properties, viscosity, and color of lowfat milk. Journal of
Dairy Science. 78: 1258-1266.
Rynne, N.M., Beresford, T.P., Kelly, A.L., and Guinee, T.P. 2004. Effect of milk
pasteurization temperature and in situ whey protein denaturation on the composition,
texture and heat-induced functionality of half-fat cheddar cheese. International Dairy
Journal. 14: 989-1001.
Slaghuis, B.A. 2001. The freezing point of authentic and original farm bulk tank
milk in The Netherlands. International Dairy Journal. 11: 121-126.

161
Supeno, P.K. 2000. Sonochemical formation of nitrate and nitrite in water.
Ultrasonics Sonochemistry. 7: 109-113.
Tsukamoto, I., Constantinoiu, E., Furuta, M., Nishimura, R., and Maeda, Y.
2004a. Inactivation of Saccharomyces cerevisiae by ultrasonic irradiation. Ultrasonics
Sonochemistry. 11: 61-65.
Tsukamoto, I., Constantinoiu, E., Furuta, M., Nishimura, R., and Maeda, Y.
2004b. Inactivation effect of sonication and chlorination on Saccharomyces cerevisiae.
Calorimetric analysis. Ultrasonics Sonochemistry. 11: 167-172.
Ugarte-Romero, E., Feng, H., Martin, S.E., Cadwallader, K.R., and Robinson, S.J.
2006. Inactivation of Escherichia coli with power ultrasound in apple cider. Journal of
Food Science. 71 (2): E102-E108.
Valero, E., Villamiel, M., Miralles, B., Sanz, J., and Martínez-Castro, I. 2001.
Changes in flavour and volatile components during storage of whole and skimmed UHT
milk. Food Chemistry. 72: 51-58.
Villamiel, M., and De Jong, P. 2000. Influence of high-intensity ultrasound and
heat treatments in continuous flow on fat, proteins, and native enzymes of milk. Journal
of Agricultural and Food Chemistry. 48: 472-478.
162
Walstra, P., Wouters, J.T.M., and Geurts, T.J. 2006. Dairy Science and
Technology. 2nd Ed. CRC Taylor and Francis. Boca Ratón. pp: 159-169.
Zygoura, P., Moyssiadi, T., Badeka, A., Konyli, E., Savvaidis, I., and
Kontominas, M.G. 2004. Shelf life of whole pasteurized milk in Greece: Effect of
packaging material. Food Chemistry. 87: 1-9.
163
Table 1. Proximal Analysis of Raw Milk, Heat Pasteurized Milk and Thermo-Sonicated Pasteurized Milk
Milk sample Protein
content (%) Butter fat
content (%) Added water to milk (%)
Solids Non-Fat (%)
Raw 3.28 ± 0.04 4.04 ± 0.05 0.00 ± 0.00 9.15 ± 0.04 Thermal treatment
3.55 ± 0.01 4.22 ± 0.02 0.00 ± 0.00 9.50 ± 0.03
30% 3.02 ± 0.03 4.21 ± 0.04 4.35 ± 0.92 8.08 ± 0.09 60% 3.04 ± 0.03 4.28 ± 0.05 3.88 ± 0.91 8.13 ± 0.08 90% 3.03 ± 0.04 4.29 ± 0.05 4.28 ± 1.12 8.36 ± 0.43
100% 3.00 ± 0.01 4.24 ± 0.02 4.92 ± 0.39 8.03 ± 0.04 a All analyses were performed on the same day of processing.
b All characteristics were significantly different for each treatment (p < 0.05).
164
Table 2. Physicochemical Characteristics of Raw Milk, Heat Pasteurized Milk and Thermo-Sonicated Pasteurized Milk
Milk sample pH Acidity* Density (g/cm3) Freezing point (ºC)
x 10-2
Raw 6.80 ± 0.04 0.109 ± 0.012 1.0303 ± 0.0014 - 51.60 ± 0.031 Thermal treatment 6.74 ± 0.06 0.126 ± 0.008 1.0317 ± 0.0010 - 61.73 ± 0.015
30% 6.64 ± 0.02 0.142 ± 0.014 1.0260 ± 0.0032 - 53.20 ± 0.053 60% 6.66 ± 0.05 0.141 ± 0.009 1.0261 ± 0.0029 - 53.47 ± 0.049 90% 6.65 ± 0.02 0.136 ± 0.012 1.0259 ± 0.0038 - 53.20 ± 0.061
100% 6.61 ± 0.01 0.146 ± 0.009 1.0257 ± 0.0015 - 52.83 ± 0.021 * Expressed as lactic acid.
a All analyses were performed on the same day of processing.
b All characteristics were significantly different for each treatment (p < 0.05).
165
84.00
85.00
86.00
87.00
88.00
89.00
90.00
91.00
92.00
93.00
94.00
0 2 4 6 8 10 12 14 16 18
Time (days)
L*
RMTT30%60%90%100%
Figure 1. Luminosity (L*) of Raw Milk (RM), Heat Pasteurized Milk (TT), and Thermo-
sonicated Milk at different ultrasound intensities (30%, 60%, 90% And 100%) during
storage.
166
-2.20
-2.00
-1.80
-1.60
-1.40
-1.20
-1.000 2 4 6 8 10 12 14 16 18
Time (days)
a*
RMTT30%60%90%100%
Figure 2. The a* value of Raw Milk (RM), Heat Pasteurized Milk (TT), and Thermo-
sonicated milk at different ultrasound intensities (30%, 60%, 90% and 100%) during
storage.
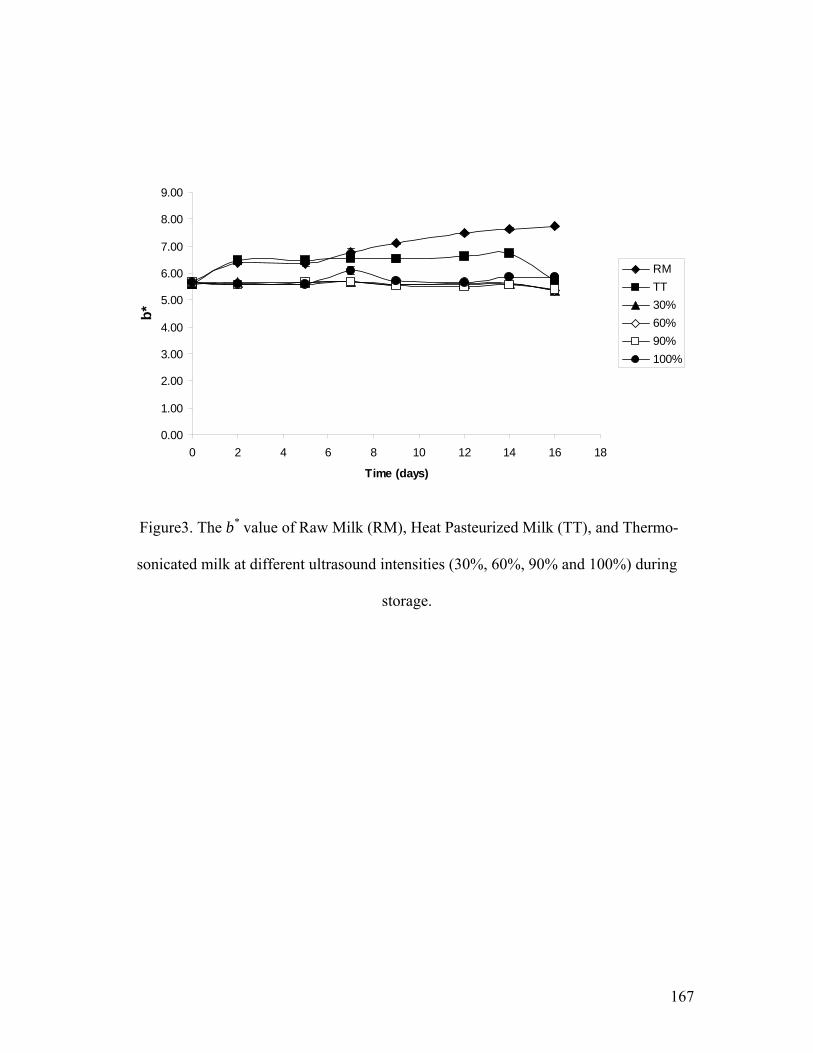
167
0.00
1.00
2.00
3.00
4.00
5.00
6.00
7.00
8.00
9.00
0 2 4 6 8 10 12 14 16 18
Time (days)
b*
RMTT30%60%90%100%
Figure3. The b* value of Raw Milk (RM), Heat Pasteurized Milk (TT), and Thermo-
sonicated milk at different ultrasound intensities (30%, 60%, 90% and 100%) during
storage.
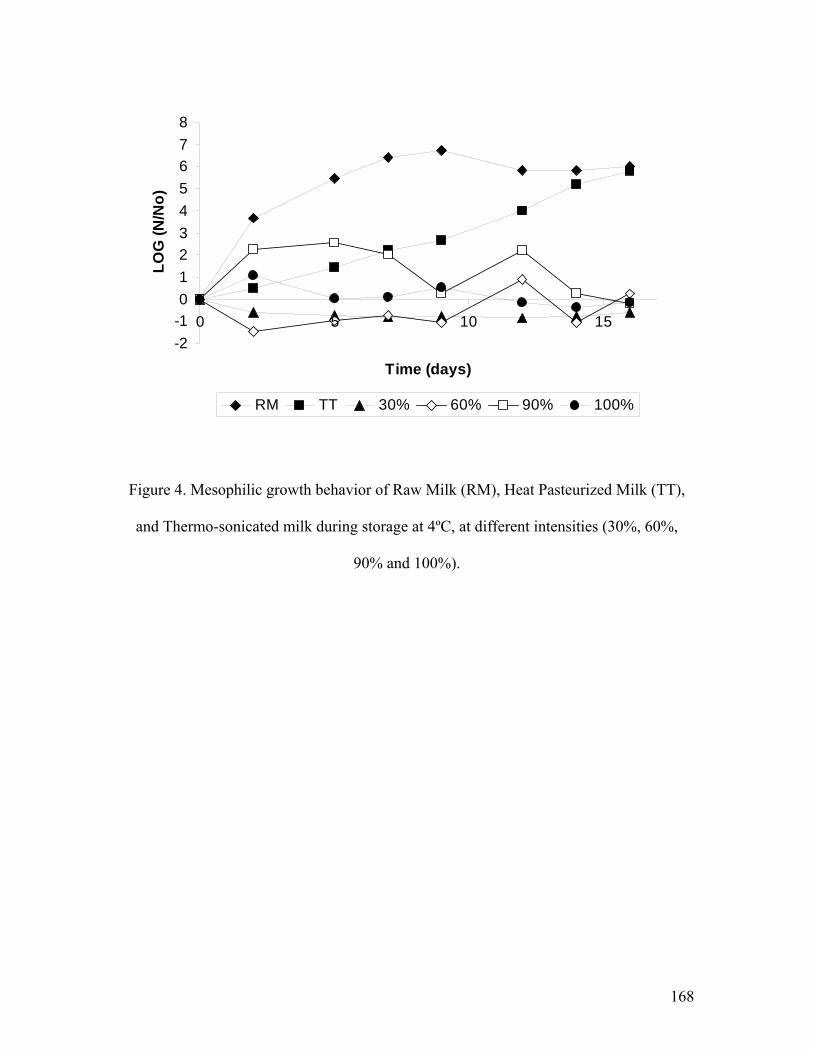
168
-2-1012345678
0 5 10 15
Time (days)
LOG
(N/N
o)
RM TT 30% 60% 90% 100%
Figure 4. Mesophilic growth behavior of Raw Milk (RM), Heat Pasteurized Milk (TT),
and Thermo-sonicated milk during storage at 4ºC, at different intensities (30%, 60%,
90% and 100%).
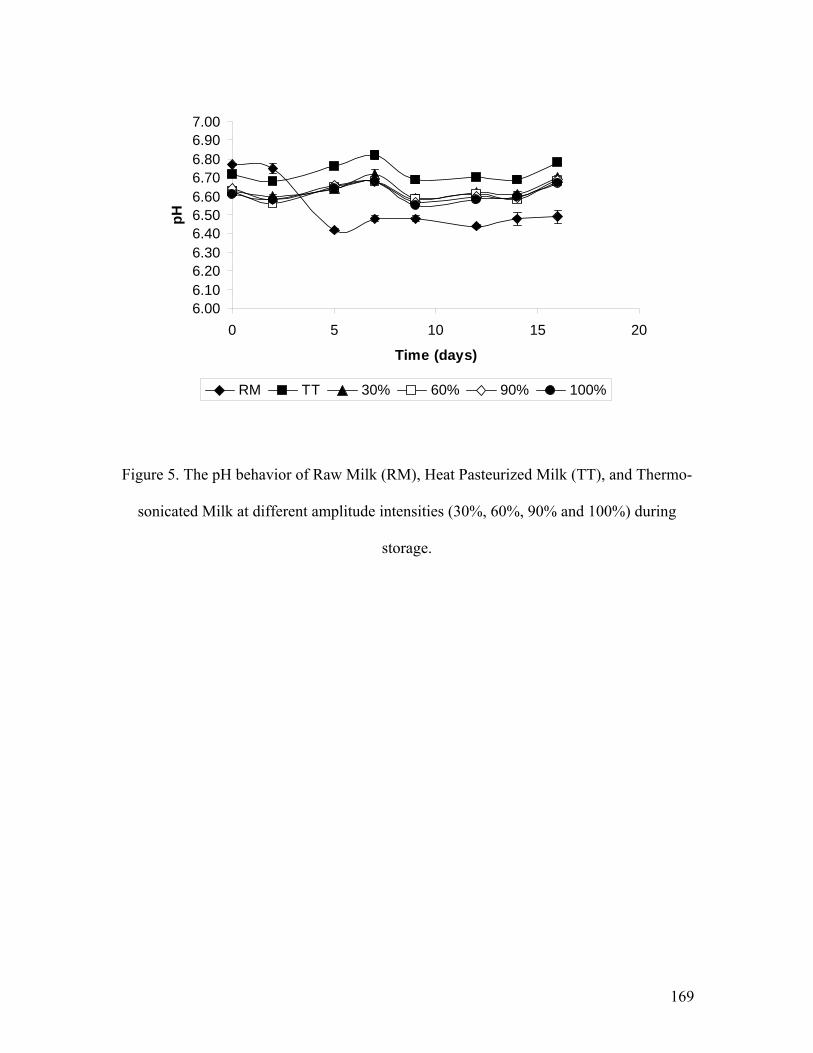
169
6.006.106.206.306.406.506.606.706.806.907.00
0 5 10 15 20
Time (days)
pH
RM TT 30% 60% 90% 100%
Figure 5. The pH behavior of Raw Milk (RM), Heat Pasteurized Milk (TT), and Thermo-
sonicated Milk at different amplitude intensities (30%, 60%, 90% and 100%) during
storage.
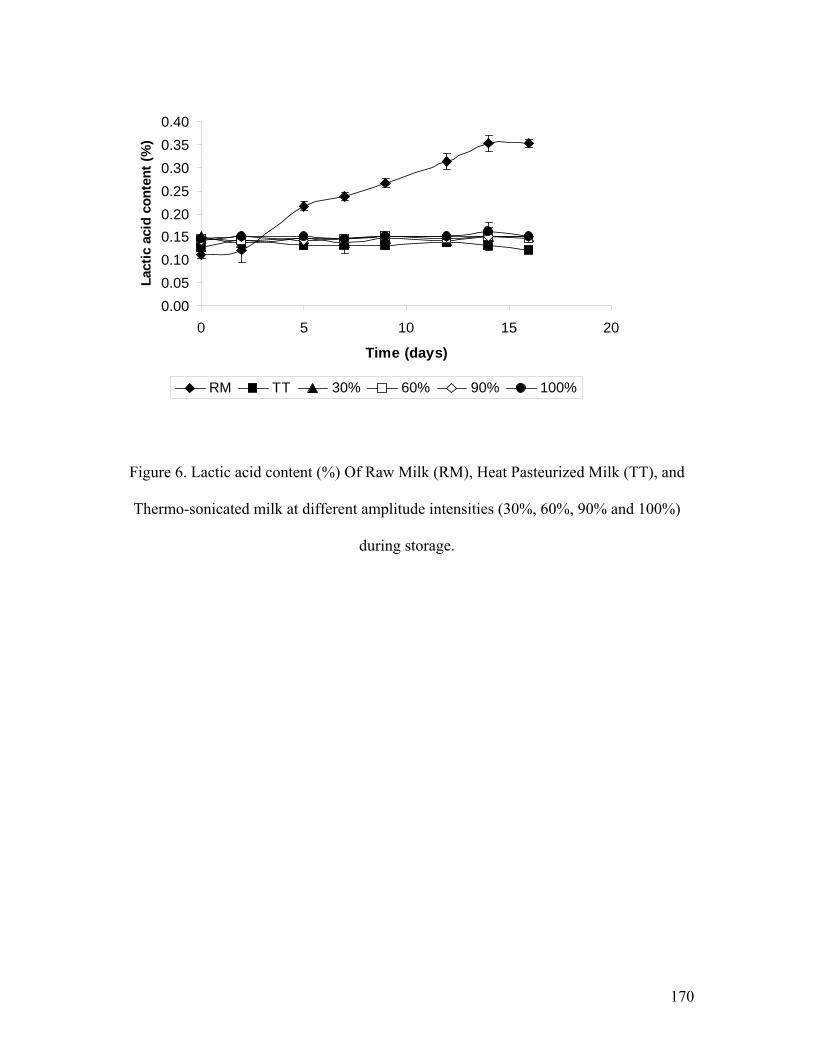
170
0.000.050.100.150.200.250.300.350.40
0 5 10 15 20
Time (days)
Lact
ic a
cid
cont
ent (
%)
RM TT 30% 60% 90% 100%
Figure 6. Lactic acid content (%) Of Raw Milk (RM), Heat Pasteurized Milk (TT), and
Thermo-sonicated milk at different amplitude intensities (30%, 60%, 90% and 100%)
during storage.
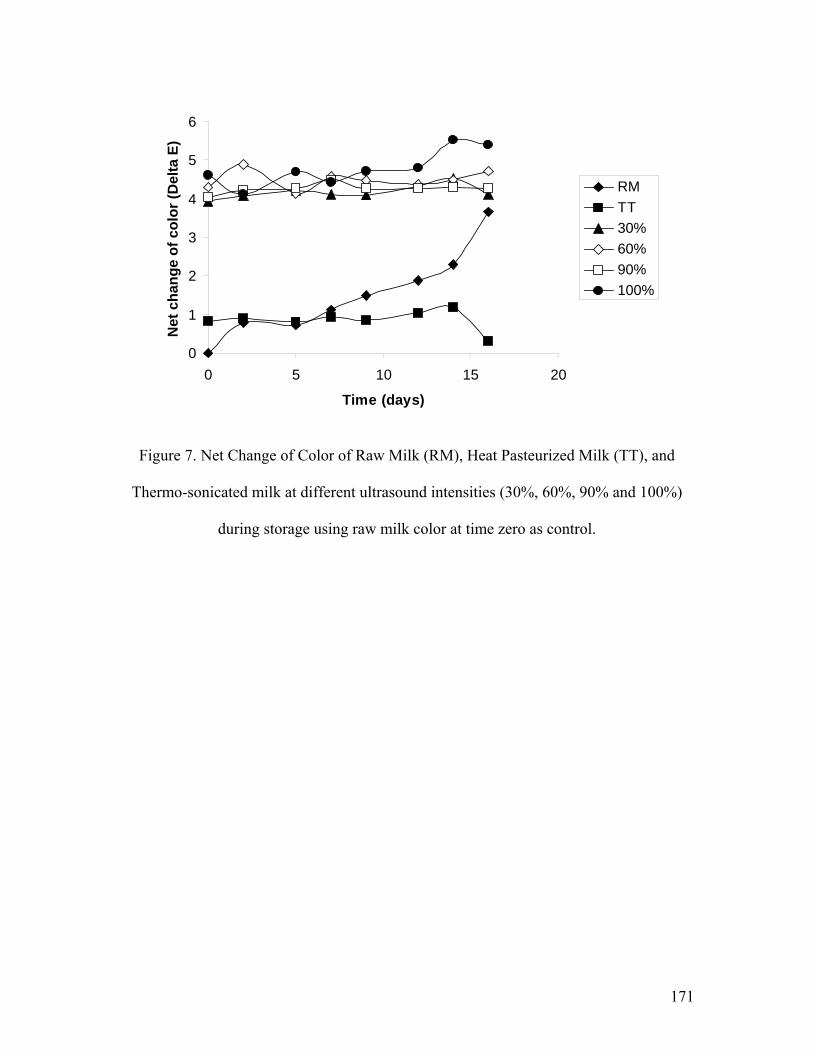
171
0
1
2
3
4
5
6
0 5 10 15 20
Time (days)
Net
cha
nge
of c
olor
(Del
ta E
)RMTT30%60%90%100%
Figure 7. Net Change of Color of Raw Milk (RM), Heat Pasteurized Milk (TT), and
Thermo-sonicated milk at different ultrasound intensities (30%, 60%, 90% and 100%)
during storage using raw milk color at time zero as control.
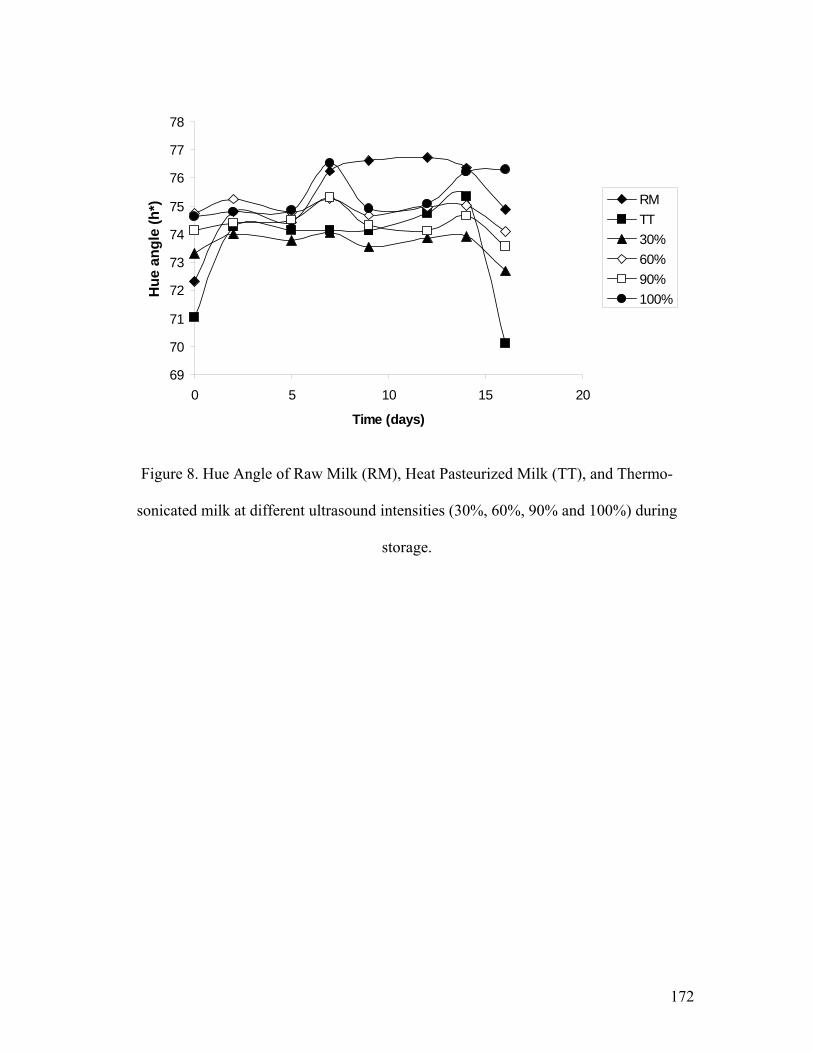
172
69
70
71
72
73
74
75
76
77
78
0 5 10 15 20
Time (days)
Hue
ang
le (h
*) RMTT30%60%90%100%
Figure 8. Hue Angle of Raw Milk (RM), Heat Pasteurized Milk (TT), and Thermo-
sonicated milk at different ultrasound intensities (30%, 60%, 90% and 100%) during
storage.
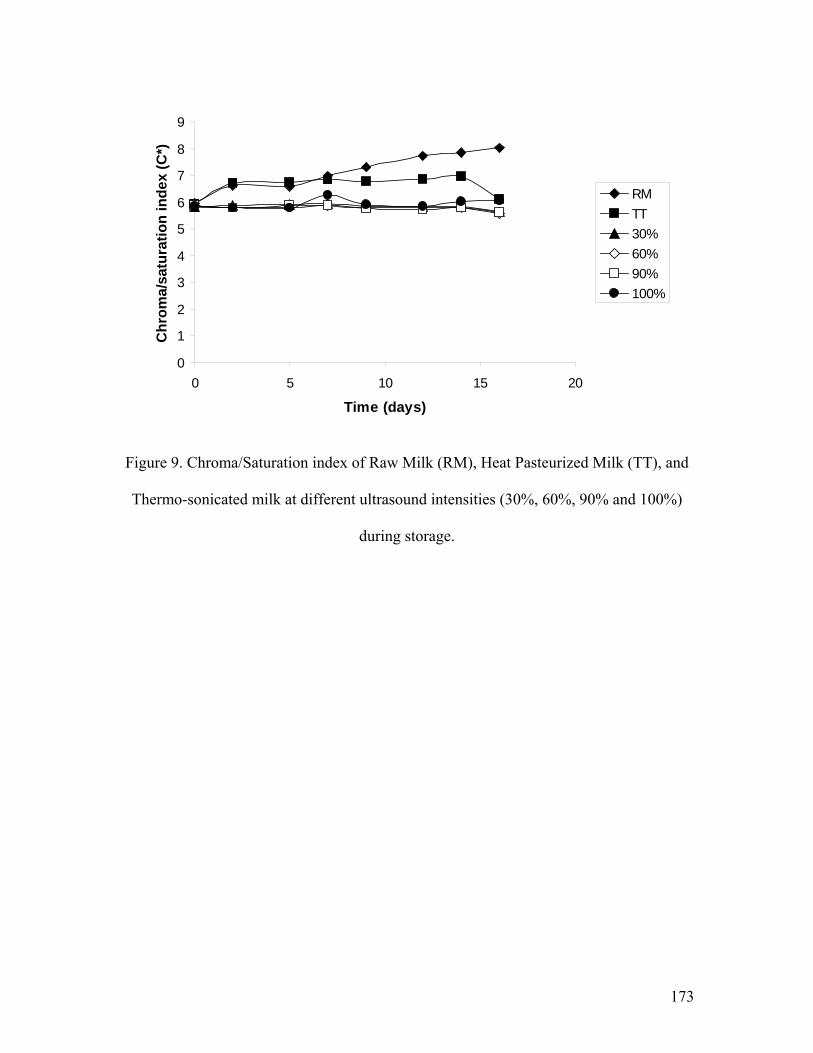
173
0
1
2
3
4
5
6
7
8
9
0 5 10 15 20
Time (days)
Chr
oma/
satu
ratio
n in
dex
(C*)
RMTT30%60%90%100%
Figure 9. Chroma/Saturation index of Raw Milk (RM), Heat Pasteurized Milk (TT), and
Thermo-sonicated milk at different ultrasound intensities (30%, 60%, 90% and 100%)
during storage.
174
CHAPTER FOUR
STUDY OF THE MECHANISM OF INACTIVATION OF Listeria innocua CELLS
IN WHOLE MILK UNDER THERMO-SONICATION TREATMENTS USING
SCANNING ELECTRON MICROSCOPY AND TRANSMISSION ELECTRON
MICROSCOPY
Daniela Bermúdez-Aguirre, Raymond Mawson and
Gustavo V. Barbosa-Cánovas
Abstract
Listeria innocua ATCC 51742 cells were studied under thermal (63ºC) and thermo-
sonciation treatments (63ºC, 400 W, 24 kHz, 120 μm) in raw whole milk. Heat-treated
cells were collected after 30 min, and thermo-sonicated cells were analyzed at 10 and 30
min of treatment. Scanning Electron Microscopy (SEM) and Transmission Electron
Microscopy (TEM) were used to evaluate the physical effects of the cavitation produced
in the cells and to establish a possible mechanism of inactivation. Two different sample
preparation techniques, hexamethyldisilazane (HMDS) dehydration, and freeze-drying
(FD), were evaluated for SEM in an attempt to preserve the cell structure as well as
possible in order to evaluate the effects of ultrasonic treatment. Heat-treated cells showed
a thinning in the cell wall after thermal treatment. Thermo-sonicated cells showed the
common characteristic of the formation of pores outside the cell wall, regardless of the
time of treatment. After 10 min of treatment some cells showed a breakage line,
suggesting a possible breakdown of the membrane with longer treatment times

175
confirming that after 30 min of exposure to ultrasonic treatment, several cells were
broken into pieces. Differences between HMDS and FD techniques in images were not
noticeable. In both cases the microstructure of cells was preserved, and FD was a faster
technique. TEM images matched with SEM images, showing valuable information such
as lack or clumping of cytoplasm content, as well as perforation, disruption, and
roughness of the cell membrane after thermo-sonication.
176
1. Introduction
Studies about the use of sound waves to kill bacteria have been reported since 1929.
Harvey and Loomis (1929) exposed cells to high power, high frequency sound waves,
combined with elevated temperatures in some experiments. Heat was responsible for
injuring cells, but results showed that luminous bacteria were killed after 30 min of
thermal treatment plus sound waves. In the same experiment needle crystals of
benzopurpurin were radiated with sound waves; when observed under a microscope, the
crystals had been broken into shorter lengths. These were the first studies to show how
bacteria are disrupted by sound waves. But because of the expensive material used at that
time, no commercial use was developed.
The mechanism of interaction between cells and ultrasound was under research in
the 1960s when free radical formation was found; later, in 1975, the release of the
cytoplasmic membrane from the cell wall generated by ultrasound was observed as a
thinning of the cell wall (Earnshaw et al., 1995). Low frequency ultrasound or high
power ultrasound generates physical, chemical and mechanical effects in the process or
product. Sonochemistry is used to study some of these effects such as increasing the rate
of chemical reactions, inactivation of microorganisms and enzymes, breakage of cells,
improving heat transfer and extraction processes, among others (Carcel et al., 1998).
When sound waves pass through a liquid, changes in pressure and temperature take place,
and thousands of bubbles are produced, causing a physical phenomenon called cavitation
(Hughes and Nyborg, 1962). Cavitation is generated by alternate rarefaction and
compression cycles in the medium, producing bubbles or cavities (Earnshaw et al., 1995),
and this is assumed to cause a lethal effect of ultrasound in cells (Mañas and Pagán,
177
2005). Implosion occurs when the amplitude is great enough to generate instability and
collapse of bubbles. The bubbles are in extreme movement and collapse violently,
generating an increase of temperature on the order of 104 K and pressures of 101.325 x
106 kPa (106 atm). Some of the effects of cavitation phenomenon are heating, electrical
discharges, sonoluminescence, chemoluminescence, formation of free radicals (Hughes
and Nyborg, 1962), acceleration of chemical reactions, improvement of extraction
processes in animal and vegetable tissues, yeasts and bacteria, and breakage of
microorganisms and viruses (Carcel et al., 1998). The type of effect of ultrasound on cells
is related to the type of cavitation. This physical phenomenon has been classified as
either stable or transient. Stable cavitation is related to the production of small bubbles
dissolved in a liquid that are produced during thousands of cycles. These bubbles have
strong forces and create microcurrents inside the medium that are often called
microstreaming; this phenomenon rubs the membrane surface, causing shear at the cell
membrane and breaking it down. Implosion is not generated in this cavitation. In contrast
with stable cavitation, in transient cavitation the size of bubbles changes quickly in just a
few oscillatory cycles, generating an important increase in temperature and pressure
because of the violent collapse of bubbles; this physical phenomenon attacks the cell
membrane, and it is enough strong to disrupt the cell structures in the cell wall, or even to
remove particles from the surface (Earnshaw et al., 1995). Much of the physical
phenomena associated with cavitation start to be produced when pressures are in the
range of 1013.25 – 101 325 Pa (Hughes and Nyborg, 1962), and much of the lethal effect
in cells is attributed to these high pressures (Earnshaw et al., 1995). Because of the
formation of free radicals in the medium caused by ultrasound, the products of the
178
sonolysis of water, such as OH- and H+ and hydrogen peroxide, could contribute to a
bactericidal effect (Earnshaw et al., 1995). However compared with the mechanical
forces produced in the medium, the free radical effect is almost insignificant (Mañas and
Pagán, 2005).
In the past, one technique for estimating cell breakage generated by physical
alteration methods, such as the use of vibrating needles, was the use of a protein
determination method. In the specific case of erythrocytes, after a treatment involving a
micro-storming phenomenon, measurement of the released hemoglobin in the medium
that was related directly to the breakage of cells was useful. Some micrographs showed
some empty cells of Escherichia coli after treatment, but the damage induced with the
previously cited treatment was insignificant compared to the damage created with
ultrasound (Hughes and Nyborg, 1962). Recently, the use of flow cytometry has been
used to study the effect of ultrasonic treatments on cellular injuries (Ananta et al., 2005).
Thermal treatment has been used in the food industry to inactivate bacteria for
more than 200 years. Some target sites in the cell that are considered as heat resistant
points because of their intrinsic stability are RNA, ribosomes, nucleic acids, enzymes and
proteins (Earnshaw et al., 1995). Damage in membranes, along with loss of nutrients and
ions also contribute to cell death (Mañas and Pagán, 2005), although the main reason for
cell death is still not clear (Earnshaw et al., 1995). Mechanisms of cell inactivation by
ultrasound are not totally clear, but may be attributed to the cavitation of the medium,
heating, shear forces, turbulence or structural effects, among others (Carcel et al., 1998;
Villamiel and de Jong, 2000). As a new technology, most research must be conducted in
an attempt to understand the physiological basis of ultrasound in the process (Earnshaw
179
et al., 1995) and the effects of environmental factors, stress adaptation mechanisms or
sublethal injuries in cells (Mañas and Pagán, 2005).
Listeria monocytogenes is a gram-positive bacteria, non-spore forming, with a rod
shape. It can survive under a broad range of temperature (1ºC to 45ºC) and pH (4.1 to
9.6) conditions some products that are affected are raw milk, pork, raw poultry, ground
beef and some vegetables (Jay, 1992). The size of Listeria cells ranges from 0.8 to 2.5
μm in length and 0.5 μm diameter (Pelczar and Reid, 1972; Rocourt, 1999). Listeria
monocytogenes is considered an emerging pathogen because of the high incidence in
outbreaks reported recently in the United States. Listeria monocytogenes is currently
highlighted as the main foodborne pathogenic microorganism that is generating problems
in the food industry (Banasiak, 2005). Reports show that these foodborne diseases
involve millions of people, with a significant number of deaths every year; in addition,
billions of dollars are spent on treatments (Kozak et al., 1996; Ko and Grant 2003;
Mohan Nair et al., 2004 and 2005). Many of the current outbreaks involve the presence of
Listeria cells in dairy products. According to some reports, species of this microorganism
can be present in 3-4% of raw milk samples, and post-pasteurization contamination could
occur easily in dairy industry facilities because of the environment. Other examples of
dairy products that have already generated listeriosis are pasteurized milk, Mexican-style
cheese, chocolate milk, frozen desserts, ice cream (Kozak et al., 1996), sour milk, cream,
and soft-cheeses such as cottage cheese (Ryser, 1999), showing its ability to survive
under many conditions.
The objective of this work was to study the possible mechanism of inactivation of
Listeria innocua cells under thermo-sonication treatments, using raw milk as a medium
180
of treatment, and to evaluate the physical effects in cells generated by cavitation with
Scanning Electron Microscopy (SEM) and Transmission Electron Microscopy (TEM).
2. Materials and methods
2.1. Listeria innocua cells
Two ml of thawed Listeria innocua cells (ATCC 51742) (one ml of microorganism
grown in the early stationary phase plus one ml of sterile glycerol (20 ml glycerol/100 ml
water) stored at -21ºC were added to 100 ml Tryptic Soy Broth (TSB) with 0.6% Yeast
Extract (TSBYE). The microorganism was kept in a bath shaker at 37ºC and 218 rpm
until it reached the early stationary phase, approximately after 11 h.
2.2. Milk samples
Raw and whole cow’s milk was obtained from Washington State University’s Creamery.
Milk was kept in refrigeration at 4ºC until it was used. The inoculation of Listeria
innocua cells was made directly in a ratio of 1:100 (inoculum: milk; V/V). Fifteen ml of
inoculated raw milk was transferred to a disposable 15 ml sterile plastic conical test tube
to be used as a control sample through microscopy sample preparation.
2.3. Thermal and thermo-sonication treatments
2.3.1. Ultrasound equipment
500 ml of raw milk was used in a sterile double-walled vessel (500 ml) as a treatment
chamber with an internal diameter of 8 cm and depth of 13.5 cm. An ultrasonic processor
Hielscher USA, Inc. (Ringwood, NJ) model UP400S (400 W, 24 kHz, 120 μm) with a 22
181
mm diameter probe was used. A magnetic stirrer was used inside the treatment chamber
to assure the homogeneity of the samples. Thermo-sonication was carried out at 100%
(120 μm) of amplitude of the ultrasound wave and a constant temperature of 63 ± 0.5ºC.
Temperature was set up and kept constant via a refrigerated bath (VWR Scientific Model
1166, Niles, IL). A thermocouple was used in the treatment chamber to monitor the
temperature (63 ±0.5ºC) throughout the experiments. Samples were taken after 10 and 30
min of thermo-sonication and transferred to disposable 15 ml sterile plastic conical test
tubes.
2.3.2. Thermal treatment
Thermal treatment was carried out in the same double-walled vessel of 500 ml. The same
volume of milk was used, and temperature of the medium was kept at 63 ± 0.5ºC with the
use of a heating bath (VWR Scientific Model 1166, Niles, IL) maintained at 65ºC. A
magnetic stirrer was used to ensure that all cells received the same thermal treatment.
Temperature was monitored by a thermocouple. After 30 min of treatment samples were
transferred to disposable 15 ml sterile plastic conical test tubes.
2.4. Sample preparation for electron microscopy
Two different sample preparation techniques were used to evaluate for the less invasive
method throughout the process until the final observation of samples at SEM. The first
technique corresponds to conventional sample preparation for biological specimens that
uses several organic solvents, with the HMDS dehydration as the final step. The second
technique was freeze drying (FD), in an attempt to evaulate the feasibility of this

182
technique for preserving structures as well as the shorter time required, but also as an
alternative sample preparation for comparison with the conventional method.
2.4.1. Method with organic solvents
Disposable 15 ml sterile plastic conical test tubes containing samples of raw milk,
thermo-sonicated and thermally treated milk were centrifuged at 1500 rpm for 5 min at
10ºC. The supernatant was discarded and the cells were resuspended in 15 ml of sterile
TSBYE (Tryptic Soy Broth Yeast Extract). After that, centrifugation was performed
again under the same conditions described above. The supernatant was discarded and the
cells were transferred with a sterile Pasteur pipette to disposable 1.5 ml sterile plastic
microcentrifuge tubes. 0.5 ml of a solution of glutaraldehyde (2%) paraformaldehyde
(2%) in 0.1 M phosphate buffer (pH 7.2) was added to each microtube and allowed to
undergo the fixation process for 24 h at 4ºC. Next, the fixation solution was washed with
phosphate buffer (0.1M) for 10 min, followed by two consecutive 10 min washes with
cacodylate buffer (0.1M). Post-fixation procedure consisted of adding 2% osmium
tetroxide in cacodylate buffer (0.1M) at 4ºC for 24 h. Cells were washed three times with
cacodylate buffer (0.1M) for 10 min each time.
Dehydration of cells was achieved with serial dilution solutions of ethanol (30%,
50%, 60%, 70%, 95% and 100%). Each solution was maintained in contact with cells for
10 min and the last solution (100% ethanol) was used three consecutive times. Samples
after the last dehydration solution and the last time were then prepared for each type of
microscope (SEM or TEM).
183
2.4.2. Freeze-Drying (FD) method
An alternative method using freeze-drying was employed to compare the results of the
traditional lengthy sample preparation for scanning electron microscopy, and also to see
the effect of freeze-drying as a dehydration technique. The procedure was the same until
after the centrifugation steps. Cells in the microcentrifuge tubes were frozen at -37ºC
overnight and then freeze dried in a freeze dryer (Freeze Mobile 24 Virtis, Gardiner, NY)
for 24 h.
2.5. Scanning electron microscopy (SEM)
After dehydration of samples with ethanol, the second dehydration procedure with
hexamethyldisilazane (HMDS) was carried out with the cells. Consecutive 15 min
periods of contact of cells with ethanol/acetone/HMDS solutions in different ratios (1:0:0,
1:1:0, 0:1:0, 0:1:1, 0:0:1, 0:0:1) were used. Air drying was used as a final step, leaving
the microcentrifuge tubes with open lids inside a hood for at least one night.
Samples were mounted on aluminum stubs, and gold plating (Sputter coater, Technics
Hummer V, San José, CA) was used as a final step for freeze-dried and organic
dehydrated samples prior to viewing the samples in a Hitachi S-570 (Japan, Tokyo)
Scanning Electron Microscope (SEM) operating at 20 kV.
2.6. Transmission Electron Microscopy (TEM)
Dehydrated cells were infused in 1:1 Acetone:SPURRS resin and kept overnight. The
concentration of resin was increased every 24 h for 2 d. Next, the polymerization of resin
was accomplished in an oven (Fisher Scientific, Tustin CA) at 70ºC for 24 h in order to
184
form specimen blocks. Sectioning procedure started with hand trimming of the blocks
with a razor blade, after which the samples were sectioned (90 nm) with a glass knife in a
Reichert Ultracut R (Leica, West Germany). Sectioned samples were placed on 200 mesh
copper grids (previously prepared for TEM) and stained according Sato’s Lead Stain
Procedure. 4% Uranyl Acetate and Sato’s Lead Stain were used as the main chemical
reactives in the procedure. Samples were viewed in a JEOL 1200 EX II (Japan, Tokyo)
Transmission Electron Microscope (TEM) operating at 100 kV.
3. Results and discussion
3.1. SEM with HMDS dehydration
Scanning Electron Microscopy was used to observe the changes in the surface of cells
subjected to thermo-sonication compared to thermally treated cells. The conventional
HMDS dehydration of cells was followed as the preparation sample technique because of
the feasibility of this technique for preserving biological specimens for SEM.
The control sample can be observed in Figure 1. The image corresponds to
Listeria innocua cells in raw milk without any treatment. As can be seen in the picture,
the cell surface shows total integrity and a smooth surface, and no changes in the cell
membrane or exterior can be observed. Listeria cells show the traditional rod shape and
the typical dimensions for these cells, 0.8 to 2.5 μm in length and 0.5 μm in diameter
(Pelczar and Reid, 1972; Rocourt, 1999).
As a complement to this study, pictures of the natural flora in raw milk are shown
in Figures 2 and 3. These bacteria were also under thermo-sonication because of their
presence in the milk before starting the treatments. Some of the common microorganisms
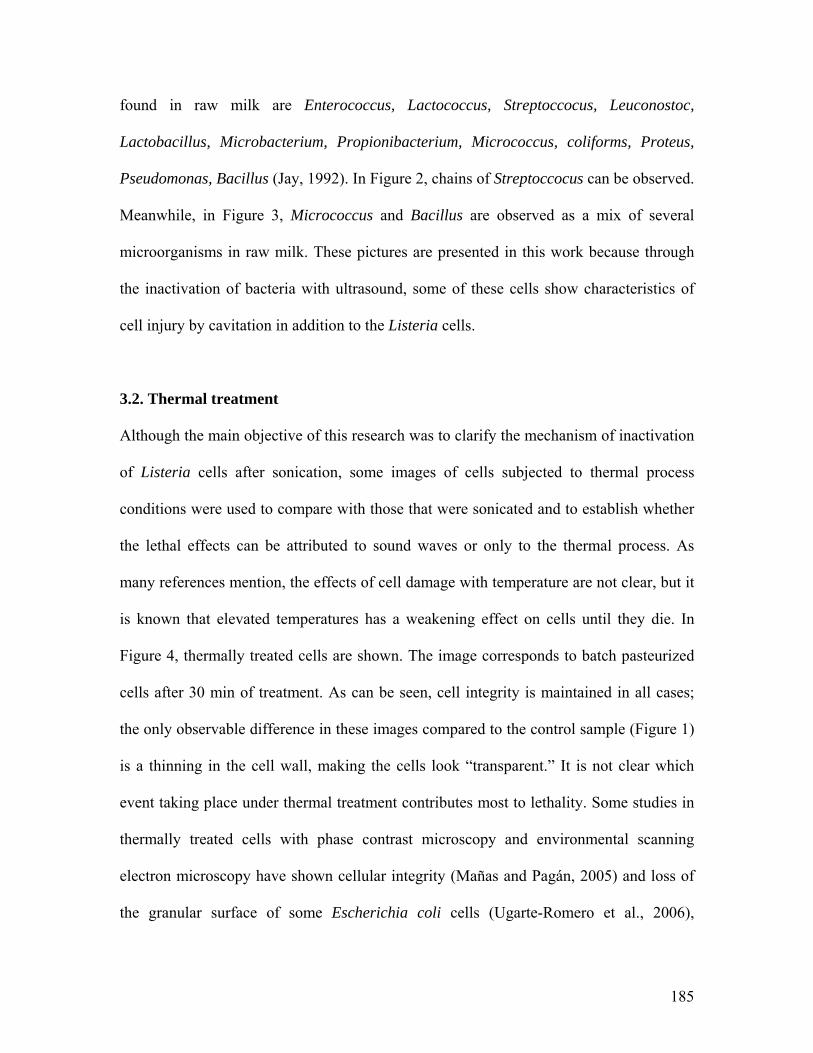
185
found in raw milk are Enterococcus, Lactococcus, Streptoccocus, Leuconostoc,
Lactobacillus, Microbacterium, Propionibacterium, Micrococcus, coliforms, Proteus,
Pseudomonas, Bacillus (Jay, 1992). In Figure 2, chains of Streptoccocus can be observed.
Meanwhile, in Figure 3, Micrococcus and Bacillus are observed as a mix of several
microorganisms in raw milk. These pictures are presented in this work because through
the inactivation of bacteria with ultrasound, some of these cells show characteristics of
cell injury by cavitation in addition to the Listeria cells.
3.2. Thermal treatment
Although the main objective of this research was to clarify the mechanism of inactivation
of Listeria cells after sonication, some images of cells subjected to thermal process
conditions were used to compare with those that were sonicated and to establish whether
the lethal effects can be attributed to sound waves or only to the thermal process. As
many references mention, the effects of cell damage with temperature are not clear, but it
is known that elevated temperatures has a weakening effect on cells until they die. In
Figure 4, thermally treated cells are shown. The image corresponds to batch pasteurized
cells after 30 min of treatment. As can be seen, cell integrity is maintained in all cases;
the only observable difference in these images compared to the control sample (Figure 1)
is a thinning in the cell wall, making the cells look “transparent.” It is not clear which
event taking place under thermal treatment contributes most to lethality. Some studies in
thermally treated cells with phase contrast microscopy and environmental scanning
electron microscopy have shown cellular integrity (Mañas and Pagán, 2005) and loss of
the granular surface of some Escherichia coli cells (Ugarte-Romero et al., 2006),
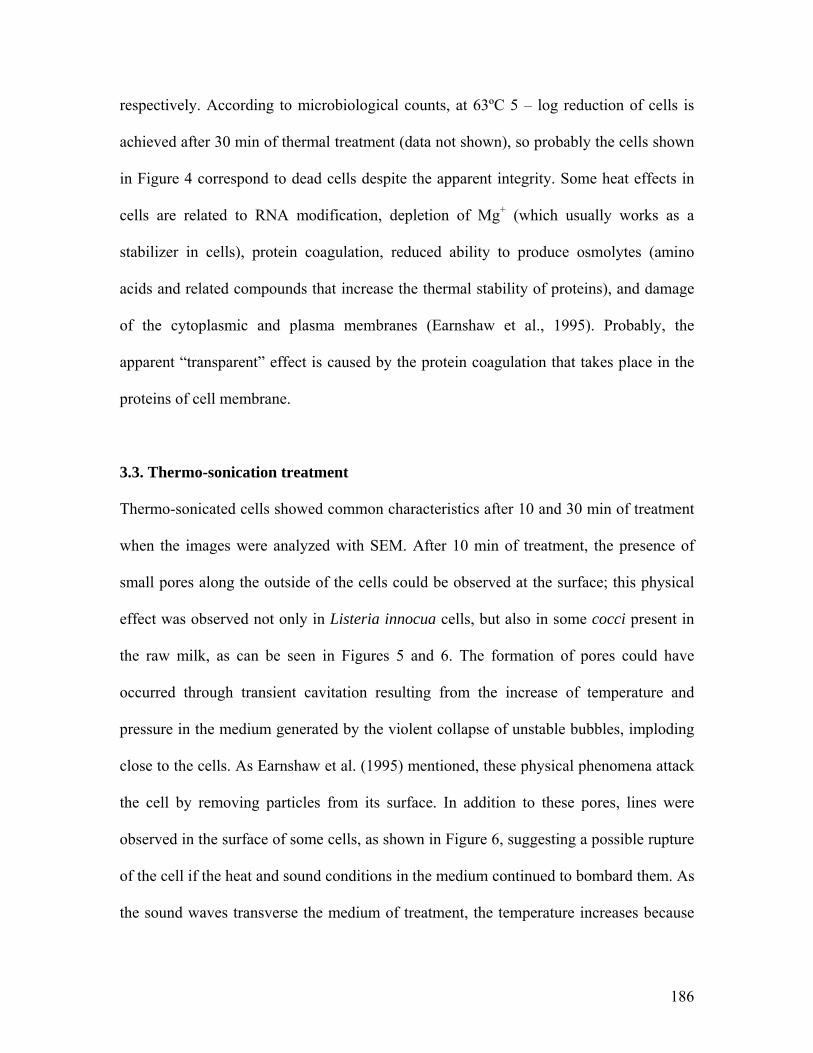
186
respectively. According to microbiological counts, at 63ºC 5 – log reduction of cells is
achieved after 30 min of thermal treatment (data not shown), so probably the cells shown
in Figure 4 correspond to dead cells despite the apparent integrity. Some heat effects in
cells are related to RNA modification, depletion of Mg+ (which usually works as a
stabilizer in cells), protein coagulation, reduced ability to produce osmolytes (amino
acids and related compounds that increase the thermal stability of proteins), and damage
of the cytoplasmic and plasma membranes (Earnshaw et al., 1995). Probably, the
apparent “transparent” effect is caused by the protein coagulation that takes place in the
proteins of cell membrane.
3.3. Thermo-sonication treatment
Thermo-sonicated cells showed common characteristics after 10 and 30 min of treatment
when the images were analyzed with SEM. After 10 min of treatment, the presence of
small pores along the outside of the cells could be observed at the surface; this physical
effect was observed not only in Listeria innocua cells, but also in some cocci present in
the raw milk, as can be seen in Figures 5 and 6. The formation of pores could have
occurred through transient cavitation resulting from the increase of temperature and
pressure in the medium generated by the violent collapse of unstable bubbles, imploding
close to the cells. As Earnshaw et al. (1995) mentioned, these physical phenomena attack
the cell by removing particles from its surface. In addition to these pores, lines were
observed in the surface of some cells, as shown in Figure 6, suggesting a possible rupture
of the cell if the heat and sound conditions in the medium continued to bombard them. As
the sound waves transverse the medium of treatment, the temperature increases because
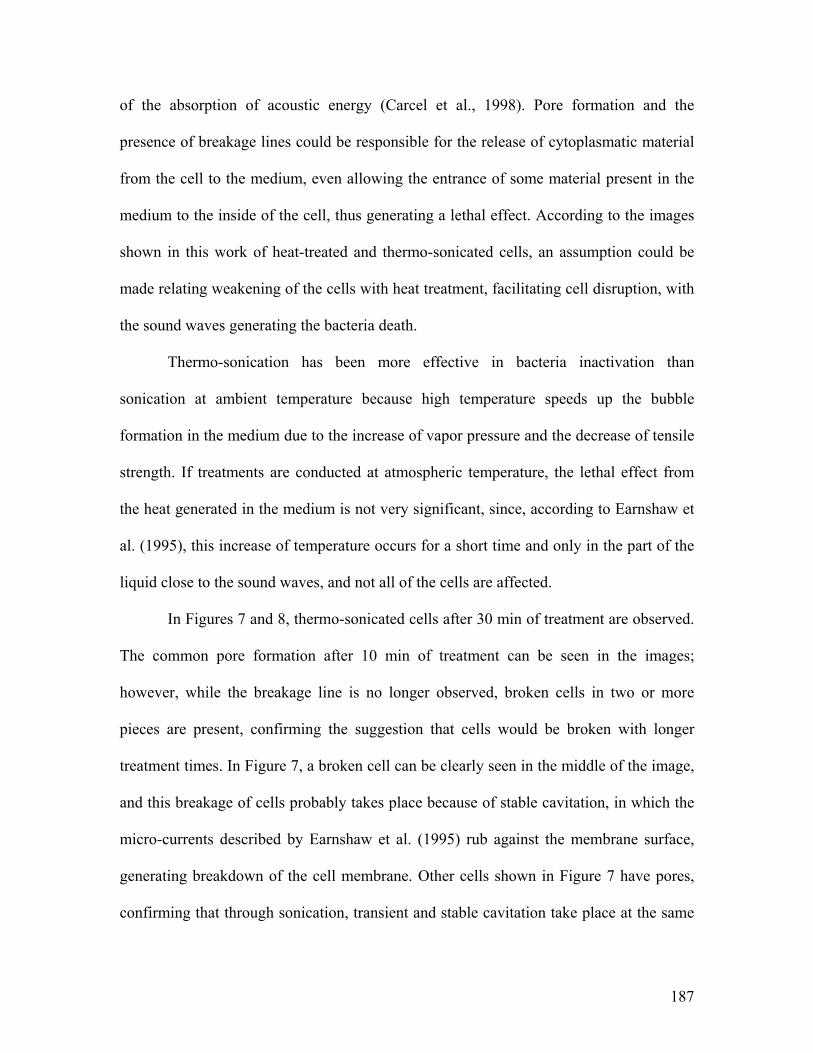
187
of the absorption of acoustic energy (Carcel et al., 1998). Pore formation and the
presence of breakage lines could be responsible for the release of cytoplasmatic material
from the cell to the medium, even allowing the entrance of some material present in the
medium to the inside of the cell, thus generating a lethal effect. According to the images
shown in this work of heat-treated and thermo-sonicated cells, an assumption could be
made relating weakening of the cells with heat treatment, facilitating cell disruption, with
the sound waves generating the bacteria death.
Thermo-sonication has been more effective in bacteria inactivation than
sonication at ambient temperature because high temperature speeds up the bubble
formation in the medium due to the increase of vapor pressure and the decrease of tensile
strength. If treatments are conducted at atmospheric temperature, the lethal effect from
the heat generated in the medium is not very significant, since, according to Earnshaw et
al. (1995), this increase of temperature occurs for a short time and only in the part of the
liquid close to the sound waves, and not all of the cells are affected.
In Figures 7 and 8, thermo-sonicated cells after 30 min of treatment are observed.
The common pore formation after 10 min of treatment can be seen in the images;
however, while the breakage line is no longer observed, broken cells in two or more
pieces are present, confirming the suggestion that cells would be broken with longer
treatment times. In Figure 7, a broken cell can be clearly seen in the middle of the image,
and this breakage of cells probably takes place because of stable cavitation, in which the
micro-currents described by Earnshaw et al. (1995) rub against the membrane surface,
generating breakdown of the cell membrane. Other cells shown in Figure 7 have pores,
confirming that through sonication, transient and stable cavitation take place at the same
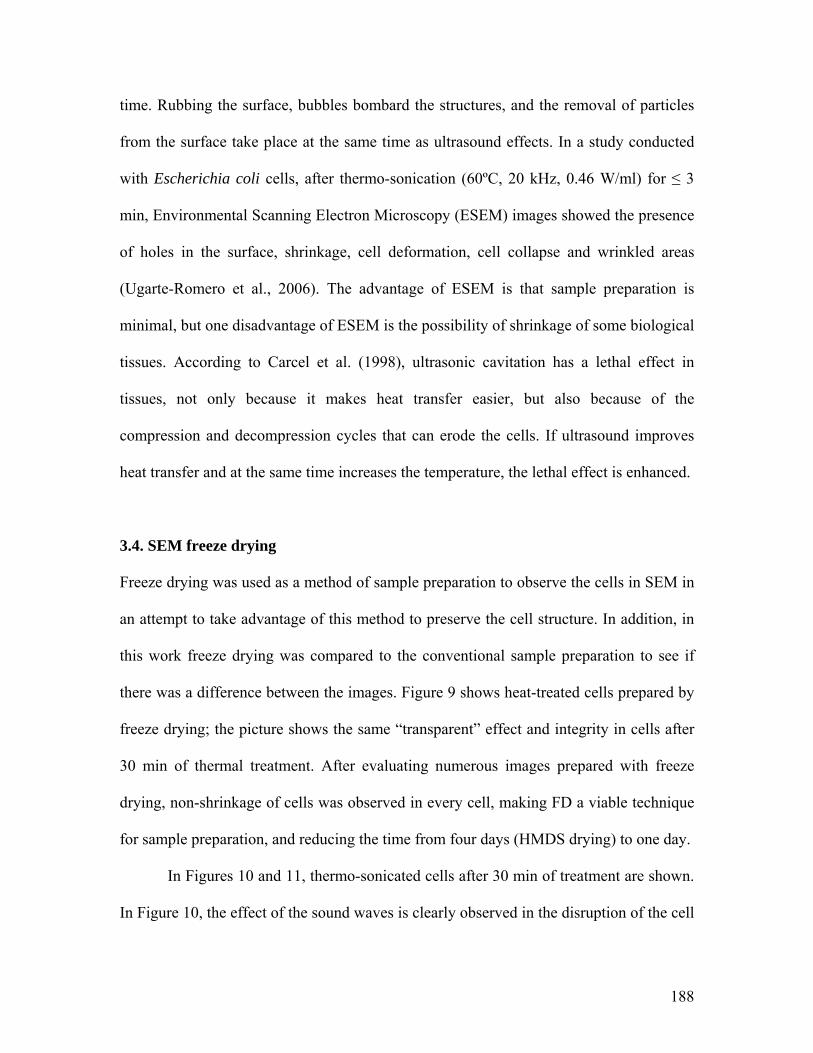
188
time. Rubbing the surface, bubbles bombard the structures, and the removal of particles
from the surface take place at the same time as ultrasound effects. In a study conducted
with Escherichia coli cells, after thermo-sonication (60ºC, 20 kHz, 0.46 W/ml) for ≤ 3
min, Environmental Scanning Electron Microscopy (ESEM) images showed the presence
of holes in the surface, shrinkage, cell deformation, cell collapse and wrinkled areas
(Ugarte-Romero et al., 2006). The advantage of ESEM is that sample preparation is
minimal, but one disadvantage of ESEM is the possibility of shrinkage of some biological
tissues. According to Carcel et al. (1998), ultrasonic cavitation has a lethal effect in
tissues, not only because it makes heat transfer easier, but also because of the
compression and decompression cycles that can erode the cells. If ultrasound improves
heat transfer and at the same time increases the temperature, the lethal effect is enhanced.
3.4. SEM freeze drying
Freeze drying was used as a method of sample preparation to observe the cells in SEM in
an attempt to take advantage of this method to preserve the cell structure. In addition, in
this work freeze drying was compared to the conventional sample preparation to see if
there was a difference between the images. Figure 9 shows heat-treated cells prepared by
freeze drying; the picture shows the same “transparent” effect and integrity in cells after
30 min of thermal treatment. After evaluating numerous images prepared with freeze
drying, non-shrinkage of cells was observed in every cell, making FD a viable technique
for sample preparation, and reducing the time from four days (HMDS drying) to one day.
In Figures 10 and 11, thermo-sonicated cells after 30 min of treatment are shown.
In Figure 10, the effect of the sound waves is clearly observed in the disruption of the cell

189
membrane; the continuity of the cell wall is broken and the free interchange of
cytoplasmatic content and medium material is generated. The loss of some organelles and
lack of cytoplasmatic material from the outside of the cell most likely occurred because
of the separation of the membrane from the cell. In this cell, the breakage seems to have
occurred with longer times than as shown in other pictures, because of the apparent
fragility of the attachment of the disrupted membrane to the rest of the cell. In Figure 11
some broken cells can be observed after 30 min of treatment in which the release of the
cytoplasmatic content occurred and the total structure of the cells was modified. As
Hughes and Nyborg (1962) affirm, one theory about the effect of ultrasound on cells is
the fragmentation of microorganisms. Micro-storming or whirlpools inside the medium
of treatment are associated with the speeding up of some reactions, modifying the
exterior side of cells or breaking them. As shown in both Figures 10 and 11, transient and
stable cavitation again were responsible for the lethal effects. The frequency of the
ultrasound is a parameter that defines the bubble size; at low frequency, bigger bubble
sizes and higher collapse transfer more energy (Earnshaw et al., 1995). This is probably
another reason for different inactivation rates with ultrasound technology in microbial
inactivation, in addition to the kind of bacteria, medium composition, and other variables
such as pressure and use of antimicrobials. In this research, the frequency used was 24
kHz; in some related studies, the frequency used was 20 kHz, but under different
conditions of temperature, medium of treatment and intensity of the cavitation (Guerrero
et al., 2005; Ugarte-Romero et al., 2006).
Although in this study the main focus was the inactivation of Listeria cells, and
many of the shown images correspond to this rod shaped microorganism, much research
190
must be done on the study of cell inactivation with ultrasound. In other novel
technologies such as Pulsed Electric Fields, the size, shape and kind of bacteria is a target
factor for their inactivation. According to Earnshaw et al. (1995), the size of the bacteria
is an important parameter in ultrasound inactivation because the larger surface exposed to
cavitation, leads to more attacked sites. Cocci are more resilient than rod shaped
microorganisms to ultrasound effects, and their smaller size gives them higher resistance
to ultrasound, high pressure and pulsed electric fields (Mañas and Pagán, 2005).
Comparing the images observed under SEM with two different sample
preparations such as HMDS dehydration and freeze drying, in this study both techniques
worked very well to reach the objective of seeing what happens in cells during thermo-
sonication and trying to establish the mechanism of inactivation. Since HMDS
dehydration has been used for a long time as the standard preparation sample, comparing
these images with those obtained using freeze drying showed that both techniques
delivered similar images of inactivation effects, although the time of sample preparation
was reduced considerably with the latter.
3.5. TEM
Some of the images obtained by Transmission Electron Microscopy matched those
observed with Scanning Electron Microscopy. Figure 12 shows thermo-sonicated cells
after 10 and 30 min of treatment, demonstrating similar inactivation effects as those
shown previously in the SEM images. The control cell is shown in Figure 12a; it is
important to note that TEM uses a sectioning procedure in which different layers of the
cell are observed, in contrast with SEM, which analyzes the whole cell surface. In Figure
191
12b, the membrane of the cell shows roughening and thinning compared to the control
cell (Figure 12a), as well as a partial loosening of the cytoplasmic membrane from the
cell wall, which is in agreement with the event described in ultrasonicated cells in 1975
by Earnshaw et al. (1995). Other lethal effects observed by TEM in cells are shown in
Figures 12c, 12d and 12e, including the formation of small holes, the disruption and
breakage of cell membranes, the lack of cytoplasm and the development of cytoplasm
clumps. The formation of pores and breakage of membranes were observed previously
with SEM images, but the advantage of TEM in the analysis of cells was that some
effects in the cytoplasm content can be observed, such as the lack of cytoplasm and the
clumping of cytoplasm due to both types of cavitation (stable cavitation that breaks down
the cell membranes, and transient cavitation that removes particles that could be
cytoplasmatic content, such as some organelles). Cell breakage is related to the shearing
action generated by the whirlpools generated from bubbles (Hughes and Nyborg, 1962).
As Transmission Electron Microscopy can deliver very valuable information about the
cell structure because of the sectioning technique used to prepare the samples, some cells
showed unseen effects, as shown in Figure 12f. This cell was thermo-sonicated for 10
min, but the damage was not visible in the analyzed section of the whole cell. It is likely
that this cell was injured on the very upper surface and so the TEM image did not show
the effects, although the physical effects of cavitation are evident in much of the image.
In this case, SEM would probably be most useful for observing the injured surface. In
Figures 12g and 12h, other effects are shown, such as the breakage of the cell membrane
in the upper left corner in Figure 12g and the presence of cytoplasm clumps in Figure
12h. In some studies conducted with yeasts (Saccharomyces cerevisiae) under thermo-
192
sonication (45ºC, 95.2 μm, 20 kHz), after 20 min TEM showed images of puncturing in
the cell wall, the disruption of organelles and a discontinuity of the plasmalemma. The
use of chitosan enhanced the thermo-sonication treatments, improving the inactivation
rate and the lethal effects observed in cells (Guerrero et al., 2005). Because of cavitation,
free radicals are formed in the medium. These free radicals can act in biological materials
such as DNA (Villamiel et al., 1999), breaking the hydrogen bonds between bases or
even breaking DNA molecules by liquid shear, thus reducing the molecular size (Hughes
and Nyborg, 1962). Future studies in cavitation could be done with hybridization in situ
that will deliver important information.
3.6. Possible mechanism of inactivation of cells under thermo-sonication treatments
On the basis of the previous images and related references (Guerrero et al., 2005; Ugarte-
Romero et al., 2006) that describe the possible effects of cavitation of cells, a summary of
some of the main physical effects of thermo-sonication as lethal agents in Listeria cells
could include the weakening of the cell membrane due to heating action, followed by the
formation of pores along the outside of the membrane, the disruption of the cell
membrane, the lack or clumping of cytoplasmic material generated by transient
cavitation, and finally the breakdown of the cell membrane due to erosion caused by
stable cavitation. This could be described as the mechanism of inactivation for Listeria
innocua cells during and after thermo-sonication at 63ºC and 120 μm; although the same
conclusion could be generalized for most microorganisms, it is important to note that
every microorganism has a different response to the same inactivation method. For
example, the type of bacteria is another factor of interest in ultrasound inactivation; in
193
accordance with some studies, gram-positive microorganisms are more resistant to
ultrasound than gram-negative microorganisms, probably because the cell wall between
them is different. Gram-positive cell walls are thicker than gram-negative cell walls,
which contain a tight layer of peptidoglycans (Earnshaw et al., 1995), making a rigid
envelope of the cell (Mañas and Pagán, 2005). Listeria species are gram-positive bacteria
and, because of that, they are more resistant and their cell wall is stronger against
sonication. Thus, the inactivation of gram-negative bacteria may occur faster, and the
cells might present more visible effects in the first minutes of treatment. Thermo-
sonication seems to be a viable method to inactivate cells, although extremely high
temperatures should not be used, since cavitation looses intensity as temperature
increases; when the temperature is close to the boiling point, the so-called micro-
storming inside the medium decreases, because the vapor pressure acts as a cushion
(Villamiel et al., 1999).
4. Conclusions
Thermo-sonication is a viable technology to inactivate bacteria; the heating effect in cells
seems to weaken the microorganisms, making it easier for the cavitation to disrupt and
break down the cells. The main effects of cavitation in cells are the formation of small
pores, the disruption of cell membranes, and lack or clumping of cytoplasmic material
with the final breakdown of cell membranes inactivating the microorganism. Stable and
transient cavitation acting together on cells causes the erosion of the cell surface and the
disruption of cell structures.
194
References
Ananta, E., Voigt, D., Zenker, M., Heinz, V., Knorr, D., 2005. Cellular injuries
upon exposure of Escherichia coli and Lactobacillus rhamnosus to high-intensity
ultrasound. Journal of Applied Microbiology 99, 271-278.
Banasiak, K., 2005. News. Food Technology 59 (11), 13-14.
Carcel, J.A., Benedito, J., SanJuan, N., Sánchez, E., 1998. Aplicación de los
ultrasonidos en las industrias de productos lácteos y derivados. Alimentación. Equipos y
Tecnología, 135- 141.
Earnshaw, R.G., Appleyard, J., Hurst, R.M., 1995. Understanding physical
inactivation processes: Combined preservation opportunities using heat, ultrasound and
pressure. International Journal of Food Microbiology 28, 197-219.
Guerrero, S., Tognon, M., Alzamora, S.M., 2005. Response of Saccharomyces
cerevisiae to the combined action of ultrasound and low weight chitosan. Food Control
16, 131-139.
Harvey, E., Loomis, A., 1929. The destruction of luminous bacteria by high
frequency sound waves. Journal of Bacteriology 17, 373-379.
195
Hughes, D.E., Nyborg, W.L., 1962. Cell disruption by ultrasound. Science 138
(3537), 108-114.
Jay, J., 1992. Modern Food Microbiology. 4th Ed. Van Nostrand Reinhold. New
York
Ko, S., Grant, S.A., 2003. Development of a novel FRET method for detection of
Listeria or Salmonella. Sensors and Actuators B96, 372-378.
Kozak, J., Balmer, T., Byrne, R., Fisher, K., 1996. Prevalence of Listeria
monocytogenes in foods: Incidence in dairy products. Food Control 7(4-5), 215-221.
Mañas, P., Pagán, R., 2005. A review: Microbial inactivation by new technologies
of food preservation. Journal of Applied Microbiology 98, 1387-1399.
Mohan Nair, M.K., Vasudevan, P., Hoagland, T., Venkitanarayanan, K., 2004.
Inactivation of Escherichia coli O157:H7 and Listeria monocytogenes in milk by caprilic
acid and monocaprylin. Food Microbiology 21, 611-616.
Mohan Nair, M.K., Vasudevan, P., Venkitanarayanan, K., 2005. Antibacterial
effect of black seed oil on Listeria monocytogenes. Food Control 16, 395-398.
Pelczar, M.J., Reid, R.D., 1972. Microbiology. McGraw-Hill, Inc. USA. pp. 657.
196
Rocourt, J., 1999. The Genus Listeria and Listeria monocytogenes: Phylogenetic
Position, Taxonomy, and Identification. In: Ryser, E.T., Marth, E.H. (Eds.), Listeria,
Listeriosis and Food Safety, 2nd Ed. Marcel Dekker, New York, pp. 1-20.
Ryser, E.T., 1999. Foodborne listeriosis. In: Ryser, E.T., Marth, E.H. (Eds.),
Listeria, Listeriosis and Food Safety, 2nd Ed. Marcel Dekker, New York, pp. 299-358.
Ugarte-Romero, E., Feng, H., Martin, S.E., Cadwallader, K.R., Robinson, S.J.,
2006. Inactivation of Escherichia coli with power ultrasound in apple cider. Journal of
Food Science 71(2), E102-E108.
Villamiel, M., de Jong, P., 2000. Influence of high-intensity ultrasound and heat
treatments in continuous flow on fat, proteins, and native enzymes of milk. Journal of
Agriculture and Food Chemistry 48, 472-478.
Villamiel, M., van Hamersveld, E.H., de Jong, P., 1999. Review: Effect of
ultrasound processing on the quality of dairy products. Milk Science International 54(2),
69-73.
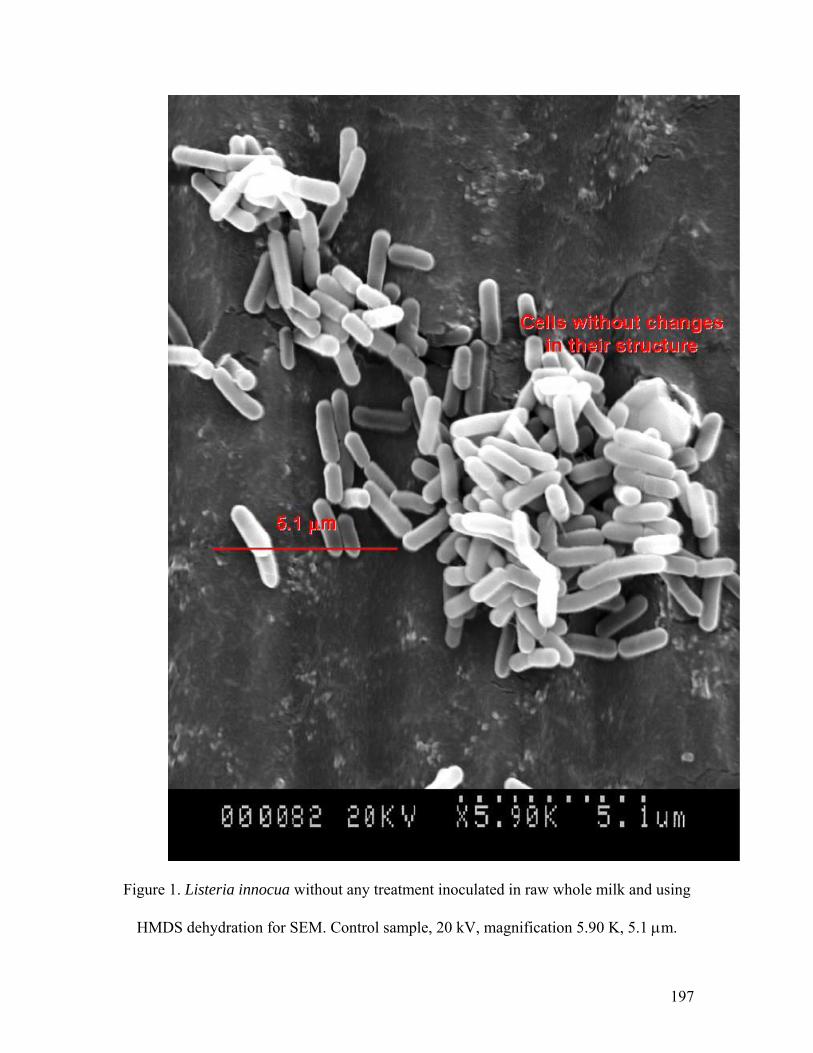
197
Figure 1. Listeria innocua without any treatment inoculated in raw whole milk and using
HMDS dehydration for SEM. Control sample, 20 kV, magnification 5.90 K, 5.1 μm.
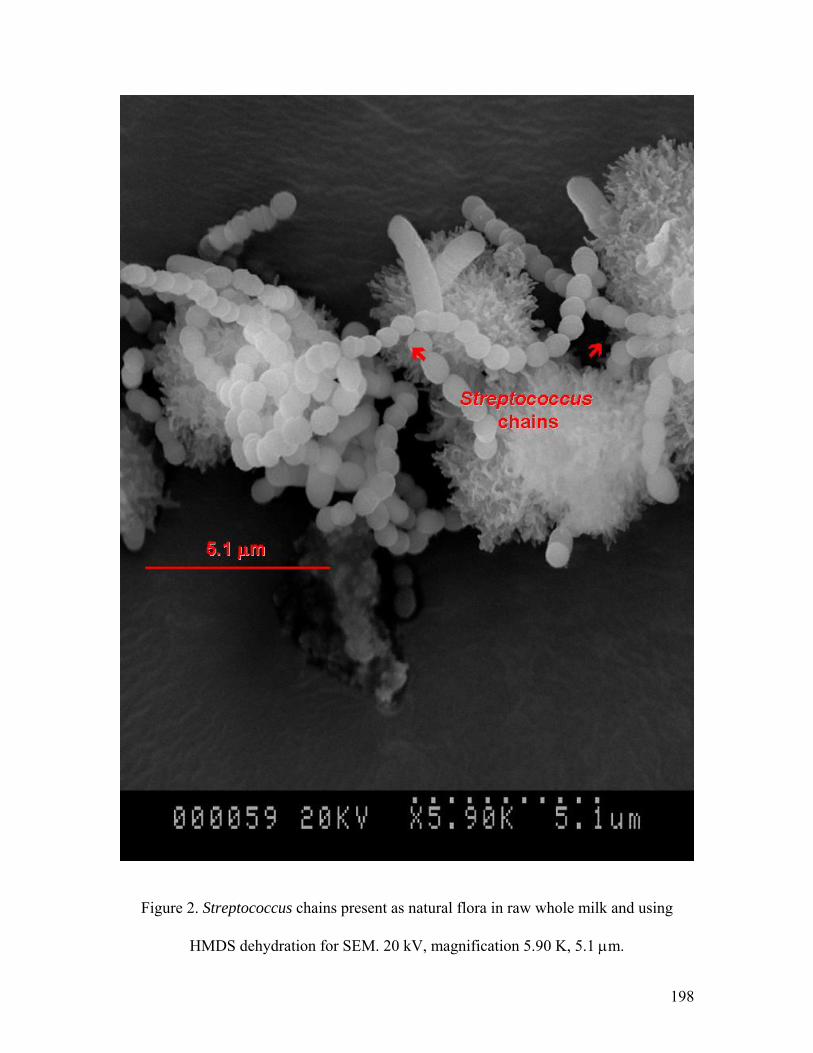
198
Figure 2. Streptococcus chains present as natural flora in raw whole milk and using
HMDS dehydration for SEM. 20 kV, magnification 5.90 K, 5.1 μm.
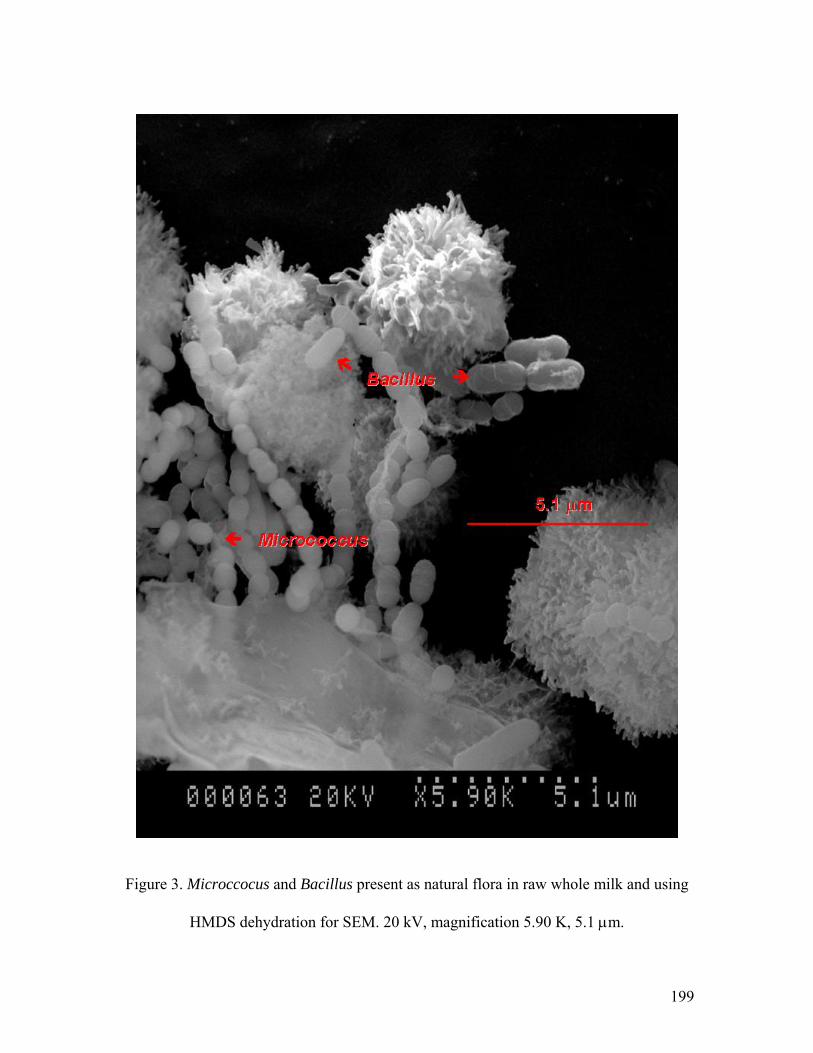
199
Figure 3. Microccocus and Bacillus present as natural flora in raw whole milk and using
HMDS dehydration for SEM. 20 kV, magnification 5.90 K, 5.1 μm.
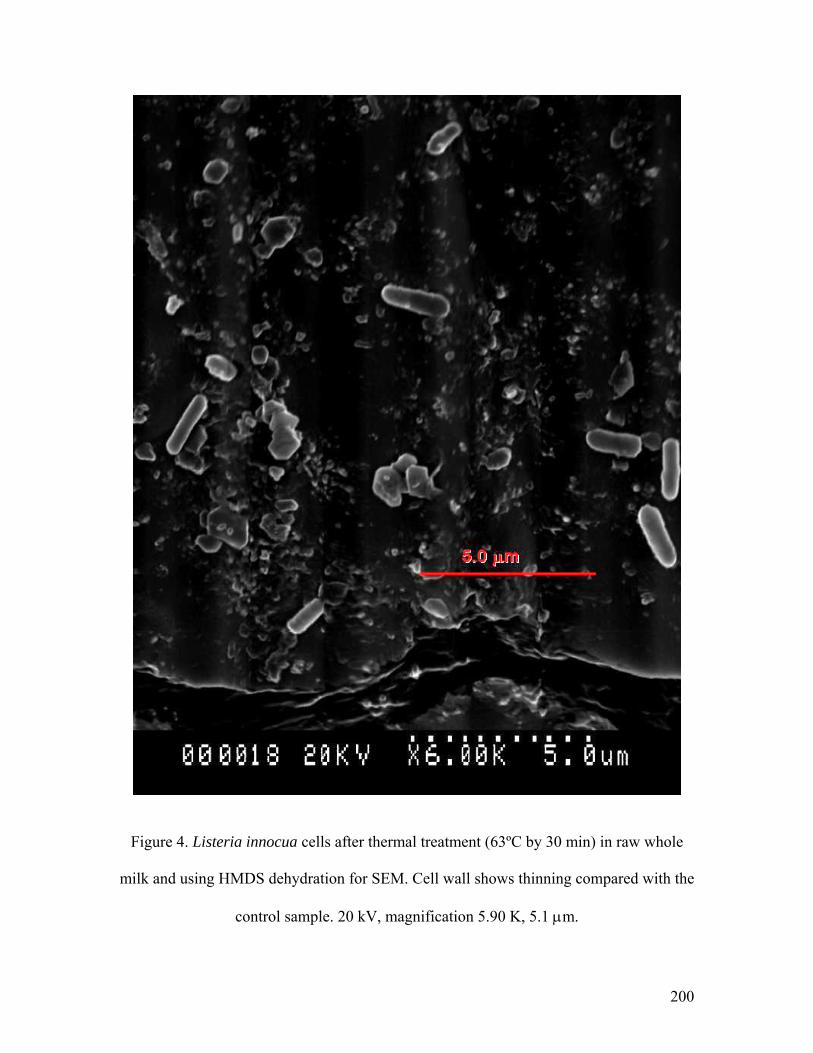
200
Figure 4. Listeria innocua cells after thermal treatment (63ºC by 30 min) in raw whole
milk and using HMDS dehydration for SEM. Cell wall shows thinning compared with the
control sample. 20 kV, magnification 5.90 K, 5.1 μm.
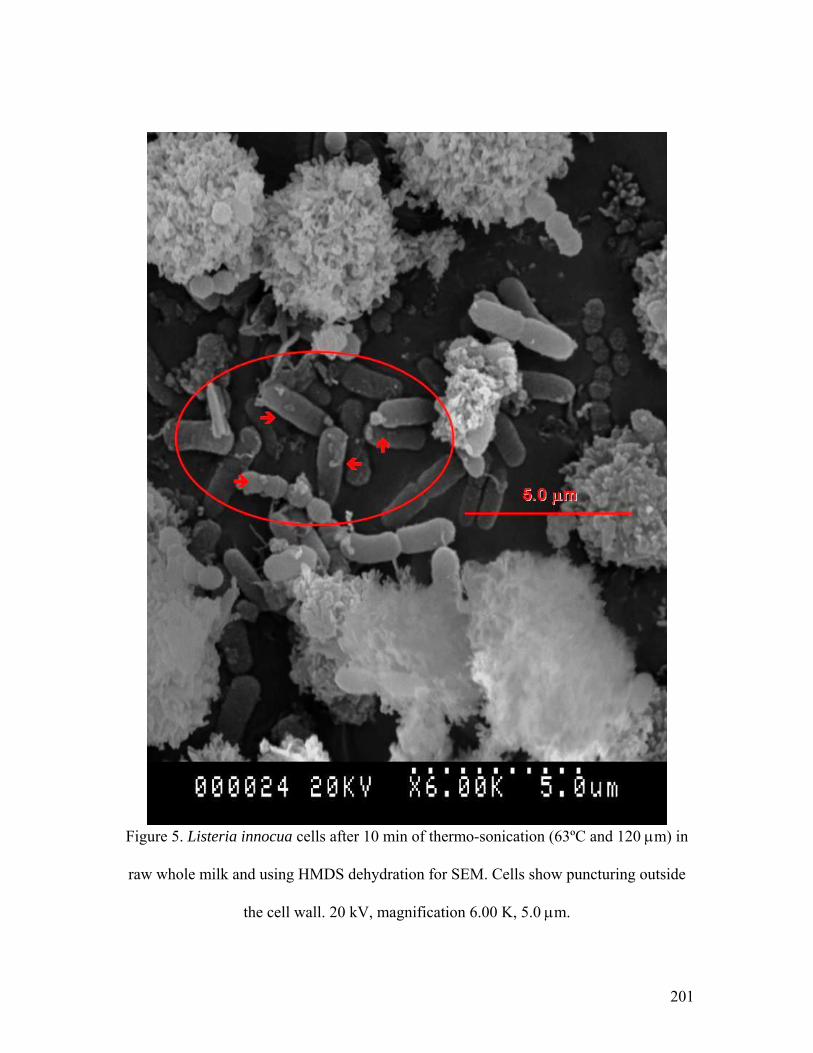
201
Figure 5. Listeria innocua cells after 10 min of thermo-sonication (63ºC and 120 μm) in
raw whole milk and using HMDS dehydration for SEM. Cells show puncturing outside
the cell wall. 20 kV, magnification 6.00 K, 5.0 μm.
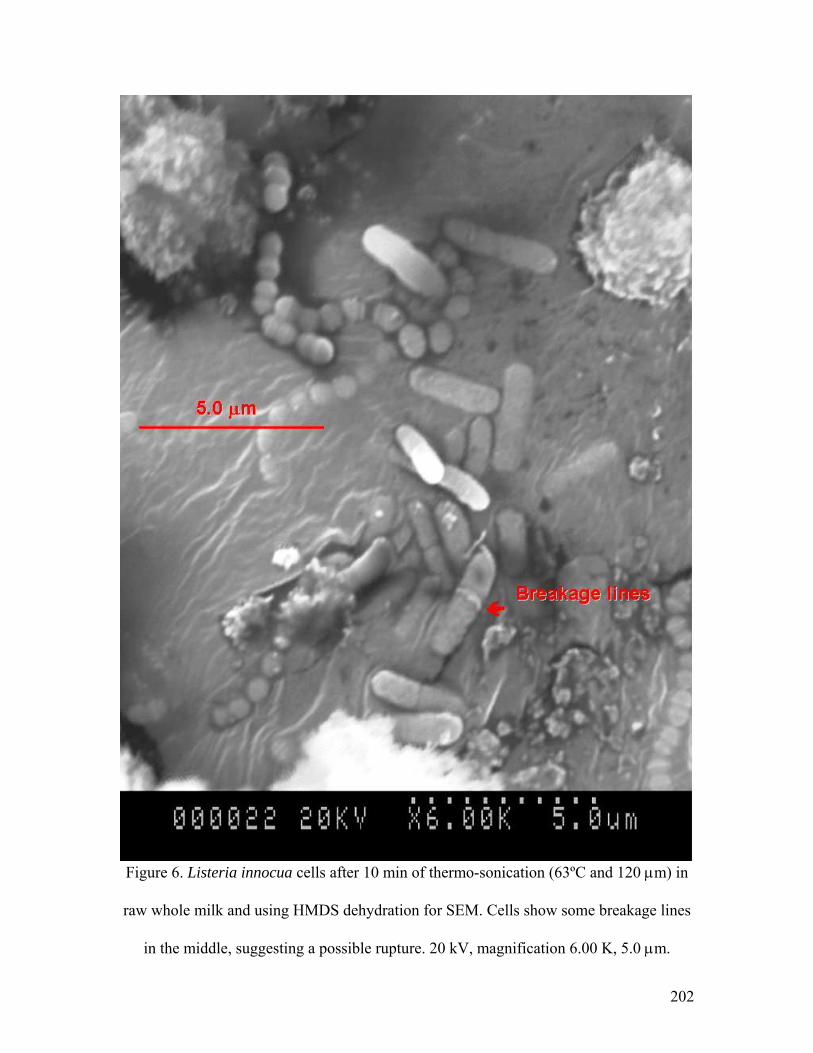
202
Figure 6. Listeria innocua cells after 10 min of thermo-sonication (63ºC and 120 μm) in
raw whole milk and using HMDS dehydration for SEM. Cells show some breakage lines
in the middle, suggesting a possible rupture. 20 kV, magnification 6.00 K, 5.0 μm.
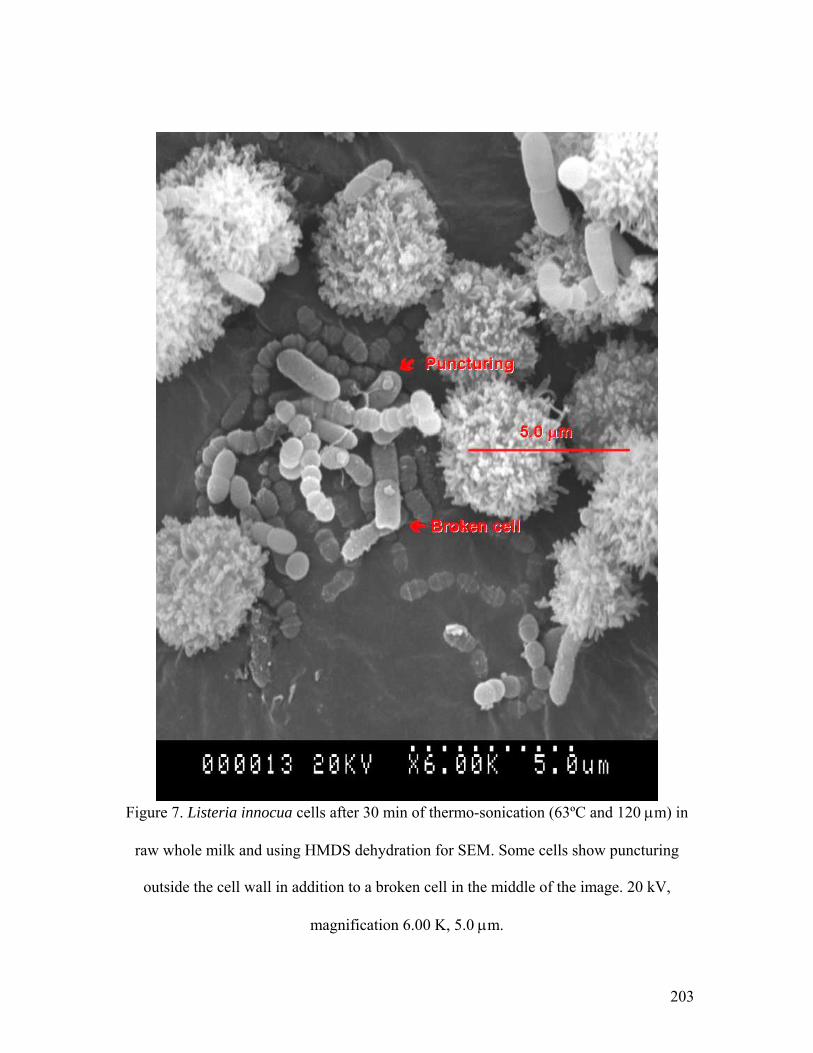
203
Figure 7. Listeria innocua cells after 30 min of thermo-sonication (63ºC and 120 μm) in
raw whole milk and using HMDS dehydration for SEM. Some cells show puncturing
outside the cell wall in addition to a broken cell in the middle of the image. 20 kV,
magnification 6.00 K, 5.0 μm.
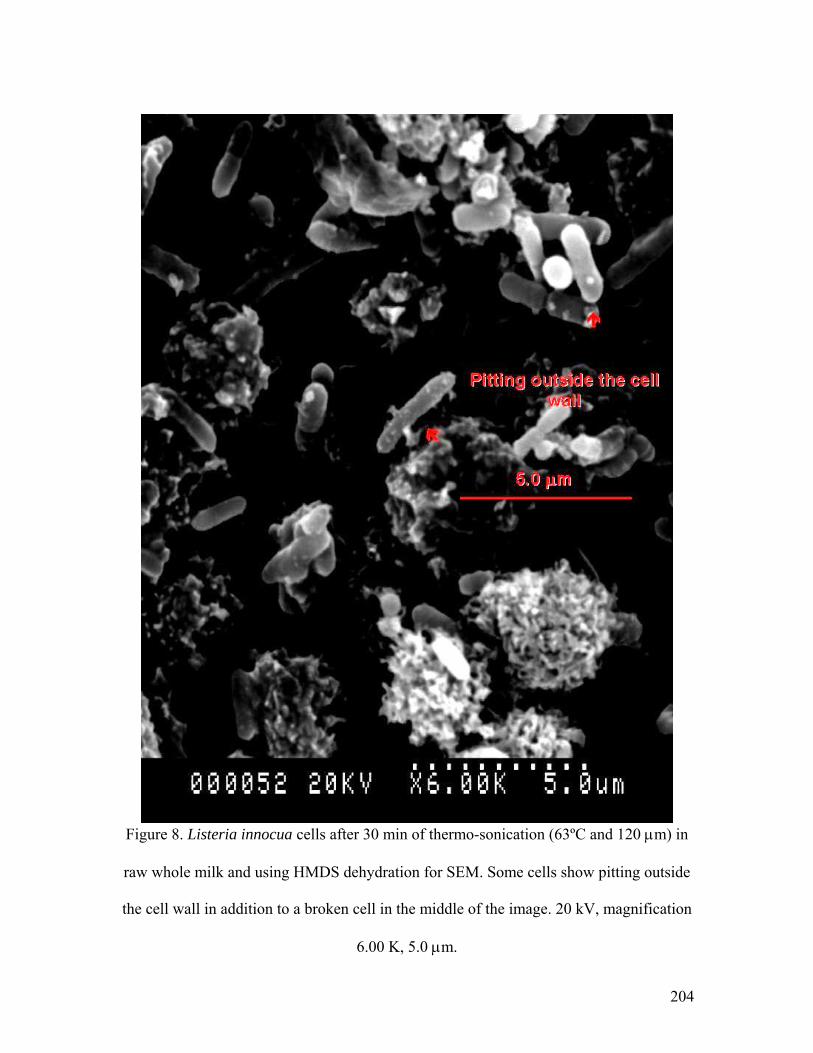
204
Figure 8. Listeria innocua cells after 30 min of thermo-sonication (63ºC and 120 μm) in
raw whole milk and using HMDS dehydration for SEM. Some cells show pitting outside
the cell wall in addition to a broken cell in the middle of the image. 20 kV, magnification
6.00 K, 5.0 μm.
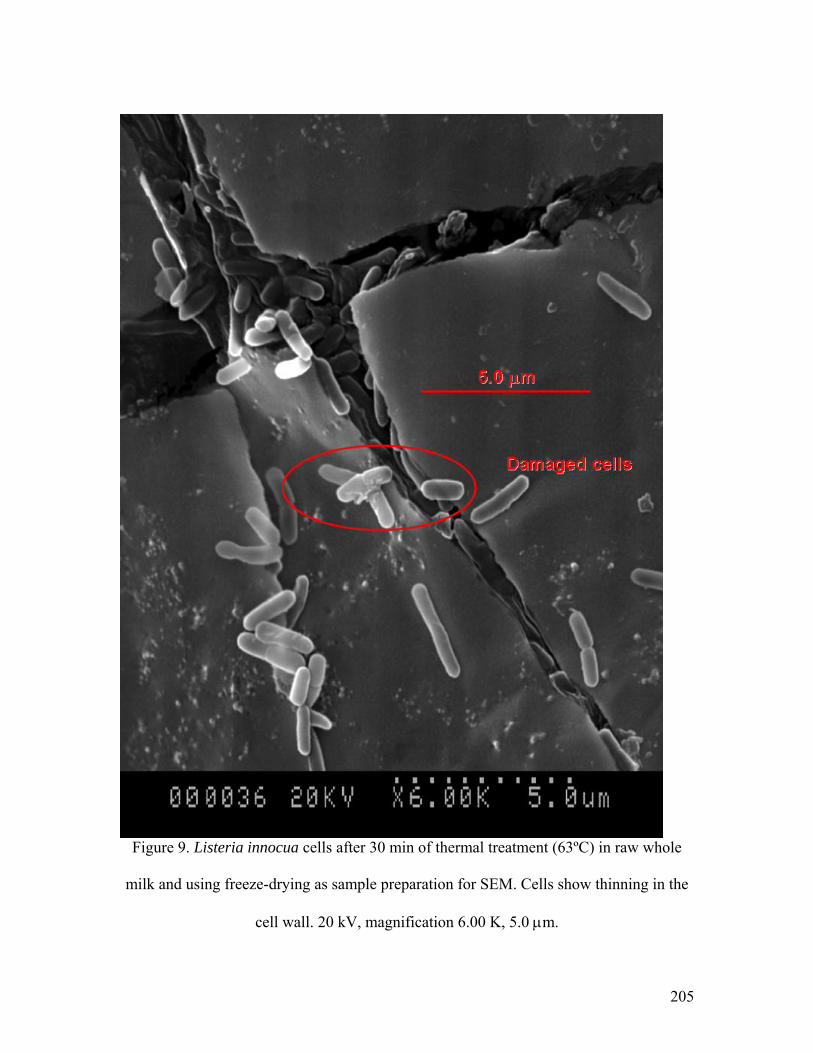
205
Figure 9. Listeria innocua cells after 30 min of thermal treatment (63ºC) in raw whole
milk and using freeze-drying as sample preparation for SEM. Cells show thinning in the
cell wall. 20 kV, magnification 6.00 K, 5.0 μm.
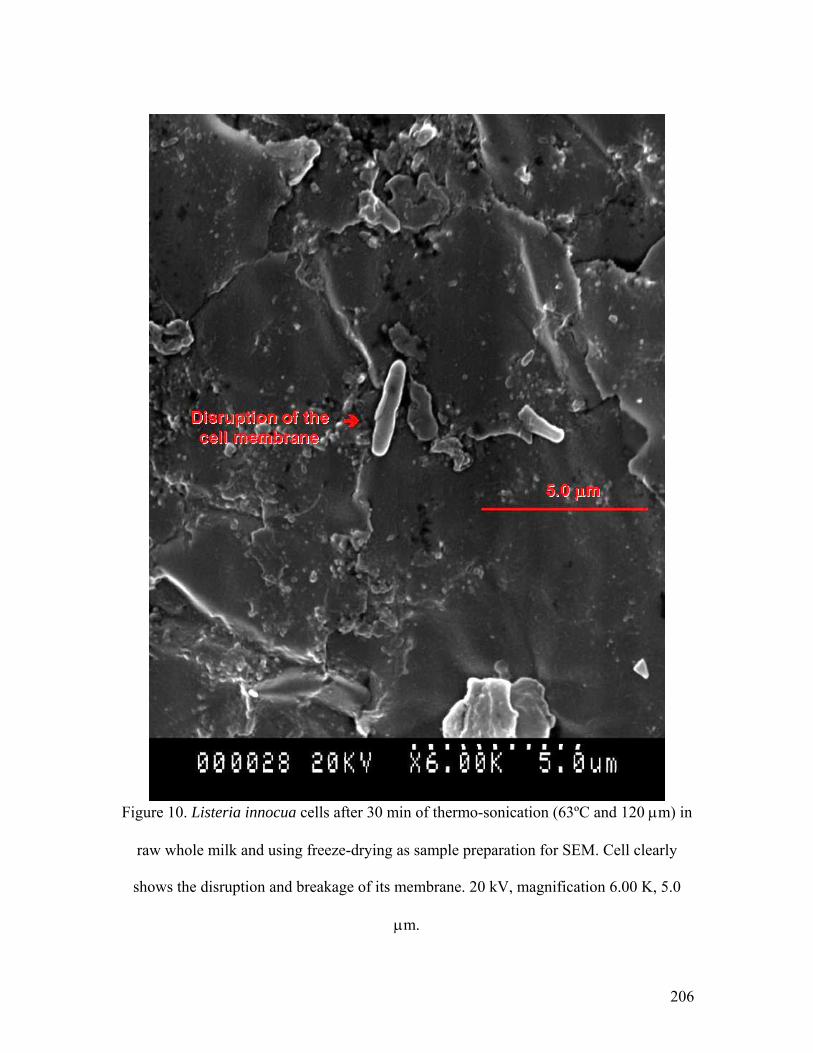
206
Figure 10. Listeria innocua cells after 30 min of thermo-sonication (63ºC and 120 μm) in
raw whole milk and using freeze-drying as sample preparation for SEM. Cell clearly
shows the disruption and breakage of its membrane. 20 kV, magnification 6.00 K, 5.0
μm.
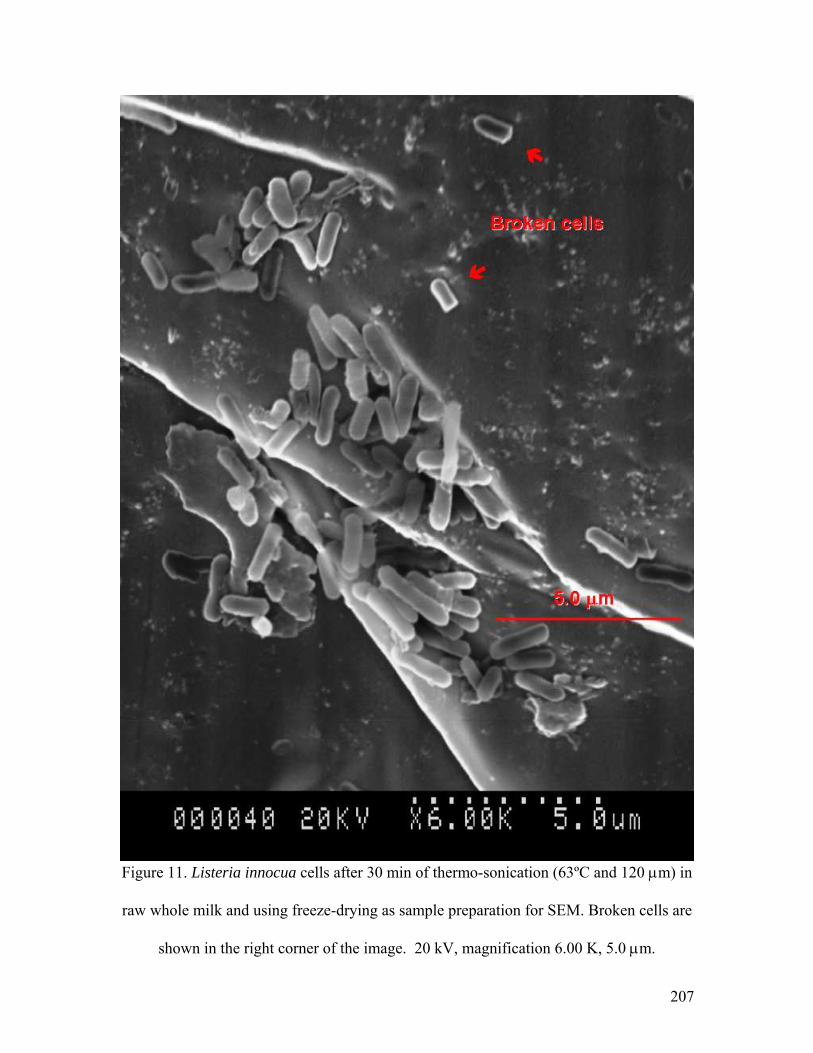
207
Figure 11. Listeria innocua cells after 30 min of thermo-sonication (63ºC and 120 μm) in
raw whole milk and using freeze-drying as sample preparation for SEM. Broken cells are
shown in the right corner of the image. 20 kV, magnification 6.00 K, 5.0 μm.
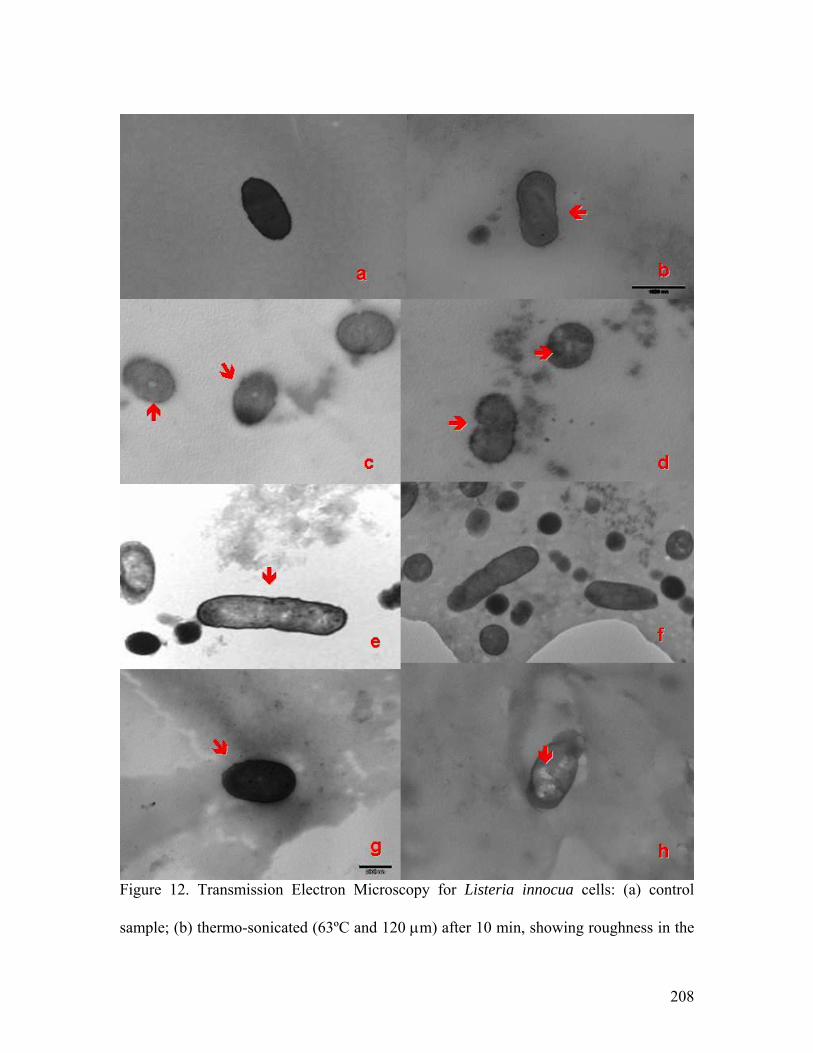
208
Figure 12. Transmission Electron Microscopy for Listeria innocua cells: (a) control
sample; (b) thermo-sonicated (63ºC and 120 μm) after 10 min, showing roughness in the
209
cell wall; (c) thermo-sonicated (63ºC and 120 μm) after 30 min, showing pore formation;
(d) thermo-sonicated (63ºC and 120 μm) after 30 min, showing pore formation and
disruption of the cell wall; (e) thermo-sonicated (63ºC and 120 μm) after 30 min,
showing lack of cytoplasm; (f) thermo-sonicated (63ºC and 120 μm) after 30 min,
showing unseen effects; (g) thermo-sonicated (63ºC and 120 μm) after 30 min with the
cell membrane broken; (h) thermo-sonicated (63ºC and 120 μm) after 30 min, showing
cytoplasm clumping. Scale 1000 to 2000 nm.
210
CHAPTER FIVE
MICROSTRUCTURE OF FAT GLOBULES IN WHOLE MILK AFTER
THERMO-SONICATION TREATMENT
Daniela Bermúdez-Aguirre, Raymond Mawson and
Gustavo V. Barbosa-Cánovas
ABSTRACT
The structure of fat globules in whole milk was studied after heat and thermo-
sonication treatments to observe what happens during these processes at the microscopic
level (using Scanning Electron Microscopy). Raw whole milk was thermo-sonicated in an
ultrasonic processor—Hielscher® UP400S (400 W, 24 kHz, 120 μm amplitude), using a
22 mm probe at 63ºC for 30 min. Heat treatment involved heating the milk at 63ºC for 30
min. Color and fat content were measured to correlate the images with analytical
measurements. Results showed that the surface of the fat globule was completely
roughened after thermo-sonication. Ultrasound waves were responsible for disintegrating
the milk fat globule membrane (MFGM), by releasing the triacylglycerols. Furthermore,
the overall structure of milk after sonication showed smaller fat globules (smaller than 1
μm) and a granular surface. This was due to the interaction between the disrupted MFGM
and some casein micelles. Minor changes in the aspect of the globules between thermal
and raw milks were detected. Color measurements showed higher L values for sonicated
samples. Sonicated milk was whiter (92.37 ± 0.20) and generally showed a better degree
of luminosity and homogenization compared to thermal treated milk (88.25 ± 0.67) and
211
raw milk (87.82 ± 0.18). Fat content was higher after sonication (4.24%) than in
untreated raw milk (4.04%) because of the release of triacylglycerols from the core of the
globules. The advantages of thermo-sonicated milk is that it can be pasteurized and
homogenized in just one step, it can be produced with important cost savings, and it has
better characteristics, making thermo-sonication a potential processing method for milk
and most other dairy products.

212
1. Introduction
Milk fat or the milk lipid globule membrane (MFGM) is related to the membrane
and the material associated with it that surrounds the milk fat globules. The core of these
micro-droplets contains triacylglycerols. The surface coating material contains
cholesterol and phospholipids such as sphingomyelin and phosphoglycerides of choline,
ethanolamine, inositol and serine (Keenan and Patton, 1995), along with lipoproteins,
glycoproteins and enzymes (Michalski and others, 2002a) such as xanthine oxidase
(Wiking and others, 2003); butyrophillin, γ-glutamyl transpeptidase, among others
(Wiking and others, 2006). The MFGM and lipid droplets represent 80% of the
cholesterol supplied by milk (Mather and Keenan, 1998). The triacylglycerol content of
the fat globule’s core is mainly composed of lauric, myristic, oleic, stearic and linoleic
acids (Michalski and others, 2005). In cow’s milk, the size of a fat globule is between 0.2
to 10 μm in diameter. Almost 90% of the fat content in milk corresponds to fat globules
that are between 1 and 8 μm (Keenan and Patton, 1995), with an average diameter of 4
μm (Michalski and others, 2005; Briard and others, 2003). However small and large fat
globules differ a little in composition (Michalski and others, 2004); smaller globules (1.5
μm) have fewer short chain fatty acids, less stearic acid, and more oleic acid (Briard and
others, 2003). In fat globules smaller than 0.8 μm, the creaming effect of milk during
storage is very slow (Villamiel and de Jong, 2000). Experimental results show that during
homogenization of milk the mechanical alteration of fat globules is generated by pressure
differences due to shear, turbulence and cavitation; this last phenomenon is sometimes
present in the valves (Walstra, 1969; Thiebaud and others, 2003). Some operations in
milk processing include pumping, agitation, pooling, cooling, clarification, pasteurization
213
and homogenization (Jensen and others, 1995). Stabilization of fat, creamy taste, and
resistance of milk to oxidized flavor are some of the advantages of the homogenization
process, which consists of pumping the milk at high pressures through small eddies at
pasteurization temperatures (Keenan and Patton, 1995). This operation requires a high
volume of milk for processing (Carcel and others, 1998) and uses pressures from 20 to 50
MPa to reduce the size of fat globules from 0.3 to 0.8 μm (Thiebaud and others, 2003),
thus changing the structure of the globules (Corredig and Dalgleish, 1996) and increasing
the surface area of fat more than 10-fold (Sharma and Dalgleish, 1993). There are three
constituent parts in homogenized milk, regular milk fat globules, tiny and native fat
globules (100 nm), and small and new lipid-protein complexes (<500 nm) (Michalski and
Januel, 2006; Michalski and others, 2002b). The size of fat globules and the composition
of the membrane are of tremendous importance in the technical and sensory properties of
dairy products (Fauquant and others, 2005; Michalski and others, 2004; Michalski and
others, 2002a). Novel nonthermal technologies, such as high pressure, pulsed electric
fields or ultrasound, are of great interest in the research and development of food
processing, not only because of the advantages they present compared with thermal
processing, but also because of the potential generation of new ingredients and products
with specific features due to action in the food matrix (Knorr and others, 2002).
Ultrasound is responsible for the breakage of fat globules in milk, which releases
liposoluble components such as phenilureas; sometimes sonication is used with the goal
of extraction in the dairy industry (Carcel and others, 1998). The main mechanism of
action in ultrasound technology is called cavitation, a phenomenon that can be either
stable or transient. Stable cavitation is associated with the small bubbles dissolved in a
214
liquid, while transient cavitation occurs when the bubble size changes quickly and
collapses, and as a result produces very high pressure (100 MPa) and high temperature
(5000 K) (Earnshaw and others, 1995). One of the current applications of ultrasound is
human milk homogenization in hospitals; some nutrients such as liposoluble vitamins,
proteins, and minerals are usually bound to fat globules; if milk is not homogenized these
nutrients are lost when the fluid circulates through the feeding system designed for
newborn infants (Carcel and others, 1998). The nanometer resolution of scanning
electron microscopy (SEM) enables detailed analysis of casein micelles, fat globule
membranes, bacteriophages, very small particles, and the changes produced during
processing (Kaláb, 1981, 1993).
The objective of this research was to study the changes in microstructure of the fat
globules after heat and themo-sonication treatments, by using SEM to understand these
changes at the microscopic level. Also, change in color was studied and quantification of
fat content performed in order to correlate these parameters with microscopic images.
2. Materials and methods
2.1 Milk samples
Raw and whole cow’s milk was obtained from the Washington State University
Creamery. Milking process was performed previously using automatic milkers for
different cows. Milk was kept in refrigeration at 4ºC until used. The raw milk (15 ml)
was then transferred to a disposable 15 ml PET conical and sterile test tube (Corning®)
and used as a control sample during microscopy sample preparation.
215
2.2 Thermal and thermo-sonication treatments
2.2.1 Ultrasound equipment
An ultrasonic processor—Hielscher® USA, Inc. (Ringwood, NJ), model UP400S
(400 W, 24 kHz, 120 μm amplitude), was used with a 22 mm diameter probe. Raw milk
(500 ml) was placed in the treatment chamber, a double-walled vessel (500 ml), with an
internal diameter of 8 cm and a depth of 13.5 cm. A magnetic stirrer was used inside the
treatment chamber to assure the homogeneity of the treatment. Ultrasonication was
carried out at 100% (120 μm amplitude) and 63 ± 0.5 ºC temperature. Temperature was
kept constant with a refrigerated bath (VWR Scientific Model 1166, Niles, IL). A
thermocouple was used in the treatment chamber to monitor the temperature (63 ±0.5ºC)
throughout the experiments. Treatment times were 10 and 30 min. Samples were
collected and transferred to disposable 15 ml PET conical and sterile test tubes (Corning
®) and kept at 4°C.
2.2.2 Heat treatment
Heat treatment was carried out in the same 500 ml double-walled vessel. The
same volume of milk was used, and temperature of the medium was kept at 63 ± 0.5ºC by
using a heating bath maintained at 65ºC. Temperature was monitored with a
thermocouple. After 30 min of treatment samples were transferred to disposable 15 ml
PET conical, sterile test tubes (Corning®).
216
2.3 Scanning electron microscopy
2.3.1 Sample preparation
Disposable 15 ml PET conical, sterile test tubes (Corning®) containing raw milk
samples (thermo-sonicated and heated) were centrifuged at 1500 rpm for 5 min at 10ºC.
The supernatant fat layer of the sample was transferred to disposable 1.5 ml sterile plastic
microcentrifuge tubes (Fisherbrand®). A 0.5 ml solution of glutaraldehyde (2%)
paraformaldehyde (2%) in 0.1 M phosphate buffer (pH 7.2) was added to each microtube;
the fixation process was allowed to proceed for 24 hours at 4ºC. After fixation, the fat
was washed for 10 min with phosphate buffer (0.1 M), followed by two consecutive 10
min washes with cacodylate buffer (0.1 M). The post-fixing procedure consisted of
adding 2% osmium tetroxide in cacodylate buffer (0.1 M) at 4ºC for 24 hours. Samples
were then washed three times with cacodylate buffer (0.1M) for 10 min each time.
Dehydration of samples was achieved with serial dilution solutions of ethanol (30,
50, 60, 70, 95 and 100%). Each solution was maintained in contact with the sample for 10
min; the last solution (100% ethanol) was repeated three times.
After dehydrating the samples with ethanol, a second dehydration procedure with
hexamethyldisilazane (HMDS) was carried out on the samples. Consecutive contact (15
min each time) was used between the samples and ethanol/acetone/HMDS solutions at
different ratios (1:0:0, 1:1:0, 0:1:0, 0:1:1, 0:0:1, 0:0:1). Air drying was used as a final
step, leaving the microcentrifuge tubes with an open lid for at least 24 hours. Samples
were mounted on aluminum stubs, and gold plating was used as a final step to view the
samples with a Hitachi S-570 (Japan, Tokyo) scanning electron microscope (SEM)
operating at 20 kV.
217
2.4 Color
Lightness to darkness (L*) (100 to 0), redness(+)-greenness(-) (a*), and
yellowness(+)-blueness(-) (b*) color parameters were determined using a Minolta CM-
2002 spectrophotometer (Minolta Camera Co., Osaka, Japan) in reflection mode.
Samples (20 ml) of raw and thermo-ultrasonicated milk were poured into sterile plastic
bags. A white ceramic plate was used for standardizing the instrument (L* = 93.4, a* = -
0.67, b* = 0.78). The net color difference (ΔE*) was calculated as follows:
222 *)(*)(*)(* baLE Δ+Δ+Δ=Δ
2.5 Fat content
Fat content was determined using a LactiCheck™ Milk Analyzer (Page &
Pedersen, International Ltd., Hopkinton, MA). The performance of this equipment was
based on high frequency ultrasound. The milk analyzer was validated to determine butter
fat content (Gerber) according to the Association of Analytical Chemists (AOAC 1986)
methodology. The equipment was previously calibrated with raw cow’s milk, and
samples were adjusted to room temperature (20ºC). Each sample was analyzed in
triplicate. No previous preparation was required for heat and thermo-ultrasonicated
samples.
218
2.6 Statistical analysis
All treatments were performed at least in duplicate, and the physicochemical and
composition characteristics were evaluated in triplicate for each sample. Statistical
analysis of the data was performed using a Microsoft Excel program. Analysis of
variance (ANOVA) was calculated with the SAS program (SAS Institute, Cary, NC,
1999) and a confidence level α of 0.05 was used to evaluate significant differences.
3. Results and discussion
3.1 Microstructure of milk: fat globules
Fat globules are delimited with a membrane, derived from the apical plasma
membrane (Corredig and Dalgleish, 1998). In Figure 1, the structural appearance of a fat
globule in raw and whole cow’s milk is shown. This structure represents the control
sample and shows the native form of the globule structure. Despite the fact the milk fat
globule membrane (MFGM) shows no important changes or disruption, little damage can
be present in the globule because of the milk handling. Changes into composition or
structure of the MFGM occur as a result of milk handling and treatment during and after
milking; these changes could be because of the induced motion of fat globules, changes
in temperature, microbial growth or biochemical reactions (Evers, 2004). The scale of the
image in Figure 1 is 4.3 μm; the fat globule has a diameter slightly bigger than the
average size generally recorded in the literature, although it is inside the range reported
by Keenan and Patton (1995) for most of the fat globules present in milk. According to
Wiking and others (2004), large fat globules are more predisposed to coalescence and
lipolysis during some milking operations, such as pumping, so the size of the globules is

219
of high importance in the stability of milk. In cheese–making, smaller fat globules are
preferred because this physical characteristic can reduce the rennet coagulation time as
well as the curd firming rate (Tosh and Dalgleish, 1998).
Figure 2 shows the microstructure of another fat globule after heat treatment at
63ºC for 30 min. The general appearance of the fat globule shows a surface without
changes compared to Figure 1. According to Corredig and Dalgleish (1998), there are no
important changes in the size of the fat globules taking place during heating. However, a
more resistant membrane is developed outside the fat globules, which is probably due to
the interaction with proteins (β-lactoglobulin and MFGM proteins) generating a
polymerized new surface that is more resistant to coalescence; these complexes are
formed by disulphide bridges. The appearance of heated fat globules is characterized by
fairly thick deposits. These deposits could be protein in the membrane (Corredig and
Dalgleish, 1996), which coincides with the appearance of the globule shown in Figure 2.
In Figure 3, some examples of fat globules after thermo-sonication are shown;
treatment time was 30 min. A visible orifice on the surface of each globule is shown,
allowing observation of the disruption and cracking of the fat globule membrane, which
is composed of cholesterol, phospholipids, proteins and enzymes. Despite the damage
shown in these fat globules, they can be considered as not totally disrupted by cavitation.
Heertje and others (1987) showed the structure of fat globules in butter after a de-oiling
process as being hollow spheres, which is similar to the globule shown in Figure 3
(bottom right). However, MFGM protects the globule's fat content from lipolysis and
oxidation; when the membrane is damaged and disrupted due to physical stress,
coalescence of the milk fat globules occurs and presence of casein is observed in the new
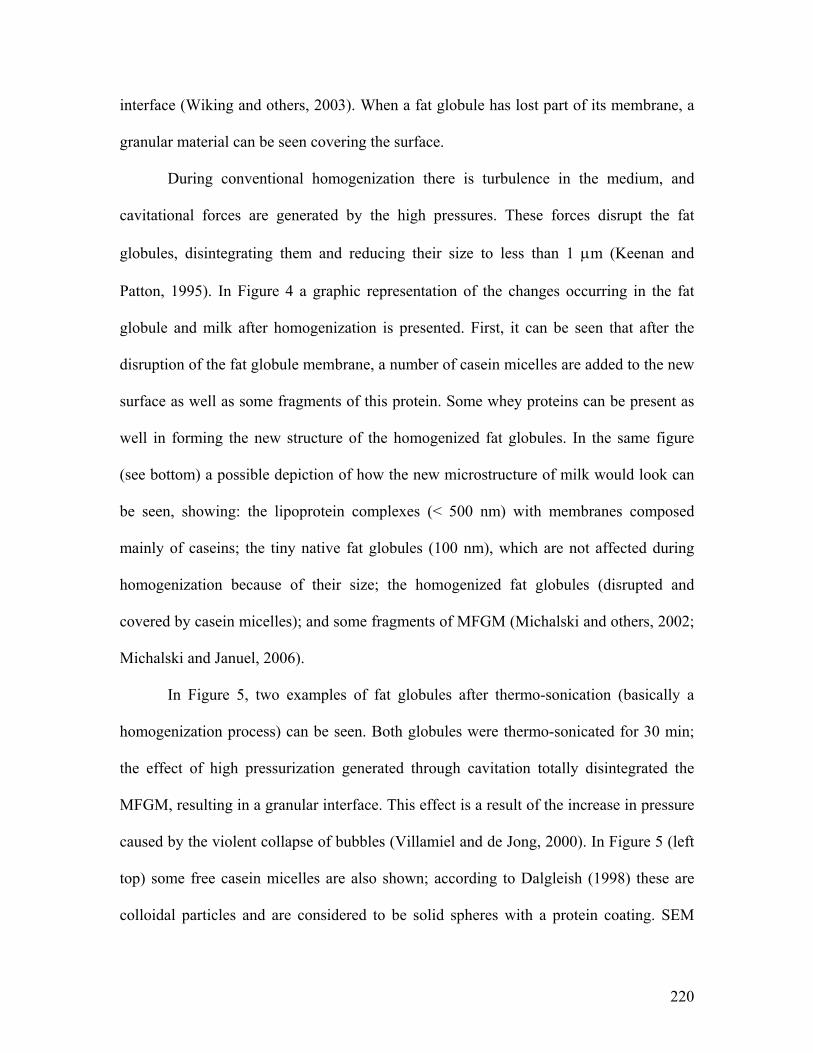
220
interface (Wiking and others, 2003). When a fat globule has lost part of its membrane, a
granular material can be seen covering the surface.
During conventional homogenization there is turbulence in the medium, and
cavitational forces are generated by the high pressures. These forces disrupt the fat
globules, disintegrating them and reducing their size to less than 1 μm (Keenan and
Patton, 1995). In Figure 4 a graphic representation of the changes occurring in the fat
globule and milk after homogenization is presented. First, it can be seen that after the
disruption of the fat globule membrane, a number of casein micelles are added to the new
surface as well as some fragments of this protein. Some whey proteins can be present as
well in forming the new structure of the homogenized fat globules. In the same figure
(see bottom) a possible depiction of how the new microstructure of milk would look can
be seen, showing: the lipoprotein complexes (< 500 nm) with membranes composed
mainly of caseins; the tiny native fat globules (100 nm), which are not affected during
homogenization because of their size; the homogenized fat globules (disrupted and
covered by casein micelles); and some fragments of MFGM (Michalski and others, 2002;
Michalski and Januel, 2006).
In Figure 5, two examples of fat globules after thermo-sonication (basically a
homogenization process) can be seen. Both globules were thermo-sonicated for 30 min;
the effect of high pressurization generated through cavitation totally disintegrated the
MFGM, resulting in a granular interface. This effect is a result of the increase in pressure
caused by the violent collapse of bubbles (Villamiel and de Jong, 2000). In Figure 5 (left
top) some free casein micelles are also shown; according to Dalgleish (1998) these are
colloidal particles and are considered to be solid spheres with a protein coating. SEM
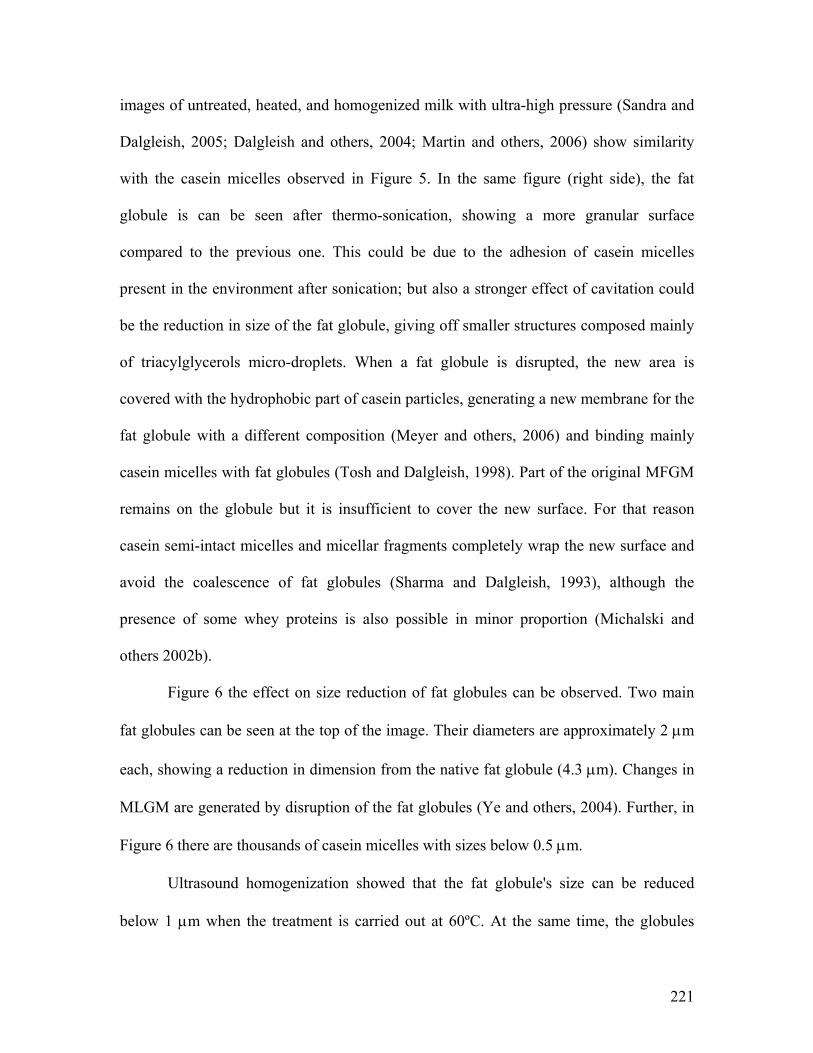
221
images of untreated, heated, and homogenized milk with ultra-high pressure (Sandra and
Dalgleish, 2005; Dalgleish and others, 2004; Martin and others, 2006) show similarity
with the casein micelles observed in Figure 5. In the same figure (right side), the fat
globule is can be seen after thermo-sonication, showing a more granular surface
compared to the previous one. This could be due to the adhesion of casein micelles
present in the environment after sonication; but also a stronger effect of cavitation could
be the reduction in size of the fat globule, giving off smaller structures composed mainly
of triacylglycerols micro-droplets. When a fat globule is disrupted, the new area is
covered with the hydrophobic part of casein particles, generating a new membrane for the
fat globule with a different composition (Meyer and others, 2006) and binding mainly
casein micelles with fat globules (Tosh and Dalgleish, 1998). Part of the original MFGM
remains on the globule but it is insufficient to cover the new surface. For that reason
casein semi-intact micelles and micellar fragments completely wrap the new surface and
avoid the coalescence of fat globules (Sharma and Dalgleish, 1993), although the
presence of some whey proteins is also possible in minor proportion (Michalski and
others 2002b).
Figure 6 the effect on size reduction of fat globules can be observed. Two main
fat globules can be seen at the top of the image. Their diameters are approximately 2 μm
each, showing a reduction in dimension from the native fat globule (4.3 μm). Changes in
MLGM are generated by disruption of the fat globules (Ye and others, 2004). Further, in
Figure 6 there are thousands of casein micelles with sizes below 0.5 μm.
Ultrasound homogenization showed that the fat globule's size can be reduced
below 1 μm when the treatment is carried out at 60ºC. At the same time, the globules
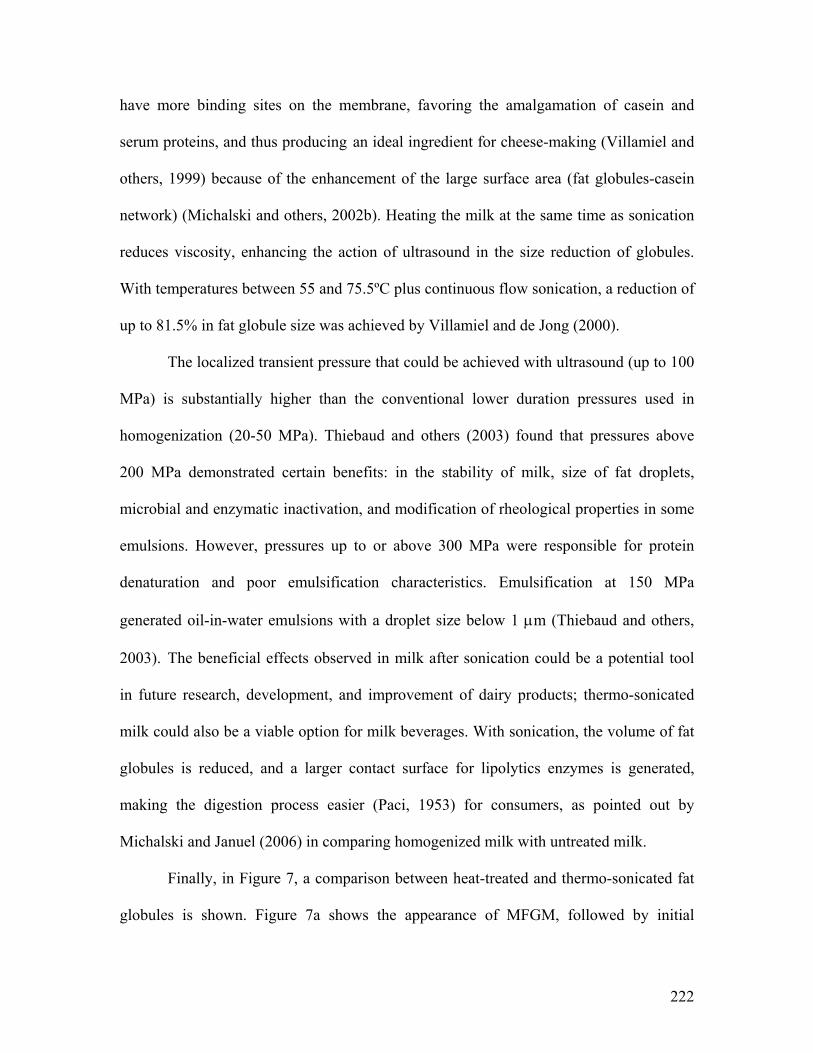
222
have more binding sites on the membrane, favoring the amalgamation of casein and
serum proteins, and thus producing an ideal ingredient for cheese-making (Villamiel and
others, 1999) because of the enhancement of the large surface area (fat globules-casein
network) (Michalski and others, 2002b). Heating the milk at the same time as sonication
reduces viscosity, enhancing the action of ultrasound in the size reduction of globules.
With temperatures between 55 and 75.5ºC plus continuous flow sonication, a reduction of
up to 81.5% in fat globule size was achieved by Villamiel and de Jong (2000).
The localized transient pressure that could be achieved with ultrasound (up to 100
MPa) is substantially higher than the conventional lower duration pressures used in
homogenization (20-50 MPa). Thiebaud and others (2003) found that pressures above
200 MPa demonstrated certain benefits: in the stability of milk, size of fat droplets,
microbial and enzymatic inactivation, and modification of rheological properties in some
emulsions. However, pressures up to or above 300 MPa were responsible for protein
denaturation and poor emulsification characteristics. Emulsification at 150 MPa
generated oil-in-water emulsions with a droplet size below 1 μm (Thiebaud and others,
2003). The beneficial effects observed in milk after sonication could be a potential tool
in future research, development, and improvement of dairy products; thermo-sonicated
milk could also be a viable option for milk beverages. With sonication, the volume of fat
globules is reduced, and a larger contact surface for lipolytics enzymes is generated,
making the digestion process easier (Paci, 1953) for consumers, as pointed out by
Michalski and Januel (2006) in comparing homogenized milk with untreated milk.
Finally, in Figure 7, a comparison between heat-treated and thermo-sonicated fat
globules is shown. Figure 7a shows the appearance of MFGM, followed by initial
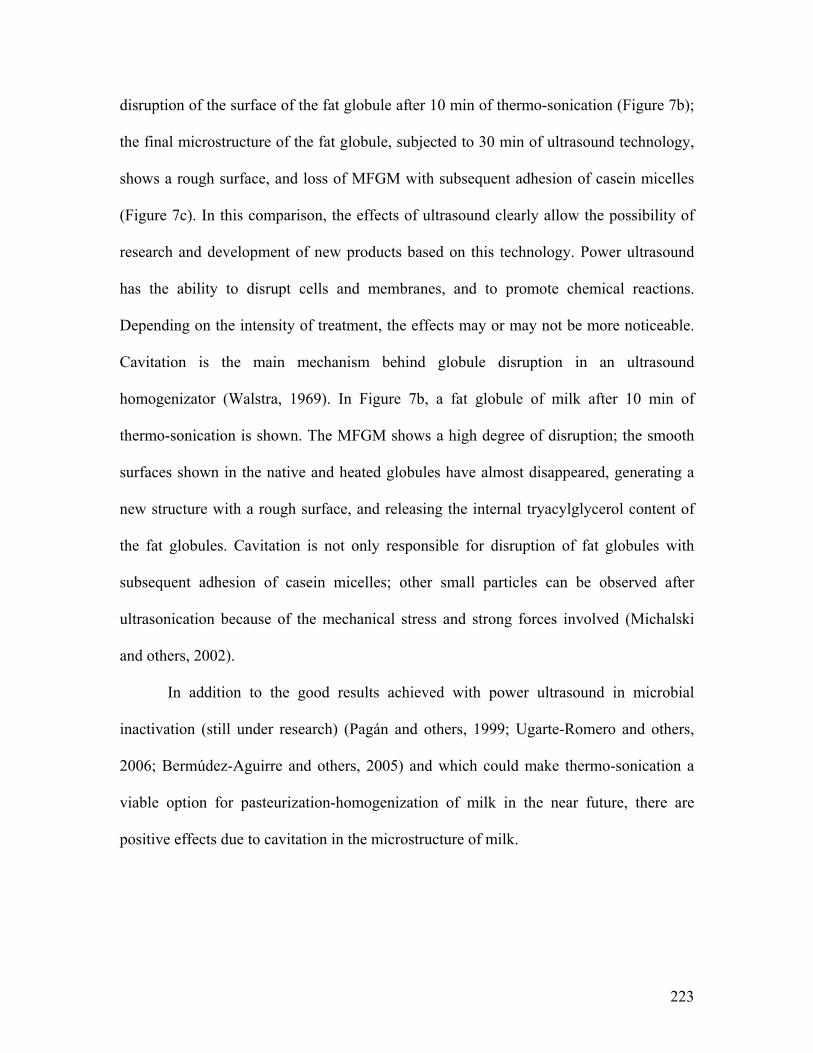
223
disruption of the surface of the fat globule after 10 min of thermo-sonication (Figure 7b);
the final microstructure of the fat globule, subjected to 30 min of ultrasound technology,
shows a rough surface, and loss of MFGM with subsequent adhesion of casein micelles
(Figure 7c). In this comparison, the effects of ultrasound clearly allow the possibility of
research and development of new products based on this technology. Power ultrasound
has the ability to disrupt cells and membranes, and to promote chemical reactions.
Depending on the intensity of treatment, the effects may or may not be more noticeable.
Cavitation is the main mechanism behind globule disruption in an ultrasound
homogenizator (Walstra, 1969). In Figure 7b, a fat globule of milk after 10 min of
thermo-sonication is shown. The MFGM shows a high degree of disruption; the smooth
surfaces shown in the native and heated globules have almost disappeared, generating a
new structure with a rough surface, and releasing the internal tryacylglycerol content of
the fat globules. Cavitation is not only responsible for disruption of fat globules with
subsequent adhesion of casein micelles; other small particles can be observed after
ultrasonication because of the mechanical stress and strong forces involved (Michalski
and others, 2002).
In addition to the good results achieved with power ultrasound in microbial
inactivation (still under research) (Pagán and others, 1999; Ugarte-Romero and others,
2006; Bermúdez-Aguirre and others, 2005) and which could make thermo-sonication a
viable option for pasteurization-homogenization of milk in the near future, there are
positive effects due to cavitation in the microstructure of milk.
224
3.2 Net Color Change and Fat Content
Because of the new and improved physical characteristics (e.g., appearance, color,
homogenization, and stability) of thermo-sonicated milk, the color and fat content were
quantified to analyze how these parameters change in the product with heat and thermo-
sonication, and how they can be correlated with changes in the microstructure of milk.
In Table 1 the color parameters L, a and b are shown for the three different
samples: raw milk, heated milk and thermo-sonicated milk. Raw and heated milk have
similar values for Hunter’s parameters, as can also be seen in the net change of color ΔE
(0.87), confirming that heat treatments do not change milk characteristics to a high
degree. The color parameters for thermo-sonicated milk show an important variation with
respect to the raw milk values, especially for the L value. The whiter color of milk
observed at first sight in the samples after thermo-sonication is confirmed with a higher L
value, meaning a greater luminosity of the sample. This value could be related to the
better homogenization observed in the samples after sonication. Smaller fat globules are
produced by cavitation, and apparently create a more uniform sample. The net change in
color (ΔE) for the thermo-sonicated sample compared to raw milk also showed a high
value (4.56). According to these studies on whole milk, the homogenization by cavitation
could be eliminating or destroying smaller size clumps of butter fat that are sometimes
present in raw milk.
The release of triacylglycerols from the core of the fat globules is confirmed by
proximal analysis, as shown in Table 1. Fat content was 4.04% for raw whole milk; after
30 min of thermo-sonication the final result for lipids content was increased to 4.24%.
This value demonstrates that the triacylglycerols content encapsulated inside the MFGM
225
of the fat globules is released to the environment, making their quantification easier after
cavitation. Other lipids, such as cholesterol and phospholipids, which usually wrap the
core of the fat globules, are also quantified after sonication because of the release of this
membrane and later emulsification in the medium. Ultrasound generates the transfer of
particles inside the medium. Villamiel and others (1999) mention that the mechanical
effects generated by cavitation enhance mass transfer. For this reason thermo-sonicated
milk has better homogenization and stability.
4. Conclusions
Ultrasound was responsible for the disruption of MFGM in the fat globules,
generating a roughened surface and smaller size of droplets, as well as the adhesion of
casein micelles to the main globule structure. Better homogenization, stability, and
appearance than in heat treated milk were observed in thermo-sonicated milk. The color
was improved and the fat content was more available because of the cavitation effect.
These new properties of milk following sonication treatment can be used in developing
and improving the sensorial and quality characteristics of commercial and new dairy
products.
References
A.O.A.C. 1986. Official Methods of Analysis. Association of Official Analytical
Chemists. USA.
226
Bermúdez-Aguirre D, Mobbs T, Versteeg K, Barbosa-Cánovas GV. 2005.
Inactivation of Listeria innocua by ultrasound of low frequency in raw whole milk. IFT
Annual Meeting, Book of Abstracts. 54-F-1. New Orleans, LA.
Briard V, Leconte N, Michel F, Michalski MC. 2003. The fatty acid composition
of small and large naturally occurring milk fat globules. European Journal of Lipid
Science and Technology. 105:677-682.
Carcel JA, Benedito J, Sanjuán N, Sánchez E. 1998. Aplicación de los
ultrasonidos en las industrias de productos lácteos y derivados. Alimentación. Equipos y
Tecnología. 135- 141.
Corredig M, Dalgleish DG. 1996. Effect of different heat treatments on the strong
binding interactions between whey proteins and milk fat globules in whole milk. Journal
of Dairy Research. 63: 441-449.
Corredig M, Dalgleish DG. 1998. Effect of heating of cream on the properties of
milk fat globule membrane isolates. Journal of Agricultural and Food Chemistry.
46:2533-2540.
Corredig M, Dalgleish DG. 1996. Effect of different heat treatments on the strong
binding interaction between whey proteins and milk fat globules in whole milk. Journal
of Dairy Research. 63:441-449.
227
Dalgleish DG. 1998. Casein micelles as colloids: surface structures and stabilities.
Journal of Dairy Science. 81:3013-3018.
Dalgleish DG, Spagnuolo PA, Goff HD. 2004. A possible structure of the casein
micelle based on high-resolution field-emission scanning electron microscopy.
International Dairy Journal. 14: 1025-1031.
Earnshaw RG, Appleyard J, Hurst RM. 1995. Understanding physical inactivation
processes: Combined preservation opportunities using heat, ultrasound and pressure.
International Journal of Food Microbiology. 23:197-219.
Evers JM. 2004. The milkfat globule membrane –methodologies for measuring
milkfat globule (membrane) damage. Review. Internationl Dairy Journal. 14:747-760.
Fauquant C, Briard V, Leconte N, Michalski MC. 2005. Differently sized native
milk fat globules separated by microfiltration: Fatty acid composition of the milk fat
globule membrane and triglyceride core. European Journal of Lipid Science and
Technology. 107:80-86.
Heertje I, Leunis M, van Zeyl WJM, Berends E. 1987. Product Morphology of
Fatty Products. Food Microstructure. 6:1-8.
228
Jensen RG, Blanc B, Patton S. 1995. Particulate Constituents in Human and
Bovine Milk. In: Jensen RG, editor. Handbook of Milk Composition. San Diego:
Academic Press. p 50-80.
Kaláb M. 1981. Electron Microscopy of Milk Products: A review of techniques.
Scanning Electron Microscopy III:453-472.
Kaláb M. 1993. Practical Aspects of Electron Microscopy in Dairy Research.
Food Structure. 12: 95-114.
Keenan TW, Patton S. 1995. The Structure of Milk: Implications for Sampling
and Storage. In: Jensen RG, editor. Handbook of Milk Composition. San Diego:
Academic Press. p 5-50.
Knorr D, Ade-Omowaye BIO, Heinz V. 2002. Nutritional improvement of plant
foods by non-thermal processing. Proceedings of the Nutrition Society. 61:311-318.
Martin AH, Goff HD, Smith A, Dalgleish DG. 2006. Immobilization of casein
micelles for probing their structure and interactions with polysaccharides using scanning
electron microscopy (SEM). Food Hydrocolloids. 20:817-824.
Mather IH, Keenan TW. 1998. Origin and Secretion of Milk Lipids. Journal of
Mammary Gland Biology and Neoplasia. 3(3):259-273.
229
Meyer S, Berrut S, Goodenough TIJ, Rajendram VS, Pinfield VJ, Povey MJW.
2006. A comparative study of ultrasound and laser light diffraction techniques for particle
size determination in dairy beverages. Measurement Science & Technology. 17:289-297.
Michalski MC, Cariou R, Michel F, Garnier C. 2002a. Native vs. Damaged Milk
Fat Globules: Membrane Properties Affect the Viscoelasticity of Milk Gels. Journal of
Dairy Science. 85:2451-2461.
Michalski MC, Michel F, Geneste C. 2002b. Appearance and submicromic
particles in the milk fat globule size distribution upon mechanical treatments. Lait 82:
193-208.
Michalski MC, Camier B, Briard V, Leconte N, Gassi JY, Goudédranche H,
Michel F, Fauquant J. 2004. The size of native milk fat globules affects physico-chemical
and functional properties of Emmental cheese. Lait 84:343-358.
Michalski MC, Briard V, Juaneda P. 2005. CLA profile in native fat globules of
different sizes selected from raw milk. Internationl Dairy Journal. 15:1089-1094.
Michalski MC, Januel C. 2006. Does homogenization affect the human health
properties of cow’s milk? Trends in Food Science and Technology. 17: 423-437.
230
Paci C. 1953. L’emploi des ultra-sons pour l’assainissement du lait. Lait 33:610-
615.
Pagán R, Mañas P, Álvarez I, Condón S. 1999. Resistance of Listeria
monocytogenes to ultrasonic waves under pressure at sublethal (manosonication) and
lethal (manothermosonication) temperatures. Food Microbiology. 16:139-148.
Sandra S, Dalgleish DG. 2005. Effects of ultra-high-pressure homogenization and
heating on structural properties of casein micelles in reconstituted skim milk powder.
International Dairy Journal. 15: 1095-1104.
Sharma SK, Dalgleish DG. 1993. Interactions between milk serum proteins and
synthetic fat globule membrane during heating of homogenized whole milk. Journal of
Agriculture and Food Chemistry. 41:1407-1412.
Thiebaud M, Dumay E, Picart L, Guiraud JP, Cheftel JC. 2003. High-pressure
homogenization of raw bovine milk. Effects on fat globule size distribution and microbial
inactivation. International Dairy Journal. 13:427-439.
Tosh SM, Dalgleish DG. 1998. The physical properties and renneting
characteristics of the synthetic membrane on the fat globules of microfluidized milk.
Journal of Dairy Science. 81:1840-1847.

231
Ugarte-Romero E, Feng H, Martin SE, Cadwallader KR, Robinson SJ. 2006.
Inactivation of Escherichia coli with power ultrasound in apple cider. Journal of Food
Science. 71(2): E102-E108.
Villamiel M, van Hamersveld EH, de Jong P. 1999. Review: Effect of ultrasound
processing on the quality of dairy products. Milchwissenschaft 54(2):69-73.
Villamiel M, de Jong P. 2000. Influence of High-Intensity Ultrasound and Heat
Treatments in Continuous Flow on Fat, Proteins, and Native Enzymes of Milk. Journal of
Agriculture and Food Chemistry. 48:472-478.
Walstra P. 1969. Preliminary note on the mechanism of homogenization.
Netherlands Milk and Dairy Journal. 23:290-292.
Wiking L, Björck L, Nielsen JH. 2003. Influence of feed composition on stability
of fat globules during pumping of raw milk. International Dairy Journal. 13:797-803.
Wiking L, Stagsted J, Björck L, Nielsen JH. 2004. Milk fat globule size is
affected by fat production in dairy cows. International Dairy Journal. 14: 909-913.
Wiking L, Nielsen JH, Båvius AK, Edvardsson A, Svennersten-Sjaunja K. 2006.
Impact of milking frequencies on the level of free fatty acids in milk, fat globule size, and
fatty acid composition. Journal of Dairy Science. 89:1004-1009.

232
Ye A, Singh H, Taylor MW, Anema SG. 2004. Interactions of fat globule surface
proteins during concentration of whole milk in a pilot-scale multiple-effect evaporator.
Journal of Dairy Research. 71:471-479.
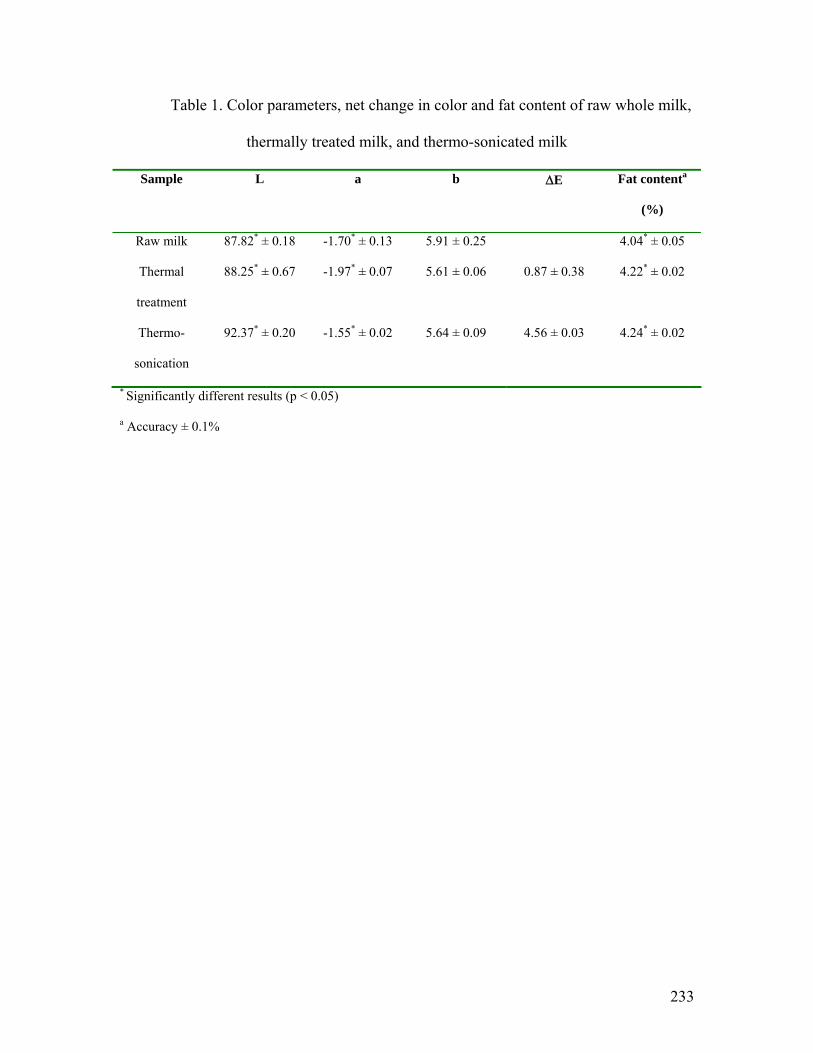
233
Table 1. Color parameters, net change in color and fat content of raw whole milk,
thermally treated milk, and thermo-sonicated milk
Sample L a b ΔE Fat contenta
(%)
Raw milk 87.82* ± 0.18 -1.70* ± 0.13 5.91 ± 0.25 4.04* ± 0.05
Thermal
treatment
88.25* ± 0.67 -1.97* ± 0.07 5.61 ± 0.06 0.87 ± 0.38 4.22* ± 0.02
Thermo-
sonication
92.37* ± 0.20 -1.55* ± 0.02 5.64 ± 0.09 4.56 ± 0.03 4.24* ± 0.02
* Significantly different results (p < 0.05)
a Accuracy ± 0.1%

234
Figure 1. Fat globule in raw whole milk used as a control sample. The globule shows its
integrity; no important changes on the surface or membrane are detected.
Magnification 7 000x.
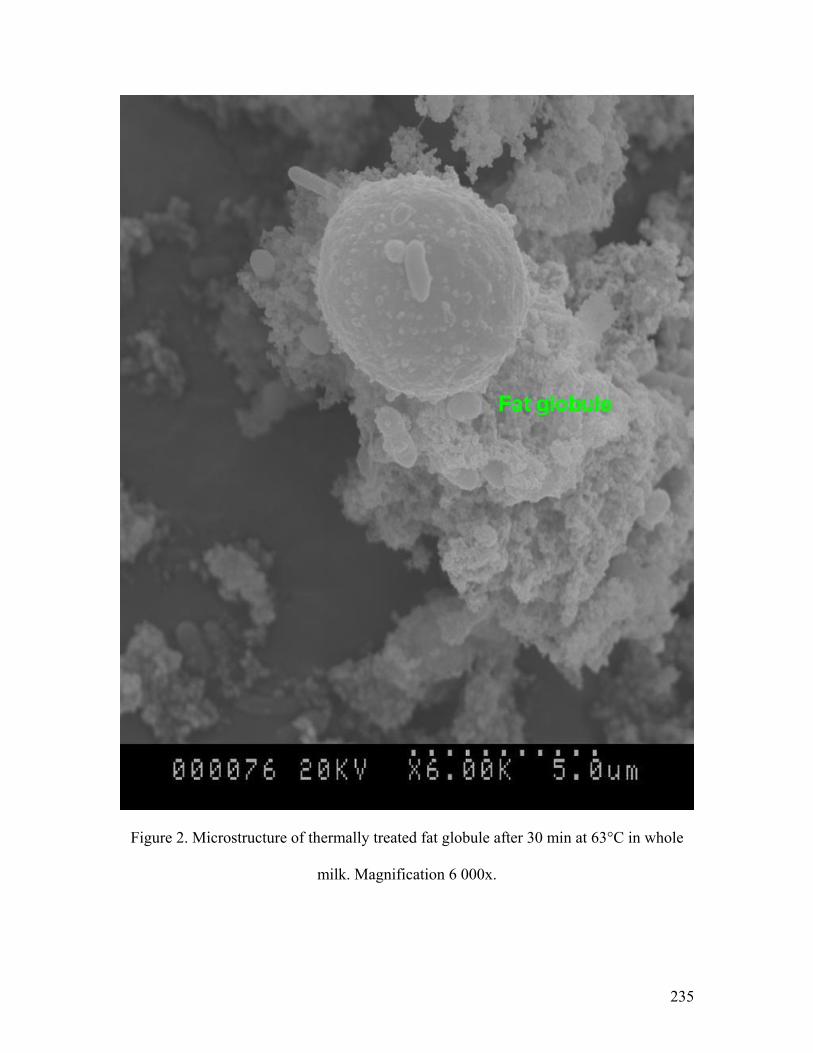
235
Figure 2. Microstructure of thermally treated fat globule after 30 min at 63°C in whole
milk. Magnification 6 000x.

236
Figure 3. Thermo-sonicated (63ºC, 120 μm for 30 min) fat globules of whole milk
showing the disintegration of the milk fat globule membrane (MFGM). Magnification 7
900x and 6 000x (top); 5 000x and 6 000x (bottom).
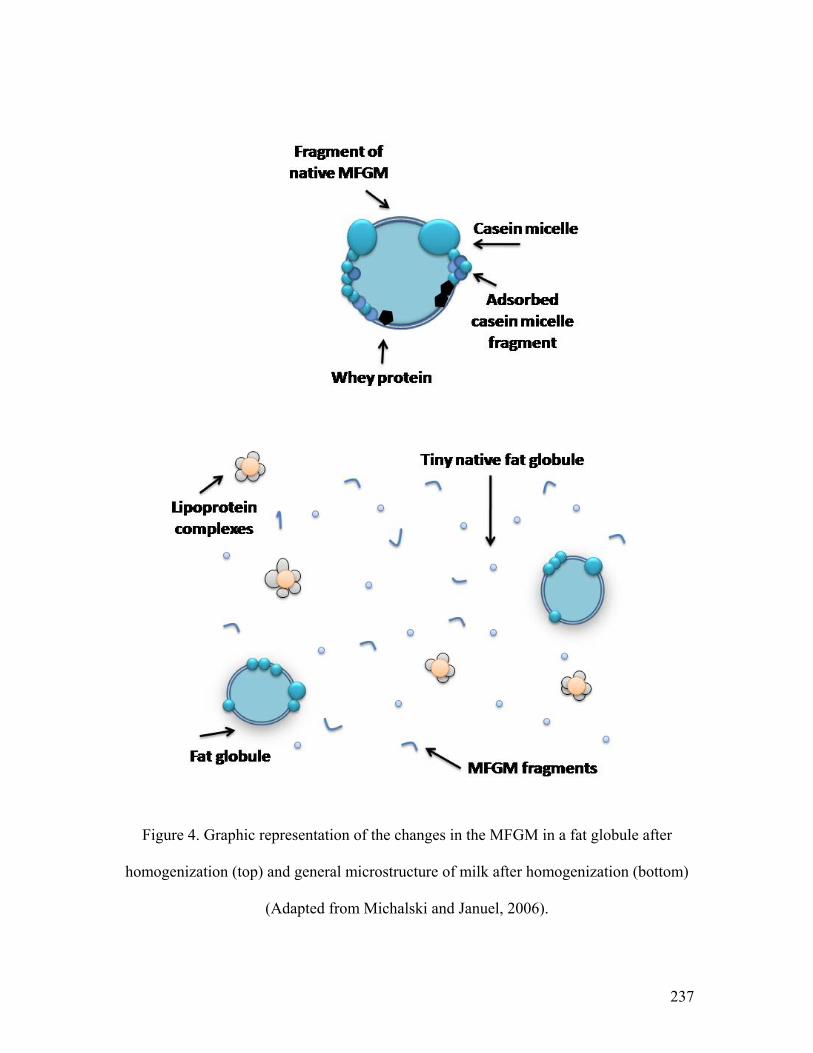
237
Figure 4. Graphic representation of the changes in the MFGM in a fat globule after
homogenization (top) and general microstructure of milk after homogenization (bottom)
(Adapted from Michalski and Januel, 2006).
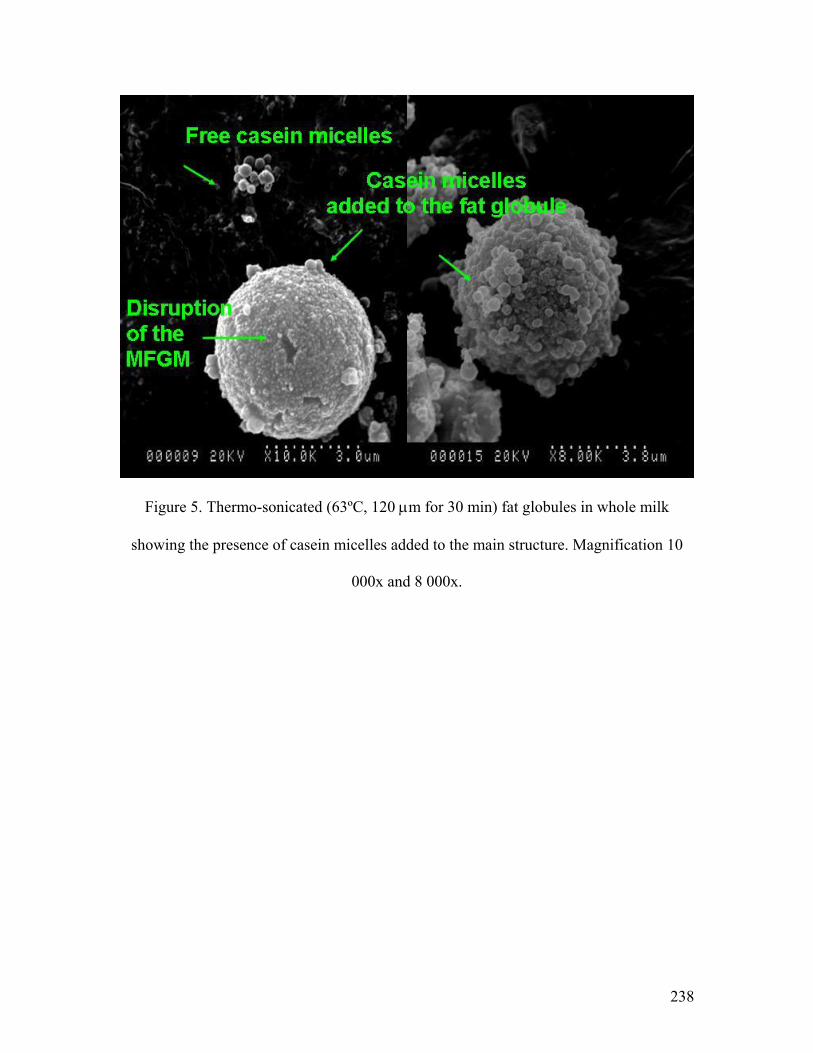
238
Figure 5. Thermo-sonicated (63ºC, 120 μm for 30 min) fat globules in whole milk
showing the presence of casein micelles added to the main structure. Magnification 10
000x and 8 000x.
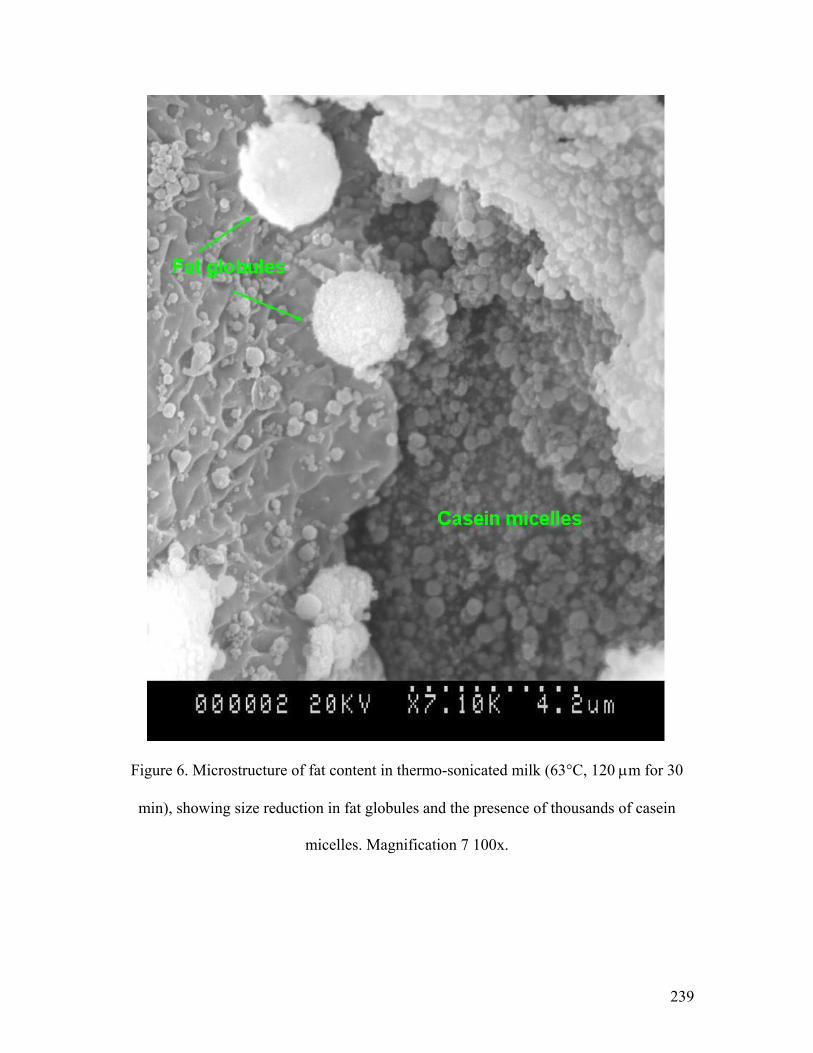
239
Figure 6. Microstructure of fat content in thermo-sonicated milk (63°C, 120 μm for 30
min), showing size reduction in fat globules and the presence of thousands of casein
micelles. Magnification 7 100x.
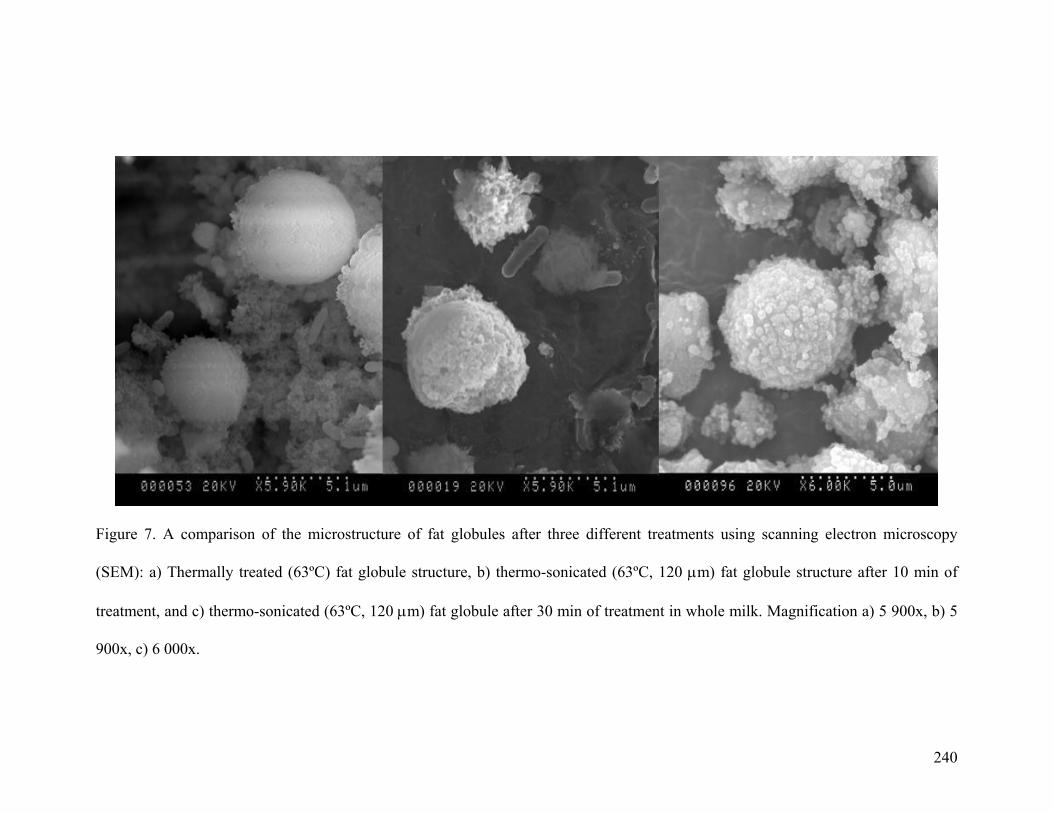
240
Figure 7. A comparison of the microstructure of fat globules after three different treatments using scanning electron microscopy
(SEM): a) Thermally treated (63ºC) fat globule structure, b) thermo-sonicated (63ºC, 120 μm) fat globule structure after 10 min of
treatment, and c) thermo-sonicated (63ºC, 120 μm) fat globule after 30 min of treatment in whole milk. Magnification a) 5 900x, b) 5
900x, c) 6 000x.
241
CHAPTER SIX
STUDY OF BUTTER FAT CONTENT IN MILK ON THE INACTIVATION OF
Listeria innocua ATCC 51742 BY THERMO-SONICATION
Daniela Bermúdez-Aguirre and Gustavo V. Barbosa-Cánovas
Abstract
Ultrasound combined with heat treatment has yielded favorable results in the inactivation
of microorganisms; however, the composition of food influences the rate of microbial
inactivation. The objective of this research was to study the effect of butter fat content in
milk on the inactivation of Listeria innocua and compositional parameters after thermo-
sonication. Four butter fat contents in milk were evaluated at 63ºC for 30 min of
sonication (Hielscher® UP400S, 400 W, 24 kHz, 120 μm amplitude). Results showed
that inactivation of Listeria cells occurs first in fat free milk, and that the rate of
inactivation decreases with increasing fat content. No degradation of protein content or
color variation was observed after the treatments. The pH dropped to 6.22, and lactic acid
content showed an increase of 0.015% after the treatment; solids-non-fat, density and
freezing point decreased. During storage life, growth of mesophiles was retarded with
sonication.
242
1. Introduction
Milk is a common worldwide product with high commercial demand, regardless of the
source, adding important protein content to the human diet. The sensory and
microbiological characteristics of milk are also very important to the consumer.
Pasteurization is the common thermal process used to inactivate pathogenic bacteria and
some enzymes in milk, however undesirable effects on nutritional and sensory properties
may be found in pasteurized milk because of the high temperature used. Further, high salt
concentrations in the medium have been shown to increase the heat resistance of
microorganisms (Earnshaw, Appleyard & Hurst, 1995), while the butter fat content of
milk can also be a barrier to the inactivation of bacteria (Zapico, de Paz, Medina &
Nuñez, 1999). Even the mode of thermal treatment batch or continuous, has a different
mechanism of inactivation in cells. Although the supplied heat is the same, cells do not
receive the same physical effects in batch mode, as compared to continuous processes
such as pressure and shear forces (Fairchild, Swartzel & Foegeding, 1994).
Listeria monocytogenes has been reported as one of the most common pathogenic
microorganisms related to foodborne outbreaks in the dairy industry (Zapico et al., 1999;
Powell, Tamplin, Marks & Campos, 2006; Piyasena, Liou & McKellar, 1998). This
microorganism is a short rod that can grow under aerobic and microaerophilic conditions.
The optimum temperature for growth is 35-37ºC, but it can also grow under refrigerated
conditions, over a wide range of pH (4-9), and with salt concentration up to 10% (Yousef
& Carlstrom, 2003; Zapico et al., 1999). Although the dairy industry is most concerned
about the presence of Listeria monocytogenes in products such as cheese, other sources of
this microorganism are frankfurters and sliced meats (Yousef & Carlstrom, 2003).
243
Listeria innocua, used as a surrogate of Listeria monocytogenes for microbiological
studies, has shown similar behavior against heat and radiation in different media (Zapico
et al., 1999), and a very high resistance to thermal treatment in skim milk (Fairchild et al.,
1994) and to electric pulses (Picart, Dumay & Cheftel, 2002).
The use of sound waves in liquid media to disrupt cells, either alone (sonication),
or in combination with heat (thermo-sonication), is an alternative approach to the
inactivation of such bacteria. Some studies have been conducted on milk under sonication
in order to analyze its functional properties after processing (Ertugay, Şengül & Şengül,
2004; Vercet, Oria, Marquina, Crelier & Lopez-Buesa, 2002; Villamiel & De Jong, 2000;
Wu, Hulbert & Mount, 2001) and to test the inactivation of bacteria such as Salmonella,
Staphylococcus aureus, Bacillus subtilis and coliforms (Villamiel, Van Hamersveld & De
Jong, 1999; Carcel, Benedito, SanJuan & Sánchez, 1998). Several studies have also
reported the use of ultrasound for microbial inactivation in other media. Some of the
tested microorganisms are Saccharomyces cerevisiae (Guerrero, Tognon & Alzamora,
2005; Tsukamoto, Constantinoiu, Furuta, Nishimura & Maeda, 2004a; Tsukamoto, Yim,
Stavarache, Furuta, Hashiba & Maeda, 2004b; Guerrero, López-Malo & Alzamora,
2001); Escherichia coli (Ugarte-Romero, Feng, Martin, Cadwallader & Robinson, 2006;
Ananta, Voigt, Zenker, Heinz & Knorr, 2005; Furuta, Yamaguchi, Tsukamoto, Yim,
Stavarache, Hasiba & Maeda, 2004); Listeria monocytogenes (Mañas, Pagán & Raso,
2000; Pagán, Mañas, Alvarez & Condón, 1999); Salmonella (Cabeza, Ordóñez, Cambero,
De la Hoz & García, 2004); Lactobacillus rhamnosus (Ananta et al., 2005); Yersinia
enterocolitica (Raso, Pagán, Condón & Sala, 1998), among others.
244
The objective of this work was to study the inactivation rate of Listeria innocua in
milk with different butter fat content (fat free, 1%, 2% and whole milk) while exposed to
pre-selected thermo-sonication treatment. Nutrient retention (butter fat and protein
content) and physical-chemical properties (pH, acidity, color, density, solids-non-fat and
freezing point) were evaluated after completion of the treatment.
2. Materials and methods
2.1 Milk samples
Four different commercial milks with different butter fat content (fat free, 1%, 2% and
whole) were purchased from Farmland Dairies, LLC. (Wallington, NJ). Samples were
previously processed with Ultra-High-Temperature (UHT) and packaged in Tetra Brik®
containers. Samples were maintained at room temperature until use. Characterization of
all samples consisted of sterility testing (no presence of bacteria), pH, acidity, color,
butter fat and protein content, density, solids-non-fat, and freezing point.
2.2 Listeria innocua analysis
2.2.1 Growth of Listeria innocua cells
Listeria innocua cells (ATCC 51742) from early stationary phase growth were stored at -
21ºC as a 50% volume suspension in sterile glycerol solution (20 ml glycerol/100 ml
water). Two ml of this suspension were unfrozen and added to 100 ml Tryptic Soy Broth
(Bacto: Becton, Dickinson and Co., Sparks, MD) with 0.6% Yeast Extract (YE) (Bacto,
Becton, Dickinson and Co., Sparks, MD). The microorganism was kept on a bath shaker
at 37ºC and 218 rpm until it reached the early stationary phase, approximately after 11 h.

245
Inoculation of Listeria cells was made in each kind of milk in a ratio of 1:100 (cells:milk)
(V/V).
2.2.2 Enumeration of Listeria and mesophilic bacteria
The sterility of each kind of milk was evaluated with plate count agar (Difco: Becton,
Dickinson and Co., Sparks, MD). Samples were taken directly from each container. After
serial dilution in aqueous peptone solution (0.1%), the samples were plated. Dishes were
incubated at 35ºC for 48 h and cells were counted.
Samples inoculated with Listeria innocua were plated in Tryptic Soy Agar (Difco:
Becton, Dickinson and Co., Sparks, MD) with 0.6% of Yeast Extract (Bacto, Becton,
Dickinson and Co., Sparks, MD). Dishes were stored at 35ºC for 48 h, after which
bacteria loads were counted.
2.3 Thermo-sonication treatments
An ultrasonic processor (Hielscher USA Inc., Ringwood, NJ) model UP400S (400 W, 24
kHz, 120 μm amplitude) with a 22 mm diameter probe was used. A double-walled vessel
of 500 ml (8 cm internal diameter, 13.5 cm depth) was used as a treatment chamber.
Temperature was set up and kept constant via a refrigerated bath (VWR Scientific Model
1166, Niles IL). A thermo-couple was used in the treatment chamber to monitor the
temperature (63 ± 0.5ºC) throughout the experiments. The acoustic intensity was kept
constant at 100% (120 μm) in all treatments. A magnetic stirrer was used inside the
vessel to assure the homogeneity of the samples throughout the sampling. The treatment
time was 30 min for all systems, and samples were taken after 0, 5, 10, 15, 20, 25 and 30
246
min. All treatments were performed in duplicate, and the analysis for each treatment was
carried out in triplicate.
Treatments were carried out in batch mode to simulate the conventional batch
pasteurization (63ºC by 30 min) and to compare with previous studies (Bermúdez-
Aguirre & Barbosa-Cánovas, 2005 and 2006).
2.4 Proximal analysis
Butter fat, solids-non-fat and protein content were evaluated using a LactiCheck™ milk
analyzer (Page & Pedersen, International Ltd., Hopkinton, MA). The performance of this
equipment is based on high frequency ultrasound. The milk analyzer was validated with
official methods to determine butter fat content (Gerber) and protein (Kjeldahl) in milk,
according to Association of Analytical Chemists (A.O.A.C.) methodology. Solids-non-fat
measurements were simultaneously performed with the same equipment. The
LactiCheckTM analyzer was previously calibrated with each kind of milk (according to
butter fat content) and samples were adjusted to room temperature (20ºC). Each sample
was analyzed in triplicate. No prior preparation was required for the different butter fat
content samples and thermo-ultrasonicated samples.
2.5 Physicochemical characteristics
2.5.1 pH and titratable acidity
pH was determined by direct immersion with a potentiometer (Orion Research Inc.,
Boston, MA). Acidity was determined by titration at room temperature with 0.1 N NaOH
247
solution to pH 8.3 and expressed as a percentage of lactic acid (1 ml of 0.1 N NaOH =
0.009 g of lactic acid). Each sample was measured in triplicate.
2.5.2 Density and freezing point
Density and freezing point were evaluated in each milk sample after treatment. A
LactiCheck™ milk analyzer (Page & Pedersen, International Ltd., Hopkinton, MA) was
used for this purpose; it was calibrated with each kind of milk before treatments, and
samples were analyzed at 20ºC, each one in triplicate.
2.5.3 Color
Lightness to darkness (L*) (100 to 0), redness(+) to greenness(-) (a*), and yellowness(+)
to blueness(-) (b*) color parameters were determined using a Minolta CM-2002
spectrophotometer (Minolta Camera Co., Osaka, Japan) in the reflection mode. Twenty
ml of UHT and thermo-ultrasonicated milk samples were poured into sterile plastic bags.
A white ceramic plate was used for standardizing the instrument (L* = 93.4, a* = -0.67,
b* = 0.78).
2.6 Shelf-life studies
In order to study the effect of thermo-sonication as a method for extending the shelf-life
of UHT milk, four batches of milk (fat free, 1%, 2% and whole milk) were treated with
the same sonication conditions described above (63ºC, 120 μm for 30 min), but without
the addition of Listeria cells. Milk samples of 25 ml each (with and without treatment)
were poured into sterile plastic bags. Multiple samples were prepared in order to use a
248
different bag of each sample on each testing day, to avoid reusing the same sample for
different purposes. Samples were stored at room temperature (21ºC) and refrigeration
conditions (4ºC) for 9 days to evaluate their physicochemical and microbiological
characteristics, such as pH, color and total plate count. Each batch of shelf-life studies
was conducted in duplicate.
2.7 Statistical analysis
Statistical analysis of the data was performed using a Microsoft Excel program. The
analysis of variance (ANOVA) was calculated with the SAS program (SAS Institute,
Cary, NC, 1999). A confidence level (α) of 0.05 was used to evaluate significant
differences.
3. Results and discussion
3.1 Inactivation rate of Listeria innocua
A sterility test of samples showed that the initial count of bacteria in milk was lower than
10 cfu/ml for all milks. Afterwards, the inoculation of different milks was performed with
initial cell counts of 107 cfu/ml of Listeria innocua ATCC 51742. The inactivation curves
for the four samples tested are shown in Figure 1. The effect of butter fat content seems
to be a hurdle that lowers the rate of inactivation. After 30 min of treatment, whole milk
(3.47% butter fat content) showed a low degree of cell inactivation; a 2.5 log reduction
was achieved. As the butter fat content decreased, the inactivation was faster, as shown in
the 1% and 2% butter fat content milks, where 4.5 and 3.2 log reductions were achieved.
In these experiments, the highest inactivation (4.9 log reduction) was achieved in fat free
249
milk after 30 min of treatment. It is clear that the presence of fat globules in milk creates
a protective effect for the cells. Some factors that affect the heat resistance of
microorganisms are high protein and fat content or high total solids (Gaze, 2005). In the
case of whole milk, the butter fat content is mainly distributed as fat globules of average
size (4 μm). Bacteria can adhere to these fat globules, but ultrasound has the ability to
disrupt the Milk Lipid Globule Membrane (MLGM), generating globules of smaller size.
Some of these smaller globules appear as hollow spheres with a completely new
roughness surface (Bermúdez-Aguirre & Barbosa-Cánovas, 2006). These
microorganisms may adhere to the surface of the newest globules, but they can also be
hidden within the rough surface and inside the globules that were disturbed with
ultrasound providing a protective fat layer against the heat and cavitation generated with
the sonication. Fat free milk, having few or no fat globules, does not offer a protective
effect to the Listeria cells.
Other workers have found that the inactivation of bacteria is reduced in food with
significant fat content because of changes in ultrasound penetration and energy
distribution (Earnshaw et al., 1995). Cavitation is the mechanism of action of ultrasound;
when a sound wave passes through a liquid medium thousands of bubbles are produced,
which increase and decrease in size very quickly. Intensity of cavitation depends on the
amplitude wave, pressure, temperature, and medium of treatment, among others. The
explosion and implosion of the bubbles are responsible for the erosion in food and
formation of free radicals (Povey & Mason, 1998). The intensity of cavitation is related
to the boiling point of the product; in milk, some of the soluble solids can affect the
intensity of the cavitation (Carcel et al., 1998). This effect of inactivation according to the
250
medium of treatment has been reported in previous studies. For example, inactivation of
Salmonella was found to be higher in aqueous peptone (2.5 log) than in milk chocolate
(0.1 log) after 10 min of treatment, suggesting the limitation of cavitation in milk samples
(Villamiel et al., 1999). A strain of Staphylococcus aureus was studied under thermo-
sonication treatments (50.3 – 56.7ºC, 20 kHz, 3.75 W/ml) in a phosphate buffer and UHT
whole milk, and again showed the protective effect of the whole milk in the inactivation
of the microorganism (Villamiel et al., 1999; Carcel et al., 1998). Some studies conducted
with Listeria monocytogenes have shown that the butter fat content of milk is an obstacle
for microbial inactivation, using nisin as an antimicrobial. When skim milk (0% fat) was
used in combination with 50 IU/ml of nisin, 7 log reductions were achieved; in milk with
4% fat content, 3 log reductions were obtained; but just 1 log was achieved in milk
containing 12.9% fat. The suggested explanation is that fat globules might absorb the
nisin molecules, reversing the antimicrobial effect of this bacteriocin (Zapico et al.,
1999).
Research conducted with Listeria innocua under pulsed electric fields treatment in
milk has also shown how the butter fat content of this fluid can enhance or reduce the
inactivation rate, although in this case other operating parameters, such as pulse
frequency, also influenced the results. At 1.1 MHz, 0.67 log reductions were achieved in
whole milk, whereas 0.95 log reduction was observed in skim milk under the same
processing conditions (Picart et al., 2002). The butter fat content of milk also influences
other properties of milk, such as electrical conductance. When the fat content in milk
increases, the conductance decreases because the fat globules are nonconductive
materials (Mabrook & Petty, 2003).
251
However, not only does butter fat content protect the cells, the use of UHT milk,
which is considered as sterile, also has an effect on the rate of inactivation. Even though
milk was tested for sterility (count was lower than 10 cfu/ml), it is clear that the absence
of the natural flora in raw milk has an effect. When raw milk was tested under the same
conditions, as those presented in this research, but with an initial count of mesophiles of
103 cfu/ml and inoculation with a similar count of Listeria innocua cells (108 cfu/ml),
inactivation was higher after 30 min of treatment, up to 5.5 log reductions (Bermúdez-
Aguirre & Barbosa-Cánovas, 2005), suggesting a possible effect of competitive flora. In
addition, the characteristics of UHT milk after processing at very high temperature
(138ºC for 2 sec; IDFA, 2006) including the aseptic conditions of the packaging process
and material used provide a different environment for Listeria cells compared to the rich
microbiological and enzymatic medium of fresh (raw) milk.
3.2 Proximal analysis
3.2.1 Butter fat content and protein
Nutrient retention for all samples is shown in Table I. Regarding butter fat content, the
reported value listed on the package was slightly different from that measured for this
experiment. After thermo-sonication, butter fat content remained equal, with insignificant
variations, as seen in Table I. It is quite apparent that the effect of previous
homogenization of UHT milk does not generate significant changes in the fat content of
milk with thermo-sonication. When raw milk is thermo-sonicated significant change in
the butter fat content has been reported; which could be due to disruption of the fat
252
globules and consequent release of triacylglycerols to the medium (Bermúdez-Aguirre &
Barbosa-Cánovas, 2006).
As to protein content, the difference between control samples and the thermo-
sonicated samples was found to be minimal, which could be attributed to the normal
variation and accuracy of the equipment used to measure protein. The analyzer used to
detect protein content is based on ultrasound spectroscopy, with an accuracy of 0.2% for
protein, so the differences shown in Table I could be related more to the accuracy of the
analyzer; otherwise, the difference in protein content due to ultrasound was minimal (i.e.
minimal denaturization of protein). Although total protein is being evaluated here, these
results agree with some studies on skim milk, which showed that after thermo-sonication
treatments (temperatures up to 50ºC), and the soluble protein content of the sonicated
samples was not significantly different from the control samples. When the temperature
was increased to 75.5ºC and the samples were sonicated for 102.3 s, the whey proteins
were denaturated in whole and skim milk, with a higher effect in whole milk. One theory
about protein denaturation states that the energy supplied from ultrasound can modify the
quaternary and/or tertiary structure of the casein, although it does not totally disturb the
micelle casein (Villamiel & De Jong, 2000).
3.2.2 Solids-non-fat
The solids-non-fat did not change significantly after thermo-sonication (Table II). There
was a trend in milk with fat (1%, 2% and whole) to show a slightly lower value after
thermo-sonication compared with the control sample, but again these values are in the
range of the accuracy of the milk analyzer for SNF (± 0.2%). The total solids in cow’s
253
milk are around 12.6%, of which approximately 9% are solids-non-fat and the rest is fat.
The solids-non-fats are usually called serum solids (Potter, 1986) and include casein,
lactalbumin, lactose, calcium, phosphorus, and riboflavin, among others (IDFA, 2006).
3.3 Physical-chemistry characteristics
3.3.1 pH and acidity
For all control milk samples, the pH values are inside the range reported for bovine milk
(pH 6.22 to 6.77), and as expected, the presence of fat globules decreases the pH of the
milk (Table II). The reported acidity for milk is 0.16% (± 0.02) (Neville & Jensen, 1995).
The pH of all samples decreased after thermo-sonication, with a consequent increase in
the acidity of the milks. This increase in acidity could have occurred because of
lipolysis, that is, the breakdown of triglycerides to free fatty acids due to enzyme activity
(Walstra, Wouters & Geurts, 2006). Ultrasound can speed enzymatic reactions in the
milk in addition to the breakage of fat globules that contain triglycerides, making these
acids more available to the enzyme. The butter fat content of the milk affects the acidity,
and according to the results of this study, the whole milk sample showed the greatest
change in acidity content. Another possible theory as to why the acidity increased in milk
could be related to the nitrite and nitrate formation on air-saturated water after sonication.
Studies reported by Supeno (2000) showed how the sonication of aqueous solutions in
the range of ultrasound frequency from 41 to 3217 kHz generated the maximum
production of nitrite and hydrogen peroxide as primary products in the medium at 360
kHz, with the subsequent formation of nitrate as a product of the oxidation of nitrite.
However, this is only a theory in the case of milk, because the reported studies were
254
performed in water; also, the frequency used for the current experiment (24 kHz) is lower
than the reported range by Supeno (2000). It is likely that the decrease in acidity in milk
could be a combination between the formation of fat free acids and the formation of
nitrite/nitrate. Further studies on thermo-sonicated milk must be performed in order to
establish the new chemical products that may develop after sonication. According to
Walstra et al. (2006), the decrease in pH could be due to the hydrolysis of phosphoric
esters because of enzymatic action. It is also possible that this change can be attributed to
ultrasound action; however changes in pH and acidity could be reflected in taste when
these changes are higher than the established limits for milk.
3.3.2 Density
After thermo-sonication, milk samples with higher butter fat content showed a slight
decrease in density. In previous experiments, the real effect of ultrasound on milk
homogenization and change in milk properties such as density was clearer when raw
whole milk was used. The milk used for the current experiments was previously
homogenized during UHT processing, so the minor observable changes in density could
be attributed to this previous process. According to the data shown in Table II, the trend
after thermo-sonication was that the density of the samples increased as the content of
solids-non-fat was higher, agreeing with the report by Walstra et al. (2006). Meanwhile,
the density of the samples was higher when the milk had less butter fat content. The
density of fresh whole milk is 1029 kg/m3 while the density of whole milk at 10ºC is
1031 kg/m3.
255
3.3.3 Freezing point
In previous studies, production of a small amount of water was generated after sonication
treatment of milk, probably because of the breakage of some macromolecules and
chemical reactions under the action of the cavitation releasing water molecules to the
medium. One of the usual quality assurance parameters in milk to examine if water has
been added to milk is to test the freezing point; the depression of this temperature
indicates adulteration of milk with water. The reported freezing point for bovine milk is
within the range of -0.512 to -0.550 ºC (Jensen & Newberg, 1995). The values of the
current experiment ranged from -0.584ºC to -0.504ºC for the control sample (from fat
free to whole milk), and from -0.599ºC to -0.493ºC for the thermo-sonicated samples
(from fat free to whole milk). As in the case of other physicochemical properties, fat free
milk did not show common behaviors in comparison to the other milks. However, for the
rest of the samples (1%, 2% and whole milk) the freezing point was slightly increased
after thermo-sonication.
3.3.4 Color
The color of the milks before and after thermo-sonication is shown in Figures 2, 3 and 4.
As shown in Figure 2, insignificant changes (p < 0.05) were observed in the L value. The
a value was more negative for all samples after sonication, except for the fat free milk
(Figure 3). In this case, a greenish color was generated. In Figure 4 the change in b value
is shown for all samples. Regardless of butter fat content the b value decreased with
sonication, meaning that the yellow contribution declined in the milk and the parameter
moved into the bluish region. As reported by Walstra et al. (2006) the bluish color of
256
skim milk is due to small casein micelles, while the yellowish color of milk fat, milk
serum and whey is due to the presence of β-carotene. As described in more detail later,
the whiter color remained during the days that these samples were kept for shelf life
studies.
3.4 Shelf-life
The storage life of UHT milk packaged in aseptic conditions can be up to 6 months or
more because of the extreme conditions of temperature used in its processing and
packaging. Although in some countries UHT milk is referred to as sterile milk, UHT
processing does not warrant the sterility of the product. While UHT reduces the number
of bacteria to a minimum, some thermo-resistance spores and enzymes can remain in the
milk, generating spoilage of the product in a matter of months. Once the aseptic package
of UHT milk has been opened, the storage life of milk is not longer than 10 days because
of the presence of bacteria and new environmental conditions.
In this research, thermo-sonication was used in UHT milk to see if this technology
could extend the shelf life of milk after the package is opened. No bacteria were added to
the milk samples in order to test the growth of microorganisms that survived the UHT
process and the growth of common flora in the spoilage of milk packaged under non
extreme aseptic conditions. Samples were poured into sterile plastic bags. Two different
storage conditions were evaluated, first under refrigeration temperature (4ºC), and
secondly corresponding to the ambient temperature of the lab (21ºC).
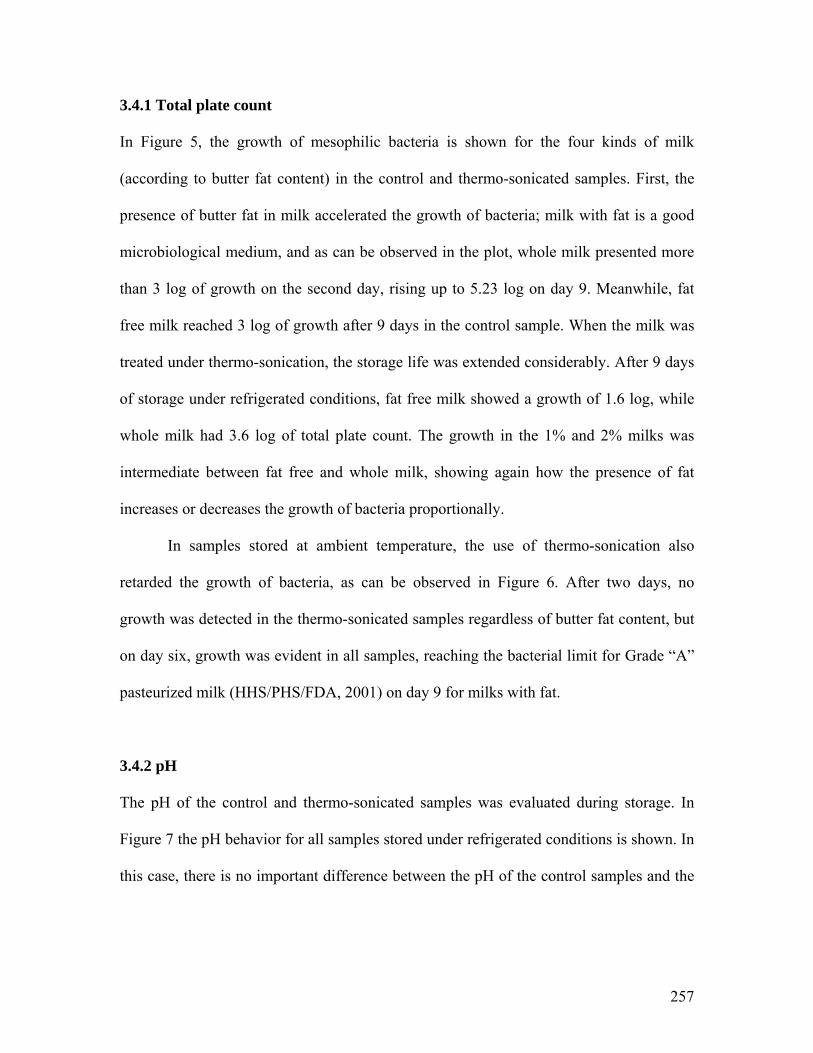
257
3.4.1 Total plate count
In Figure 5, the growth of mesophilic bacteria is shown for the four kinds of milk
(according to butter fat content) in the control and thermo-sonicated samples. First, the
presence of butter fat in milk accelerated the growth of bacteria; milk with fat is a good
microbiological medium, and as can be observed in the plot, whole milk presented more
than 3 log of growth on the second day, rising up to 5.23 log on day 9. Meanwhile, fat
free milk reached 3 log of growth after 9 days in the control sample. When the milk was
treated under thermo-sonication, the storage life was extended considerably. After 9 days
of storage under refrigerated conditions, fat free milk showed a growth of 1.6 log, while
whole milk had 3.6 log of total plate count. The growth in the 1% and 2% milks was
intermediate between fat free and whole milk, showing again how the presence of fat
increases or decreases the growth of bacteria proportionally.
In samples stored at ambient temperature, the use of thermo-sonication also
retarded the growth of bacteria, as can be observed in Figure 6. After two days, no
growth was detected in the thermo-sonicated samples regardless of butter fat content, but
on day six, growth was evident in all samples, reaching the bacterial limit for Grade “A”
pasteurized milk (HHS/PHS/FDA, 2001) on day 9 for milks with fat.
3.4.2 pH
The pH of the control and thermo-sonicated samples was evaluated during storage. In
Figure 7 the pH behavior for all samples stored under refrigerated conditions is shown. In
this case, there is no important difference between the pH of the control samples and the
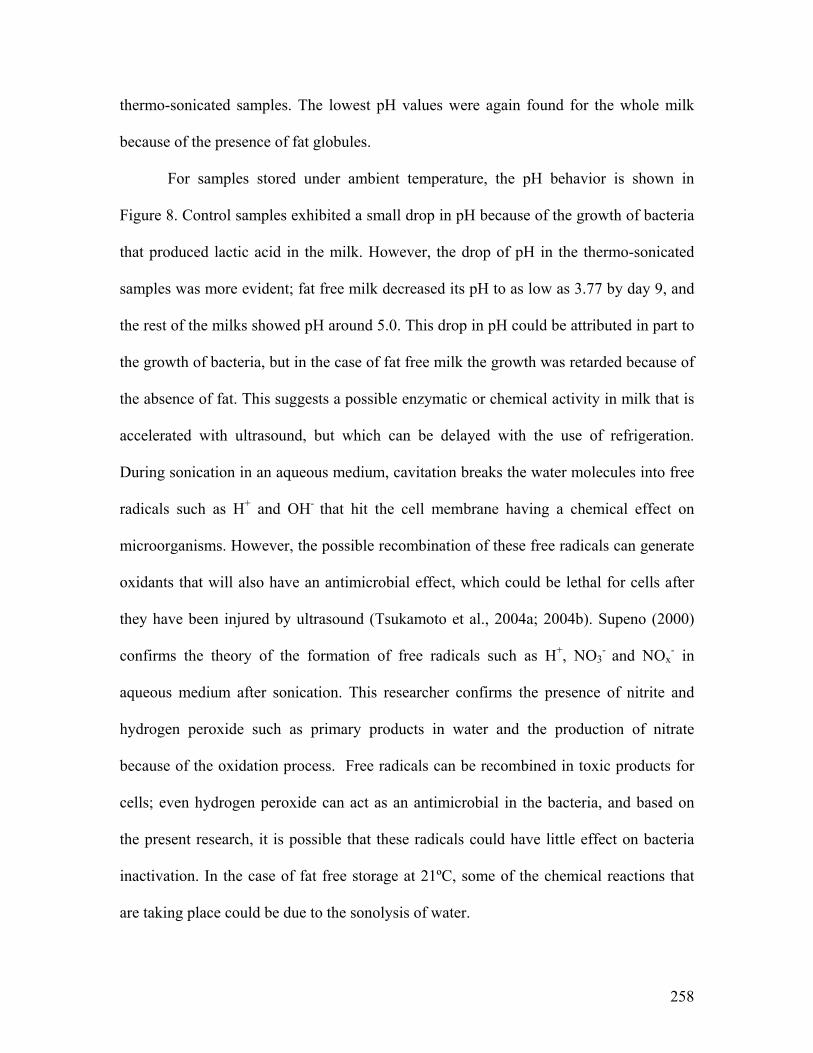
258
thermo-sonicated samples. The lowest pH values were again found for the whole milk
because of the presence of fat globules.
For samples stored under ambient temperature, the pH behavior is shown in
Figure 8. Control samples exhibited a small drop in pH because of the growth of bacteria
that produced lactic acid in the milk. However, the drop of pH in the thermo-sonicated
samples was more evident; fat free milk decreased its pH to as low as 3.77 by day 9, and
the rest of the milks showed pH around 5.0. This drop in pH could be attributed in part to
the growth of bacteria, but in the case of fat free milk the growth was retarded because of
the absence of fat. This suggests a possible enzymatic or chemical activity in milk that is
accelerated with ultrasound, but which can be delayed with the use of refrigeration.
During sonication in an aqueous medium, cavitation breaks the water molecules into free
radicals such as H+ and OH- that hit the cell membrane having a chemical effect on
microorganisms. However, the possible recombination of these free radicals can generate
oxidants that will also have an antimicrobial effect, which could be lethal for cells after
they have been injured by ultrasound (Tsukamoto et al., 2004a; 2004b). Supeno (2000)
confirms the theory of the formation of free radicals such as H+, NO3- and NOx
- in
aqueous medium after sonication. This researcher confirms the presence of nitrite and
hydrogen peroxide such as primary products in water and the production of nitrate
because of the oxidation process. Free radicals can be recombined in toxic products for
cells; even hydrogen peroxide can act as an antimicrobial in the bacteria, and based on
the present research, it is possible that these radicals could have little effect on bacteria
inactivation. In the case of fat free storage at 21ºC, some of the chemical reactions that
are taking place could be due to the sonolysis of water.
259
3.4.3 Color
The color of samples stored under refrigerated conditions is shown in Figures 9, 10 and
11. No important color changes (p < 0.05) were observed throughout the storage life.
Again, samples with lower fat content showed lower luminosity and an important
contribution to the bluish region. This finding is in agreement with that reported by
Owens, Brewer & Rankin (2001) for fat free milks. The whiteness of milk is a result of
the suspended particles that scatter light in the visible spectrum. These particles are fat
globules and casein micelles, but when fat globules are scarce in the medium (e.g. in fat
free milk) the light is scattered in a different way and it generates a blue-gray coloration.
A study to evaluate the color of milk with different butter fat content showed the
following values for the three parameters L 81.11, a -3.74 and b 2.99 for milk with 2%
butter fat content (Phillips, McGiff, Barbano & Lawless, 1995).
Samples stored at 21ºC showed changes in the color parameters L, a and b, as
shown in Figures 12, 13 and 14, respectively. A decrease of luminosity was observed in
all samples. The a values moved to the green region for the thermo-sonicated samples,
especifically for fat free milk. Actually, the change in the color of the thermo-sonicated
sample without fat was observed at first sight. The b value also registered an increase in
its value during storage life, meaning that according to the Hunter color scale, the
samples had a yellow color. The changes in b value could be because of microbial growth
and enzymatic activity in the samples. Owens et al., (2001) showed that in milk
inoculated with bacteria such as Lactococcus lactis ssp. or Propionibacterium
freudenreichii ssp. Shermanii, the b value was increased.
260
4. Conclusion
The butter fat content of milk was a hurdle in the inactivation of Listeria cells in milk
under thermo-sonication treatments, lowering the inactivation rate. Minor changes were
reported in physicochemical and nutritional properties after sonication. The storage life of
UHT milk was extended by the use of thermo-sonication and refrigerated conditions,
with the storage life increasing with lower butter fat content.
References Ananta, E., Voigt, D., Zenker, M., Heinz, V., and Knorr, D. (2005). Cellular
injuries upon exposure of Escherichia coli and Lactobacillus rhamnosus to high-intensity
ultrasound. Journal of Applied Microbiology. 99, 271-278.
Bermúdez-Aguirre, D., & Barbosa-Cánovas, G.V. (2005). Inactivation of Listeria
innocua by ultrasound of low frequency in raw whole milk. Presented at IFT Annual
Meeting, New Orleans, LA, 16-20, July 2005.
Bermúdez-Aguirre, D., & Barbosa-Cánovas, G.V. (2006). Microstructure of fat
globules in whole milk after thermo-sonication treatments. Presented at IFT Annual
Meeting, Orlando, FL, 24-28 June 2006.
Cabeza, M.C., Ordóñez, J.A., Cambero, I., De la Hoz, L., and García, M.L.
(2004). Effect of Thermoultrasonication on Salmonella enterica Serovar Enteridits in
Distilled Water and Intact Shell Eggs. Journal of Food Protection. 67(9), 1886-1891.
261
Carcel, J.A., Benedito, J., SanJuan, N., & Sánchez, E. (1998). Aplicación de los
ultrasonidos en las industrias de productos lácteos y derivados. Alimentación. Equipos y
tecnología. 135- 141.
Earnshaw, R.G., Appleyard, J., & Hurst, R.M. (1995). Understanding physical
inactivation processes: Combined preservation opportunities using heat, ultrasound and
pressure. International Journal of Food Microbiology. 28, 197-219.
Ertugay, M.F., Şengül, M., & Şengül, M. (2004). Effect of Ultrasound Treatment
on Milk Homogenisation and Particle Size Distribution of Fat. Turkish Journal of
Veterinary & Animal Sciences. 28, 303-308.
Fairchild, T.M., Swartzel, K.R., & Foegeding, P.M. (1994). Inactivation kinetics
of Listeria innocua in skim milk in a continuous flow processing system. Journal of Food
Science, 59(5), 960-963.
Furuta, M., Yamaguchi, M., Tsukamoto, T., Yim, B., Stavarache, C.E., Hasiba,
K., & Maeda, Y. (2004). Inactivation of Escherichia coli by ultrasonic irradiation.
Ultrasonics Sonochemistry, 11, 57-60.
Gaze, J. (2005). A review: Microbiological aspects of thermally processed foods.
Journal of Applied Microbiology, (98), 1381-1386.
262
Guerrero, S., López-Malo, A., & Alzamora, S.M. (2001). Effect of ultrasound on
the survival of Saccharomyces cerevisiae: Influence of temperature, pH and amplitude.
Innovative Food Science & Emerging Technologies. 2, 31-39.
Guerrero, S., Tognon, M., & Alzamora, S.M. (2005). Response of Saccharomyces
cerevisiae to the combined action of ultrasound and low weight chitosan. Food Control.
16, 131-139.
HHS/PHS/FDA. (2001). Grade A pasteurized milk ordinance. U.S. Dept. of
Health and Human Serv./Pub. Health Serv/Food and Drug Admin.
IDFA. (2006). International Dairy Foods Association.
http://www.idfa.org/facts/milk/pasteur.cfm
Jensen, R.G., & Newburg, D.S. (1995). Bovine milk lipids. In R.G. Jensen,
Handbook of Milk Composition (pp: 543-575). San Diego, California: Academic Press.
Mabrook, M.F., & Petty, M.C. (2003). A novel technique for the detection of
added water to full fat milk using single frequency admittance measurements. Sensors
and Actuators, B96, 215-218.
263
Mañas, P., Pagán, R., & Raso, J. (2000). Predicting lethal effect of ultrasonic
waves under pressure treatments on Listeria monocytogenes ATCC 15313 by power
measurements. Journal of Food Science, 65(4), 663-667.
Neville, M.C., & Jensen, R.G. (1995). The physical properties of human and
bovine milk. In R.G. Jensen, Handbook of Milk Composition (pp. 81-85), San Diego,
California: Academic Press.
Owens, S.L., Brewer, J.L., & Rankin, S.A. (2001). Influence of Bacterial Cell
Population and pH on the Color of Nonfat Milk. Food Science and Technology. 34, 329-
333.
Pagán, R., Mañas, P., Alvarez, I., & Condón, S. (1999). Resistance of Listeria
monocytogenes to ultrasonic waves under pressure at sublethal (manosonication) and
lethal (manothermosonication) temperatures. Food Microbiology, 16, 139-148.
Phillips, L.G., McGiff, M.L., Barbano, D.M., & Lawless, H.T. (1995). The
influence of fat on the sensory properties, viscosity, and color of lowfat milk. Journal of
Dairy Science. 78, 1258-1266.
Picart, L., Dumay, E., & Cheftel, J.C. (2002). Inactivation of Listeria innocua in
dairy fluids by pulsed electric fields: Influence of electric parameters and food
composition. Innovative Food Science and Technologies, 3, 357-369.
264
Piyasena, P., Liou, S., & McKellar, R.C. (1998). Predictive modeling of
inactivation of Listeria spp. in bovine milk during high-temperature short-time
pasteurization. International Journal of Food Microbiology, 39,167-173.
Potter, N.N. (1986). Food Science. 4th Ed. (pp. 348-350). New York: Van
Nostrand Reinhold.
Povey, M., & Mason, T. (1998). Ultrasound in Food Processing. London: Blackie
Academic & Professional.
Powell, M.R., Tamplin, M., Marks, B., & Campos, D.T. (2006). Bayesian
synthesis of a pathogen growth model: Listeria monocytogenes under competition.
International Journal of Food Microbiology, 109, 36-46.
Raso, J., Pagán, R., Condón, S., & Sala, F.J. (1998). Influence of Temperature and
Pressure on the Lethality of Ultrasound. Applied and Environmental Microbiology. 465-
471.
Supeno, P.K. (2000). Sonochemical formation of nitrate and nitrite in water.
Ultrasonics Sonochemistry, 7, 109-113.
265
Tsukamoto, I., Constantinoiu, E., Furuta, M., Nishimura, R., & Maeda, Y.
(2004a). Inactivation effect of sonication and chlorination on Saccharomyces cerevisiae.
Calorimetric analysis. Ultrasonics Sonochemistry, 11, 167-172.
Tsukamoto, I., Yim, B., Stavarache, C.E., Furuta, M., Hashiba, K., & Maeda, Y.
(2004b). Inactivation of Saccharomyces cerevisiae by ultrasonic irradiation. Ultrasonics
Sonochemistry, 11, 61-65.
Ugarte-Romero, E., Feng, H., Martin, S.E., Cadwallader, K.R., & Robinson, S.J.
(2006). Inactivation of Escherichia coli with power ultrasound in apple cider. Journal of
Food Science, 71(2), E102-E108.
Vercet, A., Oria, R., Marquina, P., Crelier, S., & Lopez-Buesa, P. (2002).
Rheological Properties of Yoghurt Made with Milk Submitted to Manothermosonication.
Journal of Agricultural and Food Chemistry. 50: 6165-6171.
Villamiel, M., & de Jong, P. (2000). Influence of high-intensity ultrasound and
heat treatment in continuous flow on fat, proteins and native enzymes of milk. Journal of
Agriculture and Food Chemistry, 48, 472-478.
Villamiel, M., Van Hamersveld, E.H., & De Jong, P. (1999). Review: Effect of
ultrasound processing on the quality of dairy products. Milk Science International, 54(2),
69-73.
266
Walstra, P., Wouters, J.T.M., & Geurts, T.J. (2006). Dairy Science and
Technology. 2nd Ed. (pp. 159-169), Boca Ratón,FL: CRC Taylor and Francis.
Wu, H., Hulbert, G.J., & Mount, J.R. (2001). Effects of ultrasound on milk
homogenization and fermentation with yogurt starter. Innovative Food Science &
Emerging Technologies. 1: 211-218.
Yousef, A., & Carlstrom, C. (2003). Food Microbiology: A laboratory manual.
(pp.138-142). New Jersey: Wiley Interscience.
Zapico, P., de Paz, M., Medina, M., & Nuñez, M. (1999). The effect of
homogenization of whole milk, skim milk and milk fat on nisin activity against Listeria
innocua. International Journal of Food Microbiology, 46, 151-157.
267
Table I. Nutritional attributes reported and measured for four different butter fat content UHT milk samples before and after thermal and thermo-sonication treatments
Milk Control
(reported*) Butter fat content
Control (measured)
Butter fat contenta (%)
After TS Butter fat
contenta (%)
Control (reported*)
Protein content
Control (measured)
Protein contentb (%)
After TS Protein contentb
(%)
Fat free 0g/240 ml (0.00 %)
0.00 (± 0.00)
0.00 (± 0.00)
8 g/240ml (3.33%)
3.10 (± 0.00)
3.17 (± 0.00)
1% 2.5g/240 ml (1.04%)
0.76 (± 0.01)
0.76 (± 0.01)
8 g/240 ml (3.33%)
2.95 (± 0.00)
2.92 (± 0.01)
2% 5 g/240 ml (2.08%)
1.94 (± 0.01)
1.84 (± 0.01)
8g/ 240 ml (3.33%)
2.87 (± 0.01)
2.84 (± 0.01)
Whole 8 g/240 ml (3.33%)
3.47 (± 0.01)
3.40 (± 0.00)
8g/240 ml (3.33%)
2.72 (± 0.00)
2.70 (± 0.00)
* Taken from nutritional information reported on individual containers TS = Thermo-sonication treatment (63ºC, 120 μm, 30 min) a Accuracy ± 0.1% b Accuracy ± 0.2%
268
Table II. Physicochemical characteristics of different butter fat content milk samples (fat free, 1%, 2% and whole) before and
after thermo-sonication (TS) treatments (63ºC, 120 μm by 30 min)
Milk Control Solids-
Non-Fata
After TS Solids-
Non-Fata
Control pH
After TS pH
Control Acidity (%)*
After TS Acidity (%)*
Control Density (g/cm3)b
After TS Density (g/cm3)b
Control Freezing
Point (ºC)
After Freezing
Point (ºC) Fat free 8.79 ±
0.00 8.98 ± 0.01
6.56 ± 0.02
6.46 ± 0.01
0.132 ± 0.005
0.148 ± 0.003
1.0326 ± 0.0000
1.0334 ± 0.0000
- 0.584 ± 0.000
- 0.599 ± 0.001
1% 8.36 ± 0.01
8.27 ± 0.02
6.57 ± 0.02
6.30 ± 0.03
0.132 ± 0.001
0.140 ± 0.002
1.0302 ± 0.0000
1.0294 ± 0.0035
- 0.551 ± 0.000
- 0.544 ± 0.017
2% 8.11 ± 0.02
8.04 ± 0.02
6.46 ± 0.02
6.30 ± 0.02
0.140 ± 0.003
0.126 ± 0.001
1.0282 ± 0.0006
1.0279 ± 0.0006
- 0.536 ± 0.059
- 0.528 ± 0.012
Whole 7.65 ± 0.01
7.5 ± 0.00
6.43 ± 0.02
6.23 ± 0.01
0.132 ± 0.001
0.154 ± 0.001
1.0250 ± 0.0000
1.0243 ± 0.0001
- 0.504 ± 0.006
- 0.493 ± 0.001
* Expressed as lactic acid content a Accuracy ± 0.2% b Accuracy ± 0.0005
269
-6
-5
-4
-3
-2
-1
00 5 10 15 20 25 30
Time (min)
log
(N/N
o)
Whole 1% 2% Fat free
Figure 1. Inactivation of Listeria innocua ATCC 51742 using thermo-sonication
treatments (63ºC, 120 μm by 30 min) in four different butter fat content milks
270
82
83
84
85
86
87
88
89
90
91
92
93
0 0.5 1 1.5 2 2.5 3 3.5 4 4.5
L
Control TS
Fat free Whole2%1%
Figure 2. L value of different butter fat content milk samples (fat free, 1%, 2% and
whole) before (control) and after thermo-sonication (TS) treatments (63ºC, 120 μm by 30
min)
271
-4
-3.5
-3
-2.5
-2
-1.5
-1
-0.5
00 0
.
5
1 1
.
5
2 2
.
5
3 3
.
5
4 4
.
5
a
Control TS
Fat free Whole2%1%
Figure 3. a value of different butter fat content milk samples (fat free, 1%, 2% and
whole) before (control) and after thermo-sonication (TS) treatments (63ºC, 120 μm by 30
min)
272
0
1
2
3
4
5
6
7
0 0.5 1 1.5 2 2.5 3 3.5 4 4.5
b
Control TS
Fat free Whole2%1%
Figure 4. b value of different butter fat content milk samples (fat free, 1%, 2% and
whole) before (control) and after thermo-sonication (TS) treatments (63ºC, 120 μm by 30
min)
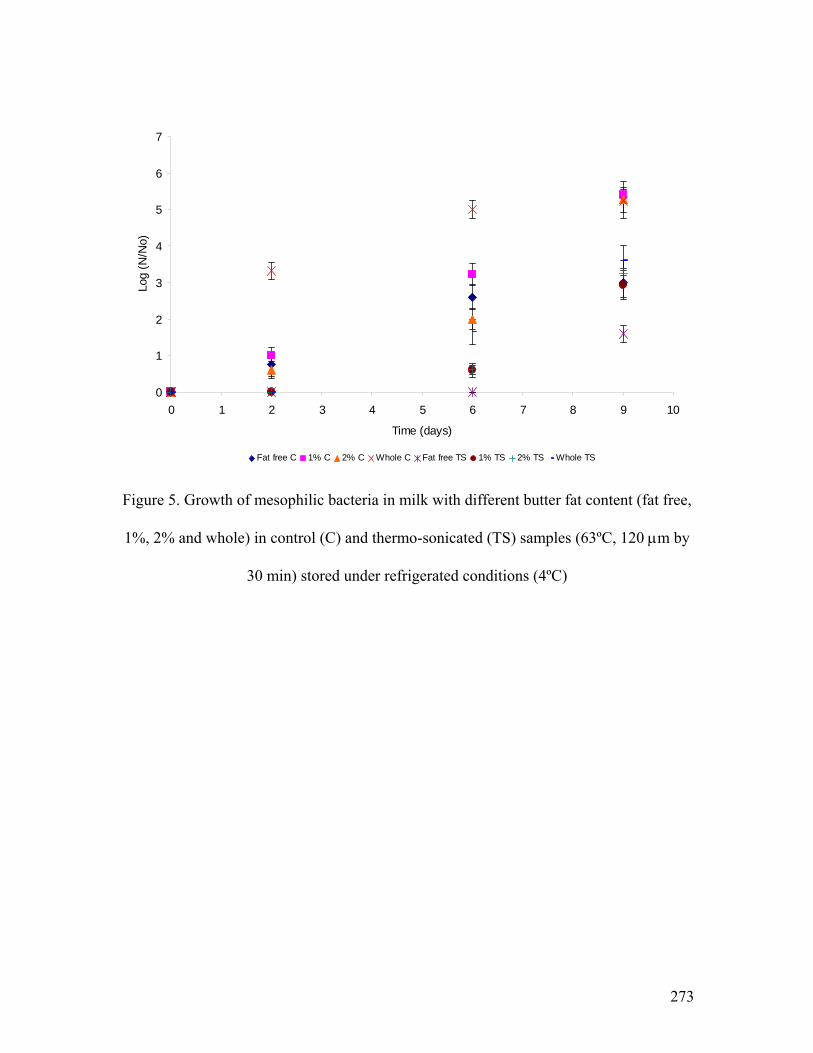
273
0
1
2
3
4
5
6
7
0 1 2 3 4 5 6 7 8 9 10
Time (days)
Log
(N/N
o)
Fat free C 1% C 2% C Whole C Fat free TS 1% TS 2% TS Whole TS
Figure 5. Growth of mesophilic bacteria in milk with different butter fat content (fat free,
1%, 2% and whole) in control (C) and thermo-sonicated (TS) samples (63ºC, 120 μm by
30 min) stored under refrigerated conditions (4ºC)
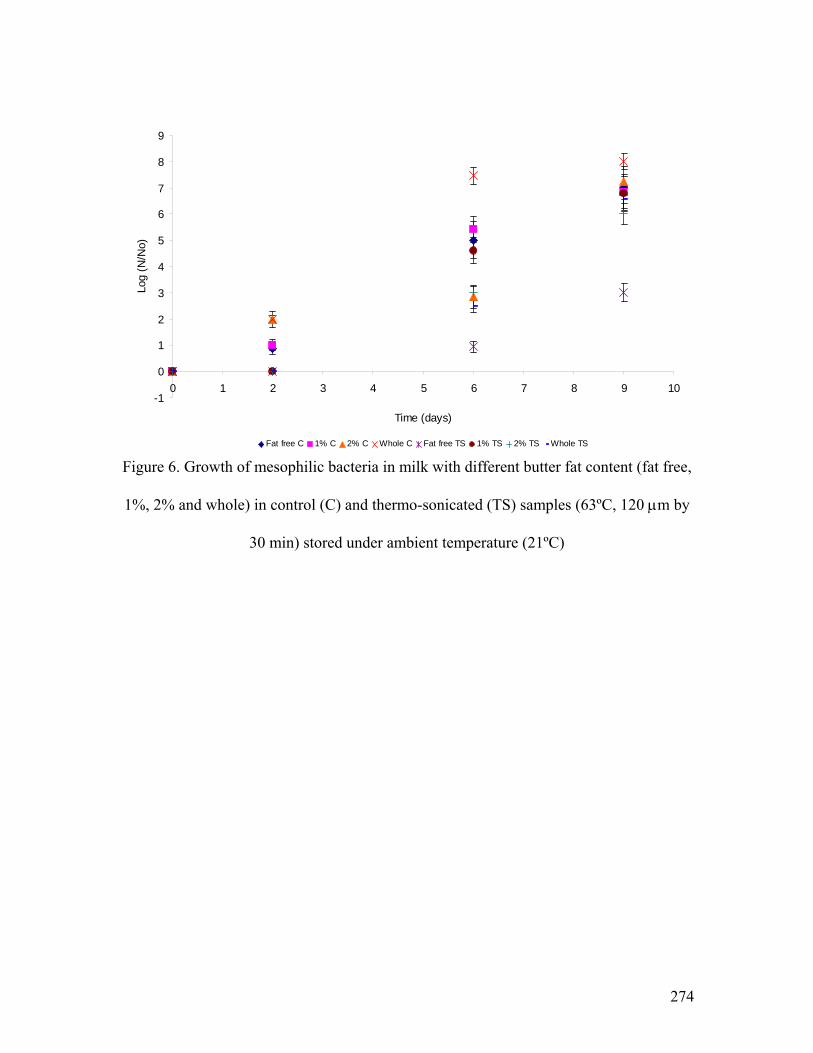
274
-1
0
1
2
3
4
5
6
7
8
9
0 1 2 3 4 5 6 7 8 9 10
Time (days)
Log
(N/N
o)
Fat free C 1% C 2% C Whole C Fat free TS 1% TS 2% TS Whole TS
Figure 6. Growth of mesophilic bacteria in milk with different butter fat content (fat free,
1%, 2% and whole) in control (C) and thermo-sonicated (TS) samples (63ºC, 120 μm by
30 min) stored under ambient temperature (21ºC)
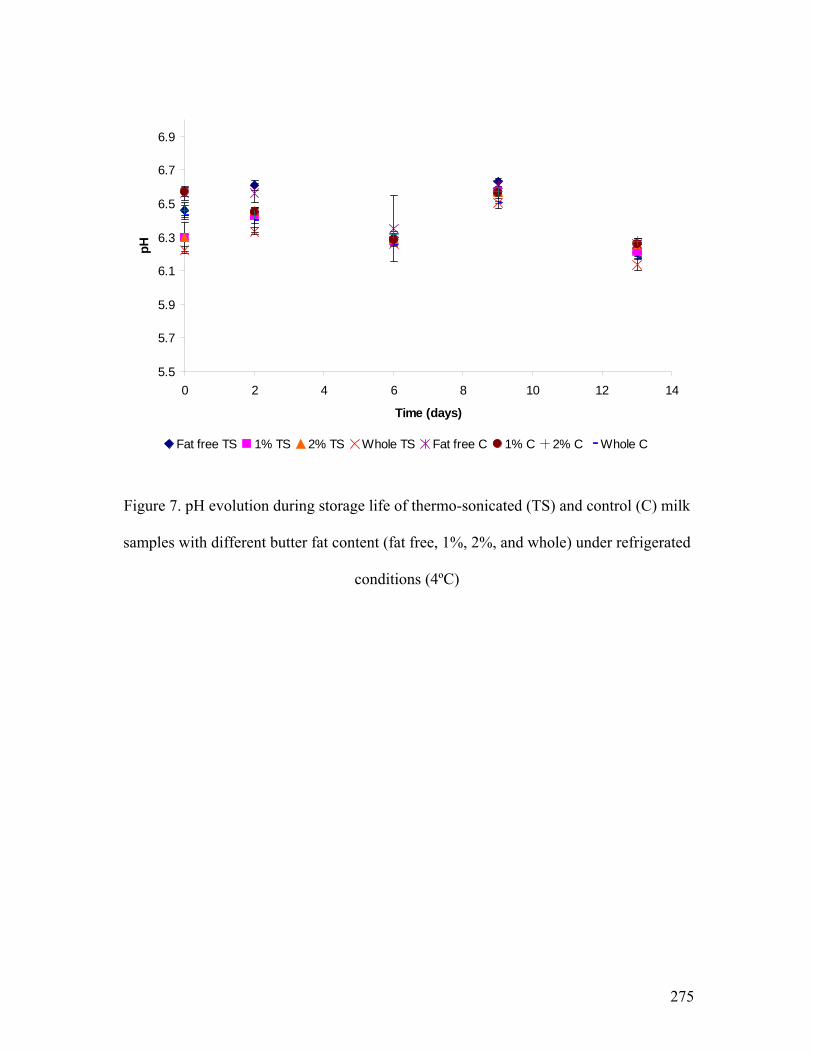
275
5.5
5.7
5.9
6.1
6.3
6.5
6.7
6.9
0 2 4 6 8 10 12 14
Time (days)
pH
Fat free TS 1% TS 2% TS Whole TS Fat free C 1% C 2% C Whole C
Figure 7. pH evolution during storage life of thermo-sonicated (TS) and control (C) milk
samples with different butter fat content (fat free, 1%, 2%, and whole) under refrigerated
conditions (4ºC)
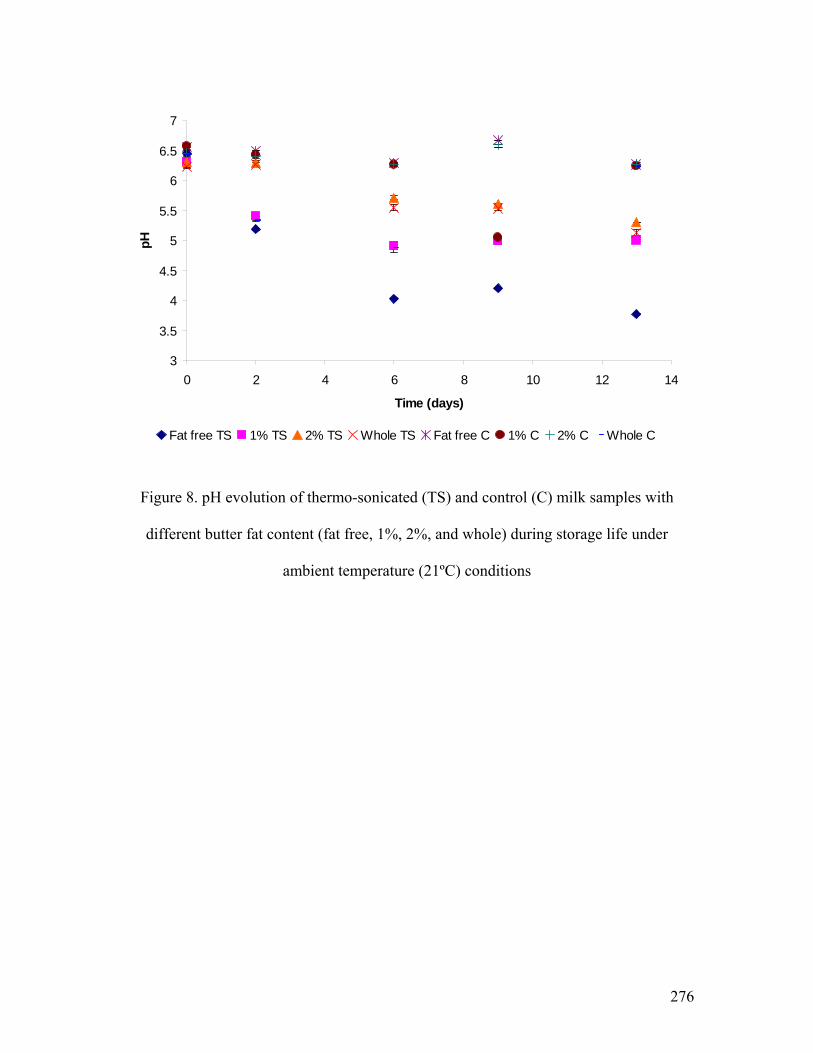
276
3
3.5
4
4.5
5
5.5
6
6.5
7
0 2 4 6 8 10 12 14
Time (days)
pH
Fat free TS 1% TS 2% TS Whole TS Fat free C 1% C 2% C Whole C
Figure 8. pH evolution of thermo-sonicated (TS) and control (C) milk samples with
different butter fat content (fat free, 1%, 2%, and whole) during storage life under
ambient temperature (21ºC) conditions
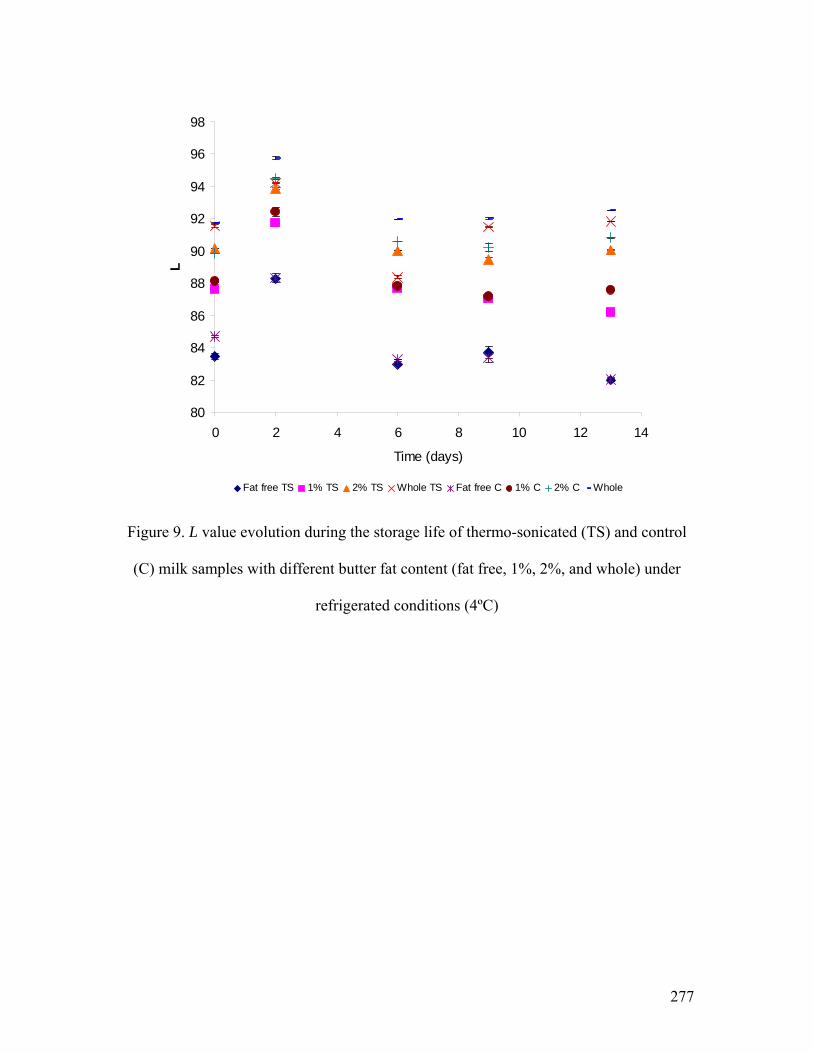
277
80
82
84
86
88
90
92
94
96
98
0 2 4 6 8 10 12 14
Time (days)
L
Fat free TS 1% TS 2% TS Whole TS Fat free C 1% C 2% C Whole
Figure 9. L value evolution during the storage life of thermo-sonicated (TS) and control
(C) milk samples with different butter fat content (fat free, 1%, 2%, and whole) under
refrigerated conditions (4ºC)
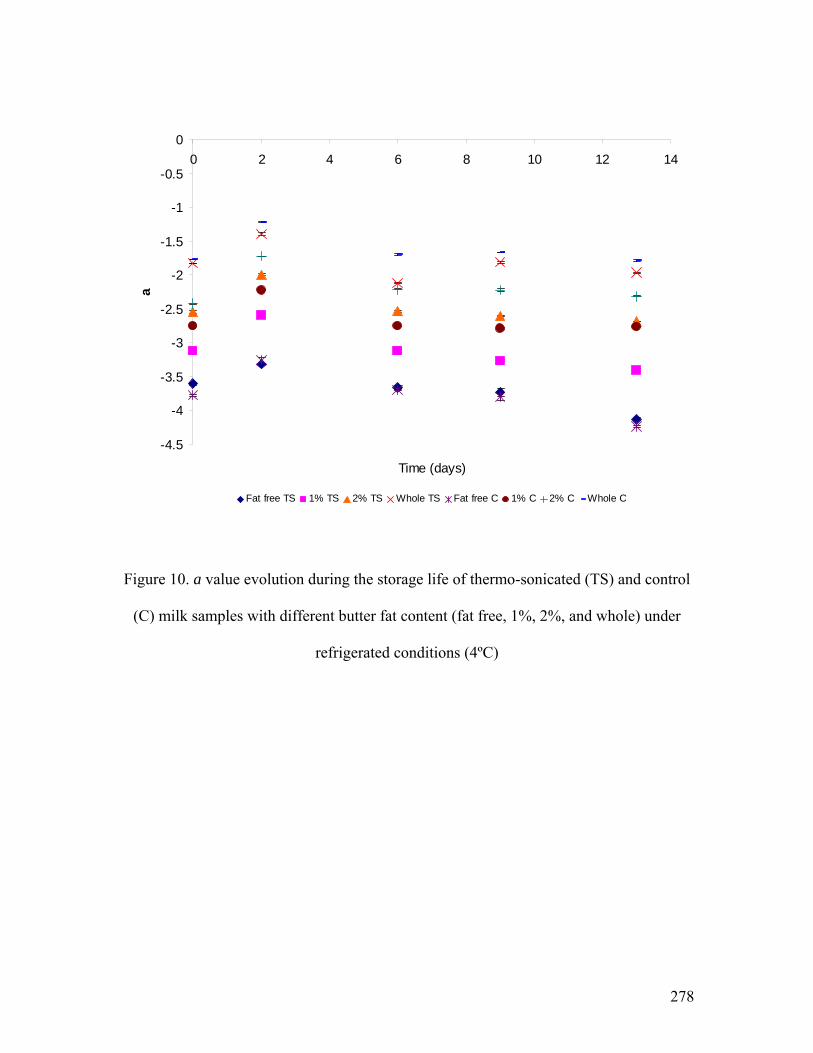
278
-4.5
-4
-3.5
-3
-2.5
-2
-1.5
-1
-0.5
00 2 4 6 8 10 12 14
Time (days)
a
Fat free TS 1% TS 2% TS Whole TS Fat free C 1% C 2% C Whole C
Figure 10. a value evolution during the storage life of thermo-sonicated (TS) and control
(C) milk samples with different butter fat content (fat free, 1%, 2%, and whole) under
refrigerated conditions (4ºC)
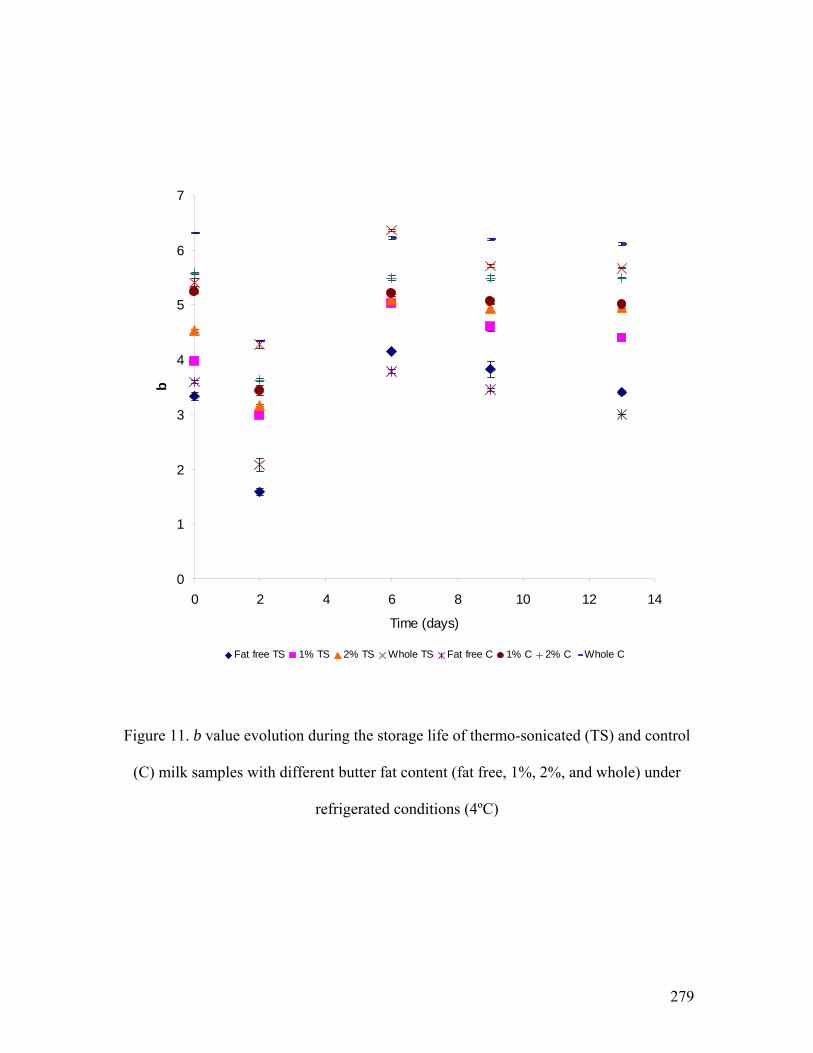
279
0
1
2
3
4
5
6
7
0 2 4 6 8 10 12 14
Time (days)
b
Fat free TS 1% TS 2% TS Whole TS Fat free C 1% C 2% C Whole C
Figure 11. b value evolution during the storage life of thermo-sonicated (TS) and control
(C) milk samples with different butter fat content (fat free, 1%, 2%, and whole) under
refrigerated conditions (4ºC)

280
76
78
80
82
84
86
88
90
92
94
96
0 2 4 6 8 10 12 14
Time (days)
L
Fat free TS 1% TS 2% TS Whole TS Fat free C 1% C 2% C Whole C
Figure 12 . L value for thermo-sonicated (TS) and control (C) milk samples with different
butter fat content (fat free, 1%, 2%, and whole) during the storage life under ambient
temperature (21ºC) conditions
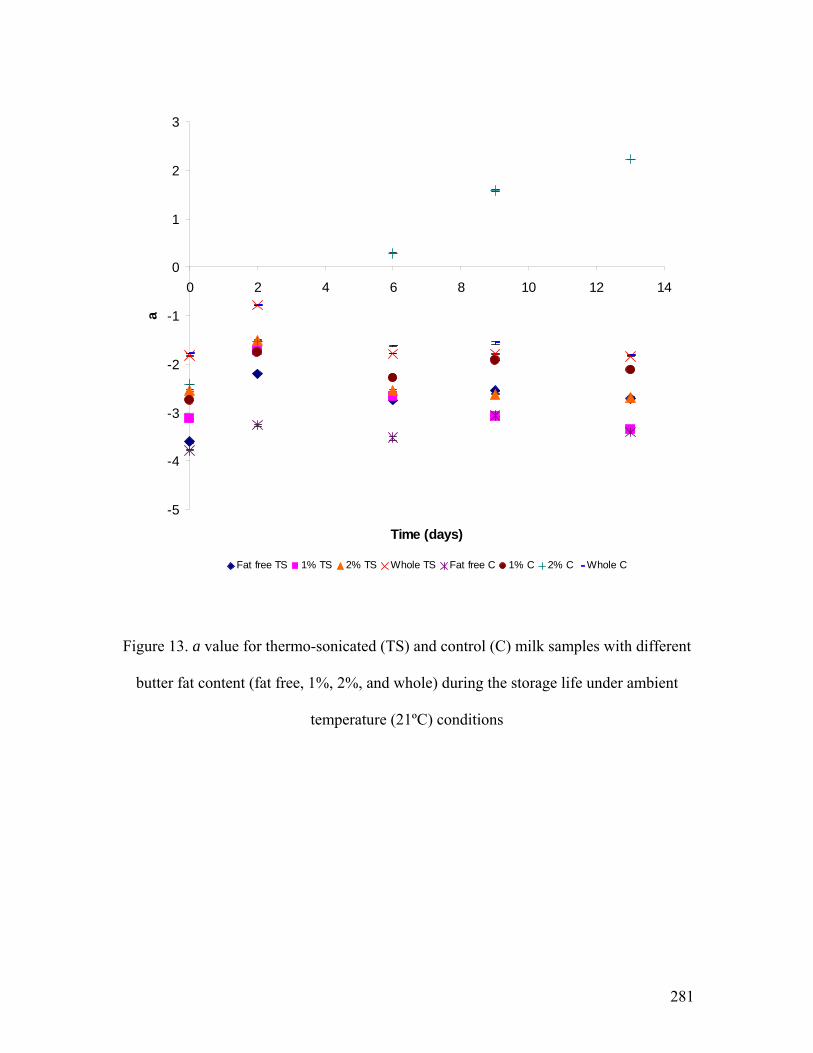
281
-5
-4
-3
-2
-1
0
1
2
3
0 2 4 6 8 10 12 14
Time (days)
a
Fat free TS 1% TS 2% TS Whole TS Fat free C 1% C 2% C Whole C
Figure 13. a value for thermo-sonicated (TS) and control (C) milk samples with different
butter fat content (fat free, 1%, 2%, and whole) during the storage life under ambient
temperature (21ºC) conditions
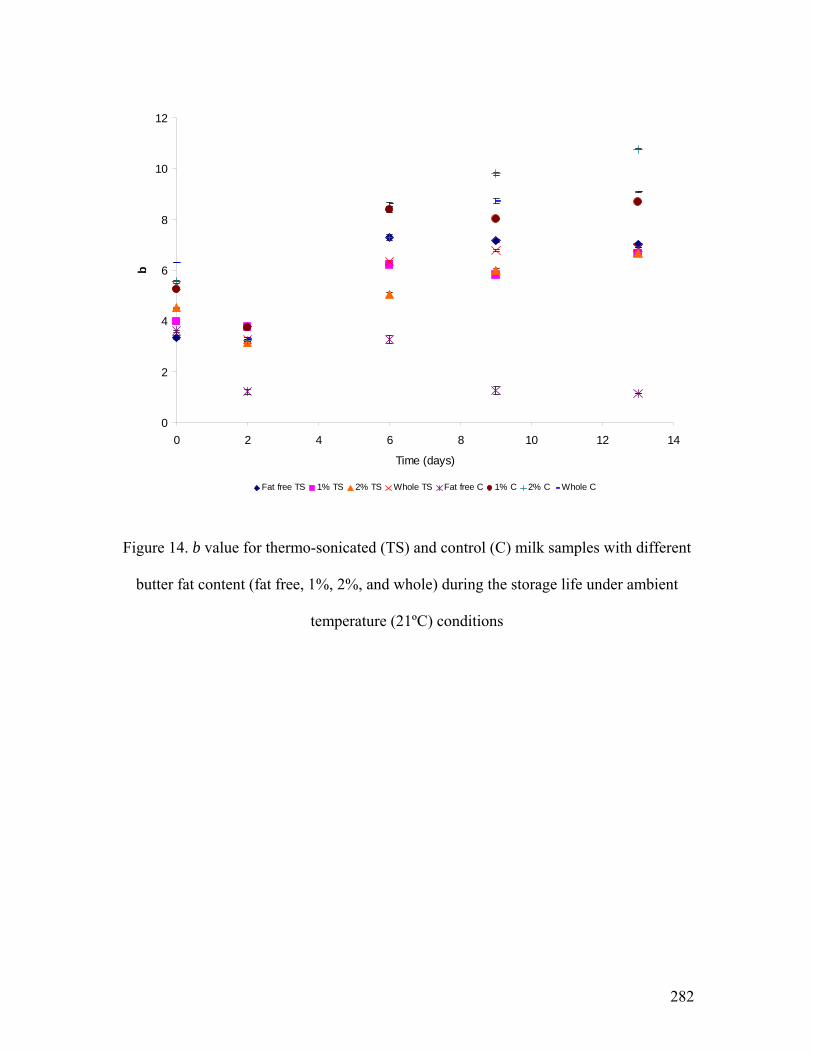
282
0
2
4
6
8
10
12
0 2 4 6 8 10 12 14
Time (days)
b
Fat free TS 1% TS 2% TS Whole TS Fat free C 1% C 2% C Whole C
Figure 14. b value for thermo-sonicated (TS) and control (C) milk samples with different
butter fat content (fat free, 1%, 2%, and whole) during the storage life under ambient
temperature (21ºC) conditions
283
CHAPTER SEVEN
EVALUATION OF THE MICROSTRUCTURE OF THERMO-SONICATED
YOGURT WITH SCANNING ELECTRON MICROSCOPY USING A SHORTER
(NEW) SAMPLE PREPARATION PROCEDURE
Daniela Bermúdez-Aguirre, Valerie Lynch-Holm and
Gustavo V. Barbosa-Cánovas
Abstract
Ultrasound has been used in food research mainly in microbial inactivation, but at the
same time it has shown positive effects in the processing of some foods. In electron
microscopy, considerable sample preparation time is required to make meaningful
observation of the product under study. In the case of dairy products, some artifacts might
occur, making sample preparation even longer and more complicated. The objective of
this work was to study the microstructure of thermo-sonicated yogurt with three different
sample preparation techniques used in electron microscopy. The thermo-sonication
treatment was applied with an ultrasonic processor (Hielscher® UP400S, 400W, 24 kHz,
120 μm) in raw whole milk at 63ºC for 30 minutes. Yogurt preparation followed the
thermo-sonication of milk with a starter culture of lactobacillus. The first sample
preparation consisted of the conventional sample dehydration with organic solvents
(ethanol, acetone and HMDS). Technique number two consisted of freeze-drying the
samples, freezing with liquid nitrogen and using a freeze-drier for 24 h. The third
technique consisted of dehydration of the samples with the same organic solvents as in
284
the first technique, but assisted with the use of microwave (MW) energy. Samples were
observed with a Scanning Electron Microscope Hitachi® S-570 at 20 kV. Results showed
that freeze-drying is not a technique suitable for yogurt because of the low resolution of
the images. However, high resolution and defined images were obtained with the MW
technique showing very good homogenization of the components of the thermo-sonicated
yogurt (casein and fat globules) while avoiding the syneresis of the product compared
with the protein network with interstitial spaces filled with whey of the conventional
yogurt. MW technique shortened the time in sample preparation to 3 h compared with the
conventional dehydration technique that takes 5 d, and at the same time provided images
with high resolution.
285
1. Introduction
One of the keys in the use and performance of electron microscopy to analyze samples is
the sample preparation procedure. Each step in the sample preparation protocol must be
followed as closely as possible in order to obtain images with high resolution, images that
represents the real microstructure of the food without damages generated through the
preparation. Some of the techniques that are available in food science to study the
structure of food products are electron and optical microscopy, elemental analysis such as
X-ray microanalysis and electron loss spectrometry, magnetic resonance imaging,
acoustic microscopy and ultrasoft X-ray microscopy (Kaláb et al., 1995). Some of the
methods of sample preparation for food products that have been used for electron
microscopy include air drying, freeze drying and fixation and chemical dehydration
(Chabot, 1979). Conventional techniques in sample preparation for food microstructure
have shown some disadvantages such as obscuring ultra-fine details because of the thick
metal coating, addition of metal particles in the specimen modifying the original
structure, or the presence of edge-effect brightness (McManus et al., 1993). Sample
preparation for Scanning Electron Microscopy (SEM) requires removal of the water from
the sample without minor change in the structure, but also the sample must be conducive
to be observed under the microscope (Chabot, 1979; Kaláb, 1981). Staining techniques
are currently used in the study of food microstructure because these techniques show the
chemical composition of the structures such as proteins, fats, ribonucleic acids and some
salts (Kaláb, 1993). In general, sample preparation procedures for SEM take considerably
longer times to obtain the required characteristics of the specimen before analyzing it
under the microscope, as is shown in some references (McManus et al., 1993).
286
Examination of dairy products with SEM has been a difficult area because of several
artifacts that occur through the sample preparation procedure (McManus et al., 1993).
The main constituents of milk that can be visible are the casein micelles, fat globules and
submicellar casein. In raw milk the size of the casein micelles is between 100-300 nm in
diameter and that of the submicelles from 10-20 nm in diameter (Kaláb, 1993); the size of
fat globules is between 0.2 to 10 μm in diameter (Keenan and Patton, 1995). Yogurt is a
fermented dairy product made from milk that is usually heated at 85ºC for 30 min then
cooled to 40ºC and the addition of the starter cultures that usually are lactobacillus.
Studies of yogurt with electron microscopy have shown the protein network as a chain of
casein micelles containing in the interstitial spaces whey protein (liquid), this matrix
being determinant in the phase separation or syneresis of the product (Kaláb, 1993). This
physical change in the product is an undesirable phenomenon in the product that can take
place through transportation and storage.
The objective of this research was to evaluate three different sample preparation
protocols for Scanning Electron Microscopy of thermo-sonicated yogurt and to decide
which protocol is optimal for the purpose of analyzing the microstructure of this dairy
product on the basis of time effectiveness-image resolution.
2. Materials and methods
2.1 Milk and yogurt samples
Two different systems were evaluated. System one corresponds to the control and it used
commercial plain natural yogurt bought in the local supermarket. This yogurt had 3.25%
milk fat and belongs to grade A. For the second sample, raw milk was used. The raw milk
287
was bought in the local creamery of Washington State University; this milk had an
average fat content of 4.25%.
2.2 Milk pasteurization
Thermo-sonication of milk
Thermo-sonication pasteurization was performed with an ultrasonic processor Hielscher
USA Inc. (Ringwood, NJ) model UP400S (400 W, 24 kHz, 120 microns) with a 22 mm
diameter probe. A double-walled vessel (500 ml) was used as a treatment chamber with
an internal diameter of 8 cm and depth of 13.5 cm. A magnetic stirrer was used inside the
treatment chamber to assure homogeneity of the treatment. The amplitude of the
ultrasonic wave was constant for the thermo-sonication treatment, 100% (120 μm), and
the temperature was maintained at 85ºC (±0.5). Temperature was kept constant via a
refrigerated bath (VWR Scientific Model 1166, Niles IL). A thermo-couple was used in
the treatment chamber to monitor the temperature throughout the experiments. Treatment
time was 30 min and milk samples were kept at 4ºC until they were processed.
2.3 Yogurt preparation
In order to process yogurt, milk samples were heated at 45ºC and milk powder (2.8%)
was added and stirred until total solubilization was achieved. Plain commercial yogurt
(2.4%) containing Lactobacillus bulgaricus, Streptococcus thermophilus, Lactobacillus
acidophilus, Lactobacillus bifidus and Lactobacillus casei was used as starter culture.
Samples were incubated at 45ºC and the acidity (lactic acid) and pH were monitored from
the beginning of the process until it reached 0.65 to 0.70% and the appearance of the
288
yogurt was homogeneous. Afterwards, samples were stored at 4ºC for 24 h to proceed
with the following analysis. For the commercial yogurt, sample 1, acidity and pH were
measured as a control parameter.
2.4 Microscopy studies
2.4.1 Sample preparation
Three different sample preparations were used as steps to look at the yogurt
microstructure in the microscope. The main difference between the procedures was the
time to prepare the sample. The HMDS (Hexamethyldisilazane) dehydration was used as
a control because that is the conventional procedure to prepare samples for microscopy
studies. The freeze-drying procedure was used in order to compare a faster method that
does not require the use of a fixative, and in which post-fixative and sample dehydration
takes place mainly by sublimation. Finally, the third method was similar to HMDS
dehydration, but took advantage of the microwave energy to dehydrate the samples faster.
2.4.1.1 HMDS dehydration
100 μg of yogurt was transferred to disposable 1.5 ml sterile plastic microcentrifuge
tubes. 0.5 ml of a solution of glutaraldehyde (2%) paraformaldehyde (2%) in 0.1 M
phosphate buffer (pH 7.2) was added to each microtube and allowed to undergo the
fixation process for 24 h at 4ºC. After that the fixation solution was washed for 10 min
with phosphate buffer (0.1M) and then two consecutive 10 min washes with cacodylate
buffer (0.1M). Post-fixed procedure consisted of adding 2% osmium tetroxide in
289
cacodylate buffer (0.1M) at 4ºC for 24 h. Samples were washed three times with
cacodylate buffer (0.1M) for 10 min each time.
Dehydration of samples was achieved with serial dilution solutions of ethanol
(30%, 50%, 60%, 70%, 95% and 100%). Each solution was maintained in contact with
the sample for 10 min and the last solution (100% ethanol) was used three consecutive
times.
After dehydration of the samples with ethanol, the second dehydration procedure
with Hexamethyldisilazane (HMDS) was carried out with the samples. Consecutive 15
min contact of samples with ethanol/acetone/HMDS solutions in different ratios (1:0:0,
1:1:0, 0:1:0, 0:1:1, 0:0:1, 0:0:1) were used. Air drying was used as a final step, leaving
the microcentrifuge tubes with the open lid inside of a hood for at least one night.
Samples were mounted in aluminum stubs and Gold plating (Sputter coater, Technics
Hummer V, Anatech, San José, CA) was used as a final step to view the samples in a
Hitachi S-570 (Japan, Tokyo) Scanning Electron Microscope (SEM) operating at 20 kV.
2.4.1.2 Freeze-drying
Yogurt samples were placed in disposable 1.5 ml sterile plastic microcentrifuge tubes.
Two batches of samples were used; the first batch without any fixative was placed
directly to freeze. In the second batch of yogurt samples a solution of glutaraldehyde
(2%) paraformaldehyde (2%) in 0.1 M phosphate buffer (pH 7.2) was used as a fixative
for one hour. After that samples were rinsed twice with filtered and deionized water for 5
min each time. Water was taken out and samples were placed to freeze. The top of the
tubes was covered with small paper balls. Liquid nitrogen was used as a freezing
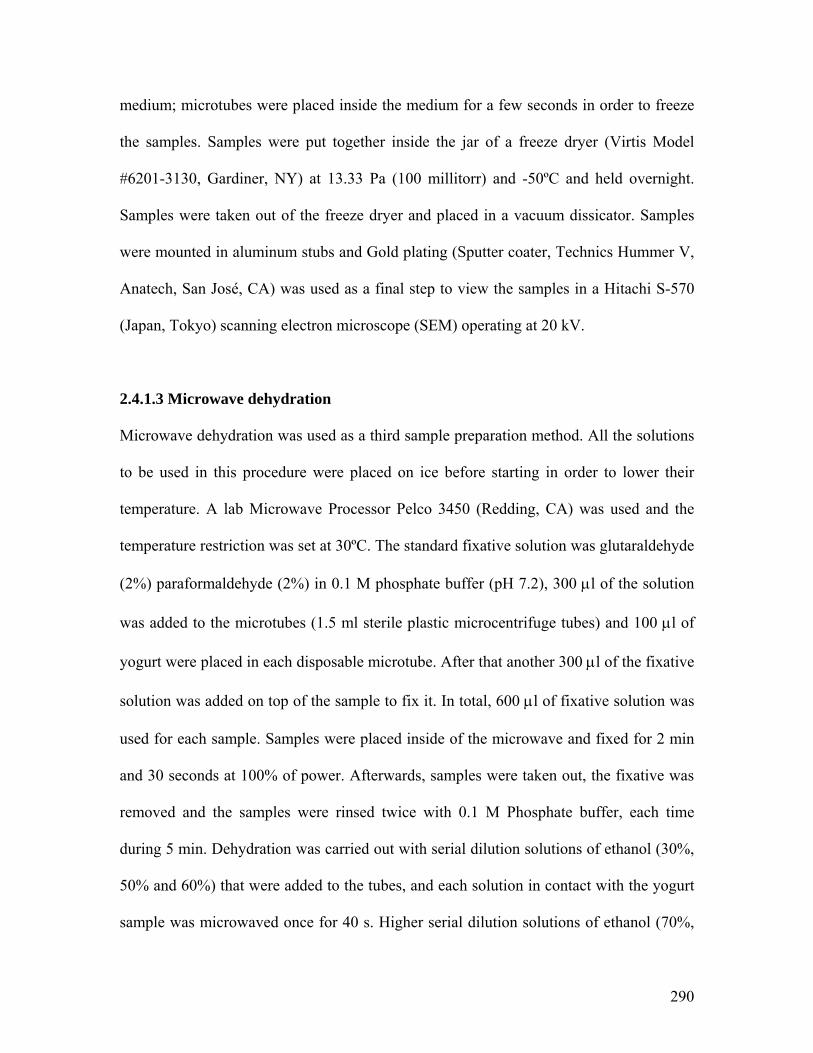
290
medium; microtubes were placed inside the medium for a few seconds in order to freeze
the samples. Samples were put together inside the jar of a freeze dryer (Virtis Model
#6201-3130, Gardiner, NY) at 13.33 Pa (100 millitorr) and -50ºC and held overnight.
Samples were taken out of the freeze dryer and placed in a vacuum dissicator. Samples
were mounted in aluminum stubs and Gold plating (Sputter coater, Technics Hummer V,
Anatech, San José, CA) was used as a final step to view the samples in a Hitachi S-570
(Japan, Tokyo) scanning electron microscope (SEM) operating at 20 kV.
2.4.1.3 Microwave dehydration
Microwave dehydration was used as a third sample preparation method. All the solutions
to be used in this procedure were placed on ice before starting in order to lower their
temperature. A lab Microwave Processor Pelco 3450 (Redding, CA) was used and the
temperature restriction was set at 30ºC. The standard fixative solution was glutaraldehyde
(2%) paraformaldehyde (2%) in 0.1 M phosphate buffer (pH 7.2), 300 μl of the solution
was added to the microtubes (1.5 ml sterile plastic microcentrifuge tubes) and 100 μl of
yogurt were placed in each disposable microtube. After that another 300 μl of the fixative
solution was added on top of the sample to fix it. In total, 600 μl of fixative solution was
used for each sample. Samples were placed inside of the microwave and fixed for 2 min
and 30 seconds at 100% of power. Afterwards, samples were taken out, the fixative was
removed and the samples were rinsed twice with 0.1 M Phosphate buffer, each time
during 5 min. Dehydration was carried out with serial dilution solutions of ethanol (30%,
50% and 60%) that were added to the tubes, and each solution in contact with the yogurt
sample was microwaved once for 40 s. Higher serial dilution solutions of ethanol (70%,
291
80%, 90% and 100%) were used and each one was microwaved for 40 s twice. Each time
before the microwave dehydration the solution was replaced with a new one. Acetone
was used in combination with ethanol, the first time in a ratio of 1:1 and microwaved for
40 s; afterwards, acetone was used and microwaved for 40 s twice. HMDS and acetone
were used in a ratio of 1:1 for 15 min without microwave dehydration and this solution
was replaced with fresh HMDS and kept in the samples overnight to allow air drying of
the samples. Samples were mounted in aluminum stubs and Gold plating (Sputter coater,
Technics Hummer V, Anatech, San José, CA) was used as a final step to view the
samples in a Hitachi® S-570 (Japan, Tokyo) scanning electron microscope (SEM)
operating at 20 kV.
3. Results and discussion
3.1 HMDS dehydration
In Figure 1 the comparison between the HMDS and microwave drying methods for
sample preparation is shown. At the top of the Figure the samples are representative of
commercial yogurt following the preparation of HMDS dehydration that usually takes 5
d. In the same Figure at the bottom both images correspond to natural yogurt but follow
the sample preparation for electron microscopy using microwave dehydration. As can be
observed, the images are very similar and microwave dehydration shows a better
resolution of the fat and protein structure of yogurt. This sample preparation takes only 3
h to prepare the sample for observation in the SEM. During sample preparation with
HMDS, chemical fixation takes place in the sample; glutaraldehyde is used first to
292
crosslink proteins and the osmium tetroxide solution is useful to stabilize unsaturated
lipids (Kaláb et al., 1995).
3.2 Freeze-drying
It is worth mentioning that the use of freeze-drying sample preparation was not able to
process yogurt samples; despite the fact that this procedure takes only one day to prepare
the sample, images did not have good resolution and for that reason no images of this
methodology are shown in the present work. According to Chabot (1979), freeze-drying
is a sample preparation that presents many artifacts and drawbacks during processing of
the food samples, such as a very quick freezing in an attempt to avoid damage in the
tissue; sometimes cryoprotectors are required to preserve the sample, which is not
suitable for SEM. The images that were obtained with this technique in this research
could have low resolution because of the formation of large crystals that are not the
structure of the yogurt that were intended to be observed. As Chabot (1979) mentions, in
dairy products specifically liquid freeze drying can generate large ice crystals showing an
ice crystal structure in a protein solution. Also, liquid nitrogen is not useful for rapid
freezing when it is used near its boiling point because of the generation of an insulating
layer around the sample avoiding a quick freezing. Melting nitrogen slush is a better and
more recommendable cryo-fixative (Kaláb, 1981).
3.3 Microwave dehydration
In Figure 2 samples are representative of the thermo-sonicated yogurt using the
conventional HMDS dehydration for sample preparation. It is quite interesting to observe
293
the new microstructure that yogurt samples have after sonication. The images shown in
Figure 1 have a more relaxed structure without an important differentiation between fat
or protein structure regardless of the sample preparation protocol. But in using thermo-
sonication as a pasteurization method of milk to process yogurt, the internal structure of
yogurt changes in an important way, as can be observed in Figure 2. A more compact
matrix of protein and fat globules is shown with a more homogeneous particle size.
Ultrasound generates a homogenized effect in the fat globules of milk; the main objective
of homogenizing milk is to divide the fat globules and clumps in milk as small as
possible in order to prevent them from rising to the top of the milk as a layer (Wu et al.,
2001). According to Dave and Shah (1998), some of the parameters that can affect the
size of the granules in yogurt are the kind of heat treatment, type of stabilizer, starter
culture and incubation time and temperature. Commercial yogurt has a porous protein
matrix formed of interconnected chains and clusters; the void spaces reflected in
microscopy images signify air compartments (Kaláb et al., 1995).
Finally, Figure 3 shows two important aspects of this research. The first aspect is
the structure in the detail of the thermo-sonicated yogurt. In these images the presence of
reduced size fat globules, proteins structure, lactose crystals and other milk components
can be observed. Structures were reduced in size because the action of ultrasound in the
milk components lead to a more homogeneous network, with other components such as
whey integrated as part of the new structure and avoiding the common problems in
yogurt such as syneresis. Whey separation or syneresis is one the quality aspects in
yogurt that has a main role in consumer preference and quality, as some authors mention
(Lee and Lucey, 2004; Wu et al., 2001; Dave and Shah, 1998). Also because of the
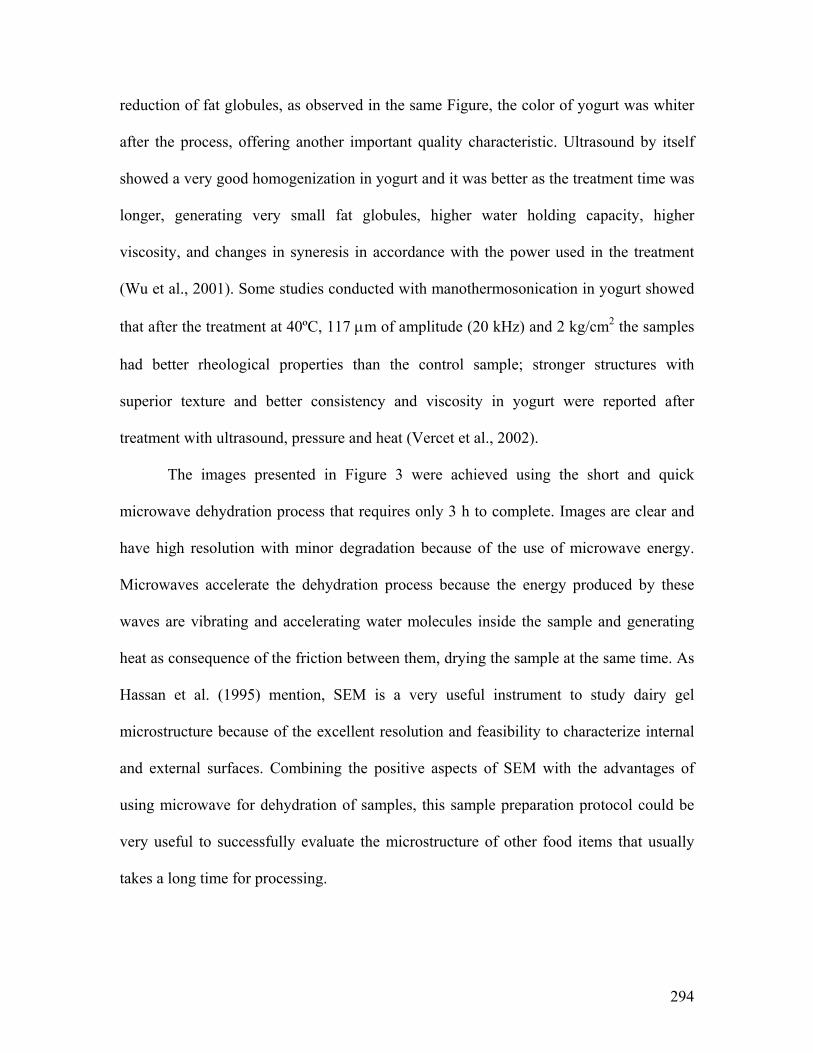
294
reduction of fat globules, as observed in the same Figure, the color of yogurt was whiter
after the process, offering another important quality characteristic. Ultrasound by itself
showed a very good homogenization in yogurt and it was better as the treatment time was
longer, generating very small fat globules, higher water holding capacity, higher
viscosity, and changes in syneresis in accordance with the power used in the treatment
(Wu et al., 2001). Some studies conducted with manothermosonication in yogurt showed
that after the treatment at 40ºC, 117 μm of amplitude (20 kHz) and 2 kg/cm2 the samples
had better rheological properties than the control sample; stronger structures with
superior texture and better consistency and viscosity in yogurt were reported after
treatment with ultrasound, pressure and heat (Vercet et al., 2002).
The images presented in Figure 3 were achieved using the short and quick
microwave dehydration process that requires only 3 h to complete. Images are clear and
have high resolution with minor degradation because of the use of microwave energy.
Microwaves accelerate the dehydration process because the energy produced by these
waves are vibrating and accelerating water molecules inside the sample and generating
heat as consequence of the friction between them, drying the sample at the same time. As
Hassan et al. (1995) mention, SEM is a very useful instrument to study dairy gel
microstructure because of the excellent resolution and feasibility to characterize internal
and external surfaces. Combining the positive aspects of SEM with the advantages of
using microwave for dehydration of samples, this sample preparation protocol could be
very useful to successfully evaluate the microstructure of other food items that usually
takes a long time for processing.
295
4. Conclusions
HMDS dehydration showed good resolution of yogurt images; however, better resolution
was achieved using microwave dehydration and the time consumed was shorter. Freeze-
drying was not a suitable procedure for sample preparation in yogurt samples. Thermo-
sonication of milk was useful as a pasteurization process to improve yogurt quality,
showing better homogenization and color, in addition to there being no syneresis
problems during storage of the product.
References
Chabot, J.F. 1979. Preparation of food science samples for SEM. Scanning
Electron Microscopy III. 279-298.
Dave, R.I. and Shah, N.P. 1998. The influence of ingredient supplementation on
the textural characteristics of yogurt. Australian Journal of Dairy Technology. 53(3):180-
184.
Hassan, A.N., Frank, J.F., Farmer, M.A., Schmidt, K.A., and Shalabi, S.I. 1995.
Formation of yogurt microstructure and three-dimensional visualization as determined by
confocola scanning laser microscopy. Journal of Dairy Science. 78:2629-2636.
Kaláb, M. 1981. Electron Microscopy of milk products: A review of techniques.
Scanning Electron Microscopy III. 453-472.
296
Kaláb, M. 1993. Practical Aspects of Electron Microscopy in Dairy Research.
Food structure. 12: 95-114.
Kaláb, M., Allan-Wojtas, P., and Miller, S.S. 1995. Microscopy and other
imaging techniques in food structure analysis. Trends in Food Science and Technology.
6:177-186.
Keenan, T.W., and Patton, S. 1995. The structure of Milk: Implications for
Sampling and Storage. In “Handbook of Milk Composition”. R.G. Jensen, Ed. Academic
Press. San Diego, California, pp: 5-50
Lee, W.J., and Lucey, J.A. 2004. Structure and Physical Properties of Yogurt
Gels: Effect of inoculation rate and incubation temperature. Journal of Dairy Science.
87:3153-3164.
McManus, W.R., McMahon, D.J., and Oberg, C.J. 1993. High-Resolution
Scanning Electron Microscopy of Milk Products: A New Sample Preparation Procedure.
Food Structure. 12: 475-482.
Vercet, A., Oria, R., Marquina, P., Crelier, S., and Lopez-Buesa, P. 2002.
Rheological properties of yogurt made with milk submitted to manothermosonication.
Journal of Agricultural and Food Chemistry.50:6165-6171.

297
Wu, H., Hulbert, G.J., and Mount, J.R. 2001. Effects of ultrasound on milk
homogenization and fermentation with yogurt starter. Innovative Food Science and
Emerging Technologies. 1: 211-218.
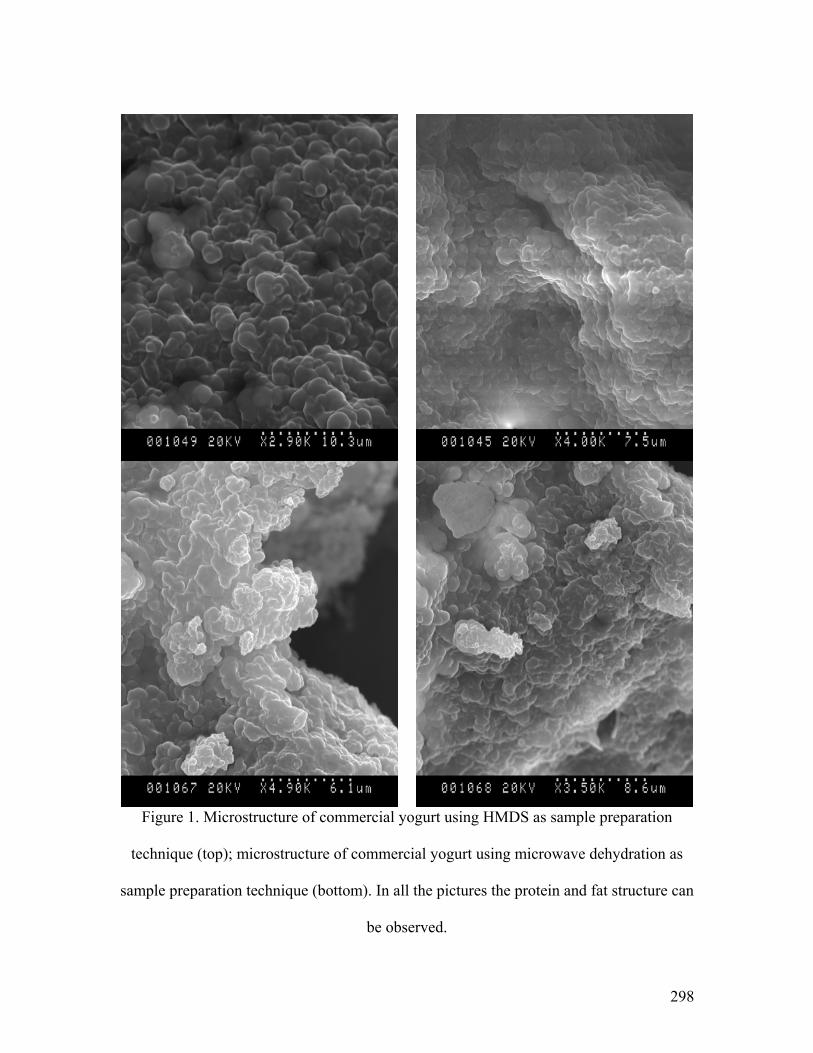
298
Figure 1. Microstructure of commercial yogurt using HMDS as sample preparation
technique (top); microstructure of commercial yogurt using microwave dehydration as
sample preparation technique (bottom). In all the pictures the protein and fat structure can
be observed.
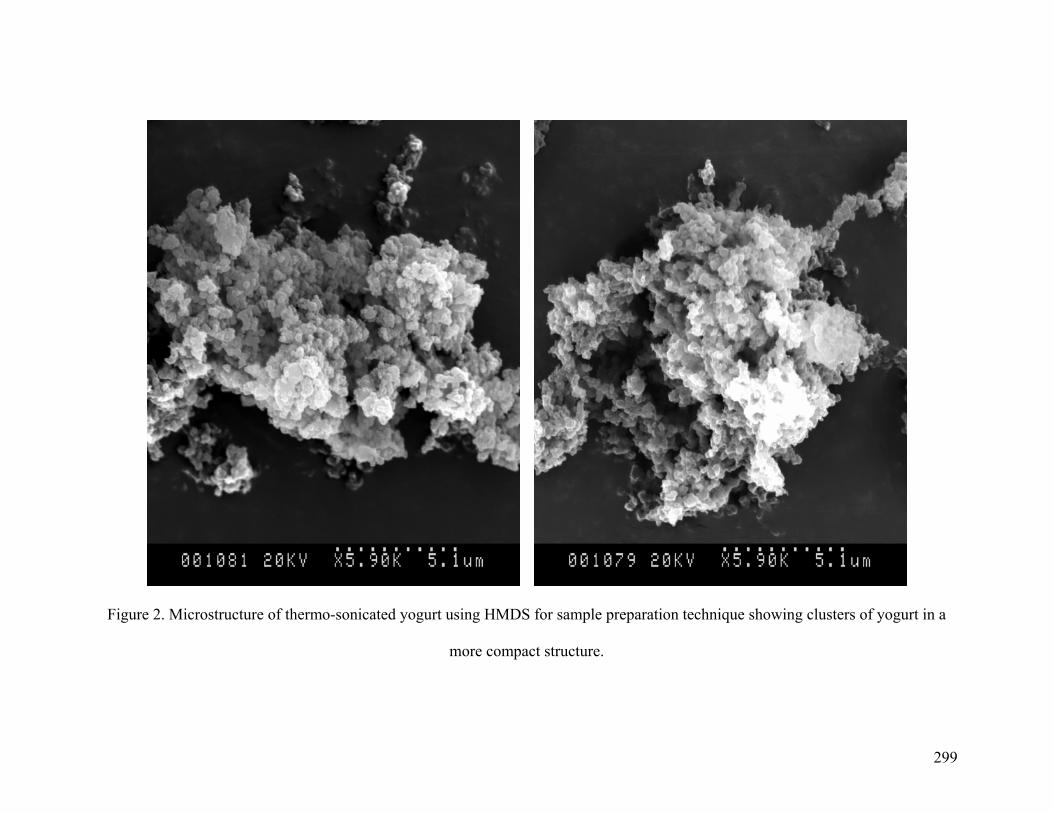
299
Figure 2. Microstructure of thermo-sonicated yogurt using HMDS for sample preparation technique showing clusters of yogurt in a
more compact structure.
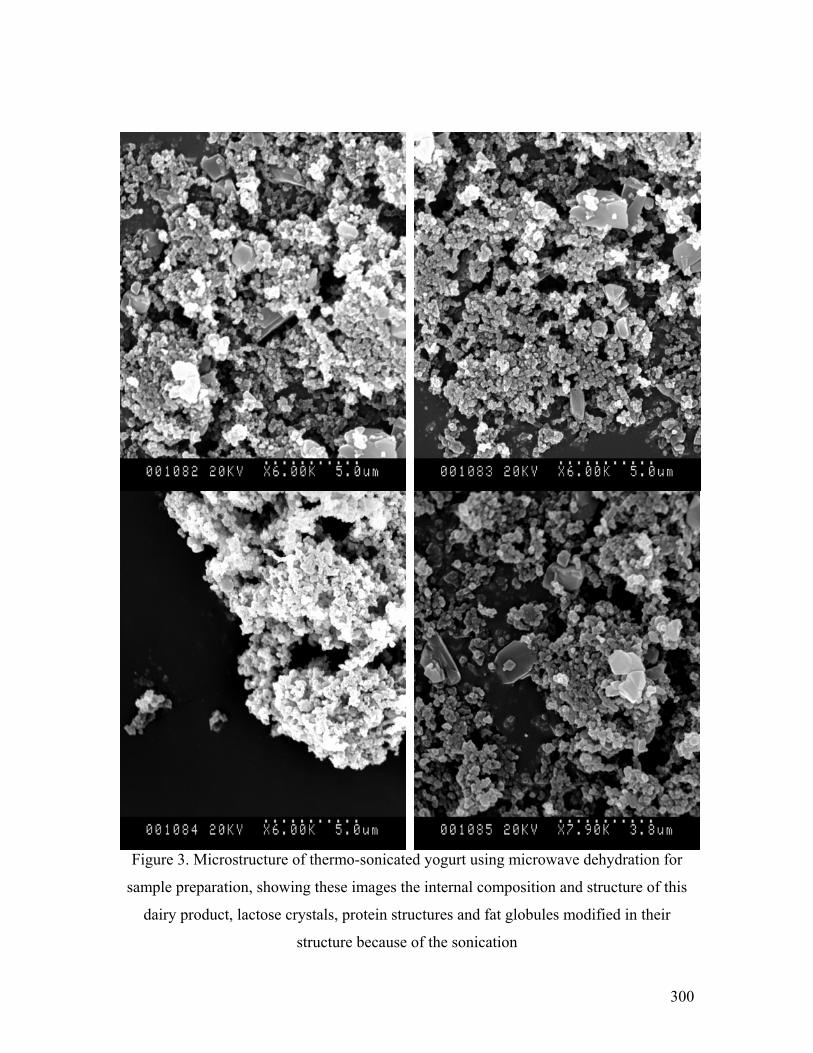
300
Figure 3. Microstructure of thermo-sonicated yogurt using microwave dehydration for
sample preparation, showing these images the internal composition and structure of this
dairy product, lactose crystals, protein structures and fat globules modified in their
structure because of the sonication
301
CHAPTER EIGHT
INACTIVATION OF Bacillus cereus SPORES IN MILK USING PULSED
ELECTRIC FIELDS-ENHANCED THERMAL PASTEURIZATION AND NISIN
AS A NATURAL ANTIMICROBIAL
Daniela Bermúdez-Aguirre, C. Patrick Dunne and
Gustavo V. Barbosa-Cánovas
Abstract
Pulsed electric fields (PEF) is an emerging technology that is able to pasteurize milk;
however, some thermal resistant spores can survive and generate problems during
storage. The objective of this work was to study the inactivation of Bacillus cereus spores
in skim and whole milk under selected PEF treatments with and without refrigeration
cycles. Peak electric fields were 30, 35 and 40 kV/cm, thermal treatments used in
conjunction with PEF were from 40ºC to 65ºC, and the number of pulses was up to 20
pulses without refrigeration and up to 240 pulses with cooling conditions. The use of
nisin in low (10 IU/ml) and high (50 IU/ml) concentrations was tested in combination
with PEF and thermal treatments. Results showed a high resistance of spores to PEF
alone; mild thermal treatments (40ºC) had an antagonist effect in inactivation and 50ºC
enhanced spore death. Skim milk was a better medium than whole milk to inactivate
spores, and stronger thermal treatments (65ºC) achieved a slight increase in spore
reduction. The use of a high concentration of nisin was effective in combination with 40
kV/cm, 144 pulses and 65ºC with almost 3.5 reductions. Indeed, spores showed their

302
resistance to preservation factors alone or in combination regardless of the media of
treatment or the severity of the processing conditions.
303
1. Introduction
Bacillus cereus is a spore-forming, Gram-positive bacteria; its optimum growth
temperature is between 28 – 35ºC, the minimum growth temperature is 4 - 5ºC and the
maximum is 48ºC. The pH that allows its growth is 4.9 to 9.3. Its spores are heat resistant
and the strains of this bacillus from milk are responsible for the production of
diarrheagenic enterotoxin (Batt, 2000; Jay, Loessner and Golden, 2005). Bacillus cereus
is present in some foods such as dairy products like ice cream, milk powders, fermented
milks and pasteurized milks (Røssland et al., 2005), meat species (Penna and Moraes,
2002); cereals (Batt, 2000), and sauces and desserts (Van Opstal et al., 2004). Some
foods that are subjected to drying or heating can contain spores of this microorganism.
This microorganism can grow in low-acid foods after pasteurization during refrigerated
storage because of its characteristics (Van Opstal et al., 2004). Often, the presence of
Bacillus cereus in milk is attributed to raw milk and cross contamination because of a
lack of good cleaning practices in the processing equipment. In addition, this
microorganism can survive thermal processing and promote the so-called “broken cream”
that is related to proteolytic activity in milk (Batt, 2000). This quality defect is also called
sweet curdling (Batt, 2000; Hanson et al., 2005) because of the formation of a non-acid or
sweet curd that has a bitter off-flavor due to the precipitation of the casein (Hanson et al.,
2005). The presence of different species of bacillus is responsible for the reduction of the
shelf-life of milk (Hanson et al., 2005).
Pulsed electric fields (PEF) technology has shown positive results in the
inactivation of pathogenic and deteriorative microorganisms in liquid foods, minimally
reducing the fresh-like characteristics of the product and showing a better quality
304
compared with the thermal treated product (Amiali et al., 2007; Węsierska and Trziszka,
2007), in addition to low energy requirements (Vega-Mercado et al., 1997). A synergistic
effect between PEF and thermal treatment has been reported in microbial inactivation
(Amiali et al., 2007). The mechanism of inactivation of cells using PEF is known as
electroporation, which generates small pores into the cell membranes and organelles
using high intensities, creating an irreversible process and disintegrating some cell
structures (García et al., 2007).
Nisin is a lantibiotic discovered in 1920, a 34 amino acid peptide produced by
Lactococcus lactis subspecies lactis by fermentation of a modified milk medium. Its
antimicrobial activity against Gram-positive bacteria has been shown in several products
(Guinane et al., 2005; Barbosa-Cánovas et al., 1998; Thomas and Delves-Broughton,
2005). The advantages of nisin as a food preservative are that it is not toxic, is produced
naturally, is heat stable, has excellent storage stability, is destroyed by digestive enzymes,
does not contribute to off-flavors, and it has a narrow spectrum of antimicrobial activity
(Jay et al., 1995). It is added to milk, cheese, dairy products, canned food such as
vegetables, mayonnaise and baby foods (Montville et al., 2001), liquid eggs, pasteurized
soups, crumpets, fruit juices, sauces, meat products such as bologna and frankfurter
sausages, beer, wine, fermented beverages, smoked salmon, shellfish, soymilk, fermented
cabbage, sauerkraut, kimchi, cooked potatoes products, pizza. This bacteriocin does not
change the taste of the product when is added (Thomas and Delves-Broughton, 2005).
The objective of this research was to study selected pulsed electric fields
treatments with and without other preservation factors such as thermal treatments and
305
different nisin concentrations in the inactivation of Bacillus cereus spores in skim and
whole milk.
2. Materials and methods
2.1 Milk samples
Pasteurized whole and skim milk were obtained from the Washington State University
Creamery. Milk was characterized in initial microbial loads (mesophilic bacteria and
Bacillus cereus spores) and was kept under refrigerated conditions (4ºC) until used.
2.2. Microbiological analysis
2.2.1. Growth and inoculum of Bacillus cereus spores
Bacillus cereus spores (ATCC 7004) were rehydrated with 5 ml of sterile Nutrient Broth
(Bacto: Becton, Dickinson and Co., Sparks, MD). After 30 min the cell suspension was
inoculated into 100 ml of Nutrient Broth and incubated at 30ºC with continuous agitation
at 225 rpm in an orbital shaker. The spectral absorbance was read each hour at 540 nm
until reach the stationary phase approximately after 9 h. One ml of culture from the early
stationary phase plus one ml of sterile glycerol were stored at -21ºC for not more than 2
months. Milk samples were inoculated with Bacillus cereus spores ATCC 7004 from the
stock suspensions in a ratio to reach 108 and 104 spores/ml depending on the experiment.
2.2.2. Enumeration of mesophilic bacteria and Bacillus cereus spores
Serial dilutions were made in Peptone water (0.1%) with samples taken from unprocessed
milk to evaluate the initial microbial load of mesophiles and quality of milk. After that,
306
samples were pour-plated in Plate Count Agar (Difco, Becton, Dickinson and Co.,
Sparks, MD), dishes were incubated at 35ºC for 48 h, and bacteria were counted. For
Bacillus cereus spores, samples were heated at 80ºC for 30 min to germinate the spores
and kill any vegetative cells. After that, samples were cooled down at 50ºC for 5 min and
pour-plated in Nutrient agar (Difco, Becton, Dickinson and Co., Sparks, MD) Dishes
were incubated at 35ºC for 48 h, and then spores loads were counted.
2.3 Nisin
Nisaplin® was obtained from Danisco USA, Inc. (New Century, KS) with a composition
of nisin of 1000 IU per mg. A standard solution of 1000 IU/ml was prepared by
suspending nisin in sterilized distilled water. Two concentrations were used in milk; the
low concentration sample had 10 IU/ml of nisin and the high concentration sample had
50 IU/ml of nisin, using the allowed limits of this bacteriocin in dairy products (Thomas
and Delves-Broughton, 2005). Nisin solution was added to milk samples immediately
before pouring the samples into the PEF chamber.
2.4 Pulsed electric field treatment
A pilot plant PEF system manufactured by Physics International (San Leandro, CA) and a
cylindrical concentric-electrodes treatment chamber (Qin et al., 1995) was used to apply
the desired treatments to the milk. The continuous treatment chamber had a volume of
25cm3 and a gap between the stainless steel electrodes of 0.6 cm. Frequency was kept
constant at 10 Hz. Flow rate of milk was set up and controlled with a rotary pump
(Masterflex 7654-00, Cole Parmer Instruments Co., Chicago, IL).
307
2.4.1 Experiments without recirculation/refrigeration cycles
Peak electric fields of 30, 35 and 40 kV/cm were used in combination up to 20 pulses of
around 2.5 μs pulse-width. Inlet and outlet temperatures were monitored with digital in-
line thermocouples (Cole-Palmer, Vernon Hills, IL) recording the maximum temperature.
Energy consumption, electric field intensity, pulse width and pulse shape were directly
measured by a digital oscilloscope (Hewlett-Packard 54530A, Colorado Springs, CO)
connected to the treatment chamber through high voltage probes. Three different sets of
experiments were run: the first was without any thermal treatment, using only the heat
generated by the PEF treatment; the second experiment used, in addition to the PEF, a
mild thermal treatment at 40ºC; and the last experiment used a more intense heat
treatment at 50ºC together with the PEF process. These experiments were conducted in a
batch system.
2.4.2 Experiments without recirculation/refrigeration cycles
Electric fields of 30 and 40 kV/cm were used in combination with up to 240 pulses of
around 2.5 μs pulse-width. Inlet and outlet temperatures were monitored with digital in-
line thermocouples (Cole-Palmer, Vernon Hills, IL) and recirculation and refrigeration
systems were used between each set of pulses to cool down the milk. Two groups of
experiments were conducted: the first group consisted of maintaining the temperature at
55ºC and applying PEF at the same time; the second group of experiments kept the
temperature at 65ºC while also using PEF treatment. Energy consumption, electric field
intensity, pulse width and pulse shape were directly measured by a digital oscilloscope
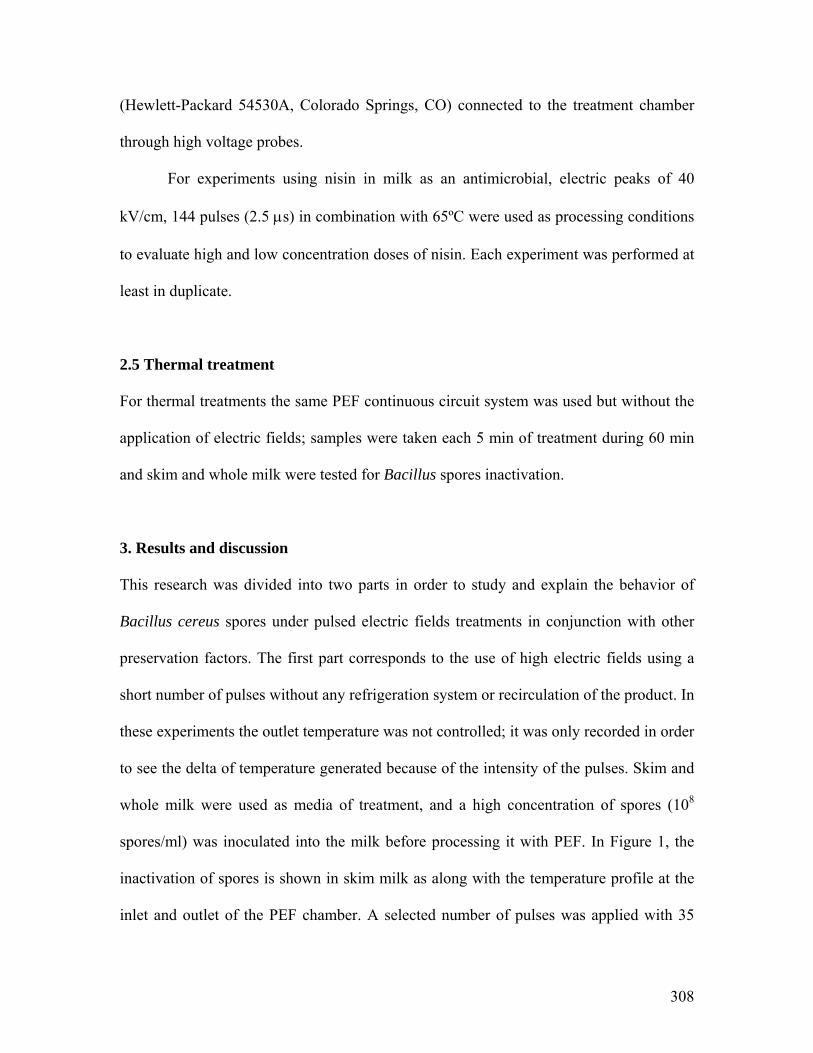
308
(Hewlett-Packard 54530A, Colorado Springs, CO) connected to the treatment chamber
through high voltage probes.
For experiments using nisin in milk as an antimicrobial, electric peaks of 40
kV/cm, 144 pulses (2.5 μs) in combination with 65ºC were used as processing conditions
to evaluate high and low concentration doses of nisin. Each experiment was performed at
least in duplicate.
2.5 Thermal treatment
For thermal treatments the same PEF continuous circuit system was used but without the
application of electric fields; samples were taken each 5 min of treatment during 60 min
and skim and whole milk were tested for Bacillus spores inactivation.
3. Results and discussion
This research was divided into two parts in order to study and explain the behavior of
Bacillus cereus spores under pulsed electric fields treatments in conjunction with other
preservation factors. The first part corresponds to the use of high electric fields using a
short number of pulses without any refrigeration system or recirculation of the product. In
these experiments the outlet temperature was not controlled; it was only recorded in order
to see the delta of temperature generated because of the intensity of the pulses. Skim and
whole milk were used as media of treatment, and a high concentration of spores (108
spores/ml) was inoculated into the milk before processing it with PEF. In Figure 1, the
inactivation of spores is shown in skim milk as along with the temperature profile at the
inlet and outlet of the PEF chamber. A selected number of pulses was applied with 35
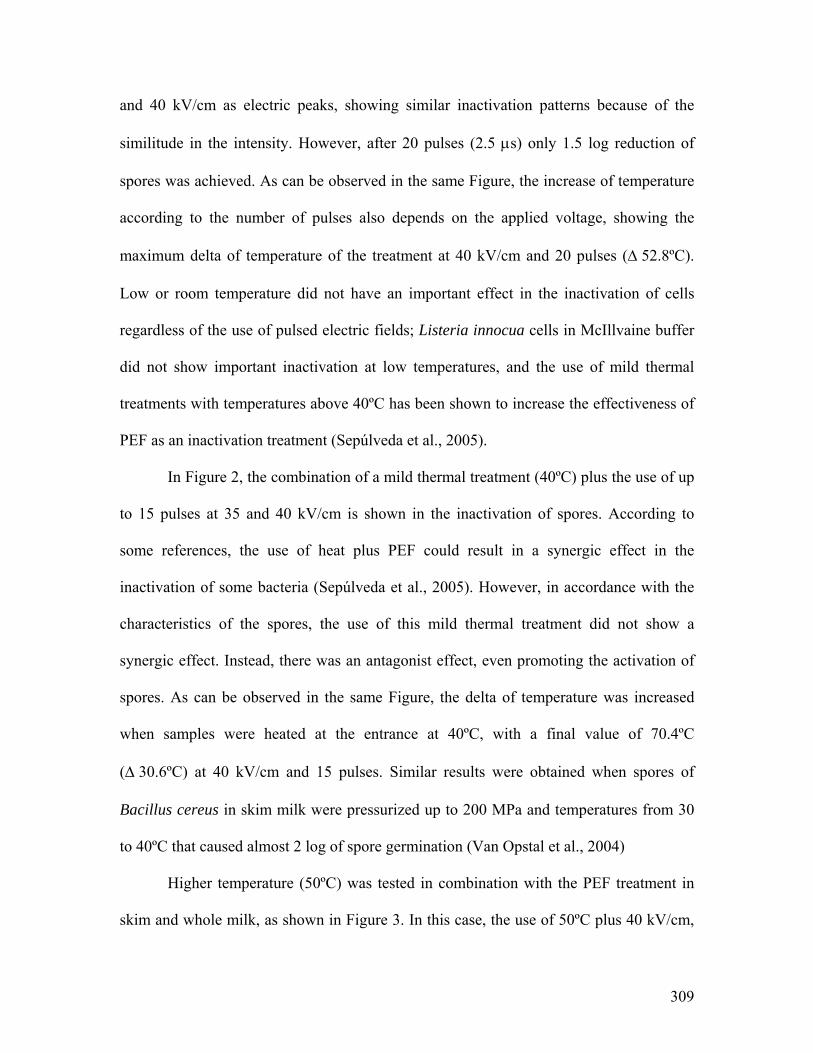
309
and 40 kV/cm as electric peaks, showing similar inactivation patterns because of the
similitude in the intensity. However, after 20 pulses (2.5 μs) only 1.5 log reduction of
spores was achieved. As can be observed in the same Figure, the increase of temperature
according to the number of pulses also depends on the applied voltage, showing the
maximum delta of temperature of the treatment at 40 kV/cm and 20 pulses (Δ 52.8ºC).
Low or room temperature did not have an important effect in the inactivation of cells
regardless of the use of pulsed electric fields; Listeria innocua cells in McIllvaine buffer
did not show important inactivation at low temperatures, and the use of mild thermal
treatments with temperatures above 40ºC has been shown to increase the effectiveness of
PEF as an inactivation treatment (Sepúlveda et al., 2005).
In Figure 2, the combination of a mild thermal treatment (40ºC) plus the use of up
to 15 pulses at 35 and 40 kV/cm is shown in the inactivation of spores. According to
some references, the use of heat plus PEF could result in a synergic effect in the
inactivation of some bacteria (Sepúlveda et al., 2005). However, in accordance with the
characteristics of the spores, the use of this mild thermal treatment did not show a
synergic effect. Instead, there was an antagonist effect, even promoting the activation of
spores. As can be observed in the same Figure, the delta of temperature was increased
when samples were heated at the entrance at 40ºC, with a final value of 70.4ºC
(Δ 30.6ºC) at 40 kV/cm and 15 pulses. Similar results were obtained when spores of
Bacillus cereus in skim milk were pressurized up to 200 MPa and temperatures from 30
to 40ºC that caused almost 2 log of spore germination (Van Opstal et al., 2004)
Higher temperature (50ºC) was tested in combination with the PEF treatment in
skim and whole milk, as shown in Figure 3. In this case, the use of 50ºC plus 40 kV/cm,
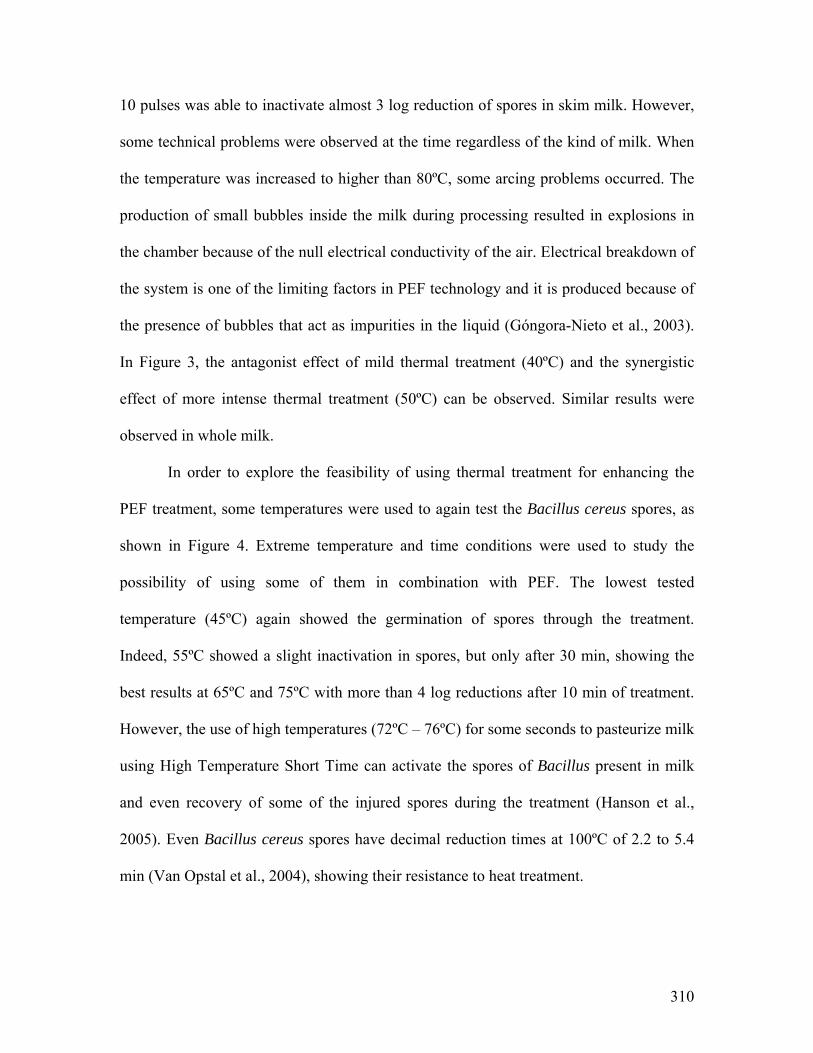
310
10 pulses was able to inactivate almost 3 log reduction of spores in skim milk. However,
some technical problems were observed at the time regardless of the kind of milk. When
the temperature was increased to higher than 80ºC, some arcing problems occurred. The
production of small bubbles inside the milk during processing resulted in explosions in
the chamber because of the null electrical conductivity of the air. Electrical breakdown of
the system is one of the limiting factors in PEF technology and it is produced because of
the presence of bubbles that act as impurities in the liquid (Góngora-Nieto et al., 2003).
In Figure 3, the antagonist effect of mild thermal treatment (40ºC) and the synergistic
effect of more intense thermal treatment (50ºC) can be observed. Similar results were
observed in whole milk.
In order to explore the feasibility of using thermal treatment for enhancing the
PEF treatment, some temperatures were used to again test the Bacillus cereus spores, as
shown in Figure 4. Extreme temperature and time conditions were used to study the
possibility of using some of them in combination with PEF. The lowest tested
temperature (45ºC) again showed the germination of spores through the treatment.
Indeed, 55ºC showed a slight inactivation in spores, but only after 30 min, showing the
best results at 65ºC and 75ºC with more than 4 log reductions after 10 min of treatment.
However, the use of high temperatures (72ºC – 76ºC) for some seconds to pasteurize milk
using High Temperature Short Time can activate the spores of Bacillus present in milk
and even recovery of some of the injured spores during the treatment (Hanson et al.,
2005). Even Bacillus cereus spores have decimal reduction times at 100ºC of 2.2 to 5.4
min (Van Opstal et al., 2004), showing their resistance to heat treatment.
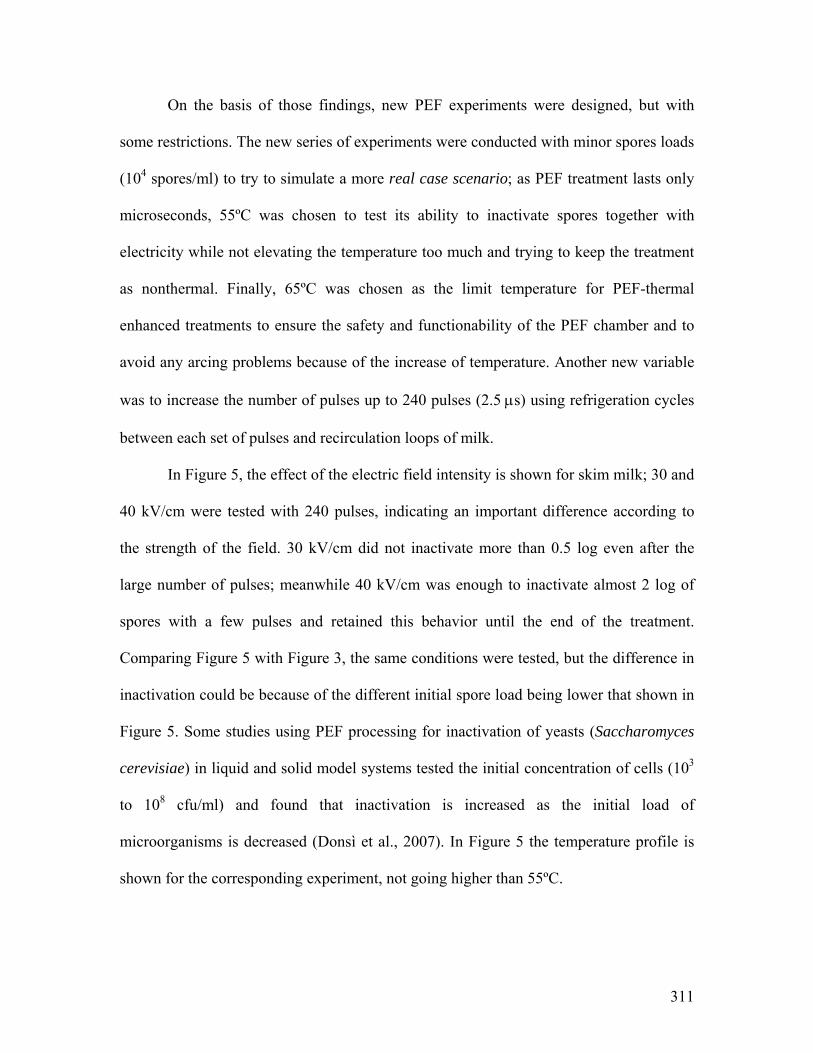
311
On the basis of those findings, new PEF experiments were designed, but with
some restrictions. The new series of experiments were conducted with minor spores loads
(104 spores/ml) to try to simulate a more real case scenario; as PEF treatment lasts only
microseconds, 55ºC was chosen to test its ability to inactivate spores together with
electricity while not elevating the temperature too much and trying to keep the treatment
as nonthermal. Finally, 65ºC was chosen as the limit temperature for PEF-thermal
enhanced treatments to ensure the safety and functionability of the PEF chamber and to
avoid any arcing problems because of the increase of temperature. Another new variable
was to increase the number of pulses up to 240 pulses (2.5 μs) using refrigeration cycles
between each set of pulses and recirculation loops of milk.
In Figure 5, the effect of the electric field intensity is shown for skim milk; 30 and
40 kV/cm were tested with 240 pulses, indicating an important difference according to
the strength of the field. 30 kV/cm did not inactivate more than 0.5 log even after the
large number of pulses; meanwhile 40 kV/cm was enough to inactivate almost 2 log of
spores with a few pulses and retained this behavior until the end of the treatment.
Comparing Figure 5 with Figure 3, the same conditions were tested, but the difference in
inactivation could be because of the different initial spore load being lower that shown in
Figure 5. Some studies using PEF processing for inactivation of yeasts (Saccharomyces
cerevisiae) in liquid and solid model systems tested the initial concentration of cells (103
to 108 cfu/ml) and found that inactivation is increased as the initial load of
microorganisms is decreased (Donsì et al., 2007). In Figure 5 the temperature profile is
shown for the corresponding experiment, not going higher than 55ºC.
312
In Figure 6, the effect of the type of milk is shown for the inactivation of spores.
Skim milk and whole milk were tested as the media of treatment; the highest voltage (40
kV/cm) was used for this comparison and the same number of pulses. As can be observed
in the same Figure, outlet temperature was kept at 55ºC as well. Inactivation occurred
first in skim milk and then in whole milk, probably because of the protective effect of the
fat in milk; however, after 90 pulses inactivation behavior was very similar in both kinds
of milks, raising 2 log reductions. Although some authors mention the protective effect of
fat for bacteria, others affirm that a high content of fat enhances the microbial
inactivation if different frequencies of PEF are used, although at this moment no theory
has been totally validated (Picart et al., 2002).
In Figure 7, the comparison between two kinds of milk and two different
processing conditions (30 and 40 kV/cm and 240 pulses) is shown using a stronger
thermal treatment at 65ºC. 30 kV/cm was not enough to inactivate spores; even in skim
milk sporulation was observed with a small number of pulses. After the treatment was
completed, only 1 log reduction was achieved with this electric strength. 40 kV/cm plus
65ºC was more effective to inactivate spores, as can be observed in the same Figure; after
240 pulses almost 2.5 log reductions were achieved in skim milk, also showing the effect
of the intensity of the electric field. Other reports have also shown this effect in the
inactivation of different microorganisms; as the intensity of the electric field strength
increases, the inactivation is enhanced (Picart et al., 2002; Sepúlveda et al., 2005)
As can be observed, resistance of spores to PEF treatment even with the use of
thermal treatments and a high number of pulses is very difficult to inactivate them.
313
Spores are very resistant regardless the adverse conditions of the process; only in skim
milk do spores seem to be slightly unprotected and favor inactivation.
Finally, the use of the most severe conditions tested in this work was used in
conjunction with nisin added as a natural antimicrobial. 40 kV/cm and 65ºC were tested
in skim and whole milk using two nisin concentrations. The lowest concentration was 10
IU of nisin/ml showing important inactivation in skim milk; almost 3 log reductions were
achieved with a few pulses. Despite the use of the same concentration in whole milk and
application of the same processing conditions, inactivation was limited to only 1.5 log,
probably because of the effect of fat. Some authors mention that the effect of fat in milk
affects the activity of nisin as an antimicrobial; it decreased 33% in skim milk and 50% in
1.29% fat milk (Sobrino-López and Martín-Belloso, 2006) and the effect of heat
treatment in Bacillus cereus was enhanced when nisin was used in milk (Vessoni Penna
and Moraes, 2002). But when high concentrations of nisin (50 IU/ml) were tested under
40 kV/cm, 65ºC and 144 pulses, inactivation was very similar regardless the kind of milk
at the beginning of the treatment, but being favorable at the end for skim milk with
almost 3.5 log reduction of spores. Synergic effects have been reported in other
microorganisms using selected combinations of PEF treatments plus nisin, e.g. Listeria
monocytogenes in liquid whole egg (Calderón-Miranda et al., 1999a) and skim milk
(Calderón-Miranda et al., 1999b); Staphylococcus aureus in skim milk (Sobrino-López
and Martín-Belloso, 2006); and Micrococcus luteus in phosphate buffer (Dutreux et al.,
2000).
314
4. Conclusions
Pulsed electric fields resulted in a favorable inactivation technique for spores of Bacillus
cereus when it was used in combination with temperature (65ºC) and 40 kV/cm as field
strength and concentration of nisin (50 IU/ml) regardless the kind of milk. Despite all the
tested combinations to inactivate spores in this research, the hurdle technology using
three preservation factors such as electricity, temperature and antimicrobials showed a
synergic effect and were useful to achieve a good inactivation level of spores.
References
Amiali, M., Ngadi, M.O., Smith, J.P., and Raghavan, G.S.V. 2007. Synergistic
effect of temperature and pulsed electric field on inactivation of Escherichia coli
O157:H7 and Salmonella enteriditis in liquid egg yolk. Journal of Food Engineering. 79:
689-694.
Barbosa-Cánovas, G.V., Pothakamury, U.R., Palou, E., and Swanson, B.G. 1998.
Nonthermal preservation of foods. Marcel Dekker, Inc. New York.
Batt, C.A. 2000. Bacillus cereus. In “Encyclopedia of Food Microbiology”. R.K.
Robinson, C.A. Batt and P. D. Patel, Eds. Academic Press. California, USA. pp: 119-124.
Calderón-Miranda, M.L., Barbosa-Cánovas, G.V., and Swanson, B.G. 1999a.
Inactivation of Listeria innocua in liquid whole egg by pulsed electric fields and nisin.
International Journal of Food Microbiology. 51:7-17.
315
Calderón-Miranda, M.L., Barbosa-Cánovas, G.V., and Swanson, B.G. 1999b.
Inactivation of Listeria innocua in skim milk by pulsed electric fields and nisin.
International Journal of Food Microbiology. 51:19-30.
Donsì, G., Ferrari, G., and Pataro, G. 2007. Inactivation kinetics of
Saccharomyces cerevisiae by pulsed electric fields in a batch treatment chamber: The
effect of electric field unevenness and initial cell concentration. Journal of Food
Engineering. 78:784-792.
Dutreux, N., Notermans, S., Góngora-Nieto, M.M., Barbosa-Cánovas, G.V., and
Swanson, B.G. 2000. Effects of combined exposure of Micrococcus luteus to nisn and
pulsed electric fields. International Journal of Food Microbiology. 60:147-152.
García, D., Gómez, N., Mañas, P., Raso, J., and Pagán, R. 2007. Pulsed electric
fields cause bacterial envelopes permeabilization depending on the treatment intensity,
the treatment médium pH and the microorganism investigated. International Journal of
Food Microbiology. 113: 219-227.
Góngora-Nieto, M.M., Pedrow, P.D., Swanson, B.G., and Barbosa-Cánovas, G.V.
2003. Impact of air bubbles in a dielectric liquid when subjected to high field strengths.
Innovative Food Science and Emerging Technologies. 4:57-67.
316
Guinane, C.M., Cotter, P.D., Hill, C., and Ross, R.P. 2005. Microbial solutions to
microbial problems; Lactococcal bacteriocins for the control of undesirable biota in food.
Journal of Applied Microbiology. 98: 1316-1325.
Hanson, M.L., Wendorff, W.L., and Houck, K.B. 2005. Effect of Heat Treatment
of Milk on activation of Bacillus spores. Journal of Food Protection. 68 (7): 1484-1486.
Jay, J.M., Loessner, M.J., and Golden, D.A. 2005. Modern Food Microbiology.
7th Ed. Springer. New York, NY. pp: 583-585.
Montville, T.J., Winkowski, K., and Chikindas, M.L. 2001. Biologically Based
Preservation Systems. In “Food Microbiology: Fundamentals and Frontiers”, 2nd Ed.
M.P. Doyle, L. R. Beuchat and T. J. Montville Eds. ASM Press. Washington, D.C. pp:
629-647.
Penna, T.C.V., and Moraes, D.A. 2002. The Influence of Nisin on the Thermal
Resistance of Bacillus cereus. Journal of Food Protection. 65(2): 415-418.
Picart, L., Dumay, E., and Cheftel, J.C. 2002. Inactivation of Listeria innocua in
dairy fluids by pulsed electric fields: Influence of electric parameters and food
composition. Innovative Food Science and Emerging Technologies. 3:357-369.
317
Qin, B.L., Pothakamury, U.R., Vega, H., Martín, O., Barbosa-Cánovas, G.V., and
Swanson, B.G. 1995. Food pasteurization using high-intensity pulsed electric fields.
Food Technology. 49: 55-60.
Røssland, E., Langsrud, T., and Sørhaug, T. 2005. Influence of controlled lactic
fermentation on growth and sporulation of Bacillus cereus in milk. International Journal
of Food Microbiology. 103:69-77.
Sepúlveda, D.R., Góngora-Nieto, M.M., San Martín, M.F. and Barbosa-Cánovas,
G.V. 2005. Influence of treatment temperature on the inactivation of Listeria innocua by
pulsed electric fields. Lebensmittel-Wissenschaft und-Technologie. 38:167-172.
Sobrino-López, A., and Martín-Belloso, O. 2006. Enhancing inactivation of
Staphylococcus aureus in skim milk by combining high-intensity pulsed electric fields
and nisin. Journal of Food Protection. 69(2):345-353.
Thomas, L.V., and Delves-Broughton, J. 2005. Nisin. In “Antimicrobials in
Food”, 3rd Ed. P.M. Davidson, J.N. Sofos and A. L. Branen, Eds. CRC Taylor & Francis.
Boca Ratón, Fl. pp: 237-274.
Van Opstal, I., Bagamboula, C.F., Vanmuysen, S.C.M., Wuytack, E.Y., and
Michiels, C.W. 2004. Inactivation of Bacillus cereus spores in milk by mild pressure and
heat treatments. International Journal of Food Microbiology. 92:227-234
318
Vega-Mercado, H., Martín-Belloso, O., Qin, B., Chang, F.J., Góngora-Nieto,
M.M., Barbosa-Cánovas, G.V., and Swanson, B.G. 1997. Non-thermal food preservation:
Pulsed electric fields. Trends in Food Science and Technology. 8: 151-157.
Vessoni Penna, T.C., and Moraes, D. A. 2002. The influence of nisin on the
thermal resistance of Bacillus cereus. Journal of Food Protection. 65(2):415-418.
Węsierska, E., and Trziska, T. 2007. Evaluation of the use of pulsed electrical
field as a factor with anitimicrobial activity. Journal of Food Engineering. 78: 1320-
1325.
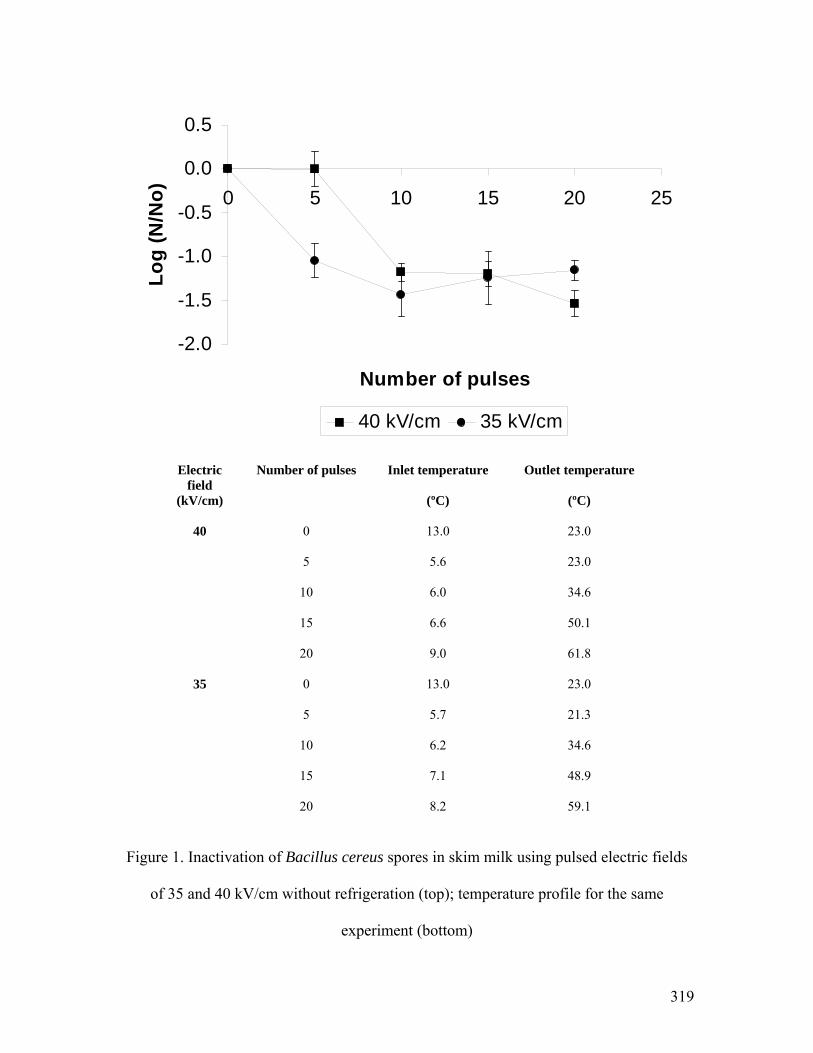
319
-2.0
-1.5
-1.0
-0.5
0.0
0.5
0 5 10 15 20 25
Number of pulses
Log
(N/N
o)
40 kV/cm 35 kV/cm
Electric field
(kV/cm)
Number of pulses Inlet temperature
(ºC)
Outlet temperature
(ºC)
0 13.0 23.0
5 5.6 23.0
10 6.0 34.6
15 6.6 50.1
40
20 9.0 61.8
0 13.0 23.0
5 5.7 21.3
10 6.2 34.6
35
15 7.1 48.9
20 8.2 59.1
Figure 1. Inactivation of Bacillus cereus spores in skim milk using pulsed electric fields
of 35 and 40 kV/cm without refrigeration (top); temperature profile for the same
experiment (bottom)
320
-2
-1.5
-1
-0.5
0
0.5
0 5 10 15
Number of pulses
Log
(N/N
o)
35 kV/cm + 40C 40 kV/cm + 40C
Pulsed electric field
(kV/cm)
Number of pulses Inlet temperature (ºC) Outlet temperature
(ºC)
5 37.4 54.0
10 37.1 65.2
15 37.0 70.0
5 40 57.5
10 40 68.4
35 kV
40 kV
15 39.8 70.4
Figure 2. Inactivation of Bacillus cereus spores in skim milk using pulsed electric fields
of 35 and 40 kV/cm plus 40ºC as mild thermal treatment (top); temperature profile for the
same experiment (bottom)
321
-3.5
-2.5
-1.5
-0.5
0.5
0 5 10 15 20
Number of pulses
Log
N/N
o
35 kV/cm + 40C 35 kV/cm 35 kV/cm + 50C
Electric field
(kV/cm)
Number of pulses Inlet temperature
(ºC)
Outlet temperature
(ºC)
35 0 13.0 23.0
5 5.7 21.3
10 6.2 34.6
15 7.1 48.9
20 8.2 59.1
35 5 37.4 54.0
10 37.1 65.2
15 37.0 70.0
35 5 49.8 68.8
7 49.8 72.8
10 49.3 78.0
Figure 3. Inactivation of Bacillus cereus spores in skim milk using pulsed electric fields
of 35 and 40 kV/cm plus 50ºC as thermal treatment (top); temperature profile for the
same experiment (bottom)

322
-8.0
-6.0
-4.0
-2.0
0.0
2.0
4.0
0 10 20 30 40 50 60
Time (min)
log
(N/N
o)
45C 55C 65C 75C
35
40
45
50
55
60
65
70
75
80
85
0 10 20 30 40 50 60
Time (min)
Tem
pera
ture
(C)
T inlet 45C T outlet 45C T inlet 55C T outlet 55C T inlet 65CT outlet 65C T inlet 75C T outlet 75C
Figure 4. Inactivation of Bacillus cereus spores in skim milk thermal treatments at 45ºC,
55ºC, 65ºC and 75ºC (top); temperature profile for the same experiment (bottom)
323
-2.5
-2
-1.5
-1
-0.5
0
0.5
1
-10 40 90 140 190 240
Number of pulses
Log
(N/N
o)
40 kV/cm SM 30 kV/cm SM
0
10
20
30
40
50
60
0 50 100 150 200
Number of pulses
Tem
pera
ture
(C)
T inlet 40 kV/cm T outlet 40 kV/cm T inlet 30 kV/cmT outlet 30 kV/cm LIMIT
Figure 5. Inactivation of Bacillus cereus spores in skim milk using pulsed electric fields
of 30 and 40 kV/cm plus 55ºC as thermal treatment (top); temperature profile for the
same experiment (bottom)
324
-2.5
-2
-1.5
-1
-0.5
0-10 40 90 140 190 240
Number of pulses
Log
(N/N
o)
40 kV/cm SM 40 kV/cm WM
0
10
20
30
40
50
60
0 50 100 150 200 250
Number of pulses
Tem
pera
ture
(C)
Whole milk Inlet Whole milk Outlet Skim milk InletSkim milk Outlet LIMIT
Figure 6. Inactivation of Bacillus cereus spores in skim and whole milk using pulsed
electric fields of 40 kV/cm plus 55ºC as thermal treatment (top); temperature profile for
the same experiment (bottom)
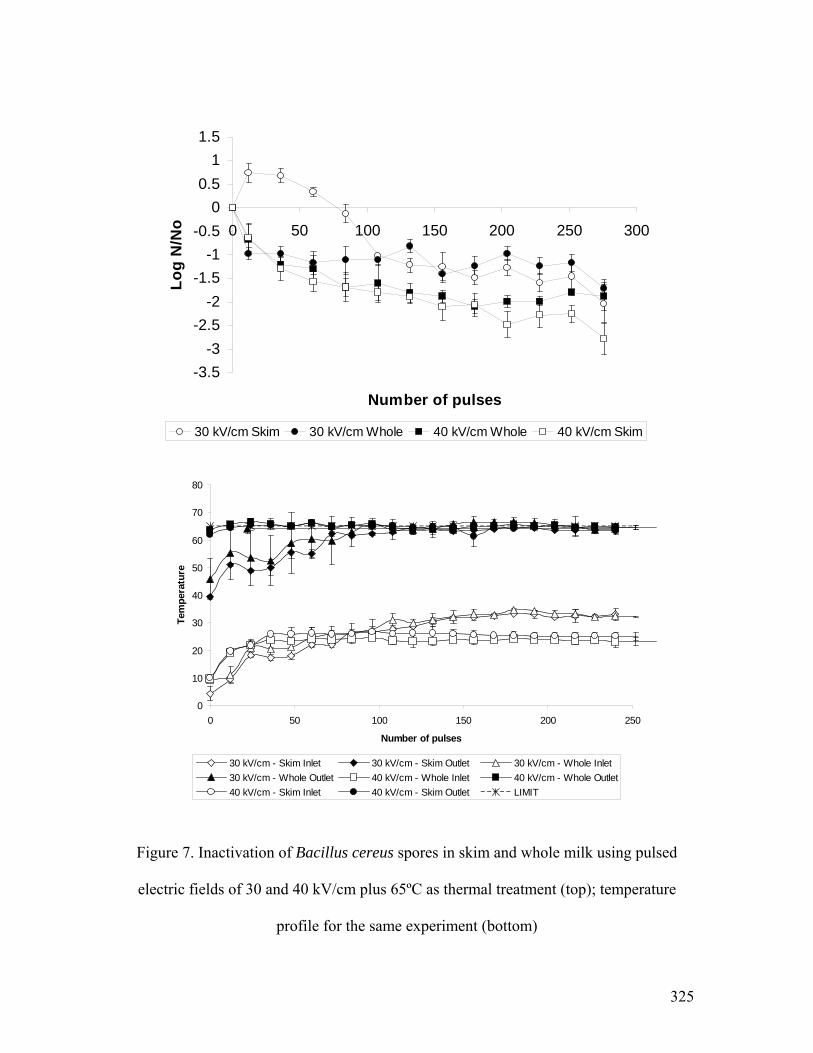
325
-3.5-3
-2.5-2
-1.5-1
-0.50
0.51
1.5
0 50 100 150 200 250 300
Number of pulses
Log
N/N
o
30 kV/cm Skim 30 kV/cm Whole 40 kV/cm Whole 40 kV/cm Skim
0
10
20
30
40
50
60
70
80
0 50 100 150 200 250
Number of pulses
Tem
pera
ture
30 kV/cm - Skim Inlet 30 kV/cm - Skim Outlet 30 kV/cm - Whole Inlet30 kV/cm - Whole Outlet 40 kV/cm - Whole Inlet 40 kV/cm - Whole Outlet40 kV/cm - Skim Inlet 40 kV/cm - Skim Outlet LIMIT
Figure 7. Inactivation of Bacillus cereus spores in skim and whole milk using pulsed
electric fields of 30 and 40 kV/cm plus 65ºC as thermal treatment (top); temperature
profile for the same experiment (bottom)
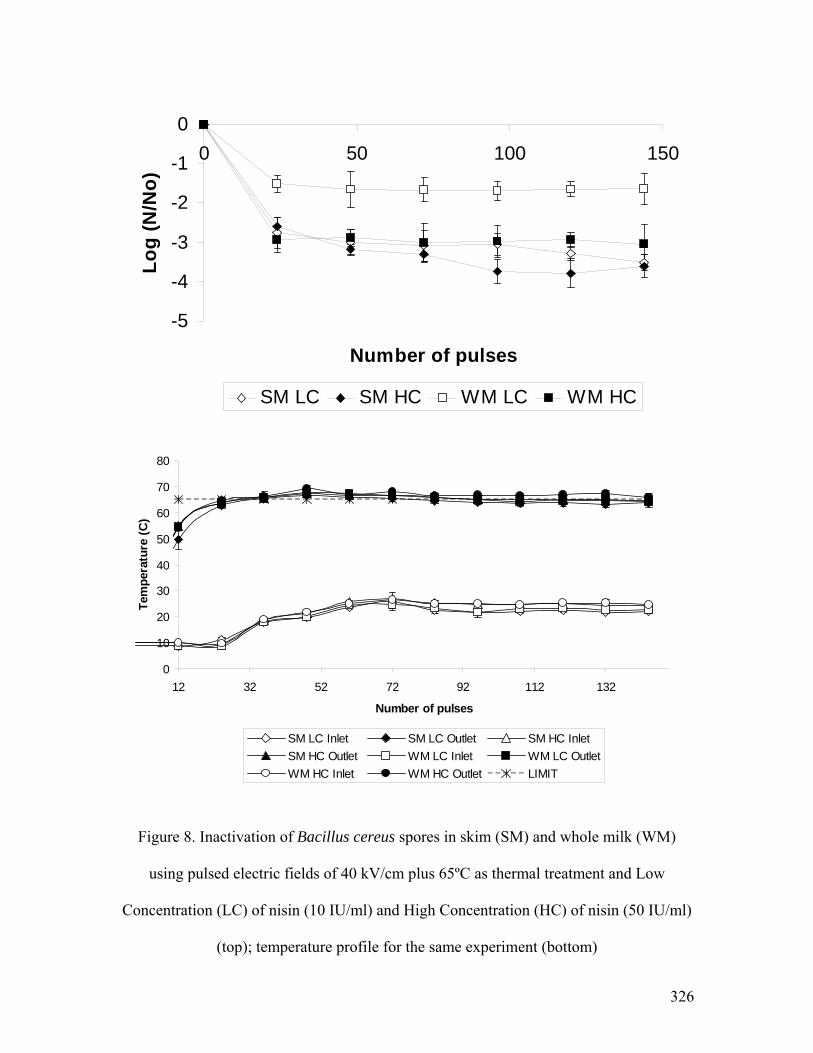
326
-5
-4
-3
-2
-1
00 50 100 150
Number of pulses
Log
(N/N
o)
SM LC SM HC WM LC WM HC
0
10
20
30
40
50
60
70
80
12 32 52 72 92 112 132
Number of pulses
Tem
pera
ture
(C)
SM LC Inlet SM LC Outlet SM HC InletSM HC Outlet WM LC Inlet WM LC OutletWM HC Inlet WM HC Outlet LIMIT
Figure 8. Inactivation of Bacillus cereus spores in skim (SM) and whole milk (WM)
using pulsed electric fields of 40 kV/cm plus 65ºC as thermal treatment and Low
Concentration (LC) of nisin (10 IU/ml) and High Concentration (HC) of nisin (50 IU/ml)
(top); temperature profile for the same experiment (bottom)
327
CHAPTER NINE
ELECTRODEPOSITING OF MILK MATERIALS DURING PULSED
ELECTRIC FIELDS PROCESSING
Daniela Bermúdez-Aguirre, Jaime A. Yáñez, C. Patrick Dunne,
Neal M. Davies, Gustavo V. Barbosa-Cánovas
Abstract
Pulsed electric fields (PEF) treatment of milk has been shown to have positive effects on
the inactivation of pathogenic bacteria and it is considered a viable option for
pasteurization of milk. However, severe conditions are required during processing to
inactivate spores in milk. These processing conditions not only achieve the inactivation
of spores, but can also generate electrodeposition of milk materials as well as erosion of
the PEF chamber electrodes. The objective of this study was to analyze the composition
of milk and the milk layer formed in the electrodes of the chamber during PEF
processing. Tested conditions were those previously required to inactivate spores (40
kV/cm, 50ºC, 240 pulses of 2.5 μs) in raw whole milk. Milk was characterized before and
after processing according to its physicochemical properties, and a proximal analysis was
carried out with a LactiCheckTM analyzer. The Bradford Coomassie blue dye-binding
method was also used to test total protein content. Results showed that after PEF
processing 0.20% of the milk was deposited as a layer inside the electrode and that the
final composition of milk changed significantly. Fat content ranged from 3 (control) to
2.63%; protein content was reduced from 3.26 to 2.85%; density changed from 1029.8 to
328
1025.7 kg/m3; nonfat solids changed from 8.75 to 7.65%; pH ranged from 6.3 to 6.44.
The Bradford Coomassie blue analysis confirmed a decrease in total protein of 1.02%.
These changes in milk are the result of extreme processing conditions that are necessary
to inactivate spores. Therefore, PEF treatment can inactivate pathogens in milk under
milder processing conditions, with minor effects on milk's composition as well as
important energy and cost savings compared to conventional pasteurization, and
avoidance of the electrodeposition of milk materials because of shorter processing times.
Industrial relevance
Pulsed Electric Field processing is currently under use in the industry to pasteurize juice;
this technique also offers important savings in energy, time and money to pasteurize
milk. Nevertheless, some spores can reduce the storage life of milk, and extreme
conditions are required to inactivate them. During the inactivation process of spores, the
severe conditions of the required PEF processing show fouling and erosion of the
electrode. This research deals with the composition of the layer (fouling) of the electrode
and the changes in milk after processing.
329
1. Introduction
Pulsed Electric Fields technology has been used to inactivate target microorganisms such
as Escherichia coli, Listeria innocua, Micrococcus luteus and Staphylococcus aureus in
different media such as skim milk, liquid egg, fruit juices and buffer solutions. In most
cases inactivation with PEF in combination with mild thermal treatments has been
successful in inactivating the microorganisms, as many of the available references show:
Sobrino-López and Martín-Belloso, 2006; Dutreux et al., 2000; Calderón-Miranda et al.,
1999a, b; Sepúlveda et al., 2005; Martín-Belloso et al., 1997; Heinz et al., 2003; Qin et
al., 1998, to name a few. When food is exposed to high-voltage-short pulses through
electrodes into a chamber, pasteurization standards are achieved. The basic components
of the electrical circuit of a PEF system are power supplies, switches, capacitors,
inductors, resistors and treatment chambers containing the electrodes (Góngora-Nieto et
al., 2002). Different inactivation conditions have been tested, including changing the
number of pulses, intensity of the electric field, temperature, treatment medium, using
natural antimicrobials, etc., although the effectiveness of the treatment depends mainly on
the field strength and the number of pulses (Odriozola-Serrano et al., 2006). Electric
fields can be in the range from 2 to 87 kV/cm, showing effectiveness in bacterial
inactivation at 20-50 kV/cm (Góngora-Nieto et al., 2002). However, some studies in
spore and enzyme inactivation report more severe processing conditions than those
mentioned for bacteria. The resistance of spores could be because of the smaller size,
rounder shape and their intrinsic protection against different inactivation factors
(Góngora-Nieto et al., 2002).
330
Chamber electrodes are often made of stainless steel in order to satisfy the
sanitary and chemicals requirements for material that is to be in contact with food
(Góngora-Nieto et al., 2002). Stainless steel electrodes are made of iron (62-69%),
chromium (16-18%), nickel (10-14%) and manganese (2%) (Roodenburg et al., 2005a).
The electric currents can generate electrochemical reactions in the chamber that can
affect food quality, and generate electrode fouling and electrode corrosion. Previous
studies have been conducted with the toxic products formed in food and electrode
corrosion (Morren et al., 2003). Some products, such as milk and eggs, have shown
corrosion or deposit of solids onto the high voltage electrode, probably because of
electrolysis of the product (Góngora-Nieto et al., 2002). The main mechanism of mass
transfer during the use of high voltages is migration (Morren et al., 2003).
Determination of protein in food is commonly tested using the official Kjeldahl
method, but one of the disadvantages of this method is the long time required to process a
sample. However, spectrophotometric methods are easy to perform and are based on
chemical reactions. The Bradford method is useful to determine total proteins because of
the interaction between the dye (Coomassie Blue) and proteins that shows higher
sensitivity for proteins, quantification of protein nitrogen, and easy and fast carry out
(Kamizake et al., 2003).
The aim of this work is to determine the physicochemical and compositional
changes in milk after pulsed electric fields processing, as well as to analyze the
composition of the electrodeposited layer into the chamber electrode when severe
processing conditions are used to inactivate spores in milk.
331
2. Materials and methods
2.1 Samples
Raw cow’s milk was obtained from the Washington State University Creamery. Raw
milk was characterized by the following parameters: pH, acidity, color and proximal
analysis (butter fat, protein, solids non-fat and density). Milk was kept under refrigerated
conditions (4ºC) until used.
2.2 PEF processing
A pilot plant PEF system manufactured by Physics International (San Leandro, CA) and a
cylindrical concentric-electrodes treatment chamber (Qin et al., 1995) was used to apply
the desired treatments to the milk. The continuous treatment chamber had a volume of
25cm3 and a gap between the stainless steel electrodes of 0.6 cm. Frequency was kept
constant at 10 Hz and the flow was 490 ml/min. Flow rate of milk was set up and
controlled with a rotary pump (Masterflex 7654-00, Cole Parmer Instruments Co.,
Chicago, IL). Peak electric field of 40 kV/cm was used in combination with 240 pulses of
around 2.5 μs pulse-width. Inlet and outlet temperatures were monitored with digital in-
line thermocouples (Cole-Palmer, Vernon Hills, IL) maintaining 50ºC as maximum
processing temperature. Energy consumption, electric field intensity, pulse width and
pulse shape were directly measured by a digital oscilloscope (Hewlett-Packard 54530A,
Colorado Springs, CO) connected to the treatment chamber through high voltage probes.
332
2.3 LactiCheckTM milk analyzer
Analysis of butter fat and protein content, solids non-fat and density were carried out
using a LactiCheck™ LC-01 Milk Analyzer (Page & Pedersen, International Ltd.,
Hopkinton, MA). The performance of this equipment is based on high frequency
ultrasound. The milk analyzer was validated to determine butter fat content (Gerber) and
protein (Kjeldahl) in milk, according to Association of Analytical Chemists (A.O.A.C.,
1986) methodology. The equipment was previously calibrated with raw cow’s milk, and
samples were adjusted to room temperature (20ºC). Each sample was analyzed in
triplicate. No prior preparation was required for the PEF processed samples.
2.4 Color
Lightness to darkness (L*) (100 to 0), redness(+) to greenness(-) (a*), and yellowness(+)
to blueness(-) (b*) color parameters were determined using a Minolta CM-2002
spectrophotometer (Minolta Camera Co., Osaka, Japan) in the reflection mode. Twenty
ml of raw and PEF processed milk samples were poured into sterile plastic bags. A white
ceramic plate was used for standardizing the instrument (L* = 93.4, a* = -0.67, b* =
0.78).
The net color difference was evaluated with the following equation, using the
parameters L*, a* and b* and comparing the different treatments with the raw milk from
the beginning to end of storage life:
( ) ( ) ( )2*2*2** baLE Δ+Δ+Δ=Δ
333
Hue angle (h*) was determined using the following relationship:
⎟⎟⎠
⎞⎜⎜⎝
⎛= −
*
*1* tan
abh
and the chroma or saturation index (C*) was evaluated using this equation:
( ) 21
*** 22
baC +=
2.5 pH and titratable acidity
pH was determined by direct immersion of the electrode with a potentiometer (Orion
Research Inc., Boston, MA), and titratable acidity was also determined using a
potentiometer. Ten ml of raw or processed milk was poured into a beaker with 20 ml of
distilled water with constant agitation. Milk was titrated at room temperature with 0.1 N
NaOH solution. The end point was reached when the potentiometer showed 8.3. Acidity
was expressed as a percentage of lactic acid (1 ml of 0.1 N NaOH = 0.009 g of lactic
acid). Each sample was again measured in triplicate.
2.6 Protein Assay
Aliquots of whole milk, milk after PEF treatment and milk residue were collected. The
milk residue was reconstituted in HPLC water and ethyl acetate to account for the
original content of water and fat content (3.2% fat content in whole milk). The Bradford
Coomassie blue dye-binding method (Bradford, 1976), available commercially from Bio-
Rad (Richmond, CA) was used for total protein determination.
334
The Bio-Rad Protein Assay is a dye-binding assay in which a differential color
change of a dye occurs in response to various concentrations of protein. The absorbance
maximum for an acidic solution of Coomassie® Brilliant Blue G-250 dye shifts from 465
nm to 595 nm when binding to protein occurs. The Coomassie blue dye binds to
primarily basic and aromatic amino acid residues, especially arginine.
A bovine serum albumin protein standard (5 g/dL albumin) (Bio-Rad, Richmond,
CA) was used in the protein assay. Standards were diluted with HPLC water to protein
concentrations ranging from 0.05 to 0.4 mg/mL to initially determine the linear working
range of the assay (Figure 1).
To perform the test, 10 μl of each standard and sample solution were aliquoted
into separate microtiter plate wells (samples were run in triplicate). Then, 200 μl of
diluted dye reagent was added to each well. The plate was shaken for 30 s in a plate
orbital shaker. The samples were incubated to at least 5 min and absorbance was read at
595 nm.
2.7 Statistical analysis
The treatment was performed at least in duplicate, and the physicochemical and
composition characteristics were evaluated in triplicate for each sample. Statistical
analysis of the data was performed using a Microsoft Excel program. Analysis of
variance (ANOVA) was calculated with the SAS program (SAS Institute, Cary, NC
1999), and a confidence level α of 0.05 was used to evaluate significant differences.
335
3. Results and discussion
3.1 Physicochemical and composition parameters of milk after PEF processing
Table 1 presents the physicochemical and composition parameters of milk before and
after processing. Regarding pH, raw whole milk showed 6.30 as initial pH; however,
after processing there was an increase in the alkalinity of the medium (6.44) that was
observed also in the lactic acid content of the milk with a decrease of 0.024%. These
results indicate that during PEF processing some alkali products are probably generated
in milk because of the interaction between the food and the electricity. The main changes
to food quality induced by the interaction with electric current discharge into the
electrode are in the chemical structure of liquids, which are mainly generated close to the
electrode surface. Production of some products such as free oxygen, hydrogen, hydroxyl,
hydroperoxyl radicals (Reyns et al., 2004), hydrogen peroxide (H2O2) and small particles
of electrode material are found in the food, although the main products are produced
because of the electrolysis of water molecules (Morren et al., 2003) and other food
components in the interface electrode-food (Saulis et al., 2007). pH and lactic acid
content of milk were significantly different (p < 0.05) before and after the PEF
processing.
Other physicochemical properties that were studied in milk after processing were
the density and solids non-fat content. Density remained almost unchanged, as can be
observed in Table 1; whereas the solids non-fat content decreased from the raw milk to
1.1% in the PEF milk. Significant differences (p<0.05) were found between raw milk and
PEF treated milks in both physicochemical properties. This decrease in solids non-fat can
be attributed to the electrodeposition of milk materials into the electrode that was forming
336
a rubber layer. The solids non-fat are usually called serum solids (Potter, 1986) and
include casein, lactalbumin, lactose, calcium, phosphorus and riboflavin, among others
(IDFA, 2006).
Composition parameters are presented in Table 1. Important changes were
reported in fat and protein content of milk after PEF processing. Fat was decreased from
3% to 2.63% and protein from 3.26% to 2.85%. These changes can be attributed to the
electrode fouling during the processing of milk that showed a layer, as observed in Figure
2. In accordance with the composition analysis, the fouling of the electrode that is shown
in Figure 2a would contain protein, fat and solids non-fat. However, other compounds
can be produced during the treatment because of the electrolysis of water, and more when
milk is used because of the high moisture content of this product.
In Figure 2b the erosion of the electrode is shown by the discoloration on its
surface; also, at the end of the treatment some dark solids were observed as precipitated
in milk that are probably metal components of the electrode. Some studies have shown
that the presence of metal particles from electrode material (stainless steel) is increased as
the voltage increases, and as the frequency decreases. At 150 V peak-peak and 10 Hz, the
concentrations of metal in demineralized water with NaCl (conductivity of 385 mS/m)
was Cr 200 μg/l, Fe 940 μg/l, Mn 50 μg/l and Ni 270 μg/l after 2 h of treatment.
Electrode corrosion can be avoided by using short pulses (Morren et al., 2003), and also
by polishing the electrodes because the surface composition (Cr2O3) is more chemical
resistant than Fe2O3, releasing less dissolved iron (Roodenburg et al., 2005a).
Experiments performed in orange juice and electric field of 30 kV/cm and 6.7 pulses at
room temperature showed that the presence of metal particles is below the European
337
limits established for this product, even the high pH could enhance the electrode
corrosion (Roodenburg et al., 2005b). Initial fat and protein content were also
significantly different (p < 0.05) from those reported after PEF processing, as shown in
Table 1.
Regarding color changes in milk, there was a slight decrease in the luminosity
(L*) after processing (Table 2), exhibiting a net color change of 1.12 between the
unprocessed and PEF milks. The quality color indicator, h* shows the point in the color
space according to angle: reddish 0º, yellowish 90º, greenish 180º and bluish 270º; for
raw milk the color was closer to the yellowish region (75.01º), while the PEF milk moved
its hue to the reddish region (71.23º); this change could be attributed to the loss of
riboflavin after processing that produces a yellow color in some products. Finally, the
chroma or saturation index that indicates the degree of saturation, purity or intensity of
color showed a decrease of this value for the PEF processed milk, moving this value to
the neutral gray point (0), probably because of the presence of some metal particles in the
product.
3.2 Protein analysis
In order to test the composition of the layer formed in the electrode after processing, a
second protein analysis was carried out. The total weight of this layer was 2.08 g after
processing one liter of raw whole milk. The Bradford Coomassie method was used to
determine the total protein content. The average protein content in raw milk was 2.35%,
whereas in PEF milk the average protein content was 2.25% (Figure 3). Protein found in
the layer of the fouling electrode was 0.023%, meaning that the protein content in the
338
PEF liquid milk plus the layer was 2.27%. These values are quite different from those
reported in Table 1, in which raw milk had 3.26% and PEF milk had 2.85% of protein
content. The reasons for these differences (significantly p < 0.05) are probably because of
the method of protein determination. The Bradford Coomassie method is useful to
determine total proteins; however, the dye does not react with small peptides or amino
acids (Kamizake et al., 2003). So, if PEF is denaturizing some proteins in peptides and
amino acids, as the value obtained with LactiCheckTM analyzer show in Table 1, these
residues are not going to be quantified with the Bradford Coomassie method. However,
the total protein content in the milk residue (layer) is 1.02% of the total protein content in
milk. Nevertheless, other components such as fat and solids non-fat could be found in the
layer because of the variations in the compositional analysis of milk after processing. The
formation of the deposits layer in the electrode, so-called fouling, could be because of the
electrophoretic concentration of charged molecules in one the outer layers of food that
has direct contact with the electrode (Morren et al., 2003; Kershner et al., 2004). Based
on this fact, a large proportion of the layer could be formed of solids non-fat because
most of them are charged molecules that can interact with the electrode.
The deposits into the electrode can affect the process because the layer can reduce
the intensity of the electric field into the chamber and transport some particles from the
electrode material to the food (Góngora-Nieto et al., 2002). But the electrode fouling can
also produce arcing problems or electrical breakdown in the chamber during the
processing of food (Morren et al., 2003) with the generation of sparks and undesirable
effects in the food and chamber components (Saulis et al., 2007). Some of the
recommended materials for chamber electrodes are gold, platinum and metal oxides
339
(iridium and ruthenium), as well as the use of some high conductive polymer coatings
(Góngora-Nieto et al., 2002). Titanium and glassy carbon are other material options for
building electrodes that are more resistant to corrosion (Roodenburg et al., 2005b). Some
processing variables that would help to reduce the electrodeposition of materials into the
electrode are the use of bipolar pulses, instant reverse pulses, low energy pulses, increase
of flow rate, reduction of build-up area (Góngora-Nieto et al., 2002), and removal of the
charge after each pulse (Morren et al., 2003).
4. Conclusions
Indeed, significant changes in all tested milk parameters were observed after PEF
processing; however, the tested conditions were extreme conditions to inactivate spores
and do not represent the regular conditions for pasteurizing milk using pulsed electric
fields technology. Regular conditions to process milk require a shorter number of pulses
(less than 20) without temperature increase, maintaining the effectiveness of PEF
processing such as alternatives to save energy, time and money.
References
A.O.A.C. 1986. Official Methods of Analysis. Association of Official Analytical
Chemists. USA.
Bradford, M. M. 1976. A rapid and sensitive method for the quantitation of
microgram quantities of protein utilizing the principle of protein-dye binding. Analytical
Biochemistry. 72, 248-254.
340
Dutreux N., Notermans S., Góngora-Nieto M.M., Barbosa-Cánovas G.V. and
Swanson B.G. 2000. Effects of combined exposure of Micrococcus luteus to nisin and
pulsed electric fields. International Journal of Food Microbiology. 60:147-152.
Calderón-Miranda, M.L., Barbosa-Cánovas, G.V., and Swanson, B.G. 1999a.
Inactivation of Listeria innocua in liquid whole egg by pulsed electric fields and nisin.
International Journal of Food Microbiology. 51: 7-17.
Calderón-Miranda, M.L., Barbosa-Cánovas, G.V., and Swanson, B.G. 1999b.
Inactivation of Listeria innocua in skim milk by pulsed electric fields and nisin.
International Journal of Food Microbiology. 51: 19-30.
Góngora-Nieto, M.M., Sepúlveda, D.R., Pedrow, P., Barbosa-Cánovas G.V., and
Swanson, B.G. 2002. Food processing by pulsed electric fields: Treatment delivery,
inactivation level, and regulatory aspects. Lebensmittel-Wissenschaft und-Technologie,
35: 375-388.
Heinz, V., Toepfl, S., and Knorr, D. 2003. Impact of temperature on lethality and
energy efficiency of apple juice pasteurization by pulsed electric fields treatment.
Innovative Food Science and Emerging Technologies. 4: 167-175.
IDFA. (2006). International Dairy Foods Association.
http://www.idfa.org/facts/milk/pasteur.cfm
341
Kamizake, N.K.K., Gonçalves, M.M., Zaia, C.T.B.V. and Zaia, D.A.M. 2003.
Determination of total proteins in cow milk powder samples: A comparative study
between Kjeldahl method and spectrophotometric methods. Journal of Food Composition
and Analysis. 16: 507-516.
Kershner, R.J., Bullard, J.W., and Cima, M.J. 2004. The role of electrochemical
reactions during electrophoretic particle deposition. Journal of Colloid and Interface
Science. 278:146-154.
Martín-Belloso, O., Vega-Mercado, H., Qin, B.L., Chang, F.J., Barbosa-Cánovas,
G.V., and Swanson, B.G. 1997. Inactivation of Escherichia coli suspended in liquid egg
using pulsed electric fields. Journal of Food Processing and Preservation. 21: 193-208.
Morren, J., Roodenburg, B., and de Haan, S.W.H. 2003. Electrochemical
reactions and electrode corrosion in pulsed electric field (PEF) treatment chambers.
Innovative Food Science and Emerging Technologies. 4: 285-295.
Odriozola-Serrano, I., Bendicho-Porta, S., and Martín-Belloso, O. 2006.
Comparative study on shelf-life of whole milk processed by high-intensity pulsed electric
field or heat treatment. Journal of Dairy Science. 89: 905-911.
Potter, N.N. 1986. Food Science. 4th Ed. (pp. 348-350). New York: Van Nostrand
Reinhold.
342
Qin, B.L., Barbosa-Cánovas, G.V., Swanson, B.G., Pedrow P.D., and Olsen, R.G.
1998. Inactivating microorganisms using a pulsed electric field continuous treatment
system. IEEE Transactions on Industry Applications 34(1):43-50.
Qin, B.L., Pothakamury, U.R., Vega, H., Martín, O., Barbosa-Cánovas, G.V., and
Swanson, B.G. 1995. Food pasteurization using high-intensity pulsed electric fields.
Food Technology. 49: 55-60.
Reyns, K.M.F.A., Diels, A.M.J., and Michiels, C.W. 2004. Generation of
bactericidal and mutagenic components by pulsed electric field treatment. International
Journal of Food Microbiology. 93:165-173.
Roodenburg, B., Morren, J., Berg, H.E., and de Haan, S.W.H. 2005a. Metal
release in a stainless steel pulsed electric field (PEF) system. Part I. Effect of different
pulse shapes; theory and experimental method. Innovative Food Science and Emerging
Technologies. 6: 327-336.
Roodenburg, B., Morren, J., Berg, H.E., and de Haan, S.W.H. 2005b. Metal
release in a stainless steel pulsed electric field (PEF) system. Part II. The treatment of
orange juice; related to legislation and treatment chamber lifetime. Innovative Food
Science and Emerging Technologies. 6: 337-345.
343
Saulis, G., Rodaitė-Riševičienė, R., and Snitka, V. 2007. Increase of the
roughness of the stainless-steel anode surface due to the exposure to high-voltage electric
pulses as reveled by atomic force microscopy. Biochemistry. 70:519-523.
Sepúlveda, D.R., Góngora-Nieto, M.M., Guerrero J.A., and Barbosa-Cánovas,
G.V. 2005. Production of extended-shelf life milk by processing pasteurized milk with
pulsed electric fields. Journal of Food Engineering. 67: 81-86.
Sobrino-López, A., and Martín-Belloso, O. 2006. Enhancing inactivation of
Staphylococcus aureus in skim milk by combining high-intensity pulsed electric fields
and nisin. Journal of Food Protection. 69(2): 345-353.
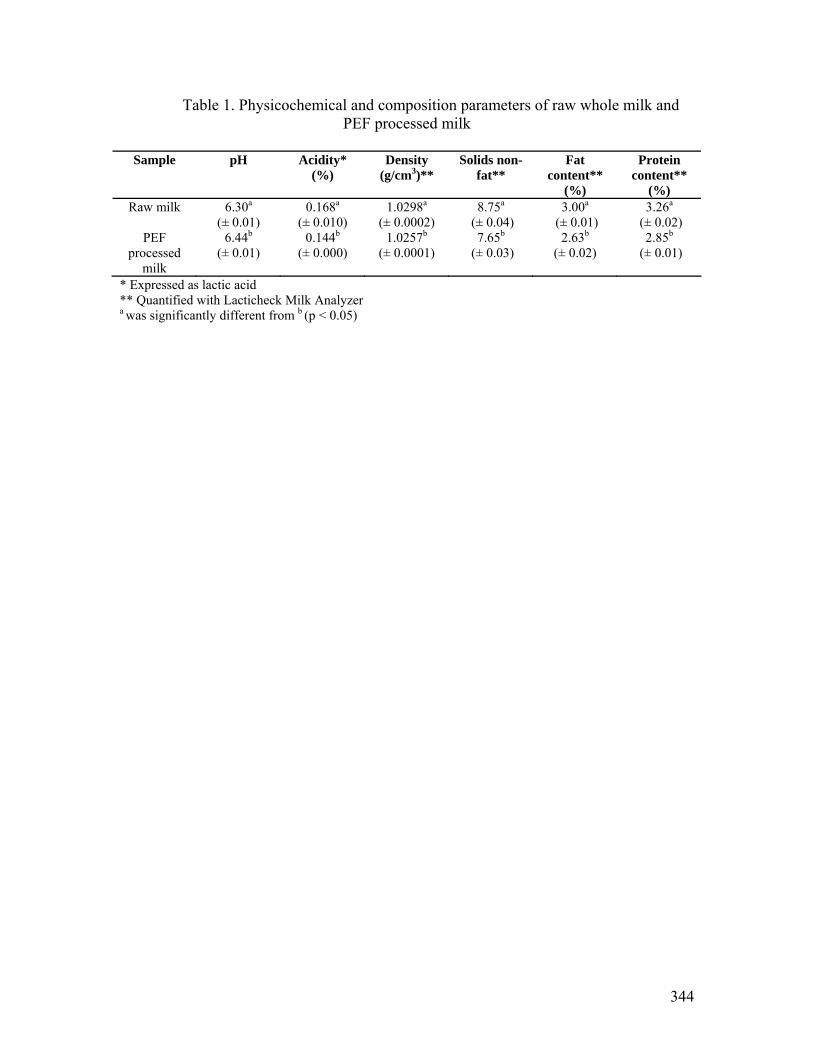
344
Table 1. Physicochemical and composition parameters of raw whole milk and PEF processed milk
Sample pH Acidity*
(%) Density
(g/cm3)** Solids non-
fat** Fat
content** (%)
Protein content**
(%) Raw milk 6.30a
(± 0.01) 0.168a
(± 0.010) 1.0298a
(± 0.0002) 8.75a
(± 0.04) 3.00a
(± 0.01) 3.26a
(± 0.02) PEF
processed milk
6.44b
(± 0.01) 0.144b
(± 0.000) 1.0257b
(± 0.0001) 7.65b
(± 0.03) 2.63b
(± 0.02) 2.85b
(± 0.01)
* Expressed as lactic acid ** Quantified with Lacticheck Milk Analyzer a was significantly different from b (p < 0.05)
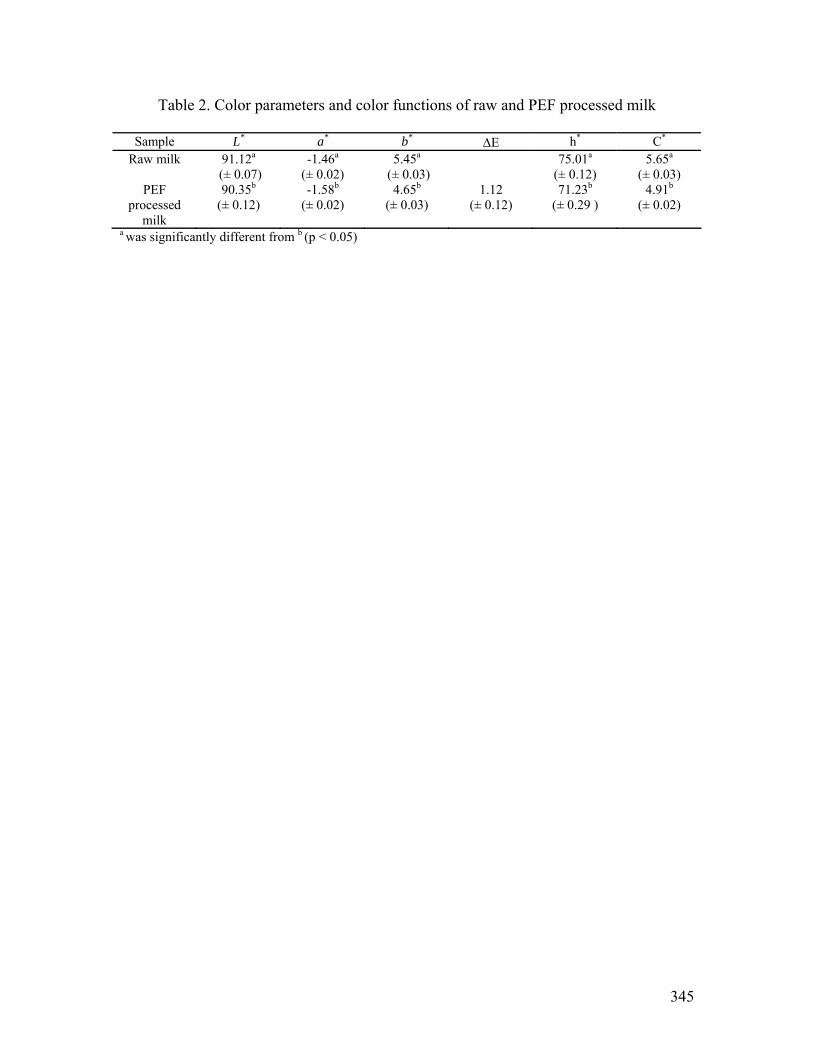
345
Table 2. Color parameters and color functions of raw and PEF processed milk
Sample L* a* b* ΔE h* C*
Raw milk 91.12a
(± 0.07) -1.46a
(± 0.02) 5.45a
(± 0.03) 75.01a
(± 0.12) 5.65a
(± 0.03) PEF
processed milk
90.35b (± 0.12)
-1.58b
(± 0.02) 4.65b
(± 0.03) 1.12
(± 0.12) 71.23b
(± 0.29 ) 4.91b
(± 0.02)
a was significantly different from b (p < 0.05)
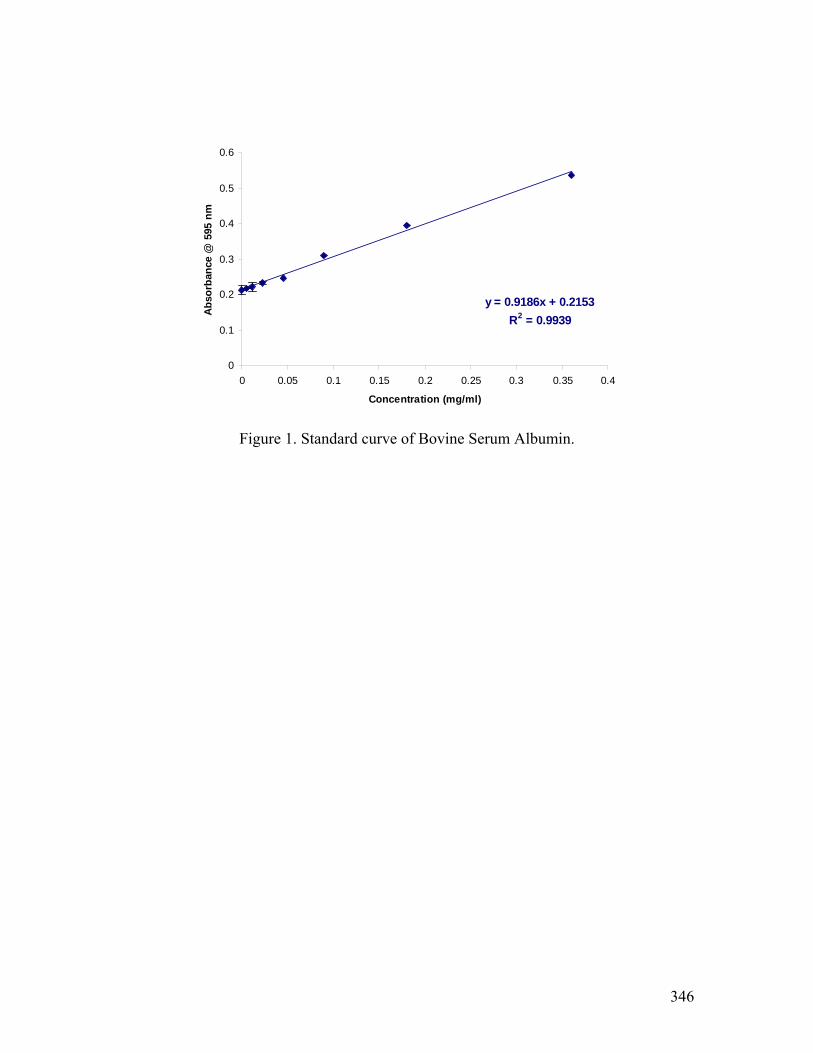
346
y = 0.9186x + 0.2153R2 = 0.9939
0
0.1
0.2
0.3
0.4
0.5
0.6
0 0.05 0.1 0.15 0.2 0.25 0.3 0.35 0.4
Concentration (mg/ml)
Abso
rban
ce @
595
nm
Figure 1. Standard curve of Bovine Serum Albumin.
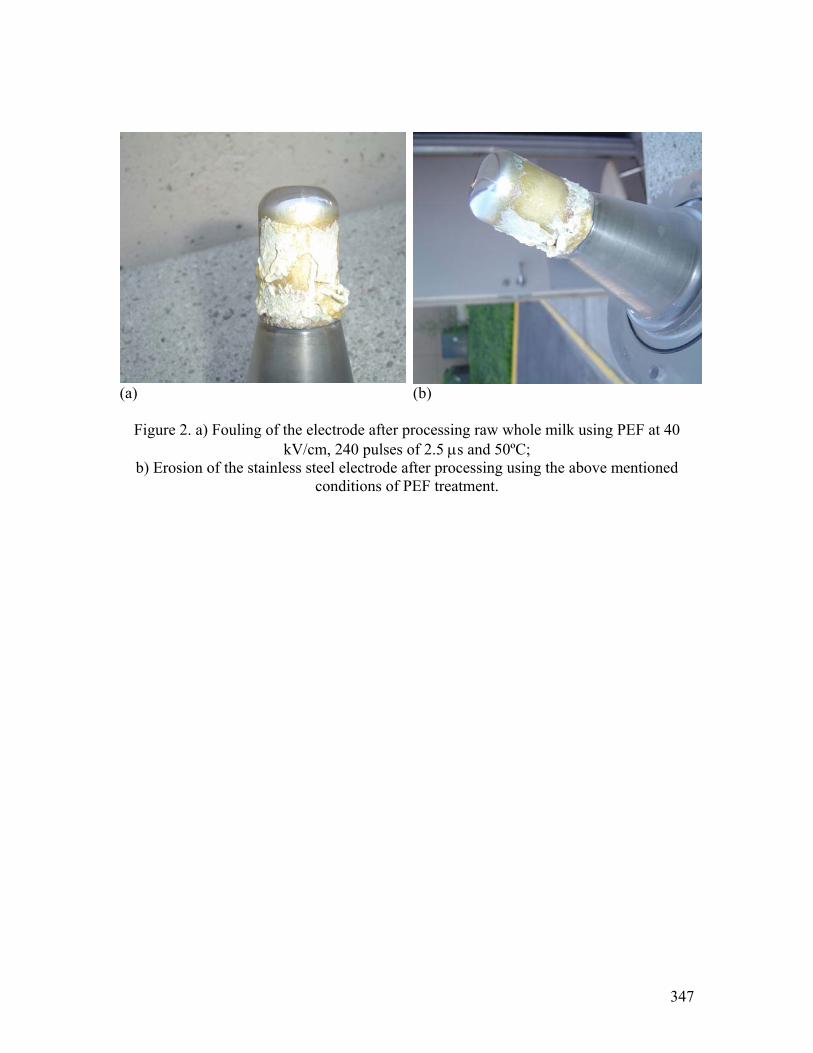
347
(a) (b)
Figure 2. a) Fouling of the electrode after processing raw whole milk using PEF at 40 kV/cm, 240 pulses of 2.5 μs and 50ºC;
b) Erosion of the stainless steel electrode after processing using the above mentioned conditions of PEF treatment.
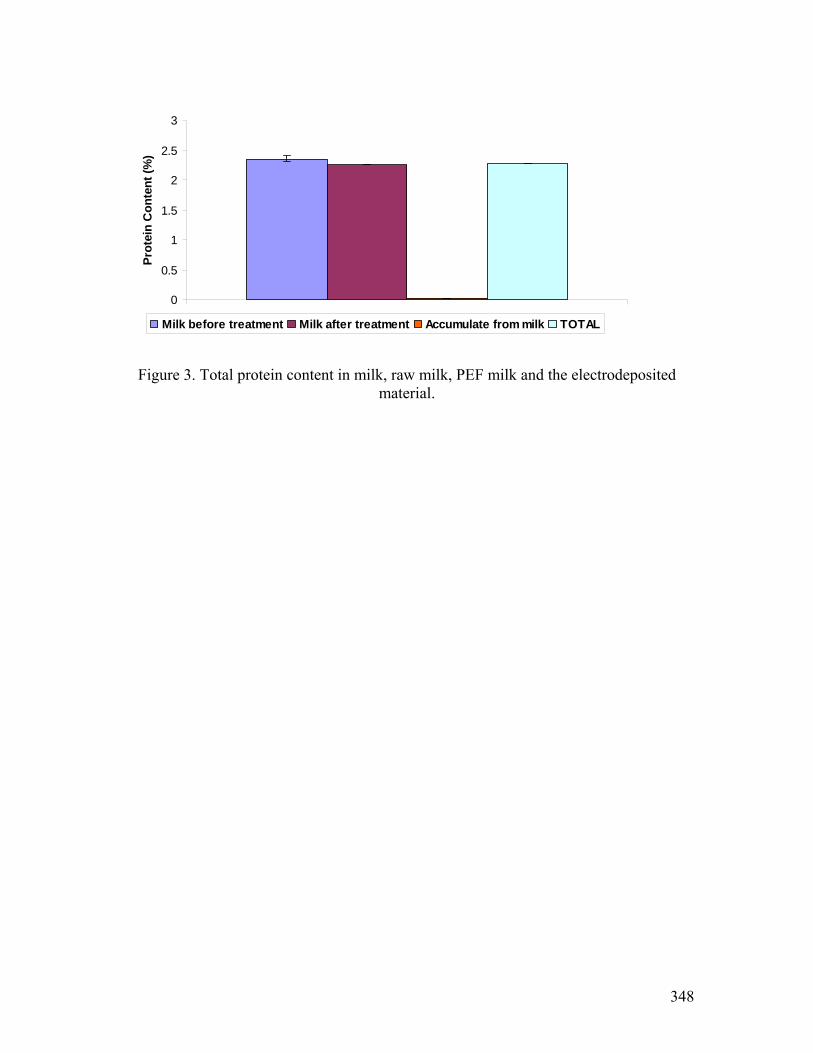
348
0
0.5
1
1.5
2
2.5
3
1
Prot
ein
Con
tent
(%)
Milk before treatment Milk after treatment Accumulate from milk TOTAL
Figure 3. Total protein content in milk, raw milk, PEF milk and the electrodeposited
material.
349
CHAPTER TEN
DETERMINATION OF ALLURA RED (RED # 40) BY REVERSE-PHASE HIGH-
PERFORMANCE LIQUID CHROMATOGRAPHY (RP-HPLC) AND
PHYSICOCHEMICAL CHANGES IN STRAWBERRY FLAVORED MILK
UNDER PULSED ELECTRIC FIELD PROCESSING
Daniela Bermúdez-Aguirre, Jaime A. Yáñez, C. Patrick Dunne,
Neal M. Davies and Gustavo V. Barbosa-Cánovas
Abstract
Few studies have been conducted on flavored milk using pulsed electric fields (PEF).
Despite the positive results this emerging technology has shown in milk pasteurization,
its use in processing other dairy products has not been reported. One of the main concerns
in using PEF is the stability of the product during storage, mainly those with additives.
The objective of this study was to analyze the degradation of Allura Red, the coloring
agent in strawberry milk, under PEF and during storage. Four systems were tested: two
commercial strawberry flavored milks and two model systems prepared with milk,
sucrose, and selected concentrations of Allura Red. Processing conditions were 40
kV/cm, 48 pulses (2.5 μs), and 55ºC. Allura Red extraction was performed using
acetonitrile. The samples were analyzed via RP-HPLC utilizing a Phenomenex Luna C18
analytical column with a mobile phase of sodium acetate and acetonitrile. Separation of
Allura Red was carried out at 25ºC and UV detection at 520 nm. After PEF processing of
350
the milk, only minor changes were observed in color, concentration of Allura Red, and
pH. Commercial samples (with or without PEF) maintained a pH above 6, but model
systems dropped below this pH value after 10 days of storage (4ºC). Color changed in the
PEF samples during storage, showing an important decrease in a*. Hue angle and chroma
also changed during storage. The HPLC analysis reported a bi-phasic effect in Allura Red
concentrations versus time. It was observed that Allura Red concentrations increased
until reaching a maximum concentration during the middle of storage life followed by a
significant decrease and degradation in the samples. These changes can be attributed to
microbial growth, reduction of pH, or changes in protein content. However, PEF
processing was observed to not have a significant effect in Allura Red concentrations
compared to the control samples.
351
1. Introduction
There are different commercially available flavored milks such as chocolate, vanilla,
banana, orange and strawberry. Chocolate milk is the most popular flavored milk in
children (90% of them like its taste), providing high content of protein, vitamins, calcium
and other nutrients. After this, strawberry flavored milk has a great acceptability with the
consumer (Miller et al., 2007). Milk is not only important in the growth of children, in
other life circumstances this beverage is one of the main sources of protein. For example
in the combat rations for soldiers, milk is an important component of the different menus.
Combat rations must accomplish provision of a quality life to the soldiers but at the same
time cover all their nutritional needs. At the R&D department of the Natick Soldier
Center, every day food researchers are looking for better products in order to change and
improve the menus each year. Some of the current milk-based beverages for military
rations are dairy shakes (chocolate, vanilla, strawberry and soon a banana shake will be
included in the 2008 menu) (NSRDEC, 2007). However, the shelf-life sometimes is
limited because of the processing conditions and shipping and storage environment. For
soldiers’ feeding purposes, the product must have a storage life as long as possible under
the most adverse conditions, but at the same time having acceptable organoleptic
characteristics such as flavor, taste, color and appearance. Conventional food processing
operations (i.e. drying, pasteurization, blanching, canning, etc.) have the inconvenience
of decreasing the overall food quality, destroying some vitamins and pigments,
denaturalization of some proteins or volatizing odors, all of which can affect the final
quality of the product. Nevertheless, these unit operations must be carried on in food in
order to inactivate pathogenic microorganisms, reduce the load of deteriorative
352
microorganisms and the enzymatic activity and extending the shelf-life of the product.
Emerging technologies such as high hydrostatic pressure, pulsed electric fields,
ultrasound or ultraviolet are being tested in foods in order to ensure a microbiologically
safe product but with fresh-like characteristics. Pulsed electric fields have shown positive
effects in the extension of the shelf-life of milk, retarding the growth of mesophilic
bacteria up to 80 days and with minor effects in quality (Sepúlveda et al., 2005).
Color in food is an important quality parameter that may determine acceptability
or rejection by the consumer. Color is important in flavor and taste recognition and
identification as well as in food preference (Gifford and Clydesdale, 1986). Children
often prefer to drink beverages and eat products with attractive colors rather than
colorless ones. Color in foods has psychological effects on how the product is perceived
by the consumer. For example, the degree of sweetness was perceived as favored in
cherry-flavored drinks because of the presence of red-colored pigments (Gifford and
Clydesdale, 1986). Allura Red AC or FD&C Red No. 40 is a red powder, soluble in
water, which is used as an additive to color beverages, candy, cereals, confections,
gelatins, puddings, ice cream, condiments, dairy products and others. Allura Red is an
organic molecule that can be classified as monoazo structure (Figure 1) and it has been
listed for use in foods since 1971 (Thorngate, 2002). Regulations of this color are in
accordance with Good Manufacturing Practice and it must be a certified additive to
become used in food products. Experimental reproductive effects have been shown with
an overdose of this additive. The TDL0 (Toxic Dose Low) is the lowest dose over a given
period of time to produce any toxic effect in humans or produce carcinogenic,
neoplastigenic or teratogenic effects in animals or humans; for Red No. 40 the TDL0 is
353
38,500 mg/kg tested in rats via oral ingestion (Lewis, 1989); hyperactivity has been
reported in children as a result of the ingestion of this colorant (Anonymous, 1984);
nevertheless, the reported average daily intake in human beings is 100 mg/kg (Thorngate,
2002). Some of the analytical techniques that have been used for determination of
synthetic colorants in food are thin-layer chromatography, derivative spectrometry,
adsorptive voltammetry (Alghamdi, 2005), capillary electrophoresis, reverse-phase liquid
chromatography (RPLC) and ion-pair RPLC (Chen et al., 1998).
The objective of this research was to study the use of pulsed electric fields in
strawberry flavored milk using two commercial brands and two model systems,
evaluating the physicochemical changes and possible degradation of Allura Red during
storage.
2. Materials and methods
2.1 Milk samples and model systems
Two brands of commercial strawberry flavored milk were purchased at the local
supermarket. Initial characterization of milks consisted of microbial evaluation
(mesophilic load), color and pH. Milk samples were kept at 4ºC until they were used.
Two model systems for strawberry milk were prepared with 2% pasteurized milk
purchased at the local supermarket, sucrose and Allura Red AC (Sigma-Aldrich®
458848) as a coloring agent (80% dye content). Model system 1 (M1C) consisted of 2%
pasteurized milk, sucrose (5.5%) and Allura Red AC (0.01%) using the minimum of
coloring agent recommended for flavored milks according to the patent
(WO/2004/100671). Model system 2 (M2C) consisted of 2% pasteurized milk, sucrose
354
(5.5%) and Allura Red AC (0.2%) in the maximum allowable concentration for flavored
milk according with the same patent mentioned above. Ingredients of each sample are
listed in Table 1. Again, samples were characterized in microbial load, color and pH and
were kept at 4ºC until they were used.
2.2 Pulsed electric fields treatment
A pilot plant pulsed electric fields (PEF) system manufactured by Physics International
(San Leandro, CA) and a cylindrical concentric-electrodes treatment chamber (Qin et al.,
1995) was used to apply the desired treatments to the milk. The continuous treatment
chamber had a volume of 25cm3 and a gap between the stainless steel electrodes of 0.6
cm.
Frequency was kept constant at 10 Hz and the flow was 490 ml/min. Flow rate of
flavored milk was set up and controlled with a rotary pump (Masterflex 7654-00, Cole
Parmer Instruments Co., Chicago, IL). Treatments with peak electric fields of 40 kV/cm
were used in combination with 48 pulses of around 2.5 μs pulse-width. A refrigerated
bath and recirculation system was used to keep the milk temperature at or below 55ºC.
Inlet and outlet temperatures were monitored with digital in-line thermocouples (Cole-
Palmer, Vernon Hills, IL) and registered (Figure 2). Energy consumption, electric field
intensity, pulse width and pulse shape were directly measured by a digital oscilloscope
(Hewlett-Packard 54530A, Colorado Springs, CO), connected to the treatment chamber
through high voltage probes.
355
2.3 Microbiological analysis
The initial load of microorganisms was evaluated for each milk (flavored and
unflavored). Plate Count Agar (Difco Becton, Dickinson and Co., Sparks, MD) was used
for mesophiles aerobes. Serial dilutions were made with peptone water before pouring
samples into dishes. These were incubated at 35°C for 48 h. For the PEF treatments, the
microbial counts were evaluated after 48 pulses. Samples were analyzed in duplicate.
2.4 pH
pH was determined by direct immersion with a potentiometer (Orion Research Inc.,
Boston, MA); each sample was measured in triplicate.
2.5 Color
Lightness to darkness (L*) (100 to 0), redness(+) to greenness(-) (a*), and yellowness(+)
to blueness(-) (b*) color parameters were determined using a Minolta CM-2002
spectrophotometer (Minolta Camera Co., Osaka, Japan) in the reflection mode. Twenty
ml of each milk sample was poured into sterile plastic bags. A white ceramic plate was
used for standardizing the instrument (L* = 93.4, a* = -0.67, b* = 0.78). Each sample
was read in triplicate.
The net color difference was evaluated with the following equation, using the
parameters L*, a* and b* and comparing the different treatments with the untreated milk
of each system from the beginning to the end of storage life.
( ) ( ) ( )2*2*2** baLE Δ+Δ+Δ=Δ
356
Hue angle (h*) was determined using the following relationship:
⎟⎟⎠
⎞⎜⎜⎝
⎛= −
*
*1* tan
abh
and the chroma or saturation index (C*) was evaluated using this equation:
( ) 21
*** 22
baC +=
2.6 High Performance Liquid Chromatography (HPLC) analysis
2.6.1 Materials
Allura Red and sodium acetate were purchased from Sigma (St. Louis, MO, USA).
HPLC grade acetonitrile and water were purchased from J. T. Baker (Phillipsburg, NJ,
USA). Commercial samples (N, L) and model systems (M1, M2) were used before and
after PEF treatments to quantify the concentration of Allura Red.
2.6.2 Allura Red Extraction
Stock solutions of Allura Red and kaempferol (internal standard, IS) were prepared in
HPLC methanol at c.a. 100 μg/ml and stored at -20ºC protected from the light. A 5 ml
aliquot of each sample was collected and mixed with ice-cold HPLC acetonitrile,
vortexed for 30 s, and centrifuged at 3,500 rpm for 8 min (Lonnerdal et al. 1987). The
supernatant was transferred to new tubes and any precipitate was discarded. Then 100 μl
of kaempferol was added to each sample, vortexed, and dried to completion under a
357
constant stream of compressed nitrogen gas. Each sample was reconstituted in 500 μl of
HPLC acetonitrile, vortex, centrifuged, and 100 μl was injected into the HPLC.
2.6.3 Chromatographic conditions
For the quantification of Allura Red, the HPLC system utilized was a Shimadzu HPLC
(Kyoto, Japan) consisting of two LC-10ATVP pumps, a SIL-10AF auto injector, a SPD-
M10A VP spectrophotometric diodearray detector, and a SCL-10A VP system controller.
Data collection and integration were accomplished using Shimadzu EZ Start 7.1.1 SP1
software (Kyoto, Japan). The method was adapted from a report by Kirschbaum et al.
(2003); the analytical column used was a Phenomenex Luna (2) C18 column (250 x 4.60
mm, i.d. 5 µm particle size, Torrance CA, USA). The mobile phase consisted of 100 mM
sodium acetate (NaOAc) (mobile phase A) and 100% acetonitrile (MeCN) (mobile phase
B). The gradient program is presented in Table 2. Separation was carried out at ambient
temperature (25 ± 1°C), and UV detection was carried at 520 nm for Allura Red and 370
nm for kaempferol (internal standard). Standard curves were prepared in whole milk with
known concentrations of Allura Red.
2.7 Storage life
PEF treated milk samples were stored at 4ºC for 40 d. Samples were collocated in sterile
plastic bags, using and discarding one bag for each day for each treatment. Every third
day, the quality characteristics (pH and color) were evaluated, and the microbial loads
were poured into Plate Count Agar (Difco®) for mesophiles aerobes. Samples were taken
from a different bag each day and diluted with peptone water. Samples were incubated at
358
35°C for 48 h. Every fifth day the coloring agent concentration was quantified using
HPLC.
3. Results and discussion
3.1 pH
Regarding the pH of samples, in Figure 3 the behavior of this physicochemical parameter
is shown. First, for the commercial and untreated samples NC and LC, the pH remained
almost constant during one month of storage without important changes. However, the
PEF treated samples (NP and LP) showed a decrease of the pH after the first week of
storage going from 6.7 to 6.3 and remaining at this value for most of the storage time,
with a final drop of the value after day 30. However, in all cases, the pH is inside the
range for commercial milk.
Both model systems showed an interesting pH behavior during storage; pH of
samples that were not processed with PEF (M1C and M2C) dropped quickly after 7 d of
storage and the behavior was very similar between them. Samples that were treated with
PEF (M1P and M2P) showed slower decrease of pH than the untreated, but finished at
the end of the storage period with pH below 5. The reason for this drop could be the
growth of lactobacillus and production of lactic acid into the milk, in addition to other
chemical reactions that could be taking place.
3.2 Color
Immediately after processing samples did not show any important change in color; at
least they showed similar appearance than before processing. Analytical measurements
359
showed the same Hunter color parameters L*, a* and b* between control samples and their
respective PEF treated samples after processing. However, during storage at 4ºC some
samples showed important variations. The three Hunter color parameters were quantified,
however the a* is of interest because of the meaning of this one. A more positive value
means that the product is closer to the redness region and a negative number means being
closer to the greenness region. Commercial samples as shown in Figure 4 remained with
a constant color in accordance with the a* value, but these same samples treated with PEF
lost their coloration after 20 d of storage, with a remarked decrease of a* dropping below
zero. One of the physicochemical mechanisms from which color is produced involves the
electron transitions between molecular orbitals. Changes in bond conjugation in an
organic molecule such as delocalization of electrons or presence of electron donor and
acceptor groups affect the absorption of light accomplishing change of colors (Thorngate,
2002). Here it is important to mention that the use of pulsed electricity has an observable
effect on the stability of the coloring agent Red No. 40 in flavored milk. Both commercial
samples, regardless the rest of the ingredients, showed this decrease that kept constant
until the end of storage (day 37).
Model systems also showed an interesting behavior of a* parameter; the model
with the lowest allowed concentration of Red No. 40 (M1) was discolored after 10 days
of storage regardless of whether it was pulsed or not. PEF only retarded the loss of color
a couple of days with a later discoloration. Model system M2, with the highest coloring
agent concentration, kept its color constant during storage regardless of whether the
sample was pulsed or not. This suggests that as the coloring agent is more concentrated,
more stability is shown after PEF processing and during storage.
360
3.2.1 Net change of color
In order to have a better understanding of the changes in color in milk after processing
and during storage, some color functions were evaluated based on Hunter parameters.
First, net change of color was calculated for each sample, using as a reference the sample
without treatment (C) of the same brand or model system. In Figure 5 this behavior is
shown for the four samples. For both commercial samples (N, L) the net change of color
was very high after day 20; meanwhile, model system M1 showed an undefined behavior
during storage, with a peak after 10 days of storage that represented the maximum
difference between treated and untreated sample. Model system M2 did not show any
important change during storage in ΔE probably because of the high concentration of Red
No. 40 present in the sample.
3.2.2 Hue angle (h*)
The hue angle is shown in Figure 6. For commercial untreated samples (NC and LC), h*
remained constant during storage, close to 0ºC, which is close to the reddish h* value. But
samples processed with PEF changed the angle to negative values close to the yellowish
region. This change was observed at first sight like a loss of color in the milk. Model
systems showed similar behavior as in ΔE; the less concentrated sample changed the hue
angle after 10 d of storage with a hysteresis region from day 15 to day 25. Samples with
highest coloring agent did not change h* during storage and remained at a constant value
of around 27º.
361
3.2.3 Chroma (C*)
The saturation index or chroma (C*) was calculated for the samples as shown in Figure 7.
This value, which indicates the degree of saturation, purity or intensity of color, showed a
constant value for commercial samples during storage. Sample N showed a higher value
during the entire time than did sample L, indicating more purity in the color of the milk.
Flavored milk N is a better and more expensive brand of this kind of beverage than brand
L; in fact, that could be a reason to use coloring with high purity and other stabilizing
agents, such as can be observed in Table 1. However, during storage samples treated with
PEF lost the intensity of the Red 40, diminishing the C* value as observed. Model
systems showed similar behavior as in the previous functions, i.e., less concentrated
system, less saturation and faster degradation, with or without PEF. As the concentration
was higher the stability of the color remained despite the treatment, as observed in Figure
7.
3.3 Microbiological counts
Microbial counts of commercial milks before processing were too low (< 10 cfu/ml) to be
detected with conventional microbiological methods. Model systems showed less than 10
cfu/ml before processing with PEF. After processing and during storage the growth of
mesophilic bacteria is shown in Figure 8. In the first case, the commercial samples NC
and LC did not show microbial growth throughout storage, at least at a level able to be
detected with conventional methods. The reason for that is because these milk beverages
were processed with Ultra High Temperature (UHT) pasteurization, eliminating all the
mesophilic bacteria in the product or reducing the bacteria level to very low counts that
362
can not be detected. Commercial samples processed with PEF showed an increase in the
bacterial population throughout storage. One reason for this increase could be a possible
cross contamination, but the microbial quality of the PEF system and all the related
material was tested without evidence of microorganisms; thus, the possibility of
activation of spores of some thermally resistant microorganisms could be the reason for
this growth. After 12 d of storage, milk showed almost 5 log of microbial growth. Model
systems showed a similar behavior in microbial growth during storage, raising 5 log after
14 d of storage. In this case, there is no difference between commercial and model
systems because the milk used for the model systems was not UHT pasteurized, having
the presence of some bacteria that could accelerate the growth of more microorganisms.
3.4 Concentration of Allura Red
In Figure 9 the concentration of Allura Red for all the systems is shown during storage.
Samples were analyzed during 41 d but results are shown only until day 31 for
commercial samples and day 26 for model systems since after these respective days of
storage the HPLC values were not possible to integrate because big interfering peaks
interfered. These peaks were not present originally. The presence of other dyes such as
Sunset Yellow or Tartrazine may cause interference with Allura Red because of similar
azo structure (Alghamdi, 2005). The first part of the Figure shows the behavior for the
commercial brand N; both samples untreated (NC) and PEF treated (NP) showed a
constant concentration during storage, and the PEF sample even showed a slight increase
in the concentration detected. For the commercial sample L, the concentration of the
coloring agent showed a maximum peak of 2.5 g/L after 20 d of storage and an opposite
363
behavior of the untreated sample (LC) and the PEF sample (LP) after day 26, with an
important decrease for the LC sample at the end of the storage period.
The model systems showed different behaviors. Model system M1 showed an
almost constant concentration of coloring agent during storage with a final drop of
coloring agent. Meanwhile, model system M2 presented the same concentration for the
untreated (M2C) and the treated (M2P) samples, although concentration did not follow a
constant trend. Reports on stability data for FD&C Red No. 40 shows that this dye has a
very good stability regardless of the pH (from 3 to 8), and is stable to light, heat (to
105ºC), acid (10% acetic acid) and presence of SO2; this colorant shows fair stability to
the presence of base (Thorngate, 2002).
So, the changes observed in the coloring agent in these samples are not because of
changes in pH or increase of temperature (in all the experiments temperature was kept
below 55ºC); one theory that could describe these changes is the possibility of the
binding between the colorant agent with some proteins and other charged molecules of
milk because of the presence of strong electric fields attracting particles and forming new
matrices, thus changing the electron configuration of the molecules and scattering or
absorbing the light in different ways and producing different colors to the human eye.
However, further research must be conducted in flavored milks in order to have a better
explanation of what is happening with the electrons of the molecules and the new
complexes and chemical reactions that take place during and after PEF processing.
364
4. Conclusions
Pulsed electric fields is a nonthermal technology that offers important energy and cost
savings during milk pasteurization; however, because of the interaction of electricity with
charged molecules in milk with coloring agents and other additives, new matrices were
formed within the product resulting in a lack of color after some days of storage in some
of the PEF processed milk samples. The presence of other ingredients and dyes helped to
retain the color after processing for commercial samples. The effect of the concentration
of Allura Red showed better stability in color at higher concentration regardless of the
treatment.
References
Alghamdi, A.H. 2005. Determination of Allura Red in Some Food Samples by
Adsorptive Stripping Voltammetry. Journal of AOAC International. 88(5):1387-1393
Anonymous. 1984. Allura Red-Developmental and psychotoxic effects? Food and
Chemical Toxicology. 22(11): 913.
Chen, Q., Mou, S., Hou, X., Riviello, J.M., and Ni Z. 1998. Determination of
eight synthetic food colorants in drinks by high-performance ion chromatography.
Journal of Chromatography A. 827:73-81.
365
Gifford, S.R., and Clydesdale, F.M. 1986. The psychophysical relationship
between color and sodium chloride concentrations in model systems. Journal of Food
Protection. 49 (12): 977-982.
Kirschbaum, J., Krause, C., Pfalzgraf, S., and Brückner, H. 2003. Development
and evaluation of an HPLC-DAD method for determination of synthetic food colorants.
Chromatographia. 57(1): S115-S119.
Lewis, R.J. 1989. Food additives. Van Nostrand Reinhold Company. New York.
pp:214.
Lonnerdal, B., Woodhouse, L. R., and Glazier, C. 1987. Compartmentalization
and quantitation of protein in human milk. Journal of Nutrition: 117, (8), 1385-95.
Miller, G.D., Jarvis, J.K., and McBean, L.D. 2007. Handbook of Foods and
Nutrition. 3rd Ed. National Dairy Council. CRC Press. Boca Ratón, Fl. pp: 28-32, 358-
359.
NSRDEC. 2007. US Army Natick Soldier Center. Operational Rations of the
Department of the Defense. 7th Ed. Department of Defense, Natick, MA, USA.

366
Qin, B.L., Pothakamury, U.R., Vega, H., Martín, O., Barbosa-Cánovas, G.V., and
Swanson, B.G. 1995. Food pasteurization using high-intensity pulsed electric fields.
Food Technology. 49: 55-60.
Sepúlveda, D.R., Góngora-Nieto, M.M., Guerrero J.A., and Barbosa-Cánovas,
G.V. 2005. Production of extended-shelf life milk by processing pasteurized milk with
pulsed electric fields. Journal of Food Engineering. 67: 81-86.
Thorngate III, J.H. 2002. Synthetic Food Colorants. In “Food Additives”, 2nd Ed.
A. L. Branen, P.M. Davidson, S. Salminen and J.H. Thorngate III, Eds. Marcel Dekker,
Inc. New York. pp: 477-500.
WO/2004/100671. Flavored milk manufacturing processes and compositions.
World Intellectual Property Organization.
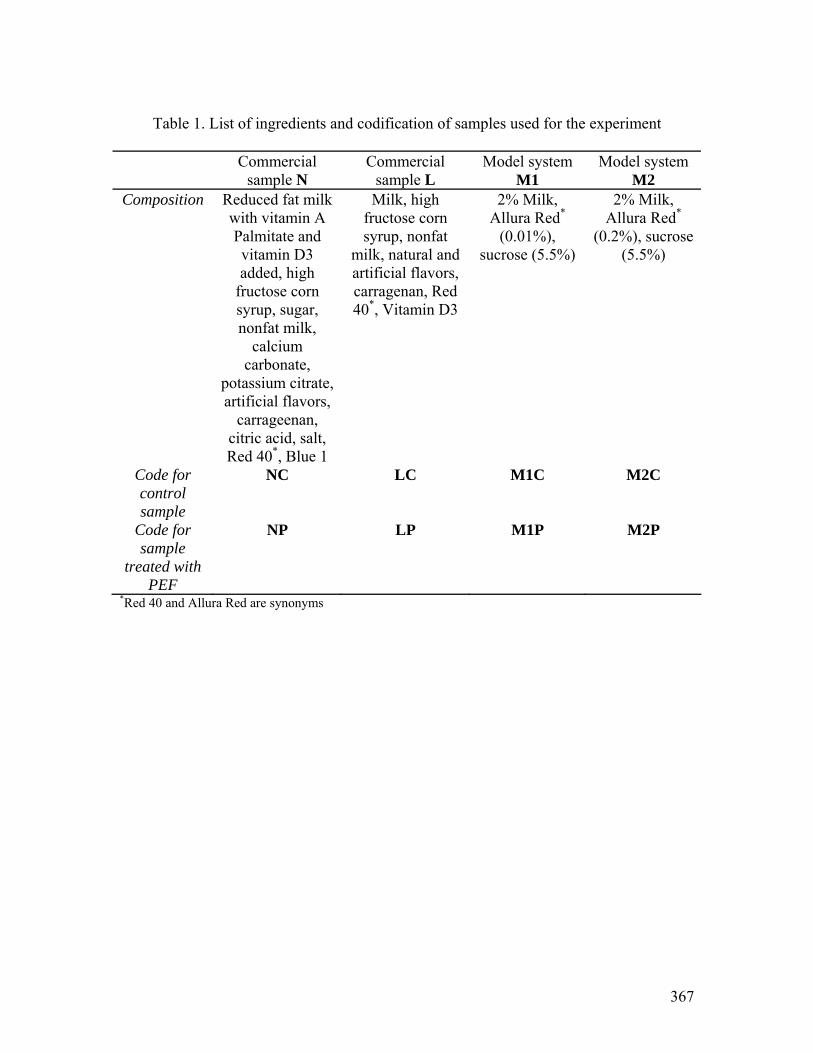
367
Table 1. List of ingredients and codification of samples used for the experiment
Commercial
sample N Commercial
sample L Model system
M1 Model system
M2 Composition Reduced fat milk
with vitamin A Palmitate and vitamin D3 added, high
fructose corn syrup, sugar, nonfat milk,
calcium carbonate,
potassium citrate, artificial flavors,
carrageenan, citric acid, salt, Red 40*, Blue 1
Milk, high fructose corn syrup, nonfat
milk, natural and artificial flavors, carragenan, Red 40*, Vitamin D3
2% Milk, Allura Red*
(0.01%), sucrose (5.5%)
2% Milk, Allura Red*
(0.2%), sucrose (5.5%)
Code for control sample
NC LC M1C M2C
Code for sample
treated with PEF
NP LP M1P M2P
*Red 40 and Allura Red are synonyms
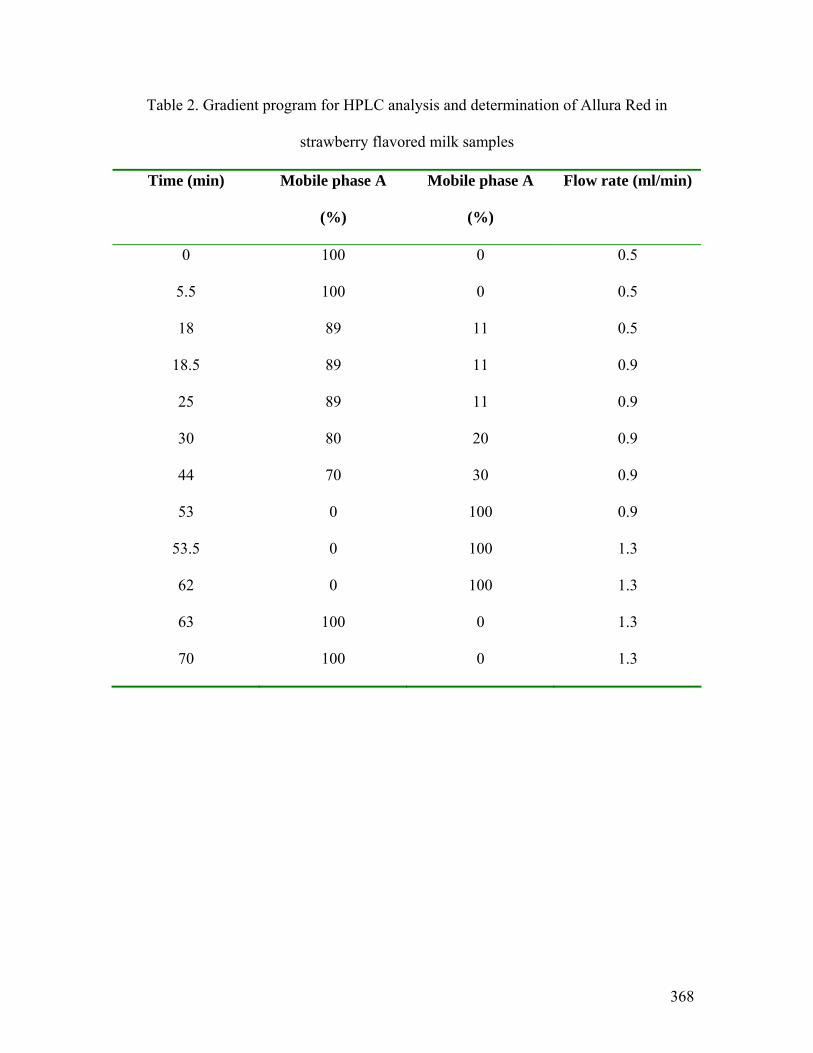
368
Table 2. Gradient program for HPLC analysis and determination of Allura Red in
strawberry flavored milk samples
Time (min) Mobile phase A
(%)
Mobile phase A
(%)
Flow rate (ml/min)
0 100 0 0.5
5.5 100 0 0.5
18 89 11 0.5
18.5 89 11 0.9
25 89 11 0.9
30 80 20 0.9
44 70 30 0.9
53 0 100 0.9
53.5 0 100 1.3
62 0 100 1.3
63 100 0 1.3
70 100 0 1.3
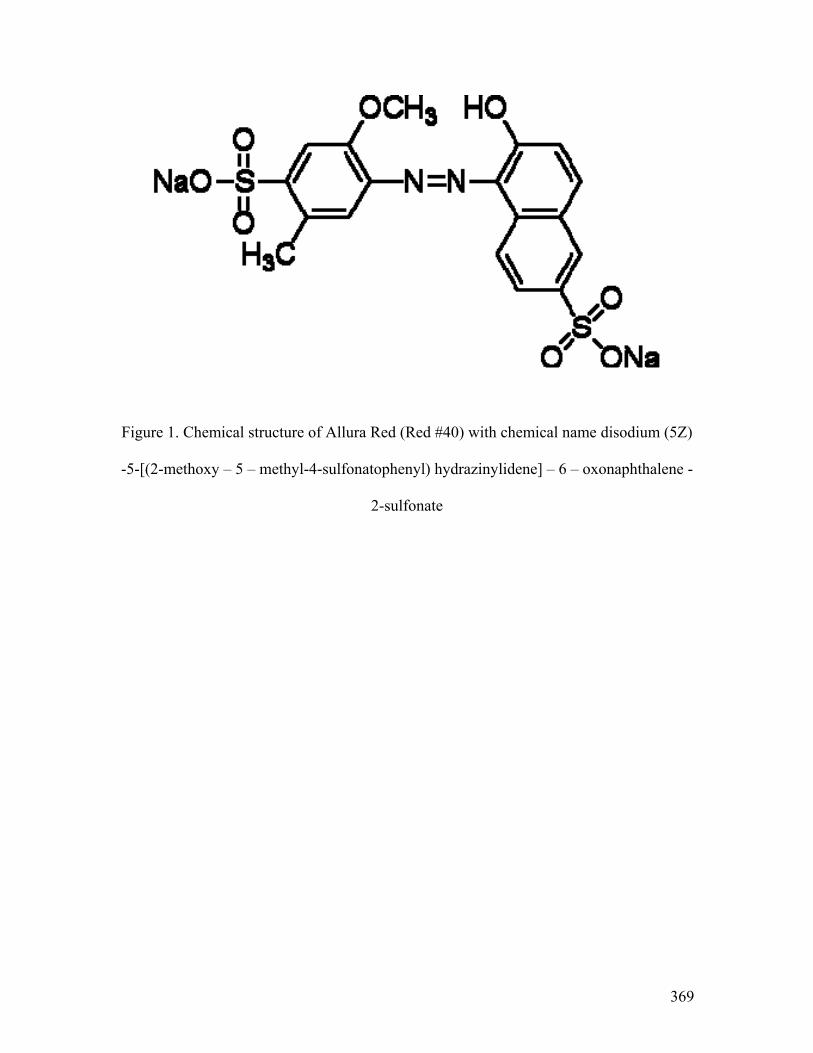
369
Figure 1. Chemical structure of Allura Red (Red #40) with chemical name disodium (5Z)
-5-[(2-methoxy – 5 – methyl-4-sulfonatophenyl) hydrazinylidene] – 6 – oxonaphthalene -
2-sulfonate
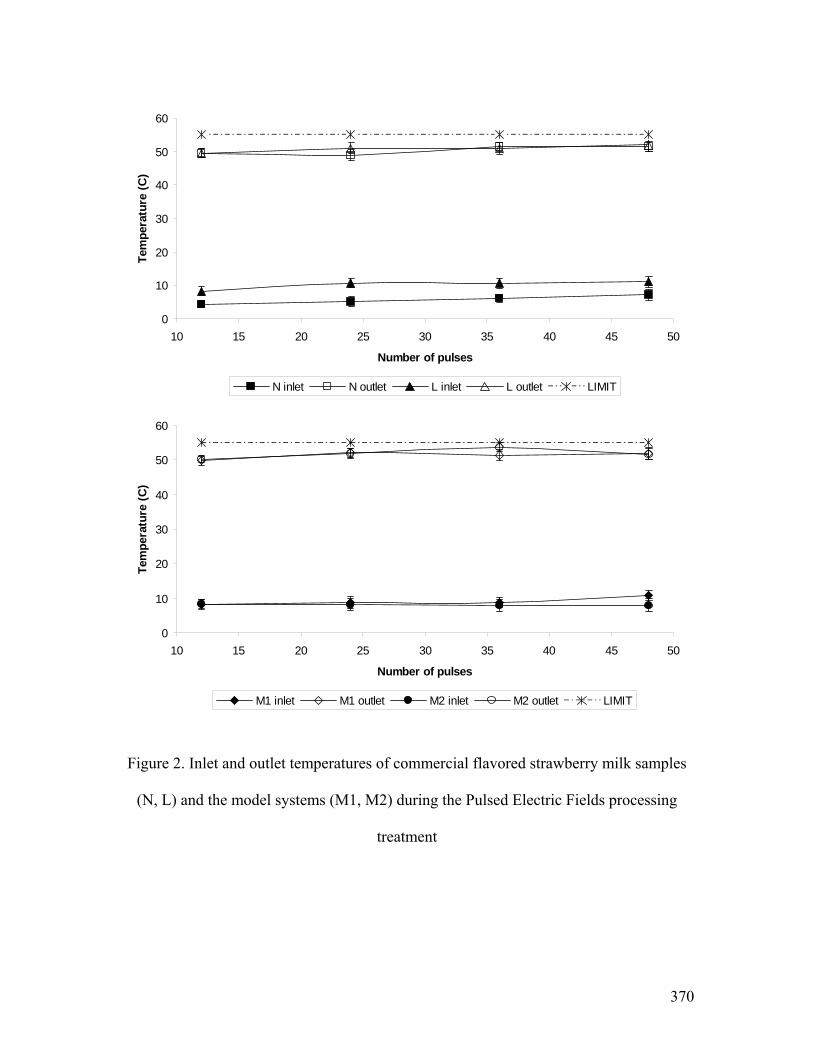
370
0
10
20
30
40
50
60
10 15 20 25 30 35 40 45 50
Number of pulses
Tem
pera
ture
(C)
N inlet N outlet L inlet L outlet LIMIT
0
10
20
30
40
50
60
10 15 20 25 30 35 40 45 50
Number of pulses
Tem
pera
ture
(C)
M1 inlet M1 outlet M2 inlet M2 outlet LIMIT
Figure 2. Inlet and outlet temperatures of commercial flavored strawberry milk samples
(N, L) and the model systems (M1, M2) during the Pulsed Electric Fields processing
treatment
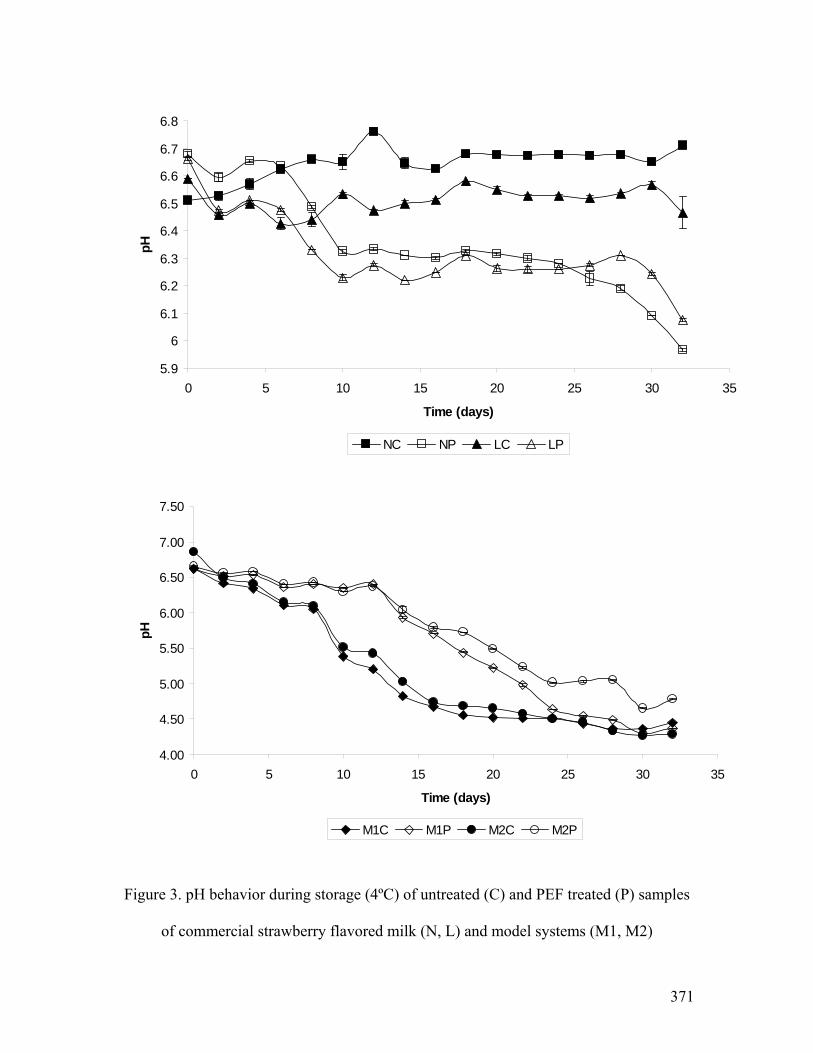
371
5.9
6
6.1
6.2
6.3
6.4
6.5
6.6
6.7
6.8
0 5 10 15 20 25 30 35
Time (days)
pH
NC NP LC LP
4.00
4.50
5.00
5.50
6.00
6.50
7.00
7.50
0 5 10 15 20 25 30 35
Time (days)
pH
M1C M1P M2C M2P
Figure 3. pH behavior during storage (4ºC) of untreated (C) and PEF treated (P) samples
of commercial strawberry flavored milk (N, L) and model systems (M1, M2)

372
-10
-5
0
5
10
15
20
25
30
0 5 10 15 20 25 30 35 40
Time (days)
a*
NC NP LC LP
-10
0
10
20
30
40
50
60
0 5 10 15 20 25 30 35 40
Time (days)
a*
M1C M1P M2C M2P
Figure 4. a* color parameter for samples during storage (4ºC) of untreated (C) and PEF
treated (P) samples of commercial strawberry flavored milk (N, L) and model systems
(M1, M2)
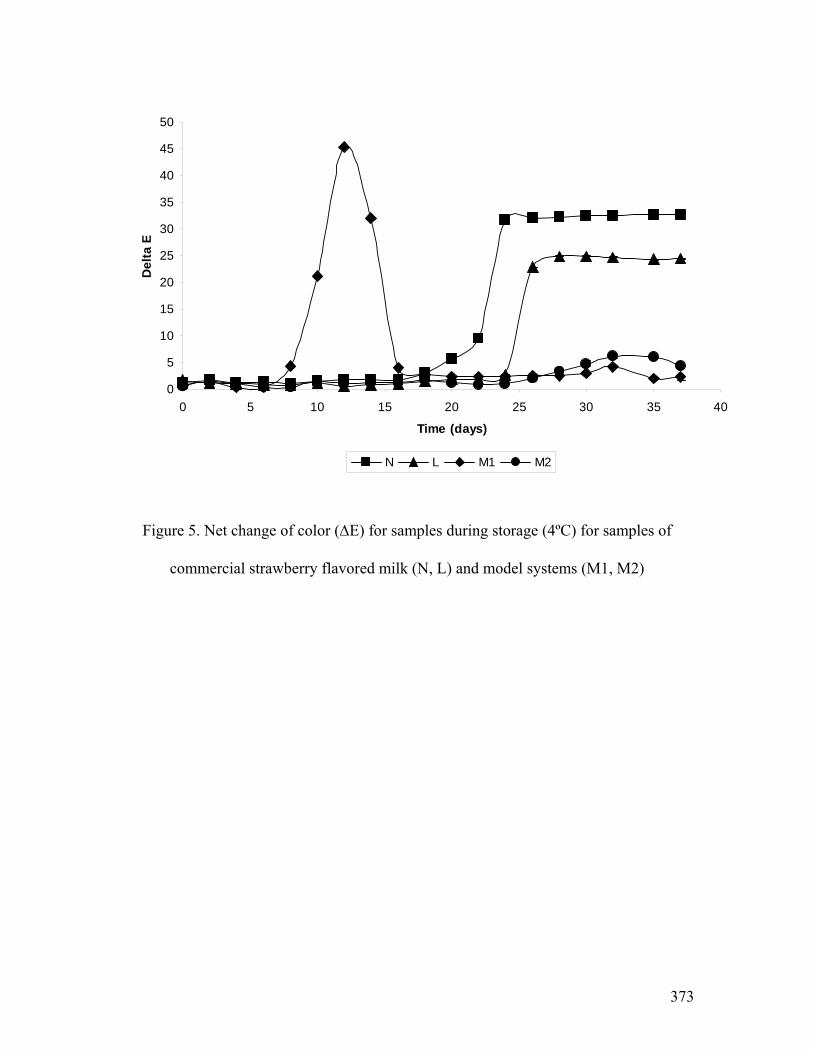
373
0
5
10
15
20
25
30
35
40
45
50
0 5 10 15 20 25 30 35 40
Time (days)
Del
ta E
N L M1 M2
Figure 5. Net change of color (ΔE) for samples during storage (4ºC) for samples of
commercial strawberry flavored milk (N, L) and model systems (M1, M2)
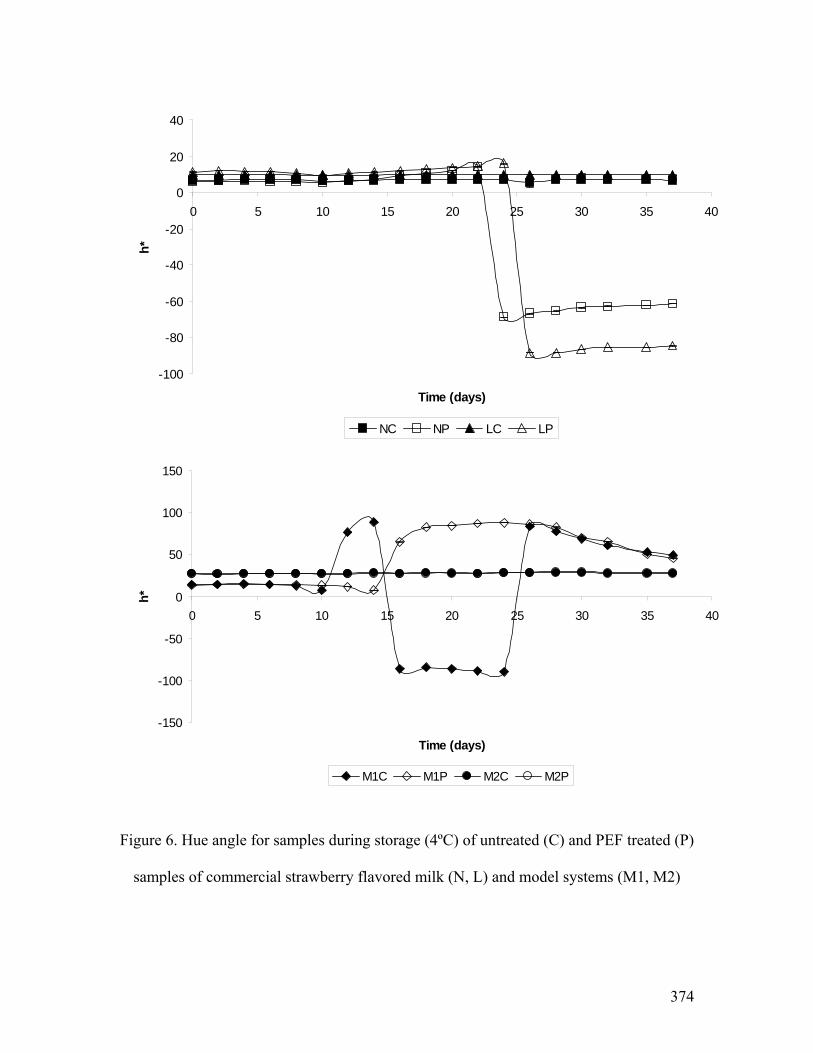
374
-100
-80
-60
-40
-20
0
20
40
0 5 10 15 20 25 30 35 40
Time (days)
h*
NC NP LC LP
-150
-100
-50
0
50
100
150
0 5 10 15 20 25 30 35 40
Time (days)
h*
M1C M1P M2C M2P
Figure 6. Hue angle for samples during storage (4ºC) of untreated (C) and PEF treated (P)
samples of commercial strawberry flavored milk (N, L) and model systems (M1, M2)
375
0
5
10
15
20
25
30
0 5 10 15 20 25 30 35 40
Time (days)
C*
NC NP LC LP
0
10
20
30
40
50
60
0 5 10 15 20 25 30 35 40
Time (days)
C*
M1C M1P M2C M2P
Figure 7. Chroma or saturation index for samples during storage (4ºC) of untreated (C)
and PEF treated (P) samples of commercial strawberry flavored milk (N, L) and model
systems (M1, M2)
376
0
1
2
3
4
5
6
7
0 2 4 6 8 10 12 14 16
Time (days)
log
(N/N
o)
NC NP LC LP
0
1
2
3
4
5
6
0 2 4 6 8 10 12 14 16
Time (days)
log
(N/N
o)
M1C M1P M2C M2P
Figure 8. Microbial growth for samples during storage (4ºC) of untreated (C) and PEF
treated (P) samples of commercial strawberry flavored milk (N, L) and model systems
(M1, M2)
377
0
0.5
1
1.5
2
2.5
3
0 5 10 15 20 25 30 35 40
Time (days)
Allu
ra R
ed C
once
ntra
tion
(mg/
mL)
NC NP
0
0.5
1
1.5
2
2.5
3
0 5 10 15 20 25 30 35 40
Time (days)
Allu
ra R
ed C
once
ntra
tion
(mg/
mL)
LC LP
378
0
5
10
15
20
25
30
35
0 5 10 15 20 25 30 35 40
Time (days)
Allu
ra R
ed C
once
ntra
tion
(mg/
mL)
M1C M1P
0
20
40
60
80
100
120
0 5 10 15 20 25 30 35 40
Time (days)
Allu
ra R
ed C
once
ntra
tion
(mg/
mL)
M2C M2P
Figure 9. Allura Red Concentration (mg/mL) for samples during storage (4ºC) of untreated (C) and PEF treated (P) samples of
commercial strawberry flavored milk (N, L) and model systems (M1, M2)
379
CONCLUSIONS
This research project tested ultrasound and pulsed electric fields to process milk. Some
general conclusions can be summarized as follows:
Ultrasound technology in combination with thermal treatment was able to inactivate
pathogens and deteriorative microorganisms in milk, considerably reducing the treatment
time and achieving pasteurization standards. Because of the non-linear behavior of the
inactivation curves with ultrasound, Weibull’s and four parameter models were useful to
describe the inactivation kinetics of Listeria innocua in milk by ultrasound.
Despite the changes that ultrasound generated in the composition and physicochemical
parameters of milk after processing, one of the most important nutritional components
protein, remained in the regular range of this milk constituent. Beneficial effects were
observed in color (whiter), stability and homogenization degree in milk after sonication.
After the inactivation and microscopy studies of Listeria cells before and after sonication,
it is possible to suggest as a likely mechanism of cell inactivation the rupture of the cell
membrane, formation of pores, breakdown of cells and the deposition of cell material into
the surface because of the rubbing effect produced by the cavitation of ultrasound. The
presence of free radicals in the milk after the sonication could also have a bactericidal
effect.
380
Caviation generated by sonication homogenizes fat globules of milk, reducing the size to
smaller than one micrometer and generating a more compact and stable structure of milk.
Also, this new structure has a whiter color because of the size reduction of the globules
and the availability of fat, which is creates a new surface area of the oil droplets.
Fat content of milk was shown to be an important hurdle in the inactivation of Listeria
innocua, representing a limiting factor for microbial inactivation using sound waves plus
heat. However, probably because of the presence of new chemical components in milk
caused by the lysis of macromolecules, longer storage life was conferred to the milk.
New and improved dairy products can be developed from thermo-sonicated milk by
taking advantage of the better quality characteristics of the processed milk, having higher
yields, better color, structure and stability. The use of microwave energy was successfully
used to prepare samples for electron microscopy, considerably reducing the preparation
time and improving the resolution of the microscopy images.
Bacillus cereus spores again showed their resistance, not only to thermal treatments, but
also to pulsed electric fields treatment, regardless of the processing conditions. Even with
the use of natural antimicrobials, the spores were resistant, but remained in low counts
after processing milk. Again, the effect of butter fat content in milk was shown with
another microorganism and another technology.
381
The electrodeposition of milk materials during intense treatment with pulsed electric
fields processing is a reality that must be minimized or eliminated. Presence of metals
after processing and decrease mainly of protein content in milk showed the disadvantage
of the processing in order to eliminate spores.
Pulsed electric fields can generate a lack of color in strawberry flavored milks because of
the interaction of the coloring agent (Allura Red) with other components, but this effect is
reduced when other additives are present or the coloring agent is added in higher
concentration but still within the range for food colorants allowed by FDA.
382
FUTURE RESEARCH
After evaluating ultrasound and pulsed electric fields as surrogate technologies to
pasteurize and/or process milk, it is recommended that it would be helpful to widely
document both technologies and to look forward to the possible approval for regulatory
and legal institutions. Some of the future work should be focused on the following:
a) From the engineering point of view, the search for better, more resistant and
sanitary materials for sonotrodes (ultrasound) and electrodes (pulsed electric
fields) would be a priority. Food technologists should work together with
scientists from material science in order to create materials that resist processing
conditions in both technologies without erosion problems and the release of metal
particles into the food.
b) Special sensors should be installed and validated in pulsed electric fields
equipment in order to ensure the absence of bubbles before and during processing
as well as the removal of fouling from the electrode in order to avoid arcing
problems.
c) A detailed analysis of energy consumption in ultrasound processing and pulsed
electric fields to inactivate spores should be carried out in order to show the
economical and energy-saving advantages of these technologies.
d) Better temperature control should be adapted and installed into the ultrasound
equipment in order to avoid overcharge of the system and to facilitate testing of
other processing conditions.

383
e) From the microbiological point of view, more pathogenic bacteria should be
tested under thermo-sonication and other processing conditions such as higher
temperatures and shorter times.
f) A complete chemical study is required in milk after thermo-sonication and pulsed
electric field treatments in order to study the new substances that are generated by
the cavitation of the ultrasound and the contact of electricity with food materials.
Quantification of free radicals, metal particles and other substances are of interest.
g) Studies with pulsed electric fields in other flavored milks, such as chocolate, are
recommended in order to test the stability of the ingredients of these products and
to evaluate the feasibility of this technology to process one of the most consumed
flavored milks.
h) After testing the new chemical composition as well as ensuring the microbial
quality of milk processed with both technologies, sensorial analysis of the product
is highly recommended. Positive effects have been observed in the appearance of
treated milk with ultrasound and PEF, so the next step should be to analyze the
flavor, taste and general acceptance of milk and other dairy products.
i) A huge research world of opportunities for the processing of dairy products with
these new characteristics of milk is available; processing of cheese, yogurt and
other related products with both technologies will lead to improved products for
the consumer.