Embed Size (px)
Citation preview

Special Report 1079-ENovember 2007
Nonstructural Carbohydrates inCool-season Grasses
Oregon State Extension
UNIVERSITY Service

For additional copies of this publication
This publication is available only online, athttp://extension.oregonstate.edu/catalog/pdf/sr/sr1079-e.pdf

Oregon State UniversityExtension Service
Special Report 1079-E
November 2007
Nonstructural Carbohydrates inCool-season Grasses
Troy DowningExtension dairy specialist and staff chairTillamook County, Oregon State UniversityandMike GamrothExtension dairy specialistOregon State University
Trade-name products and services are mentioned as illustrations only. This doesnot mean that the Oregon State University Extension Service either endorsesthese products and services or intends to discriminate against products andservices not mentioned.
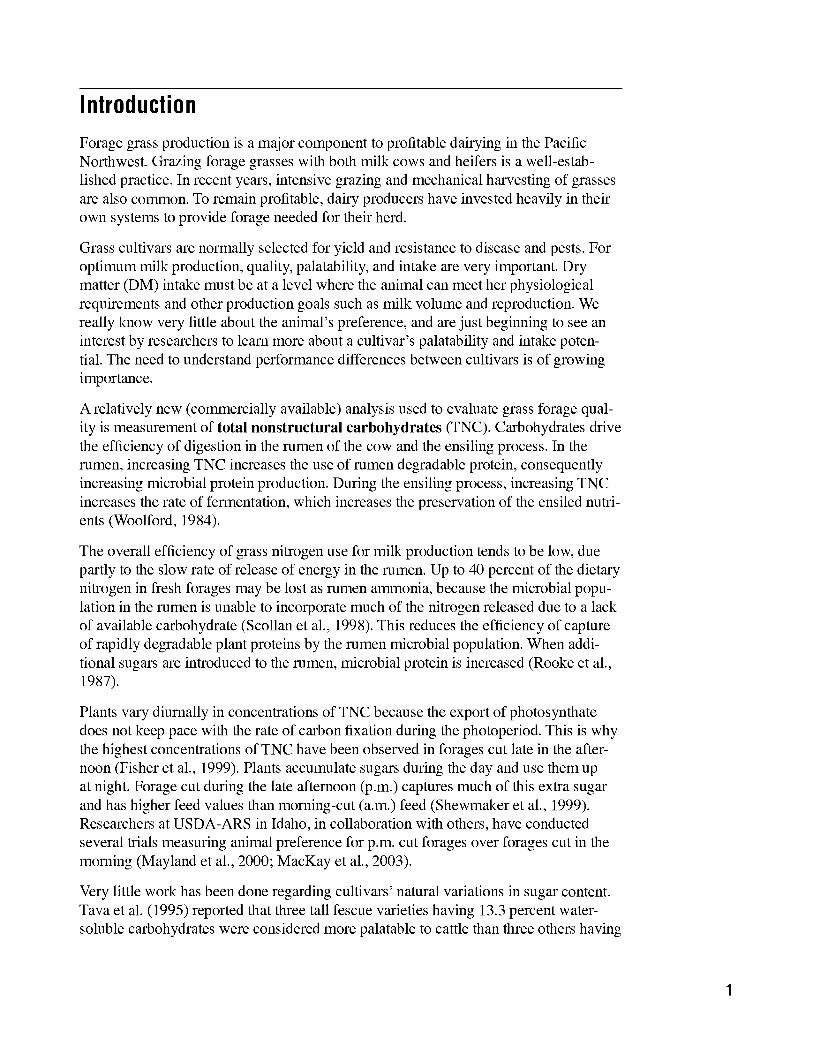
Introduction
Forage grass production is a major component to profitable dairying in the PacificNorthwest. Grazing forage grasses with both milk cows and heifers is a well-estab-lished practice. In recent years, intensive grazing and mechanical harvesting of grassesare also common. To remain profitable, dairy producers have invested heavily in theirown systems to provide forage needed for their herd.
Grass cultivars are normally selected for yield and resistance to disease and pests. Foroptimum milk production, quality, palatability, and intake are very important. Drymatter (DM) intake must be at a level where the animal can meet her physiologicalrequirements and other production goals such as milk volume and reproduction. Wereally know very little about the animal's preference, and are just beginning to see aninterest by researchers to learn more about a cultivar's palatability and intake poten-tial. The need to understand performance differences between cultivars is of growingimportance.
A relatively new (commercially available) analysis used to evaluate grass forage qual-ity is measurement of total nonstructural carbohydrates (TNC). Carbohydrates drivethe efficiency of digestion in the rumen of the cow and the ensiling process. In therumen, increasing TNC increases the use of rumen degradable protein, consequentlyincreasing microbial protein production. During the ensiling process, increasing TNCincreases the rate of fermentation, which increases the preservation of the ensiled nutri-ents (Woolford, 1984).
The overall efficiency of grass nitrogen use for milk production tends to be low, duepartly to the slow rate of release of energy in the rumen. Up to 40 percent of the dietarynitrogen in fresh forages may be lost as rumen ammonia, because the microbial popu-lation in the rumen is unable to incorporate much of the nitrogen released due to a lackof available carbohydrate (Scollan et al., 1998). This reduces the efficiency of captureof rapidly degradable plant proteins by the rumen microbial population. When addi-tional sugars are introduced to the rumen, microbial protein is increased (Rooke et al.,1987).
Plants vary diurnally in concentrations of TNC because the export of photosynthatedoes not keep pace with the rate of carbon fixation during the photoperiod. This is whythe highest concentrations of TNC have been observed in forages cut late in the after-noon (Fisher et al., 1999). Plants accumulate sugars during the day and use them upat night. Forage cut during the late afternoon (p.m.) captures much of this extra sugarand has higher feed values than morning-cut (a.m.) feed (Shewmaker et al., 1999).Researchers at USDA-ARS in Idaho, in collaboration with others, have conductedseveral trials measuring animal preference for p.m. cut forages over forages cut in themorning (Mayland et al., 2000; MacKay et al., 2003).
Very little work has been done regarding cultivars' natural variations in sugar content.Tava et al. (1995) reported that three tall fescue varieties having 13.3 percent water-soluble carbohydrates were considered more palatable to cattle than three others having
1
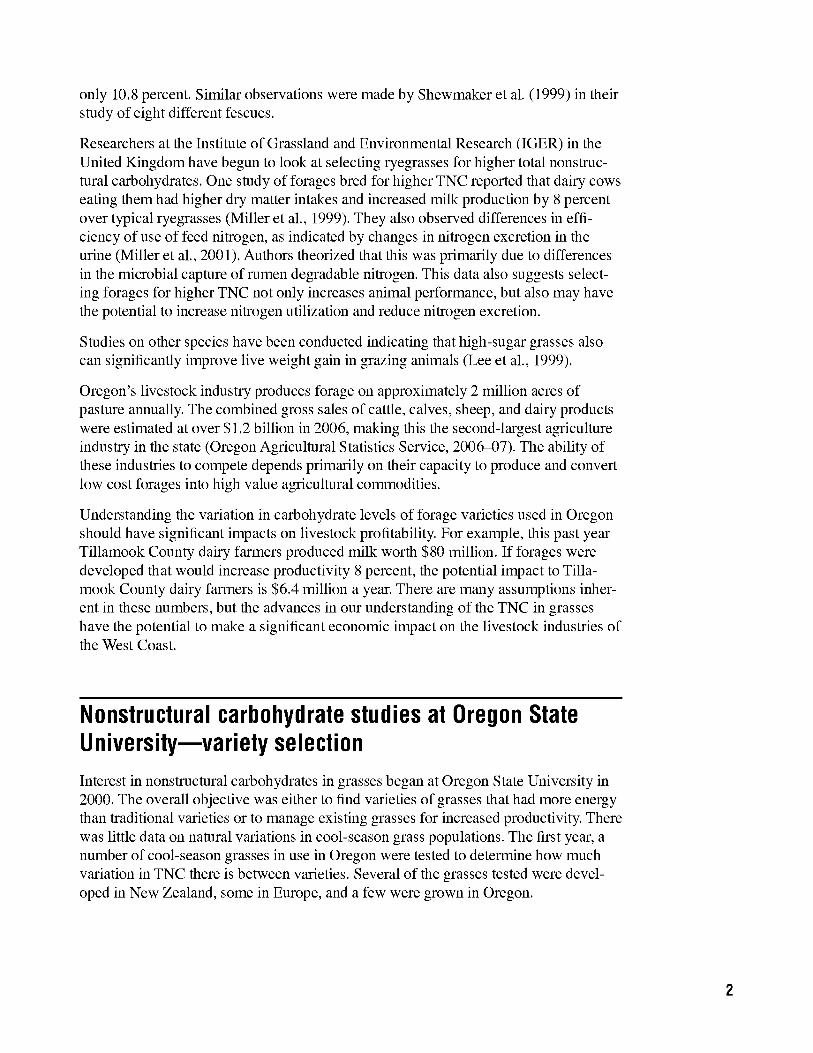
only 10.8 percent. Similar observations were made by Shewmaker et al. (1999) in theirstudy of eight different fescues.
Researchers at the Institute of Grassland and Environmental Research (IGER) in theUnited Kingdom have begun to look at selecting ryegrasses for higher total nonstruc-tural carbohydrates. One study of forages bred for higher TNC reported that dairy cowseating them had higher dry matter intakes and increased milk production by 8 percentover typical ryegrasses (Miller et al., 1999). They also observed differences in effi-ciency of use of feed nitrogen, as indicated by changes in nitrogen excretion in theurine (Miller et al., 2001). Authors theorized that this was primarily due to differencesin the microbial capture of rumen degradable nitrogen. This data also suggests select-ing forages for higher TNC not only increases animal performance, but also may havethe potential to increase nitrogen utilization and reduce nitrogen excretion.
Studies on other species have been conducted indicating that high-sugar grasses alsocan significantly improve live weight gain in grazing animals (Lee et al., 1999).
Oregon's livestock industry produces forage on approximately 2 million acres ofpasture annually. The combined gross sales of cattle, calves, sheep, and dairy productswere estimated at over $1.2 billion in 2006, making this the second-largest agricultureindustry in the state (Oregon Agricultural Statistics Service, 2006-07). The ability ofthese industries to compete depends primarily on their capacity to produce and convertlow cost forages into high value agricultural commodities.
Understanding the variation in carbohydrate levels of forage varieties used in Oregonshould have significant impacts on livestock profitability. For example, this past yearTillamook County dairy farmers produced milk worth $80 million. If forages weredeveloped that would increase productivity 8 percent, the potential impact to Tilla-mook County dairy farmers is $6.4 million a year. There are many assumptions inher-ent in these numbers, but the advances in our understanding of the TNC in grasseshave the potential to make a significant economic impact on the livestock industries ofthe West Coast.
Nonstructural carbohydrate studies at Oregon StateUniversity-variety selection
Interest in nonstructural carbohydrates in grasses began at Oregon State University in2000. The overall objective was either to find varieties of grasses that had more energythan traditional varieties or to manage existing grasses for increased productivity. Therewas little data on natural variations in cool-season grass populations. The first year, anumber of cool-season grasses in use in Oregon were tested to determine how muchvariation in TNC there is between varieties. Several of the grasses tested were devel-oped in New Zealand, some in Europe, and a few were grown in Oregon.
2
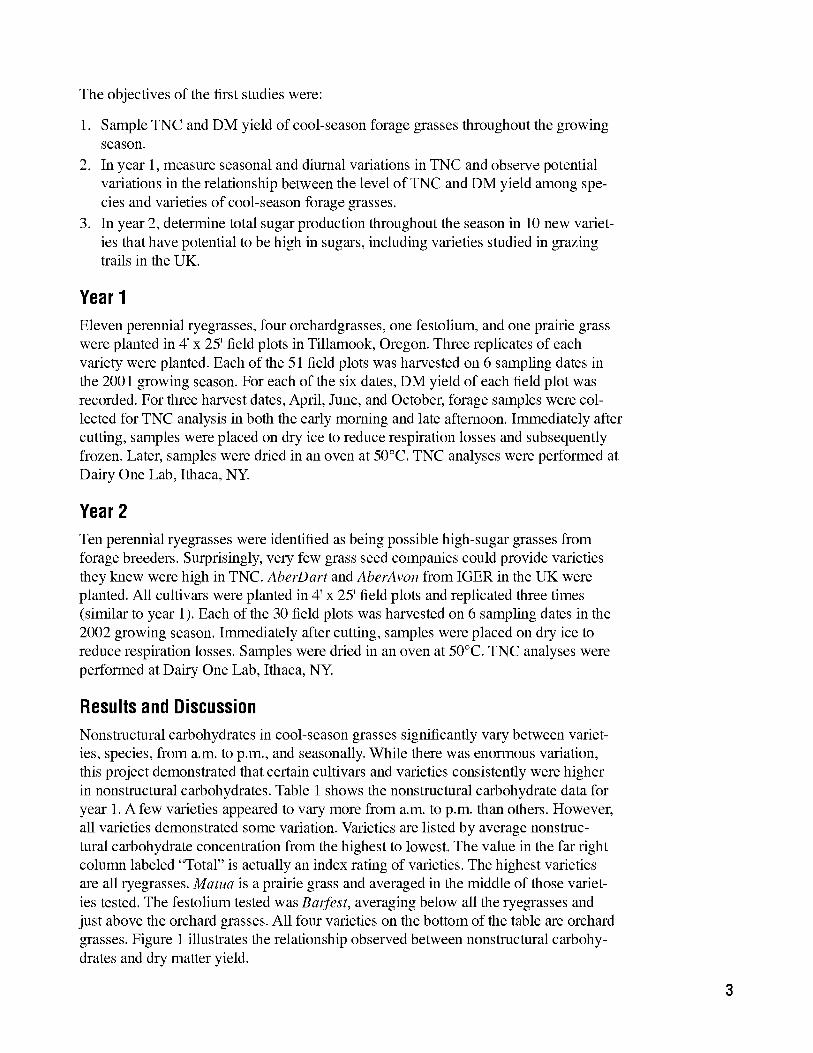
The objectives of the first studies were:
1. Sample TNC and DM yield of cool-season forage grasses throughout the growingseason.
2. In year 1, measure seasonal and diurnal variations in TNC and observe potentialvariations in the relationship between the level of TNC and DM yield among spe-cies and varieties of cool-season forage grasses.
3. In year 2, determine total sugar production throughout the season in 10 new variet-ies that have potential to be high in sugars, including varieties studied in grazingtrails in the UK.
Year 1
Eleven perennial ryegrasses, four orchardgrasses, one festolium, and one prairie grasswere planted in 4' x 25' field plots in Tillamook, Oregon. Three replicates of eachvariety were planted. Each of the 51 field plots was harvested on 6 sampling dates inthe 2001 growing season. For each of the six dates, DM yield of each field plot wasrecorded. For three harvest dates, April, June, and October, forage samples were col-lected for TNC analysis in both the early morning and late afternoon. Immediately aftercutting, samples were placed on dry ice to reduce respiration losses and subsequentlyfrozen. Later, samples were dried in an oven at 50°C. TNC analyses were performed atDairy One Lab, Ithaca, NY.
Year 2
Ten perennial ryegrasses were identified as being possible high-sugar grasses fromforage breeders. Surprisingly, very few grass seed companies could provide varietiesthey knew were high in TNC. AberDart and AberAvon from IGER in the UK wereplanted. All cultivars were planted in 4'x 25' field plots and replicated three times(similar to year 1). Each of the 30 field plots was harvested on 6 sampling dates in the2002 growing season. Immediately after cutting, samples were placed on dry ice toreduce respiration losses. Samples were dried in an oven at 50°C. TNC analyses wereperformed at Dairy One Lab, Ithaca, NY.
Results and Discussion
Nonstructural carbohydrates in cool-season grasses significantly vary between variet-ies, species, from a.m. to p.m., and seasonally. While there was enormous variation,this project demonstrated that certain cultivars and varieties consistently were higherin nonstructural carbohydrates. Table 1 shows the nonstructural carbohydrate data foryear 1. A few varieties appeared to vary more from a.m. to p.m. than others. However,all varieties demonstrated some variation. Varieties are listed by average nonstruc-tural carbohydrate concentration from the highest to lowest. The value in the far rightcolumn labeled "Total" is actually an index rating of varieties. The highest varietiesare all ryegrasses. Matua is a prairie grass and averaged in the middle of those variet-ies tested. The festolium tested was Barfest, averaging below all the ryegrasses andjust above the orchard grasses. All four varieties on the bottom of the table are orchardgrasses. Figure 1 illustrates the relationship observed between nonstructural carbohy-drates and dry matter yield.
3

Table 1. Nonstructural carbohydrate % of dry matter for a.m./p.m. harvested cultivars in 2001.
Percent total nonstructural carbohydrate in dry matter4/20 a.m. 4/20 p.m. 6/28 a.m. 6/28 p.m. 10/1 a.m. 10/1 p.m. Total
Elgon 14.3 13.7 18.2 25.3 21.0 23.9 19.4
etralite 14.8 14.7 16.3 25.1 19.4 23.9 19.0
Ilerbie 11.5 13.3 19.2 25.9 19.6 21.7 18.5
G-34 12.6 16.2 17.2 19.4 17.1 27.3 18.3
Tonga 15.8 21.7 16.0 20.6 15.2 20.0 18.2
Glenn 13.8 17.6 17.0 19.1 19.5 21.8 18.1
Bison 12.1 12.4 18.4 24.5 15.9 22.9 17.7
atua 12.2 22.6 14.5 21.9 15.5 18.7 17.6
Barfort 14.4 18.0 14.0 23.5 13.8 20.3 17.3
tanker 12.9 13.6 17.7 21.0 15.2 23.5 17.3
Belramo 12.5 14.1 14.6 19.2 18.3 17.5 16.0
ronsyn 9.0 15.1 17.6 21.2 13.0 16.5 15.4
Barfest 11.7 15.9 13.5 12.2 13.3 21.8 14.7
Orion 14.3 11.9 17.1 22.4 10.2 11.1 14.5
Pizza 10.0 12.4 12.3 19.6 8.2 12.5 12.5
Cambria 9.7 14.8 9.1 15.6 10.3 12.8 12.0
Bandana 10.8 11.6 8.8 14.0 9.0 16.5 11.8
25
CMca
10
w 5
0
R2 = 0.4515
0 5000 10000 15000
Total OM
20000 25000
Figure 1. The relationship between nonstructural carbohydrates and dry matter yieldthroughout all sampling periods.
4
20
15
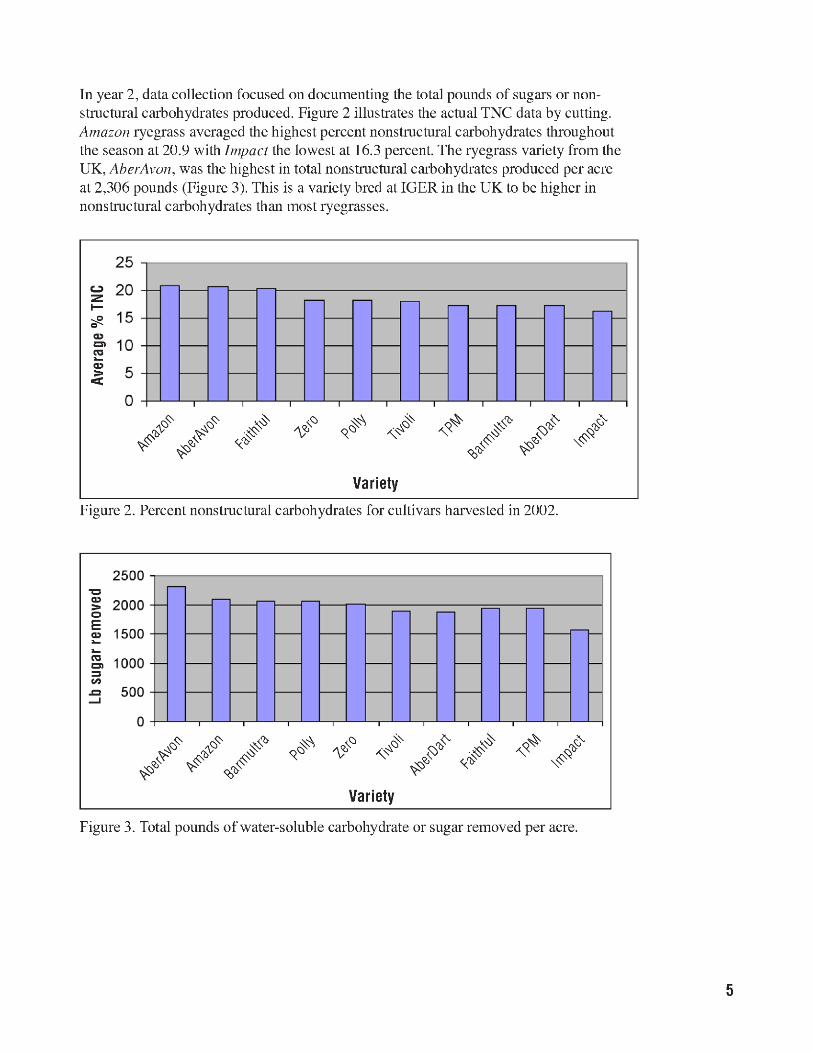
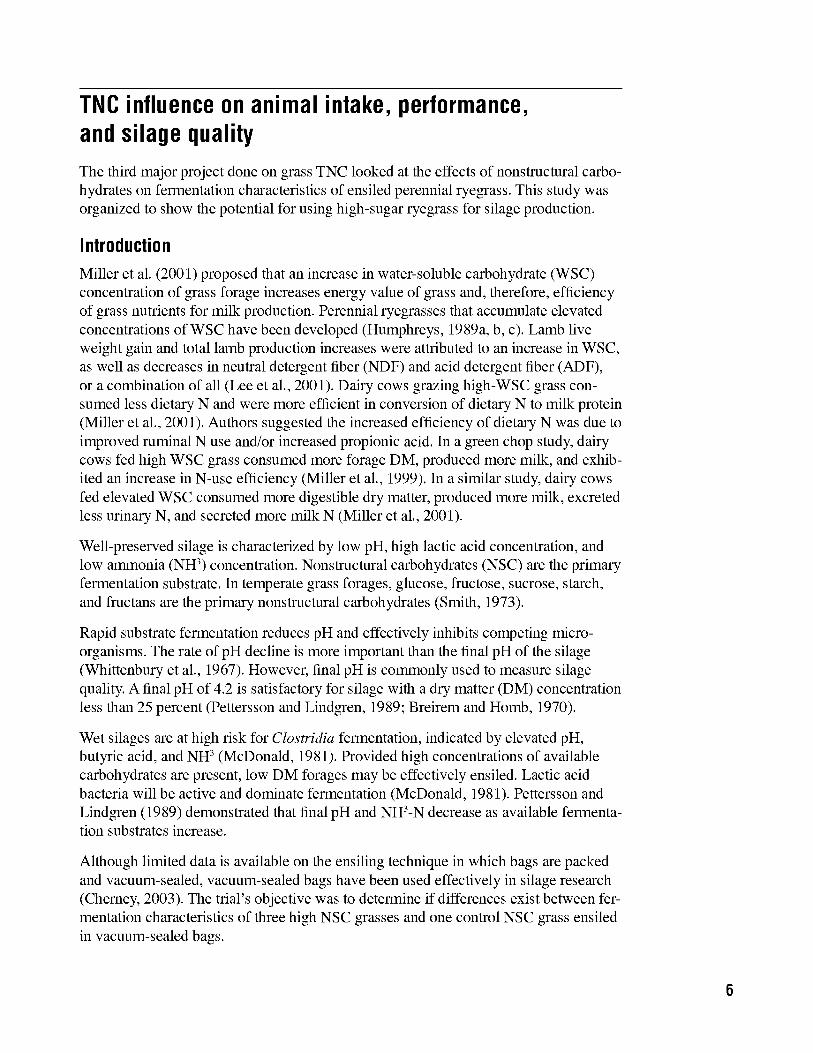
In year 2, data collection focused on documenting the total pounds of sugars or non-structural carbohydrates produced. Figure 2 illustrates the actual TNC data by cutting.Amazon ryegrass averaged the highest percent nonstructural carbohydrates throughoutthe season at 20.9 with Impact the lowest at 16.3 percent. The ryegrass variety from theUK, AherAvon, was the highest in total nonstructural carbohydrates produced per acreat 2,306 pounds (Figure 3). This is a variety bred at IGER in the UK to be higher innonstructural carbohydrates than most ryegrasses.
25
0
,VO JOB
P \ooP ti0
O\\J
Variety
Figure 2. Percent nonstructural carbohydrates for cultivars harvested in 2002.
2500
2000
1500
1000
500
to
Variety
Figure 3. Total pounds of water-soluble carbohydrate or sugar removed per acre.
0
5
TNC influence on animal intake, performance,and silage quality
The third major project done on grass TNC looked at the effects of nonstructural carbo-hydrates on fermentation characteristics of ensiled perennial ryegrass. This study wasorganized to show the potential for using high-sugar ryegrass for silage production.
Introduction
Miller et al. (2001) proposed that an increase in water-soluble carbohydrate (WSC)concentration of grass forage increases energy value of grass and, therefore, efficiencyof grass nutrients for milk production. Perennial ryegrasses that accumulate elevatedconcentrations of WSC have been developed (Humphreys, 1989a, b, c). Lamb liveweight gain and total lamb production increases were attributed to an increase in WSC,as well as decreases in neutral detergent fiber (NDF) and acid detergent fiber (ADF),or a combination of all (Lee et al., 2001). Dairy cows grazing high-WSC grass con-sumed less dietary N and were more efficient in conversion of dietary N to milk protein(Miller et al., 2001). Authors suggested the increased efficiency of dietary N was due toimproved ruminal N use and/or increased propionic acid. In a green chop study, dairycows fed high WSC grass consumed more forage DM, produced more milk, and exhib-ited an increase in N-use efficiency (Miller et al., 1999). In a similar study, dairy cowsfed elevated WSC consumed more digestible dry matter, produced more milk, excretedless urinary N, and secreted more milk N (Miller et al., 2001).
Well-preserved silage is characterized by low pH, high lactic acid concentration, andlow ammonia (NH3) concentration. Nonstructural carbohydrates (NSC) are the primaryfermentation substrate. In temperate grass forages, glucose, fructose, sucrose, starch,and fructans are the primary nonstructural carbohydrates (Smith, 1973).
Rapid substrate fermentation reduces pH and effectively inhibits competing micro-organisms. The rate of pH decline is more important than the final pH of the silage(Whittenbury et al., 1967). However, final pH is commonly used to measure silagequality. A final pH of 4.2 is satisfactory for silage with a dry matter (DM) concentrationless than 25 percent (Pettersson and Lindgren, 1989; Breirem and Homb, 1970).
Wet silages are at high risk for Clostridia fermentation, indicated by elevated pH,butyric acid, and NH3 (McDonald, 1981). Provided high concentrations of availablecarbohydrates are present, low DM forages may be effectively ensiled. Lactic acidbacteria will be active and dominate fermentation (McDonald, 1981). Pettersson andLindgren (1989) demonstrated that final pH and NH3-N decrease as available fermenta-tion substrates increase.
Although limited data is available on the ensiling technique in which bags are packedand vacuum-sealed, vacuum-sealed bags have been used effectively in silage research(Cherney, 2003). The trial's objective was to determine if differences exist between fer-mentation characteristics of three high NSC grasses and one control NSC grass ensiledin vacuum-sealed bags.
6
Materials and methods
Four cool-season, perennial ryegrasses, three with a relatively high NSC concentra-tion (AberAvon, AberDart, Elgon) and one commonly grown in Oregon (Linn), wereselected as treatments and a control. AberAvon and AberDart are diploid perennialryegrasses that have been selected for elevated NSC. Elgon is a tetraploid perennialryegrass that exhibited high levels of NSC in field plot trials in Oregon (Downing et al.,2004). Linn is a diploid perennial ryegrass representative of Oregon perennial ryegrass.
Grasses were harvested with a flail forage plot harvester (Swift Current, Saskatchewan,Canada) in the vegetative stage. Chop height and length were approximately 6 cm and15 cm, respectively. Three replicates of each grass were harvested at 0900 h and 2000 h.After harvest, an 800-g sample of each was placed in an individual 3-mil Zublon®plastic bag (Triume Enterprises, CA) and sealed with a Roschermatic VM-21® vacuumsealer (Roscherwenke GMBH, Germany). Harvesting, sampling, and sealing werecompleted within 2 hours. Bags were stored in a cool place for the 60-day ensilingperiod. After the 60 days, bags were frozen at -10°C and kept frozen until laboratoryanalysis.
Fresh grass samples were freeze-dried with a Freeze Mobile 12 (VirTis Co., Gardiner,NY) and ground through a 1-mm screen using a Thomas Wiley Mill (Thomas Sci-entific, USA). The 24 fresh grass samples were individually analyzed for DM, crudeprotein (CP), neutral detergent fiber (NDF), acid detergent fiber (ADF), sugars, starch,and ash. Ensiled forage samples were analyzed for percent DM, pH, lactic acid, aceticacid, propionic acid, butyric acid, isobutyric acid, total acids, CP, NH3, crude proteinequivalent percent (CPE %), and NH3-N percent of total N (TN), by Dairy One ForageLaboratory (Ithaca, NY). Lactic acid concentration was reanalyzed to confirm results.
Statistical analysis
Data were analyzed as a completely randomized design with the MIXED Procedureof SAS (SAS User's Guide, 1998). A contrast statement was used to compare the highNSC varieties to Linn. Correlation coefficients were computed using PROC CORRof SAS (SAS User's Guide, 1998) to define the relationship between the more readilyavailable carbohydrates and selected fermentation parameters.
Results and discussion
Composition of the fresh grass samples by treatment and cutting time is shown inTable 2. Dry matter concentration was lower in the high NSC grass varieties versusLinn (P<0.01) and lower in the a.m. versus p.m. cutting (P<0.01). NDF and ADFwere lower in the high-NSC varieties (P<0.01) and in the p.m. versus a.m. cutting(P<0.01). Crude protein was higher in the high-NSC grass varieties (P<0.01) and lowerin the p.m. versus a.m. cutting (P<0.05). Starch was higher in high-NSC versus Linn(P<0.05) and lower in the a.m. versus p.m. cutting (P<0.01). For variables listed inTable 3, treatment by cutting interaction was not significant.
Total NSC were higher in the high-NSC varieties versus Linn (P<0.0 1). For NSC con-centrations, treatment by time of cutting interaction was significant (P<0.05). Figure 4illustrates the NSC levels of fresh grass for all treatments and both the a.m. and p.m.
7
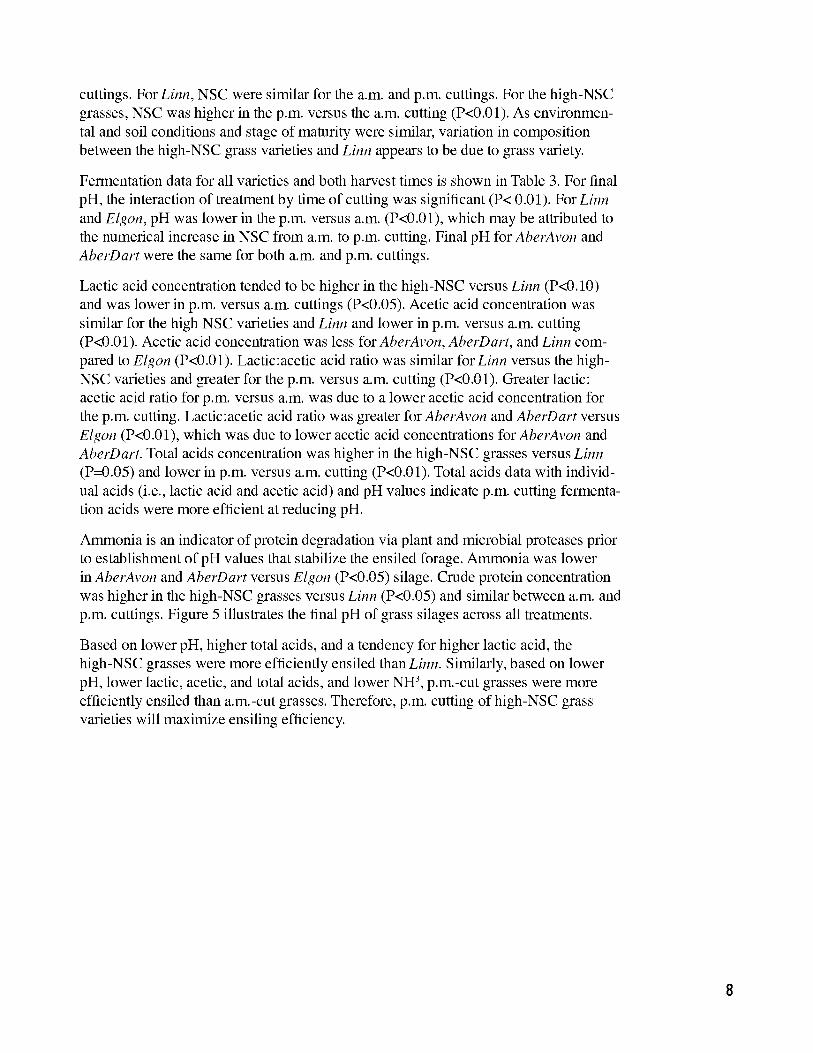
cuttings. For Linn, NSC were similar for the a.m. and p.m. cuttings. For the high-NSCgrasses, NSC was higher in the p.m. versus the a.m. cutting (P<0.01). As environmen-tal and soil conditions and stage of maturity were similar, variation in compositionbetween the high-NSC grass varieties and Linn appears to be due to grass variety.
Fermentation data for all varieties and both harvest times is shown in Table 3. For finalpH, the interaction of treatment by time of cutting was significant (P< 0.01). For Linnand Elgon, pH was lower in the p.m. versus a.m. (P<0.0 1), which may be attributed tothe numerical increase in NSC from a.m. to p.m. cutting. Final pH forAberAvon andAberDart were the same for both a.m. and p.m. cuttings.
Lactic acid concentration tended to be higher in the high-NSC versus Linn (P<0.10)and was lower in p.m. versus a.m. cuttings (P<0.05). Acetic acid concentration wassimilar for the high NSC varieties and Linn and lower in p.m. versus a.m. cutting(P<0.01). Acetic acid concentration was less for AberAvon, AberDart, and Linn com-pared to Elgon (P<0.01). Lactic:acetic acid ratio was similar for Linn versus the high-NSC varieties and greater for the p.m. versus a.m. cutting (P<0.01). Greater lactic:acetic acid ratio for p.m. versus a.m. was due to a lower acetic acid concentration forthe p.m. cutting. Lactic:acetic acid ratio was greater for AberAvon and AberDart versusElgon (P<0.01), which was due to lower acetic acid concentrations for AberAvon andAberDart. Total acids concentration was higher in the high-NSC grasses versus Linn(P=0.05) and lower in p.m. versus a.m. cutting (P<0.01). Total acids data with individ-ual acids (i.e., lactic acid and acetic acid) and pH values indicate p.m. cutting fermenta-tion acids were more efficient at reducing pH.
Ammonia is an indicator of protein degradation via plant and microbial proteases priorto establishment of pH values that stabilize the ensiled forage. Ammonia was lowerin AberAvon and AberDart versus Elgon (P<0.05) silage. Crude protein concentrationwas higher in the high-NSC grasses versus Linn (P<0.05) and similar between a.m. andp.m. cuttings. Figure 5 illustrates the final pH of grass silages across all treatments.
Based on lower pH, higher total acids, and a tendency for higher lactic acid, thehigh-NSC grasses were more efficiently ensiled than Linn. Similarly, based on lowerpH, lower lactic, acetic, and total acids, and lower NH3, p.m.-cut grasses were moreefficiently ensiled than a.m.-cut grasses. Therefore, p.m. cutting of high-NSC grassvarieties will maximize ensiling efficiency.
8

Table 2. Composition of fresh grasses by treatment and cutting time.
Treatment' Cutting
Item Linn AberAvon AberDart Elgon SE AM PM SE P2
DM 19.9a 18.2b 18.6b 17.3° 0.30 17.5 19.6 0.21 C**, CS**WSC 14.9a 18.5b 17.8b 17.3b 0.28 14.4 19.9 0.23 C*, CS**NDF 40.0a 33.61 34.5bc 35.0c 0.37 37.0 34.5 0.26 C**, CS**ADF 23.6a 18.9d 19.7° 20.3' 0.20 21.5 19.8 0.14 C**, CS**CP 22. la 24.5c 230ab 23.8'c 0.41 23.9 22.8 0.29 C*, CS**
'Control WSC (Linn); high WSC (AberAvon, AberDart, Elgon). Means within the same row with different super-scripts differ at P <0.05.2C=Cutting; CS=Contrast statement (the three high WSC varieties compared to Linn)*P < 0.05**P < 0.01
Table 3. Fermentation profile of ensiled grasses by treatment and cutting time.Treatment' Cutting
Item Linn AberAvon AberDart Elgon SE AM PM SE P2
DM, % 19.3° 17.7b 18.110 16.3a 0.40 16.3 19.4 0.28 C**Final pH 4.3a 4.01 4.01 4.1b 0.12 4.5 4.1 0.11 C* CS**Lactic acid 13.9a 14.7ab 15.5° 15.210 0.42 15.3 14.30.30 C*, CS*Acetic acid 2.45a 2.44a 2.47a 3.051 0.09 2.99 2.22 0.06 C**Lactic:Acetic3 5.771 6.101c 6.400 5.13a 0.15 5.18 6.52 0.11 C**
Total acids 16.4a 17.2ab 17.9bc 18.2c 0.47 18.3 16.6 0.34 C** CS*
Ammonia4 1.87a 1.78a 1.83a 2.161 0.08 2.31 1.51 0.06 C**
CP 22.5a 24.11 23.5ab 24.2' 0.39 24.0 23.20.28 CS*
Ammonia' 8.17ab 7.33a 7.83ab 8.831 0.40 9.67 6.42 0.28 C**
'Control NSC (Linn); high WSC varieties, AberAvon, AberDart, and Elgon. Means within the same row with dif-ferent superscripts differ at P <0.05.
2C=Cutting; CS=Contrast statement (the three high WSC varieties compared to Linn)
3Lactic:Acetic acid ratio'Crude protein equivalent percent
'N, % of total N*P < 0.05
**P < 0.01
9

25
20
z o AberAvon15
AberDart
'; Elgona,a 10 Linn
5
0
a.m. p.m.
Figure 4. Nonstructural carbohydrate levels of fresh grass.
4 35.
4 3.
4 25.
4 2
AberAvon
.
C.4 15
AberDart
Elgon.
Linn4.1
4 05.
4 Ta.m. p.m.
Figure 5. Final pH of grass silages cut in the a.m. and p.m.
10
Conclusions
This 2-year project has been helpful in characterizing nonstructural carbohydrates incool-season grasses. We have learned a lot about the normal fluctuations seen acrossenvironments and, more specifically, variations due to genetic differences. The mainconclusions are:
1. Percentages of nonstructural carbohydrate are highly variable throughout the grow-ing season and between species and varieties of cool-season forage grasses.
2. Growth rate may affect the level of TNC in cool-season forage grasses.
3. Consistently, orchard grasses contained lower levels of TNC and had higher DMyields than ryegrasses.
4. Grasses bred in Europe to emphasize nonstructural carbohydrates are higher insugars than the average of the population found in the U.S.
References
Breirem, K. and T. Homb. 1970. Formiddler og forkonservering. Forlag Buskap ogAvdrattA.S., GjOvik, Norway.
Chemey, J.H. and D.J.R. Chemey. 2003. Assessing silage quality. Pages 141-198 inSilage Science and Technology. D.R. Buxton, R. Muck, and J. Harrison, eds. ASA,CSSA, and SSSA, Madison, WI.
Downing, T., A. Buyserie, P. French, and M. Gamroth. 2004. Nonstructural carbohy-drates in cool-season grasses. American Forages and Grasslands Council Proceed-ings, Vol. 13, pg. 90.
Fisher, D.S., H.F. Mayland, and J.C. Bums. 1999. Variation in ruminant's preferencefor tall fescue hays cut either at sundown or at sunup. J. Anim. Sci. 77:762-768.
Humphreys, M.O. 1989a. Water-soluble carbohydrates in perennial ryegrass breeding.1. Genetic differences among cultivars and hybrid progeny grown as spaced plants.Grass and Forage Sci. 44:231-236.
Humphreys, M.O. 1989b. Water-soluble carbohydrates in perennial ryegrass breeding.II. Cultivar and hybrid progeny performance in cut plots. Grass and Forage Sci.44:237-244.
Humphreys, M.O. 1989c. Water-soluble carbohydrates in perennial ryegrass breeding.III. Relationships with herbage production, digestibility and crude protein content.Grass and Forage Sci. 44:423-430.
Lee, L.A., E.L. Jones, M.O. Humphreys, J.M. Moorby, M.S. Dhanoa, M.K.Theodorou, J.C. Macrae, and N.D. Scollan. 1999. Increased live weight gainfrom pre-weaned lambs grazing Lolium perenne selected for high water-solublecarbohydrate concentrations. IX International Symposium on Ruminant Physiology,Pretoria, South Africa.
11
Lee, M.R.F., E.L. Jones, J.M. Moorby, M.O. Humphreys, M.K. Theodorou, J.C.MacRae, and N.D. Scollan. 2001. Production responses from lambs grazed onLolium perenne selected for an elevated water-soluble carbohydrate concentration.Animal Research. 50:441-449.
MacKay, L.C., H.F. Mayland, and W.P. MacKay. 2003. Horse preference for alfalfa-grass hay harvested in the afternoon or morning. J. Anim Sci., Vol 86, Suppl. 1,W232.
Mayland, H.F., G.E. Shewmaker, P.A. Harrison, and N.J. Chatterton. 2000. Nonstruc-tural carbohydrates in tall fescue cultivars. Agron. J. 92:1203-1206.
McDonald, P. 1981. The Biochemistry of Silage. John Wiley and Sons Ltd., NY
Miller, L.A., M.K. Theodorou, J.C. MacRae, R.T. Evans, A.T. Adesogan, M.O. Hum-phreys, N.D. Scollan, and J.M. Moorby. 1999. Milk production and N partitioningresponses in dairy cows offered perennial ryegrass selected for high water-solublecarbohydrate concentrations. S Afr J Anim Sci 29:281-282.
Miller, L.A., J.M. Moorby, D.R. Davies, M.O. Humphreys, N.D. Scollan, J.C. MacRae,and M.K. Theodorou. 2001. Increased concentration of water-soluble carbohydratein perennial ryegrass (Lolium perenne L.): milk production from late-lactation dairycows. Grass and Forage Sci. 56:383-394.
Oregon Agricultural Statistics Service, 2006-07.
Pettersson, K. and S. Lindgren. 1989. The influence of the carbohydrate fraction andadditives on silage quality. Grass and Forage Sci. 45:223-233.
Rooke, J.A., N.H. Lee, and D.G. Armstrong. 1987. The effects of intraruminal infu-sions of urea, casein, glucose syrup, and a mixture of casein and glucose on nitro-gen digestion in the rumen of cattle receiving grass-silage diets. British J of Nutri-tion 57:89-98.
SAS User's Guide, 1998.
Scollan, N.D., M.R.F. Lee, and E.J. Kim. 1998. Alteration of efficiency of meat pro-duction in beef cattle by manipulating diets. In: Proc 8t' World Conference onAnimal Production, Symposium Series 2, pg. 92.
Shewmaker, G.E., H.F. Mayland, J.C. Burns, and D.S. Fisher. 1999. Diurnal variationin alfalfa quality and implications for testing. Western Alfalfa Improvement Confer-ence Proceedings. Annual Meeting, June 1999, Powell, WY
Smith, D. 1973. The nonstructural carbohydrates. Pages 105-155 in Chemistry andBiochemistry of Herbage. Vol. 1. G.W. Butler and R.W. Bailey, eds. AcademicPress, NY
Tava, A.N., C. Berardo, M. Cunico, M. Romani, and M. Odoardi. 1995. Cultivar dif-ferences and seasonal changes of primary metabolites and flavor constituents in tallfescue in relation to palatability. J Agric. Food Chem. 43(1);98-101.
12

Whittenbury, R., P. McDonald, and D.G. Bryan-Jones. 1967. A short review ofsome biochemical and microbiological aspects of ensilage. J. Sci. Food Agric.18:441-444.
Woolford, M.K. 1984. The Silage Fermentation. Marcel Dekker, Inc. NY, NY.
© 2007 Oregon State University
This publication was produced and distributed in furtherance of the Acts of Congress of May 8 and June 30, 1914.Extension work is a cooperative program of Oregon State University, the U.S. Department of Agriculture, andOregon counties.
Oregon State University Extension Service offers educational programs, activities, and materials withoutdiscrimination based on age, color, disability, gender identity or expression, marital status, national origin, race,religion, sex, sexual orientation, or veteran's status. Oregon State University Extension Service is an EqualOpportunity Employer.
Published November 2007
13