Embed Size (px)
Citation preview
A Call to Reinvent Donor Relationships
The Online Giving Study
by Network for Good and TrueSense Marketing
sponsored by
• The study covers $381 million in online giving through
Network for Good’s platform, including 3.6 million gifts to 66,470 different nonprofits from 2003-2009.
• The online giving experience has a significant impact on
donor loyalty, retention, and gift levels. The more intimate and emotionally coherent the giving experience, the stronger the relationship between donor and nonprofit appears to be. In other words, online fundraising is all about relation-ships, as it is in offline fundraising.
• Personality matters. The loyalty factor for donors acquired through generic giving pages is 66.7% lower than for donors who give via charity-branded giving pages.
• Analysis of cumulative online giving (i.e., giving added up over time) via different pages powered by Network for Good shows that donors who gave via charity websites started at
the highest level and gave the most over time. Those who used giving portals started lower and gave less over time. Those who used social giving opportunities gave the least initially and added little afterward.
• Recurring giving is a major driver of giving over time and should be strongly encouraged in the giving experience.
• Online giving spikes during the month of December and
large-scale disasters. During disasters, donors are more likely to consider new giving options, while in December they are more likely to give based on relationships with the charities.
| 1 |
Executive Summary
This isn’t another study about the rapid growth of online giving (though it is skyrocketing)—it’s a call to reinvent donor relationships. This study of $381 million in giving looks specifically at the online giving experience and finds it is directly tied to donors’ likelihood of giving more—and more often.
About the Study
CONTENTS
It’s Still About Relationships . . . . . . . . . . . 3
The Influence of the Online Giving Experience . . . . . . . . . . . . . 8
December and Disasters Dominate . . . 14
Additional Data . . . . . . . . . . . . . . . . . . . . . . 20
What This Study Examined
• $381 million in online giving
• 3.6 million gifts
• 1.879 million unique donors
• 66,470 different nonprofits
• Seven-year time span (2003-2009)
• Donations from a wide range of nonprofit sizes and types
Not so long ago, all fundraising was done face-to-face. Houses of worship passed the plate. Alms were given to the needy where they were. Do-gooders persuaded people they knew to support their work.
Charitable giving happened in the context of personal relationships.
Then charities began to learn the techniques and disciplines of mar-keting and advertising to expand their reach to more supporters.
What the new breed of professional fundraisers quickly discovered was that the path to success was getting relational with donors—being as much like the old-line, personal methods as possible.
That’s true with major gifts, direct mail, broadcast media, telemarket-ing—and as this study suggests, with online fundraising, too.
Discussions of online fundraising tend to focus on technology and the latest new bell, whistle or widget. Raising funds online is not
about technology, any more than raising funds through the mail
is about paper. It’s about the relationship between the nonprofit and the donor who wants to support a cause. People who give online are no different from other donors in that they expect a relationship—not simply a transaction—with the organization they support.
This isn’t another study about the rapid growth of online giving (though it is skyrocketing). We’re not as concerned with the number of online gifts as with the nature of the online giving experience—and how it impacts donor behavior.
By looking at donor relationships, not just donor transactions, we’ve “uncovered” something a lot of people already knew: The level of connection to an organization that a donor experiences online is
It’s Still About Relationships
directly tied to their likelihood of giving more—and more often. Even small upgrades to the donor experience make a measurable difference in online giving.
While some amount of online giving will be transactional—where donors don’t want a relationship with the organization—there’s no excuse for not improving the online giving experience with the donors who do want a relationship. As this study shows, even a small nonprofit with limited resources can and should make meaningful connections with their donors online.
Online Giving Study | ABOUT THE STUDY
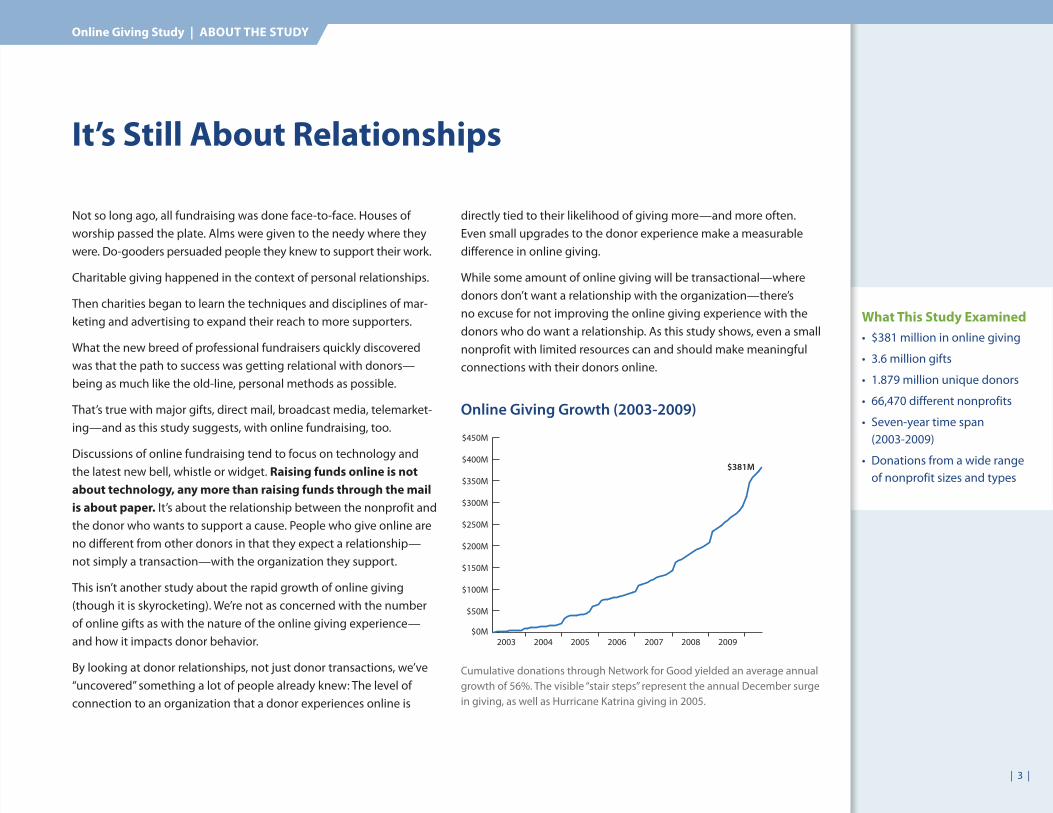
Online Giving Growth (2003-2009)
Cumulative donations through Network for Good yielded an average annual growth of 56%. The visible “stair steps” represent the annual December surge in giving, as well as Hurricane Katrina giving in 2005.
$0M
$50M
$100M
$150M
$200M
$250M
$300M
$350M
$400M
$450M
2009200820072006200520042003
$381M
| 3 |
| 4 |
Key Metrics Considered
in the Study
• How many donors were gained and lost
• How much and how often donors gave
• Where donors were in the long-term donor lifecycle
Why This Study is Different
This study examines donor behavior over time, using TrueSense Marketing’s Donor Health Index, a tool designed to gauge the value and long-term prospects of groups of donors. It looks at key metrics: how many donors were gained and lost, how much and how often donors gave, and where donors were in the long-term donor lifecycle.
It compares giving in different online venues: social networks, giving portals, and charity websites. This presents a glimpse into what donors are doing as giving opportunities become increasingly dispersed all over the Internet.
We have looked at these results, along with our collective experience with online outreach, and sought not to simply present data but also to convey some concrete advice for fundraisers and philanthropists who want to get the most out of using the Internet for good causes.
This study should be viewed as a big-picture survey of a portion of online giving in several of its most common forms—as well as a call to action to improve the experience of online donors.
Scope (and Limitations) of the Study
The data set for this study is limited to donations powered by the Network for Good platform. Any giving that took place on sites that do not use the Network for Good platform or that were made offline are not included. Also, the data do not differentiate what nonprofits are doing to affect donor behavior beyond the giving transaction. Some do a great job connecting with and engaging donors in many ways and through many channels, while others are doing little. What they do and don’t do has a big impact on donor relationships and the metrics we’ve uncovered.
Network for Good processes donations for charities of all sizes, but because we focus our efforts on helping small- to medium-sized nonprofits with their fundraising, there is a strong representation of these nonprofits in our data. There is also a wide range of organizational types.
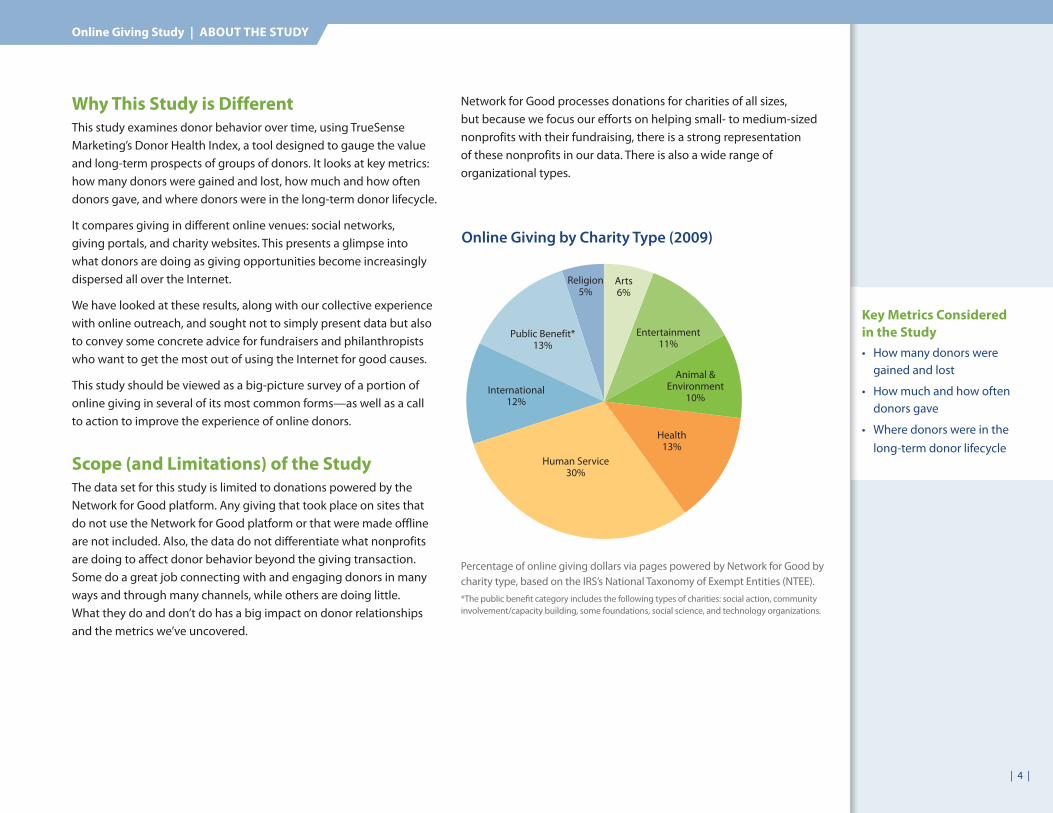
Public Benefit*13%
International 12%
Human Service 30%
Health13%
Animal & Environment
10%
Entertainment11%
Arts6%
Religion5%
Online Giving by Charity Type (2009)
Percentage of online giving dollars via pages powered by Network for Good by charity type, based on the IRS’s National Taxonomy of Exempt Entities (NTEE). *The public benefi t category includes the following types of charities: social action, community involvement/capacity building, some foundations, social science, and technology organizations.
Online Giving Study | ABOUT THE STUDY
| 5 |
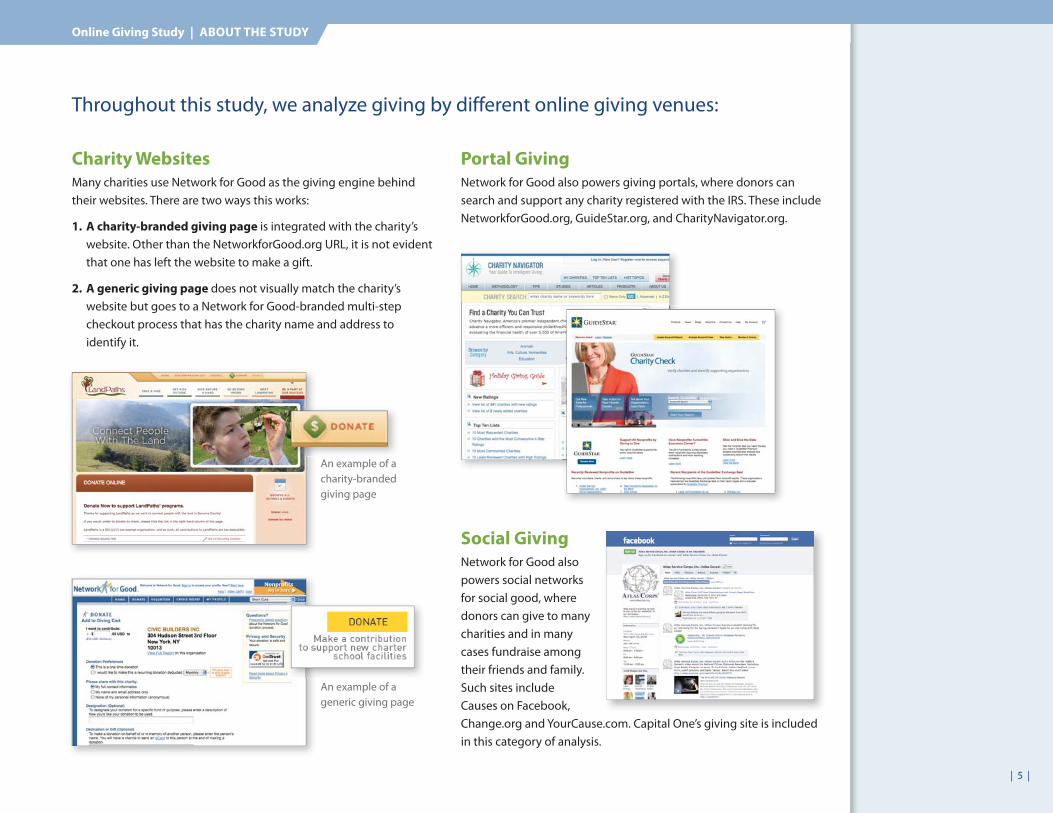
Throughout this study, we analyze giving by different online giving venues:
An example of a charity-branded giving page
An example of a generic giving page
Social Giving
Network for Good also powers social networks for social good, where donors can give to many charities and in many cases fundraise among their friends and family. Such sites include Causes on Facebook, Change.org and YourCause.com. Capital One’s giving site is included in this category of analysis.
Online Giving Study | ABOUT THE STUDY
Charity Websites
Many charities use Network for Good as the giving engine behind their websites. There are two ways this works:
1. A charity-branded giving page is integrated with the charity’s website. Other than the NetworkforGood.org URL, it is not evident that one has left the website to make a gift.
2. A generic giving page does not visually match the charity’s website but goes to a Network for Good-branded multi-step checkout process that has the charity name and address to identify it.
Portal Giving
Network for Good also powers giving portals, where donors can search and support any charity registered with the IRS. These include NetworkforGood.org, GuideStar.org, and CharityNavigator.org.
| 6 |
Who Should Read This
• Nonprofits
• Their funders
How to Read This
This study should be viewed as a big-picture survey of a portion of online giving in several of its most common forms—as well as a call to action to improve the experience of online donors.
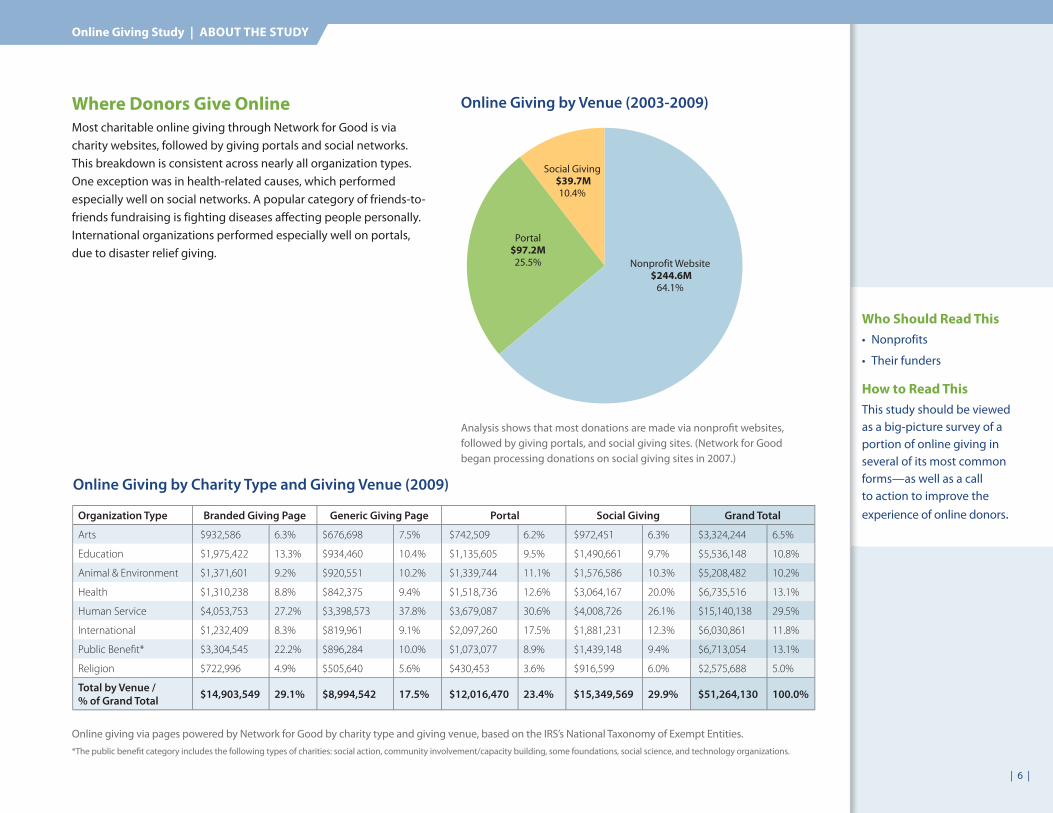
Where Donors Give Online
Most charitable online giving through Network for Good is via charity websites, followed by giving portals and social networks. This breakdown is consistent across nearly all organization types. One exception was in health-related causes, which performed especially well on social networks. A popular category of friends-to-friends fundraising is fighting diseases affecting people personally. International organizations performed especially well on portals, due to disaster relief giving.
Online Giving by Venue (2003-2009)
Analysis shows that most donations are made via nonprofi t websites, followed by giving portals, and social giving sites. (Network for Good began processing donations on social giving sites in 2007.)
Nonprofit Website $244.6M
64.1%
Portal$97.2M
25.5%
Social Giving $39.7M
10.4%
Online Giving Study | ABOUT THE STUDY
Organization Type Branded Giving Page Generic Giving Page Portal Social Giving Grand Total
Arts $932,586 6.3% $676,698 7.5% $742,509 6.2% $972,451 6.3% $3,324,244 6.5%
Education $1,975,422 13.3% $934,460 10.4% $1,135,605 9.5% $1,490,661 9.7% $5,536,148 10.8%
Animal & Environment $1,371,601 9.2% $920,551 10.2% $1,339,744 11.1% $1,576,586 10.3% $5,208,482 10.2%
Health $1,310,238 8.8% $842,375 9.4% $1,518,736 12.6% $3,064,167 20.0% $6,735,516 13.1%
Human Service $4,053,753 27.2% $3,398,573 37.8% $3,679,087 30.6% $4,008,726 26.1% $15,140,138 29.5%
International $1,232,409 8.3% $819,961 9.1% $2,097,260 17.5% $1,881,231 12.3% $6,030,861 11.8%
Public Benefi t* $3,304,545 22.2% $896,284 10.0% $1,073,077 8.9% $1,439,148 9.4% $6,713,054 13.1%
Religion $722,996 4.9% $505,640 5.6% $430,453 3.6% $916,599 6.0% $2,575,688 5.0%
Total by Venue /
% of Grand Total $14,903,549 29.1% $8,994,542 17.5% $12,016,470 23.4% $15,349,569 29.9% $51,264,130 100.0%
Online Giving by Charity Type and Giving Venue (2009)
Online giving via pages powered by Network for Good by charity type and giving venue, based on the IRS’s National Taxonomy of Exempt Entities.*The public benefi t category includes the following types of charities: social action, community involvement/capacity building, some foundations, social science, and technology organizations.
The online giving experience seems to have a significant impact on donor loyalty, retention, and gift levels. The more intimate and emotionally coherent the giving experience online, the stronger the relationship between donor and nonprofit appears to be. In other words, online fundraising is all about relationships.
The Online Giving Experience
| 8 |
Donor Retention
In analyzing online giving, it is clear that the better the online experience is for donors, the higher the retention rate over time.
How Donors Give
The online donor experience seems to have a significant impact on donor loyalty, retention, and gift levels. The more intimate and emotionally coherent the giving experience online, the stronger the relationship between donor and nonprofit appears to be. In other words, online fundraising is all about relationships. This is no surprise for experienced fundraisers. It’s just as fundraisers have experienced in every other medium in history, from street panhandling to direct mail to television.
Online relationships are often deeply affected by offline connec-tions and cultivation. It’s increasingly common for donors to switch among channels. They might get converted via telemarketing, then renew their gift online, then perhaps respond to an offline appeal. While outside the scope of this study, there’s plenty of evidence that donors who give both online and off are the most loyal and valuable. Multi-channel cultivation that blends online and offline elements is the best cultivation.
Donor Value Varies by Online Venue
Cumulative giving over time is a key metric for measuring donor re-lationships. It’s the number nonprofits should heed in order to make the right strategic choices. In the best relationships, a donor gives repeatedly over time, creating rising cumulative value. Donor support may include not only single gifts but sustained, monthly giving and planned gifts. In weak relationships, more donors lapse—stop giving —and the cumulative giving goes flat.
Fundraisers tend to not pay close attention to cumulative online donor value for a variety of reasons. One might be that because the
direct costs are lower than with direct mail, fundraisers are less focused on return on investment. Another explanation is that fundraisers are simply not organized to understand donor value online and across channels because of silos in their organization or a lack of one unified donor database. If fundraisers don’t have a complete, clear view of their donors and an understanding of why and where they are giving, they cannot effectively cultivate them. This makes synergies among channels purely accidental and severely limits online fundraising potential.
The Influence of the Online Giving Experience
$100
$150
$200
$250
$300
200920082007
Charity WebsiteGiving PortalSocial Giving
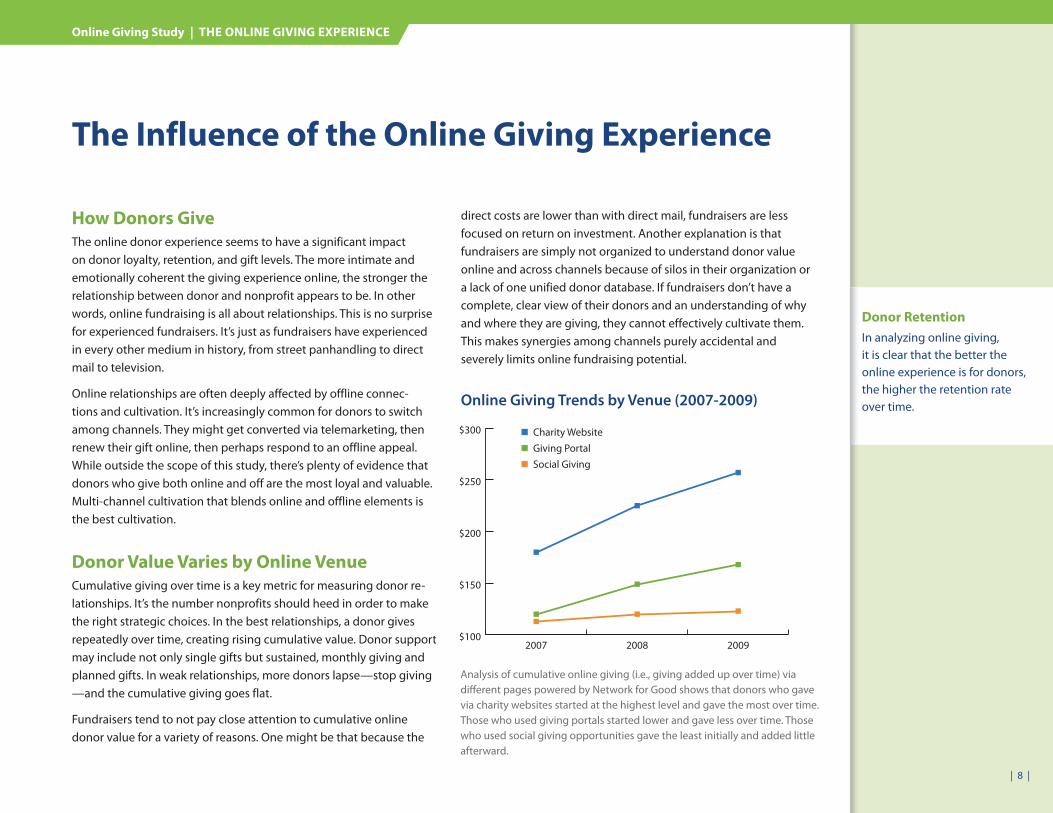
Online Giving Trends by Venue (2007-2009)
Analysis of cumulative online giving (i.e., giving added up over time) via diff erent pages powered by Network for Good shows that donors who gave via charity websites started at the highest level and gave the most over time. Those who used giving portals started lower and gave less over time. Those who used social giving opportunities gave the least initially and added little afterward.
Online Giving Study | THE ONLINE GIVING EXPERIENCE
| 9 |
Personality Matters!
The difference in donor experience has a significant impact on giving levels. The loyalty factor (i.e., repeat giving) for donors acquired through generic giving pages is 66.7% lower than for donors who give via charity-branded giving pages.
Charity Website Giving:
Strong Relationship, Highest Value
Many charities use Network for Good as the giving engine behind their own websites.
Donors who gave through charity-branded websites powered by Network for Good started at the highest amounts—$180 in 2007. By the end of 2009, the average cumulative giving per donor had risen to $257, a 42.8% climb in value in two years compared to a 40.0% rise for portals and 8.8% for social networking sites.
Your Personality Online:
Even a Little Goes a Long Way
The importance of the donor-charity connection is heavily under-scored by the findings of the research analysis of the fundraising results of charities using Network for Good to process donations on their websites. As described in the introduction of this study, there are two types of website giving pages offered through Network for Good:
1. A charity-branded giving page is integrated with the charity’s website. Other than the NetworkforGood.org URL, it is not evident that one has left the website to make a gift.
2. A generic giving page does not visually match the charity’s website but goes to a Network for Good-branded multi-step checkout process with the charity’s name and address as the only personalization.
The difference in donor experience has a significant impact on giving levels. In addition to the degree of charity branding, other factors affecting the donor experience are the login required for generic giving pages and the multi-page checkout process.
$150
$200
$250
$300
200920082007
Charity-Branded PagesGeneric Pages
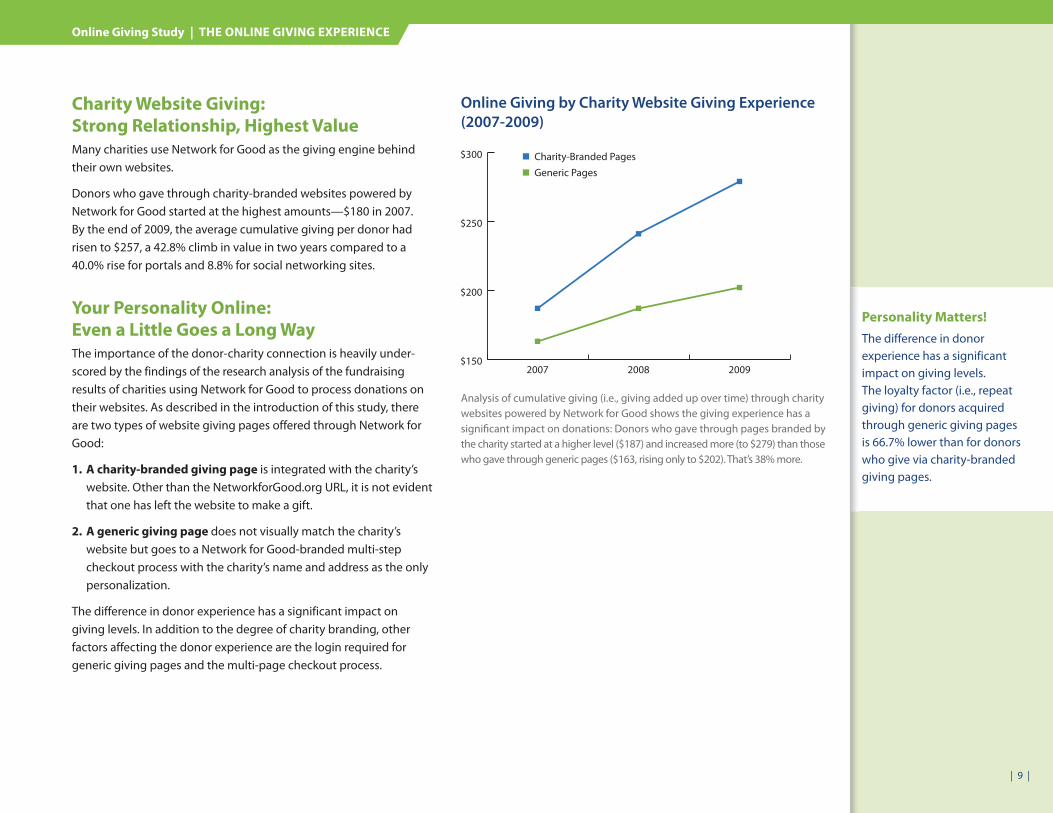
Online Giving by Charity Website Giving Experience
(2007-2009)
Analysis of cumulative giving (i.e., giving added up over time) through charity websites powered by Network for Good shows the giving experience has a signifi cant impact on donations: Donors who gave through pages branded by the charity started at a higher level ($187) and increased more (to $279) than those who gave through generic pages ($163, rising only to $202). That’s 38% more.
Online Giving Study | THE ONLINE GIVING EXPERIENCE
| 10 |
TIPS
Encourage Recurring Gifts
Because recurring giving is one of the key drivers of donor value, nonprofits should encourage this behavior:
• Always offer a recurring gift option on your giving page.
• Monthly giving is the most popular choice, so make that one the easiest for donors to do.
• Present a compelling reason to give monthly, whether it’s a greater impact or convenience.
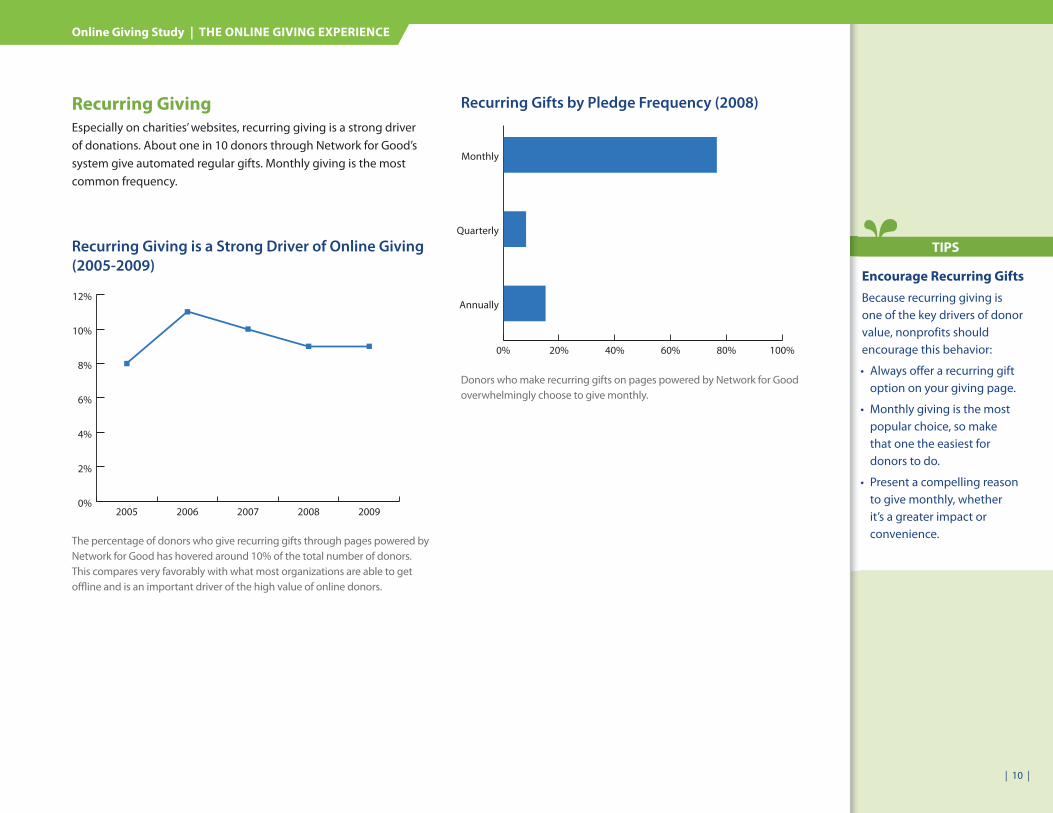
Recurring Gifts by Pledge Frequency (2008)
Donors who make recurring gifts on pages powered by Network for Good overwhelmingly choose to give monthly.
0% 20% 40% 60% 80% 100%
Annually
Quarterly
Monthly
Online Giving Study | THE ONLINE GIVING EXPERIENCE
Recurring Giving
Especially on charities’ websites, recurring giving is a strong driver of donations. About one in 10 donors through Network for Good’s system give automated regular gifts. Monthly giving is the most common frequency.
Recurring Giving is a Strong Driver of Online Giving
(2005-2009)
The percentage of donors who give recurring gifts through pages powered by Network for Good has hovered around 10% of the total number of donors. This compares very favorably with what most organizations are able to get offl ine and is an important driver of the high value of online donors.
0%
2%
4%
6%
8%
10%
12%
20092008200720062005
| 11 |
TIPS
Cultivate Donors from
Portals and Social
Network Sites
• Thank donors promptly and thoroughly. Assume they don’t know much about your organization.
• Keep your organization’s profile up to date (contact info, mission, etc.).
• Declutter your site. Make your homepage clear, uncomplicated, and designed to encourage giving from visitors arriving from portals.
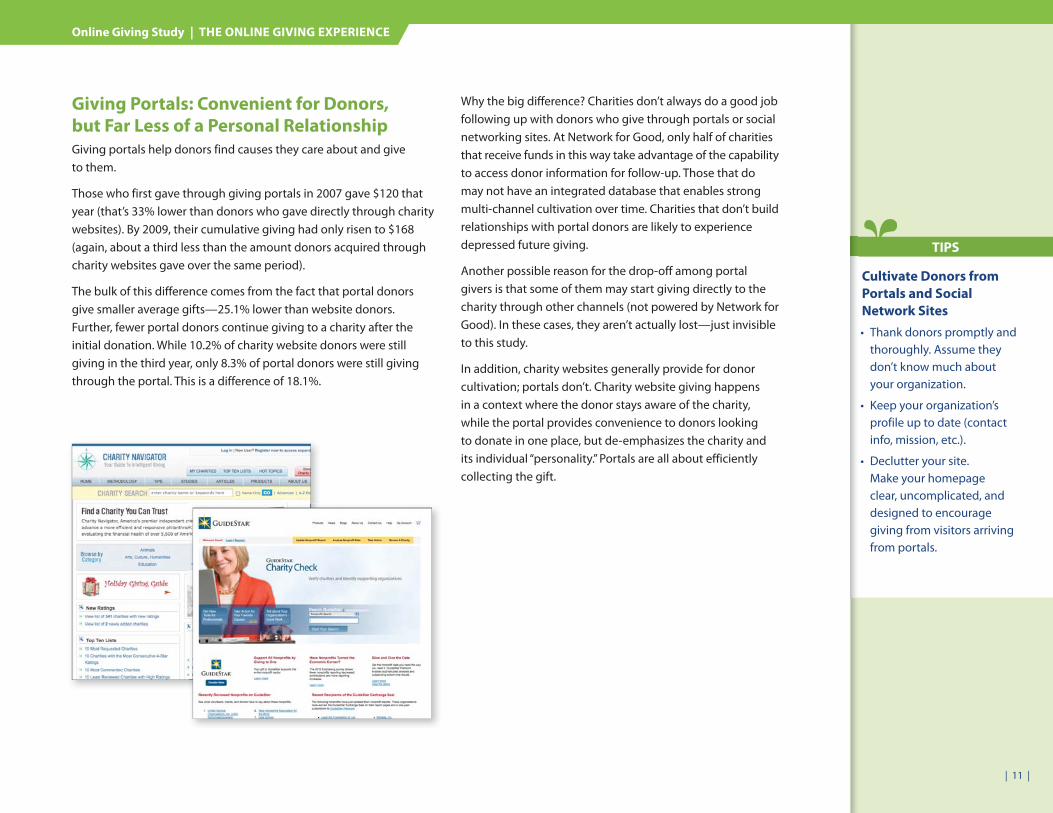
Giving Portals: Convenient for Donors,
but Far Less of a Personal Relationship
Giving portals help donors find causes they care about and give to them.
Those who first gave through giving portals in 2007 gave $120 that year (that’s 33% lower than donors who gave directly through charity websites). By 2009, their cumulative giving had only risen to $168 (again, about a third less than the amount donors acquired through charity websites gave over the same period).
The bulk of this difference comes from the fact that portal donors give smaller average gifts—25.1% lower than website donors. Further, fewer portal donors continue giving to a charity after the initial donation. While 10.2% of charity website donors were still giving in the third year, only 8.3% of portal donors were still giving through the portal. This is a difference of 18.1%.
Online Giving Study | THE ONLINE GIVING EXPERIENCE
Why the big difference? Charities don’t always do a good job following up with donors who give through portals or social networking sites. At Network for Good, only half of charities that receive funds in this way take advantage of the capability to access donor information for follow-up. Those that do may not have an integrated database that enables strong multi-channel cultivation over time. Charities that don’t build relationships with portal donors are likely to experience depressed future giving.
Another possible reason for the drop-off among portal givers is that some of them may start giving directly to the charity through other channels (not powered by Network for Good). In these cases, they aren’t actually lost—just invisible to this study.
In addition, charity websites generally provide for donor cultivation; portals don’t. Charity website giving happens in a context where the donor stays aware of the charity, while the portal provides convenience to donors looking to donate in one place, but de-emphasizes the charity and its individual “personality.” Portals are all about efficiently collecting the gift.
| 12 |
The weak relationship between donor and nonprofit in the giving experience also could depress giving levels. In many cases, donors give through social sites because of a relationship with a friend rather than with the charity they support. Or, they are making a gift out of a fleeting impulse or a sense of convenience. This results in a one-time gift but does not establish the solid relationship with the charity. Special follow-up is required to build on this more tenuous donor-nonprofit relationship.
Lower-Relationship Online Giving
is Here to Stay
Nonprofits should not conclude that giving portals and social networking charity sites are a bad thing. They are a valuable service to donors, and they’re proliferating. They likely funnel gifts to organizations that wouldn’t have received them otherwise.
They also probably serve as an “entryway” or “on-ramp” for people who are new to charitable giving or your cause. Think of the portals as the online equivalent of the famous Salvation Army Red Kettles, occupying street corners and gathering a kind of “impulse giving.”
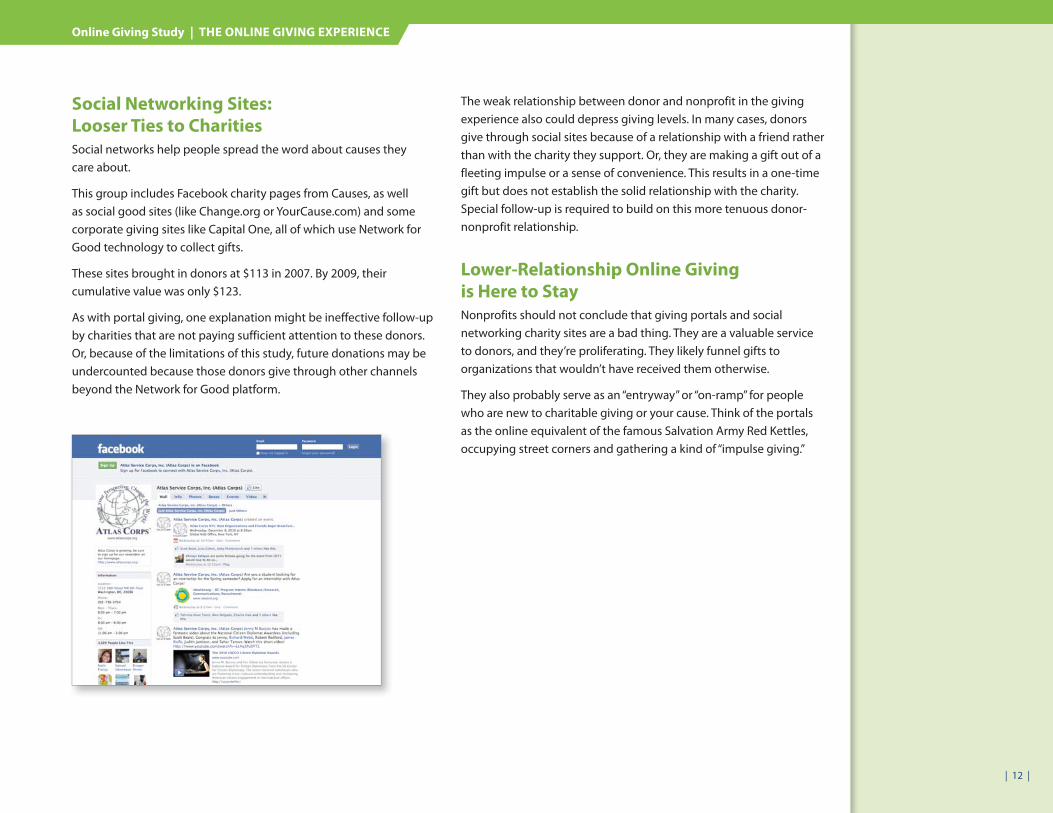
Social Networking Sites:
Looser Ties to Charities
Social networks help people spread the word about causes they care about.
This group includes Facebook charity pages from Causes, as well as social good sites (like Change.org or YourCause.com) and some corporate giving sites like Capital One, all of which use Network for Good technology to collect gifts.
These sites brought in donors at $113 in 2007. By 2009, their cumulative value was only $123.
As with portal giving, one explanation might be ineffective follow-up by charities that are not paying sufficient attention to these donors. Or, because of the limitations of this study, future donations may be undercounted because those donors give through other channels beyond the Network for Good platform.
Online Giving Study | THE ONLINE GIVING EXPERIENCE
Online giving spikes during the month of December and large-scale disasters. During disasters, donors are more likely to consider new giving options, while in December, they’re more likely to give based on relationships with the charities.
The Spiky Nature of Online Giving
| 14 |
December Donors Are
Worth More
Donors who gave first in December had a three-year cumulative value that’s 51.8% higher than donors in the other 11 months.
Online Giving Study | THE SPIKY NATURE OF ONLINE GIVING
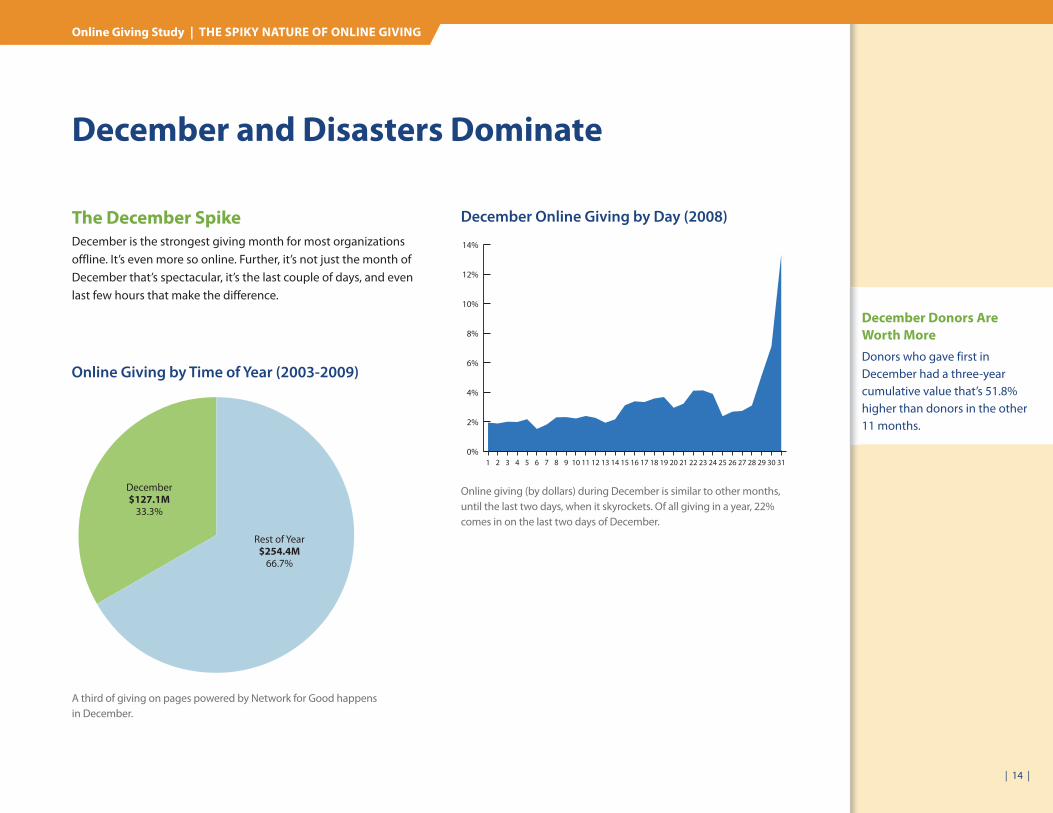
The December Spike
December is the strongest giving month for most organizations offline. It’s even more so online. Further, it’s not just the month of December that’s spectacular, it’s the last couple of days, and even last few hours that make the difference.
Online Giving by Time of Year (2003-2009)
A third of giving on pages powered by Network for Good happens in December.
December$127.1M
33.3%
Rest of Year$254.4M
66.7%
December Online Giving by Day (2008)
Online giving (by dollars) during December is similar to other months, until the last two days, when it skyrockets. Of all giving in a year, 22% comes in on the last two days of December.
0%
2%
4%
6%
8%
10%
12%
14%
31302928272625242322212019181716151413121110987654321
December and Disasters Dominate
| 15 |
TIPS
Maximize December
Donations
• Start early. Get your website and email house in order. During the last few days of the year, change your website to make donation collecting the focus of the homepage. Make your best offer to the donor (it’s not about you).
• Prime the pump. Start building your email list and relationships with your sup-porters in the fall.
• During the last week of the
year, send several emails.
Pull out the stops on social networking sites. Create a countdown campaign and remind supporters they can give until midnight local time on the 31st.
• Email early on the 31st.
Mail in the morning so you’ll be near the top of inboxes.
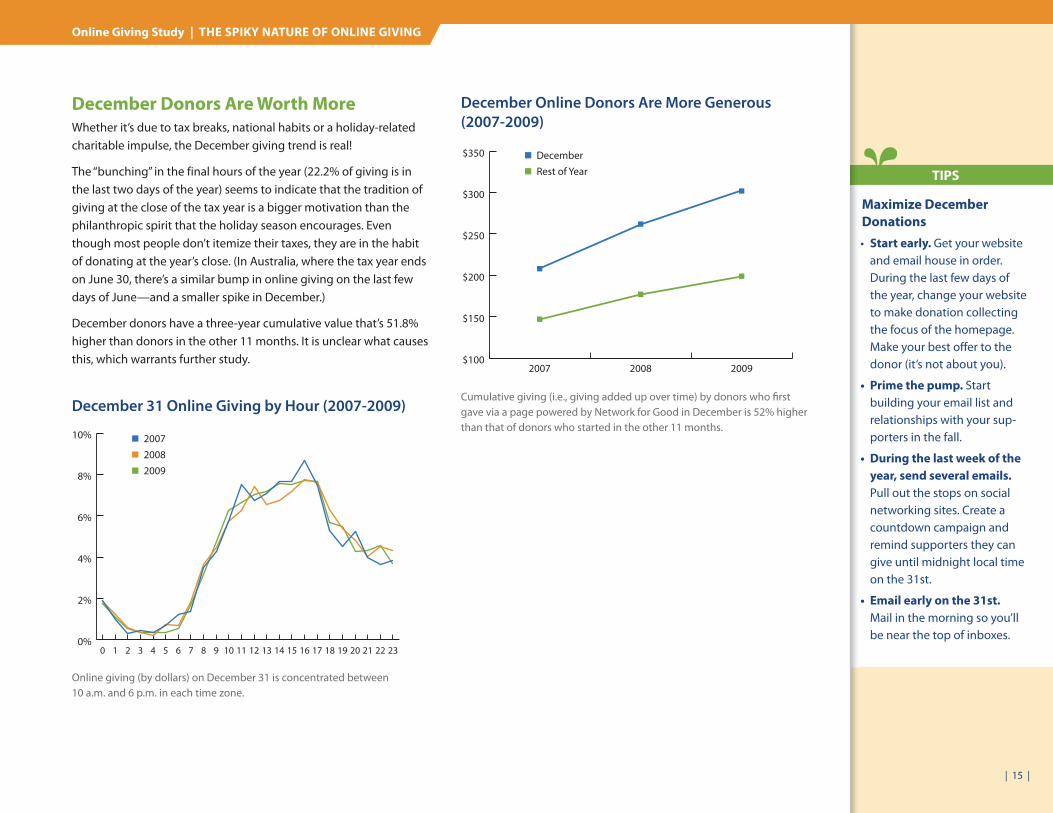
December Donors Are Worth More
Whether it’s due to tax breaks, national habits or a holiday-related charitable impulse, the December giving trend is real!
The “bunching” in the final hours of the year (22.2% of giving is in the last two days of the year) seems to indicate that the tradition of giving at the close of the tax year is a bigger motivation than the philanthropic spirit that the holiday season encourages. Even though most people don’t itemize their taxes, they are in the habit of donating at the year’s close. (In Australia, where the tax year ends on June 30, there’s a similar bump in online giving on the last few days of June—and a smaller spike in December.)
December donors have a three-year cumulative value that’s 51.8% higher than donors in the other 11 months. It is unclear what causes this, which warrants further study.
December Online Donors Are More Generous
(2007-2009)
$100
$150
$200
$250
$300
$350
200920082007
DecemberRest of Year
Cumulative giving (i.e., giving added up over time) by donors who fi rst gave via a page powered by Network for Good in December is 52% higher than that of donors who started in the other 11 months.
Online Giving Study | THE SPIKY NATURE OF ONLINE GIVING
December 31 Online Giving by Hour (2007-2009)
Online giving (by dollars) on December 31 is concentrated between 10 a.m. and 6 p.m. in each time zone.
0%
2%
4%
6%
8%
10%
23222120191817161514131211109876543210
200720082009
| 16 |
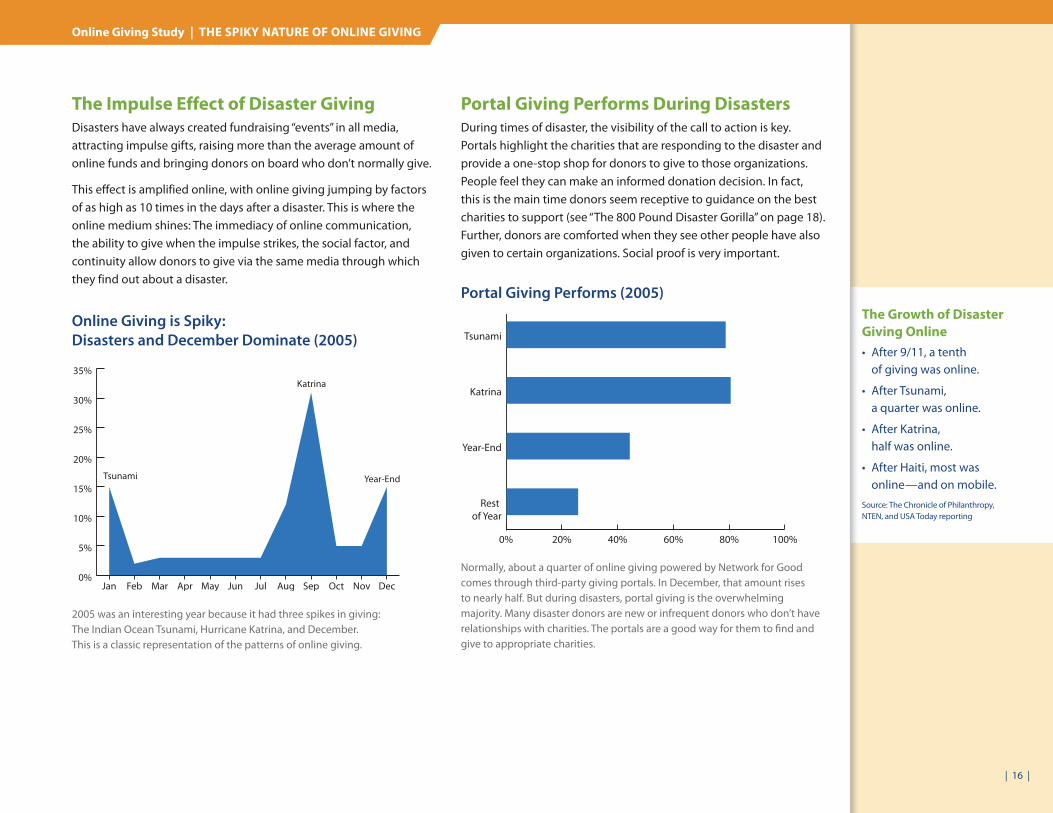
The Growth of Disaster
Giving Online
• After 9/11, a tenth of giving was online.
• After Tsunami, a quarter was online.
• After Katrina, half was online.
• After Haiti, most was online—and on mobile.
Source: The Chronicle of Philanthropy, NTEN, and USA Today reporting
The Impulse Effect of Disaster Giving
Disasters have always created fundraising “events” in all media, attracting impulse gifts, raising more than the average amount of online funds and bringing donors on board who don’t normally give.
This effect is amplified online, with online giving jumping by factors of as high as 10 times in the days after a disaster. This is where the online medium shines: The immediacy of online communication, the ability to give when the impulse strikes, the social factor, and continuity allow donors to give via the same media through which they find out about a disaster.
Online Giving Study | THE SPIKY NATURE OF ONLINE GIVING
Portal Giving Performs During Disasters
During times of disaster, the visibility of the call to action is key.Portals highlight the charities that are responding to the disaster and provide a one-stop shop for donors to give to those organizations. People feel they can make an informed donation decision. In fact, this is the main time donors seem receptive to guidance on the best charities to support (see “The 800 Pound Disaster Gorilla” on page 18). Further, donors are comforted when they see other people have also given to certain organizations. Social proof is very important.
Online Giving is Spiky:
Disasters and December Dominate (2005)
0%
5%
10%
15%
20%
25%
30%
35%
DecNovOctSepAugJulJunMayAprMarFebJan
Tsunami
Katrina
Year-End
2005 was an interesting year because it had three spikes in giving: The Indian Ocean Tsunami, Hurricane Katrina, and December. This is a classic representation of the patterns of online giving.
0% 20% 40% 60% 80% 100%
Rest of Year
Year-End
Katrina
Tsunami
Portal Giving Performs (2005)
Normally, about a quarter of online giving powered by Network for Good comes through third-party giving portals. In December, that amount rises to nearly half. But during disasters, portal giving is the overwhelming majority. Many disaster donors are new or infrequent donors who don’t have relationships with charities. The portals are a good way for them to fi nd and give to appropriate charities.
| 17 |
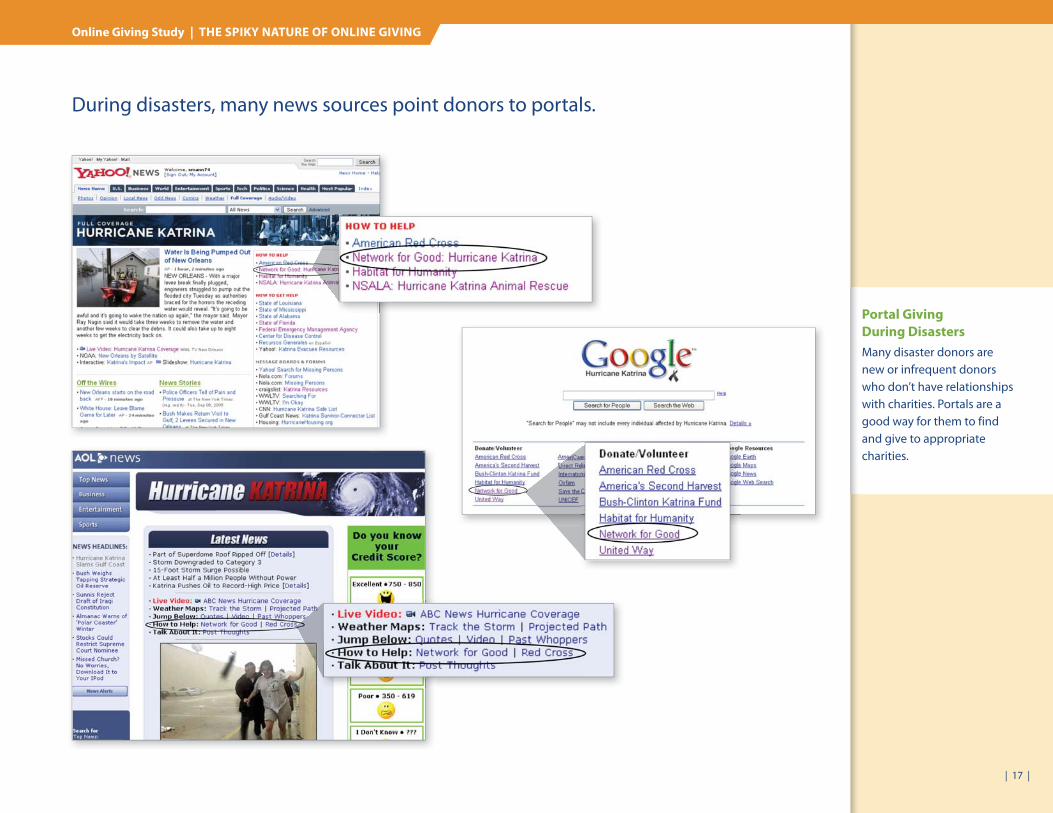
Portal Giving
During Disasters
Many disaster donors are new or infrequent donors who don’t have relationships with charities. Portals are a good way for them to find and give to appropriate charities.
During disasters, many news sources point donors to portals.
Online Giving Study | THE SPIKY NATURE OF ONLINE GIVING
| 18 |
TIPS
Manage Disaster Giving
• During large-scale disasters,
smaller nonprofits should work hard to be featured on portals, where they can gain visibility.
• Think beyond large-scale
disasters. A disaster doesn’t have to be global to motivate a higher level of giving. There are several kinds of disasters that can spur giving, including local severe weather incidents, disasters that result in damage to your organization’s property, and disasters elsewhere in the world that are of concern to local ethnic and cultural communities.
• Institute stewardship
processes for disaster-related gifts to improve your chances of retaining and upgrading those donors.
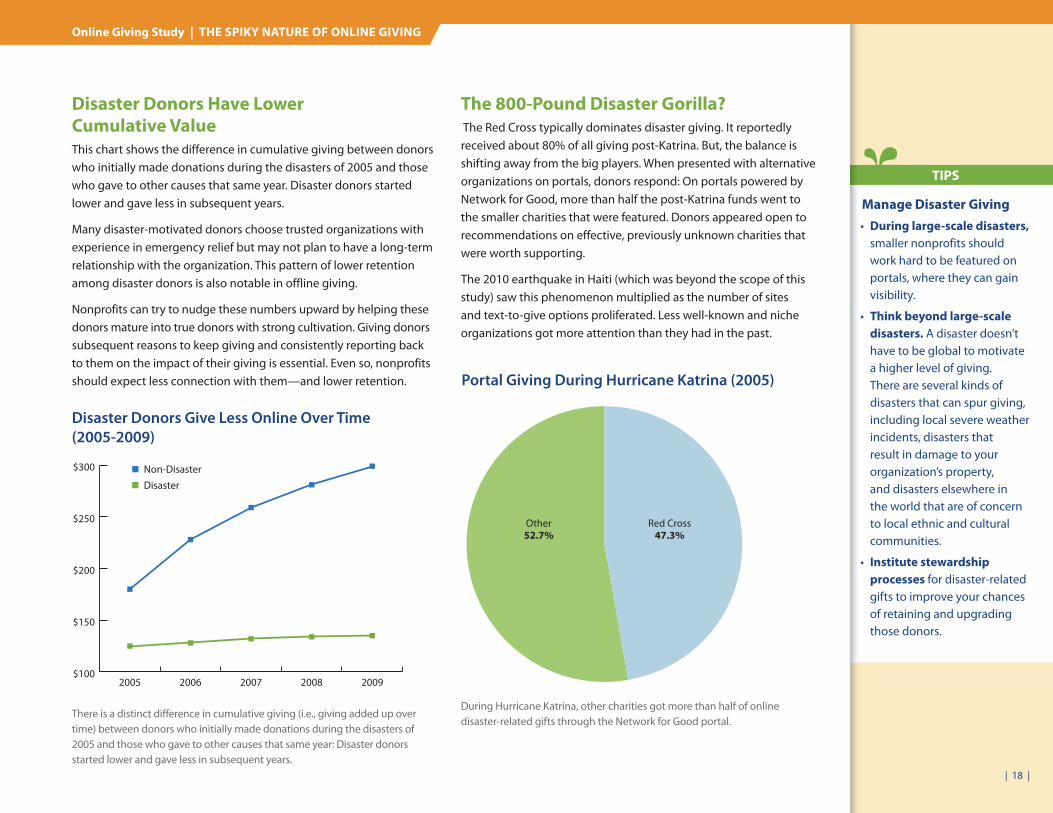
Disaster Donors Have Lower
Cumulative Value
This chart shows the difference in cumulative giving between donors who initially made donations during the disasters of 2005 and those who gave to other causes that same year. Disaster donors started lower and gave less in subsequent years.
Many disaster-motivated donors choose trusted organizations with experience in emergency relief but may not plan to have a long-term relationship with the organization. This pattern of lower retention among disaster donors is also notable in offline giving.
Nonprofits can try to nudge these numbers upward by helping these donors mature into true donors with strong cultivation. Giving donors subsequent reasons to keep giving and consistently reporting back to them on the impact of their giving is essential. Even so, nonprofits should expect less connection with them—and lower retention.
The 800-Pound Disaster Gorilla?
The Red Cross typically dominates disaster giving. It reportedly received about 80% of all giving post-Katrina. But, the balance is shifting away from the big players. When presented with alternative organizations on portals, donors respond: On portals powered by Network for Good, more than half the post-Katrina funds went to the smaller charities that were featured. Donors appeared open to recommendations on effective, previously unknown charities that were worth supporting.
The 2010 earthquake in Haiti (which was beyond the scope of this study) saw this phenomenon multiplied as the number of sites and text-to-give options proliferated. Less well-known and niche organizations got more attention than they had in the past.
Disaster Donors Give Less Online Over Time
(2005-2009)
$100
$150
$200
$250
$300
20092008200720062005
Non-DisasterDisaster
There is a distinct diff erence in cumulative giving (i.e., giving added up over time) between donors who initially made donations during the disasters of 2005 and those who gave to other causes that same year: Disaster donors started lower and gave less in subsequent years.
Portal Giving During Hurricane Katrina (2005)
During Hurricane Katrina, other charities got more than half of online disaster-related gifts through the Network for Good portal.
Other52.7%
Red Cross47.3%
Online Giving Study | THE SPIKY NATURE OF ONLINE GIVING
The following data from the research is fun and interesting—but not necessarily actionable. It shows when people donate and what states were most generous in their online giving.
Appendix
| 20 |
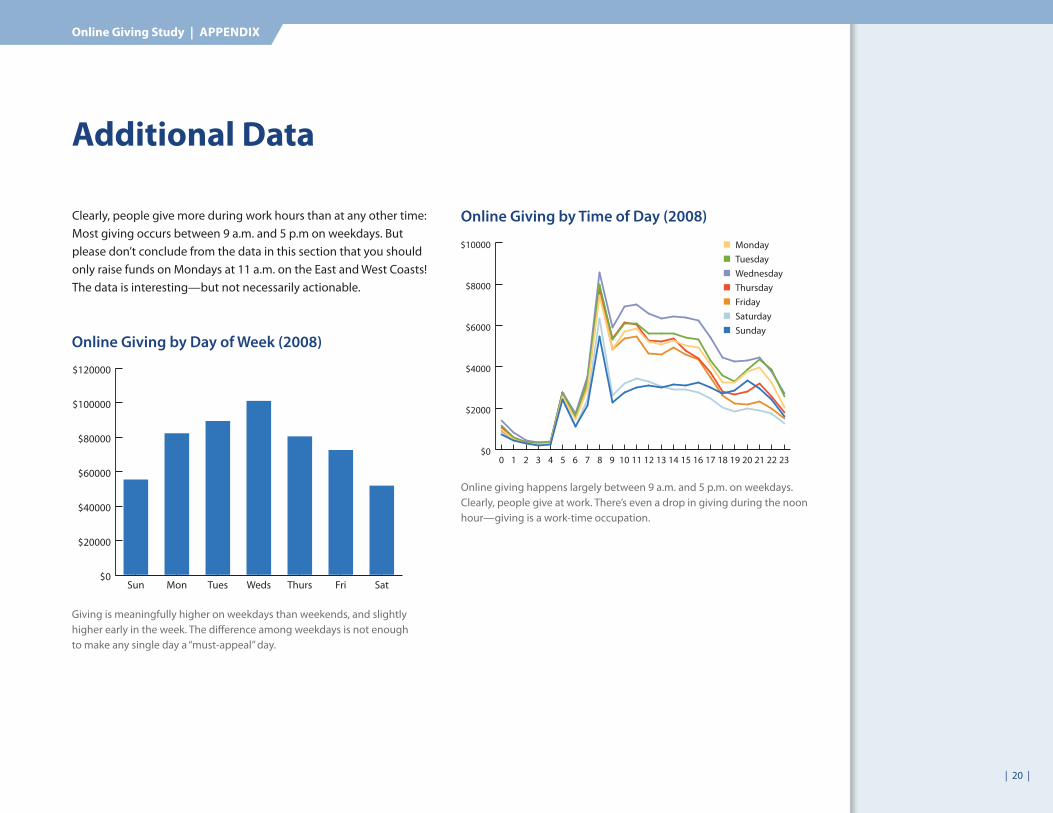
Clearly, people give more during work hours than at any other time: Most giving occurs between 9 a.m. and 5 p.m on weekdays. But please don’t conclude from the data in this section that you should only raise funds on Mondays at 11 a.m. on the East and West Coasts! The data is interesting—but not necessarily actionable.
Additional Data
Online Giving Study | APPENDIX
Online Giving by Time of Day (2008)
Online giving happens largely between 9 a.m. and 5 p.m. on weekdays. Clearly, people give at work. There’s even a drop in giving during the noon hour—giving is a work-time occupation.
Online Giving by Day of Week (2008)
Giving is meaningfully higher on weekdays than weekends, and slightly higher early in the week. The diff erence among weekdays is not enough to make any single day a “must-appeal” day.
$0
$20000
$40000
$60000
$80000
$100000
$120000
SatFriThursWedsTuesMonSun
MondayTuesdayWednesdayThursdayFridaySaturdaySunday
$0
$2000
$4000
$6000
$8000
$10000
23222120191817161514131211109876543210
| 21 |
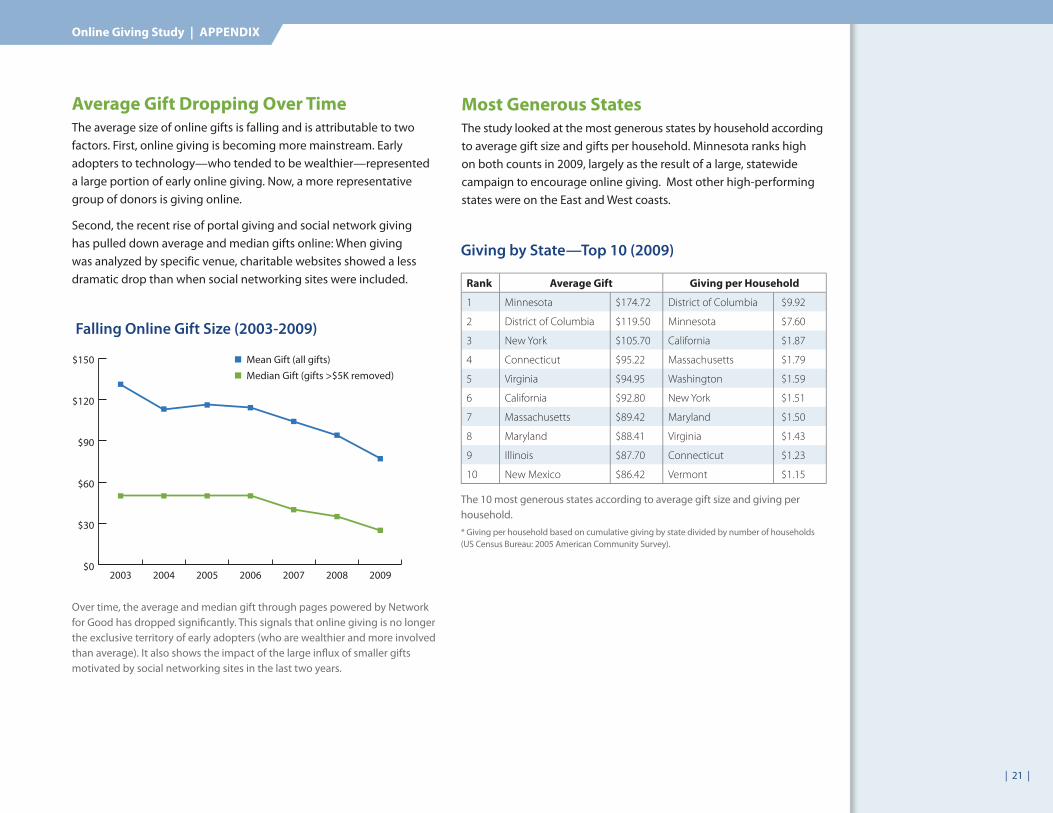
Average Gift Dropping Over Time
The average size of online gifts is falling and is attributable to two factors. First, online giving is becoming more mainstream. Early adopters to technology—who tended to be wealthier—represented a large portion of early online giving. Now, a more representative group of donors is giving online.
Second, the recent rise of portal giving and social network giving has pulled down average and median gifts online: When giving was analyzed by specific venue, charitable websites showed a less dramatic drop than when social networking sites were included.
Falling Online Gift Size (2003-2009)
Over time, the average and median gift through pages powered by Network for Good has dropped signifi cantly. This signals that online giving is no longer the exclusive territory of early adopters (who are wealthier and more involved than average). It also shows the impact of the large infl ux of smaller gifts motivated by social networking sites in the last two years.
$0
$30
$60
$90
$120
$150
2009200820072006200520042003
Mean Gift (all gifts)Median Gift (gifts >$5K removed)
Rank Average Gift Giving per Household
1 Minnesota $174.72 District of Columbia $9.92
2 District of Columbia $119.50 Minnesota $7.60
3 New York $105.70 California $1.87
4 Connecticut $95.22 Massachusetts $1.79
5 Virginia $94.95 Washington $1.59
6 California $92.80 New York $1.51
7 Massachusetts $89.42 Maryland $1.50
8 Maryland $88.41 Virginia $1.43
9 Illinois $87.70 Connecticut $1.23
10 New Mexico $86.42 Vermont $1.15
Giving by State—Top 10 (2009)
The 10 most generous states according to average gift size and giving per household.* Giving per household based on cumulative giving by state divided by number of households (US Census Bureau: 2005 American Community Survey).
Online Giving Study | APPENDIX
Most Generous States
The study looked at the most generous states by household according to average gift size and gifts per household. Minnesota ranks high on both counts in 2009, largely as the result of a large, statewide campaign to encourage online giving. Most other high-performing states were on the East and West coasts.
About Network for Good
Network for Good is a nonprofi t that makes it easy for donors to support any charity, anywhere online and that helps nonprofi ts raise funds for their missions through simple, aff ordable, and eff ective online fundraising services. To foster continued growth in online giving, Network for Good also provides free training to nonprofi ts on online outreach through the site www.Fundraising123.org. Through partnership with corporations, Network for Good enables cause marketing initiatives and charitable giving solutions. Network for Good has processed over $450 million in donations for more than 70,000 nonprofi ts since its 2001 founding by AOL, Cisco, and Yahoo!.
About TrueSense Marketing
TrueSense Marketing is a leader in U.S. fundraising, producing more than 40 million donor impressions a year. With offi ces in Pittsburgh, Seattle, and Pasadena, the 70 fundraising professionals of TrueSense are watching the changes in donor behavior and responding with fact-based approaches to direct mail, online fundraising, and other media.
Special Thanks
Network for Good and TrueSense would like to thank three people who provided their thoughts, advice and insights into our fi ndings: Mark Rovner, Roger Craver, and Greg Ulrich. And special thanks to AOL for sponsoring the study.
We welcome you to review, post, blog, reprint, or otherwise share the results from The Online Giving Study. Please simply give credit where it’s due, according to the Creative Commons License, Attribution 3.0. The individual charts are available for download and use at www.OnlineGivingStudy.org.
For more information or to download the charts, please visit:
www.OnlineGivingStudy.org
sponsored by