Embed Size (px)
Citation preview
1 1
2013 Nonprofit Communications
Trends Report
Get This Report and Graphics at
NonprofitMarketingGuide.com/2013
npmg.us/2013
2
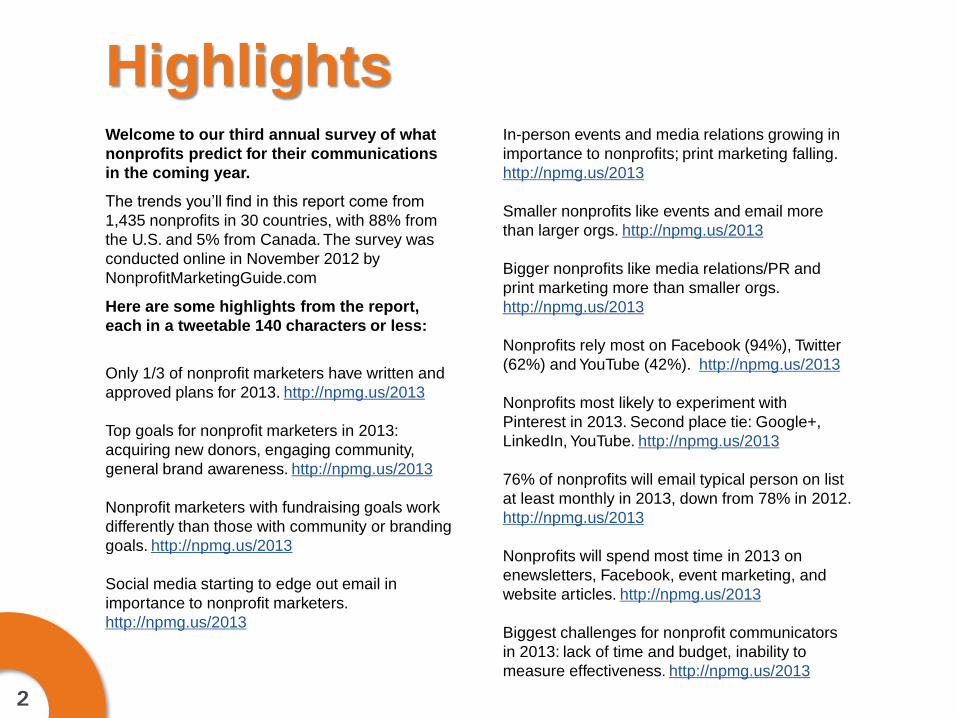
Welcome to our third annual survey of what
nonprofits predict for their communications
in the coming year.
The trends you’ll find in this report come from
1,435 nonprofits in 30 countries, with 88% from
the U.S. and 5% from Canada. The survey was
conducted online in November 2012 by
NonprofitMarketingGuide.com
Here are some highlights from the report,
each in a tweetable 140 characters or less:
Only 1/3 of nonprofit marketers have written and
approved plans for 2013. http://npmg.us/2013
Top goals for nonprofit marketers in 2013:
acquiring new donors, engaging community,
general brand awareness. http://npmg.us/2013
Nonprofit marketers with fundraising goals work
differently than those with community or branding
goals. http://npmg.us/2013
Social media starting to edge out email in
importance to nonprofit marketers.
http://npmg.us/2013
In-person events and media relations growing in
importance to nonprofits; print marketing falling.
http://npmg.us/2013
Smaller nonprofits like events and email more
than larger orgs. http://npmg.us/2013
Bigger nonprofits like media relations/PR and
print marketing more than smaller orgs.
http://npmg.us/2013
Nonprofits rely most on Facebook (94%), Twitter
(62%) and YouTube (42%). http://npmg.us/2013
Nonprofits most likely to experiment with
Pinterest in 2013. Second place tie: Google+,
LinkedIn, YouTube. http://npmg.us/2013
76% of nonprofits will email typical person on list
at least monthly in 2013, down from 78% in 2012.
http://npmg.us/2013
Nonprofits will spend most time in 2013 on
enewsletters, Facebook, event marketing, and
website articles. http://npmg.us/2013
Biggest challenges for nonprofit communicators
in 2013: lack of time and budget, inability to
measure effectiveness. http://npmg.us/2013
Highlights
3
What excites nonprofits: new chances to reach
out, using social strategically, more
communications planning. http://npmg.us/2013
What scares nonprofits: can’t keep pace with
social media, inconsistent marketing approaches,
lack of funding. http://npmg.us/2013
Nonprofits in the West more likely to have written
marketing plans. http://npmg.us/2013
Nonprofits in the West more likely to say in-
person events are important and to spend time
on them. http://npmg.us/2013
Nonprofits in the South most likely to rank social
media as very important and love Twitter more
than other regions. http://npmg.us/2013
Nonprofits in the Midwest love print marketing
more than other regions. http://npmg.us/2013
Nonprofits in the Midwest like LinkedIn more than
other regions. http://npmg.us/2013
Nonprofits in the Northeast communicate more
frequently via email and print than other regions.
http://npmg.us/2013
Communicators at “Environment and Animals”
nonprofits spend more time on fundraising
appeals than others. http://npmg.us/2013
Communicators at Arts, Cultural & Humanities
orgs spend more time on Facebook & like
Pinterest more than other orgs.
http://npmg.us/2013
Philanthropy/grantmaking orgs most likely to have
a written and approved marketing plan for 2013.
http://npmg.us/2013
Religious nonprofits are the biggest newsletter
writers, especially in print. http://npmg.us/2013
International nonprofits most likely to say
blogging, social media, and video are very
important comm tools for 2013
http://npmg.us/2013
Nonprofit Marketing Guide.com
You can reach Kivi Leroux Miller, president of
NonprofitMarketingGuide.com and author of this
report, for interviews at (336) 499-5816,
[email protected] and @kivilm on Twitter.
Highlights, Continued
Get this report and graphics at
NonprofitMarketingGuide.com/2013
npmg.us/2013
4
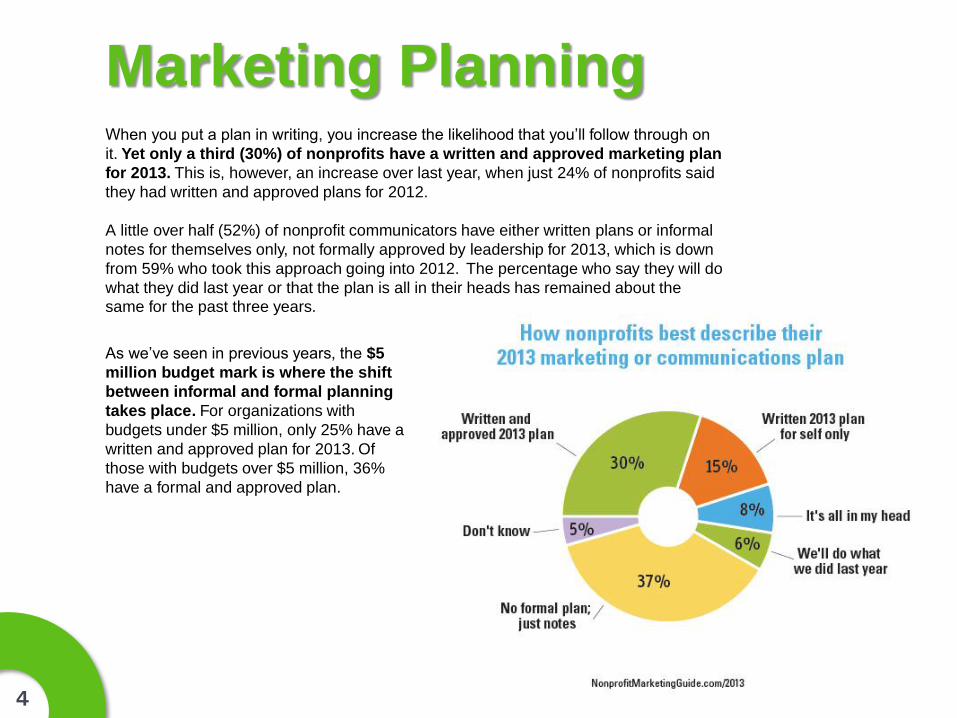
Marketing Planning When you put a plan in writing, you increase the likelihood that you’ll follow through on
it. Yet only a third (30%) of nonprofits have a written and approved marketing plan
for 2013. This is, however, an increase over last year, when just 24% of nonprofits said
they had written and approved plans for 2012.
A little over half (52%) of nonprofit communicators have either written plans or informal
notes for themselves only, not formally approved by leadership for 2013, which is down
from 59% who took this approach going into 2012. The percentage who say they will do
what they did last year or that the plan is all in their heads has remained about the
same for the past three years.
As we’ve seen in previous years, the $5
million budget mark is where the shift
between informal and formal planning
takes place. For organizations with
budgets under $5 million, only 25% have a
written and approved plan for 2013. Of
those with budgets over $5 million, 36%
have a formal and approved plan.
5
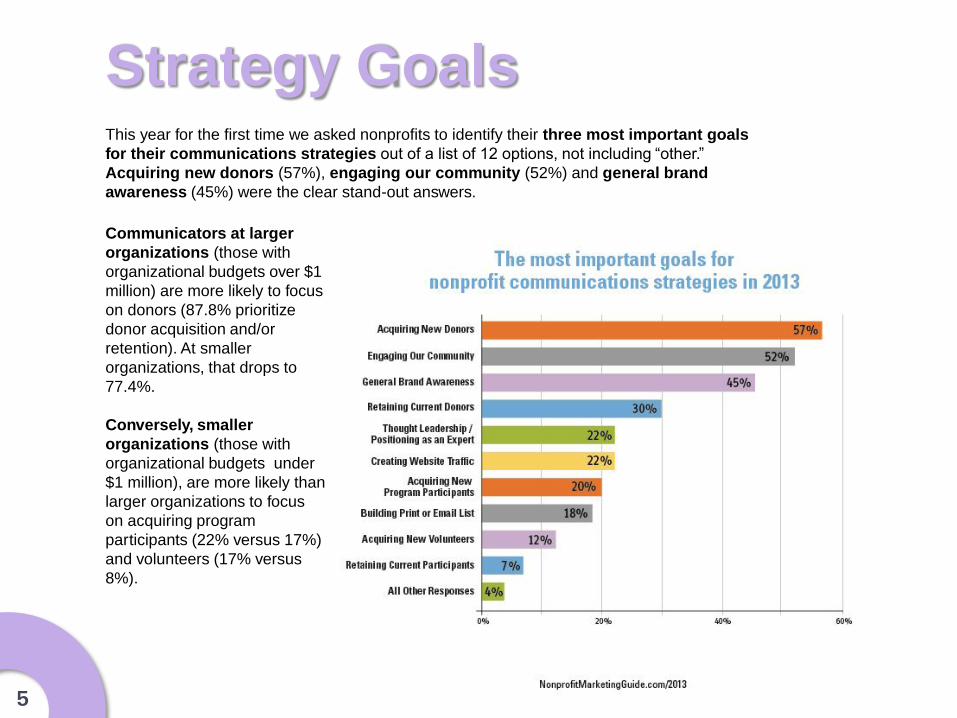
Strategy Goals This year for the first time we asked nonprofits to identify their three most important goals
for their communications strategies out of a list of 12 options, not including “other.”
Acquiring new donors (57%), engaging our community (52%) and general brand
awareness (45%) were the clear stand-out answers.
Communicators at larger
organizations (those with
organizational budgets over $1
million) are more likely to focus
on donors (87.8% prioritize
donor acquisition and/or
retention). At smaller
organizations, that drops to
77.4%.
Conversely, smaller
organizations (those with
organizational budgets under
$1 million), are more likely than
larger organizations to focus
on acquiring program
participants (22% versus 17%)
and volunteers (17% versus
8%).
6
How Focusing on Fundraising Versus
Community/Branding Changes the Approach
We took a closer look at organizations whose
communications strategies were focused on both
acquiring new donors and retaining current donors
(fundraising communicators) versus organizations that
selected all three of these goals at their top choices:
engaging our community, general brand awareness,
and thought leadership/positioning as an expert
(community/brand builders).
We wanted to see if those communicators
explicitly focused on fundraising goals
approached the job differently than those who had
more community or brand-oriented goals.
The “community/brand builders” were more likely to
have written plans and to work for larger organizations
(60% in this category have organizational budgets
over $1 million). They were more likely to identify
media relations/PR, blogging, and social media as
very important tools. They were also more likely to
say that phone calls/phone banks and paid advertising
were their least important tools. They planned to
email more frequently, and were much more likely to
rely on and experiment with social media than
“fundraising” communicators.
When looking at which types of content they would
spend most of their time on, we see a “content
marketing” approach to communications. These
organizations are much more likely to be spending
their time producing blog posts, webinars or other
training content, Twitter updates, infographics, and
research reports or white papers than those with
fundraising goals. They are also more likely to identify
lack of time to produce quality content, producing
enough content, producing engaging content, and
difficulty integrating communications channels as their
biggest challenges.
Conversely, the “fundraising” communicators were
much more likely to identify both print marketing and
email marketing as very important communications
tools, along with phone calls/phone banks and in-
person events. They are likely to send direct mail more
often, and to take a more conservative approach to
social media. For example, they are more likely to say
they are experimenting with sites like Twitter and
YouTube, which have been more fully adopted by
community/brand builders.
Fundraising communicators are also much more likely
to spend their time on print and email fundraising
appeals and print and email newsletter articles. They
are somewhat more likely to say that budget for direct
expenses, lack of clear strategy, and lack of
knowledge or training needed to produce content are
big challenges.
7
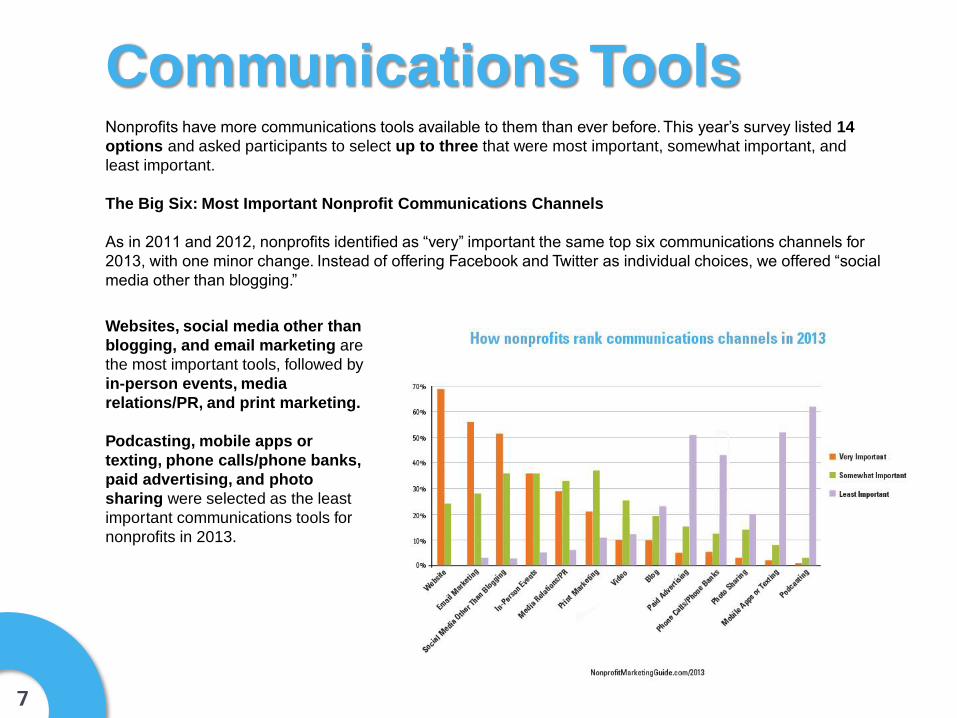
Communications Tools Nonprofits have more communications tools available to them than ever before. This year’s survey listed 14
options and asked participants to select up to three that were most important, somewhat important, and
least important.
The Big Six: Most Important Nonprofit Communications Channels
As in 2011 and 2012, nonprofits identified as “very” important the same top six communications channels for
2013, with one minor change. Instead of offering Facebook and Twitter as individual choices, we offered “social
media other than blogging.”
Websites, social media other than
blogging, and email marketing are
the most important tools, followed by
in-person events, media
relations/PR, and print marketing.
Podcasting, mobile apps or
texting, phone calls/phone banks,
paid advertising, and photo
sharing were selected as the least
important communications tools for
nonprofits in 2013.
8
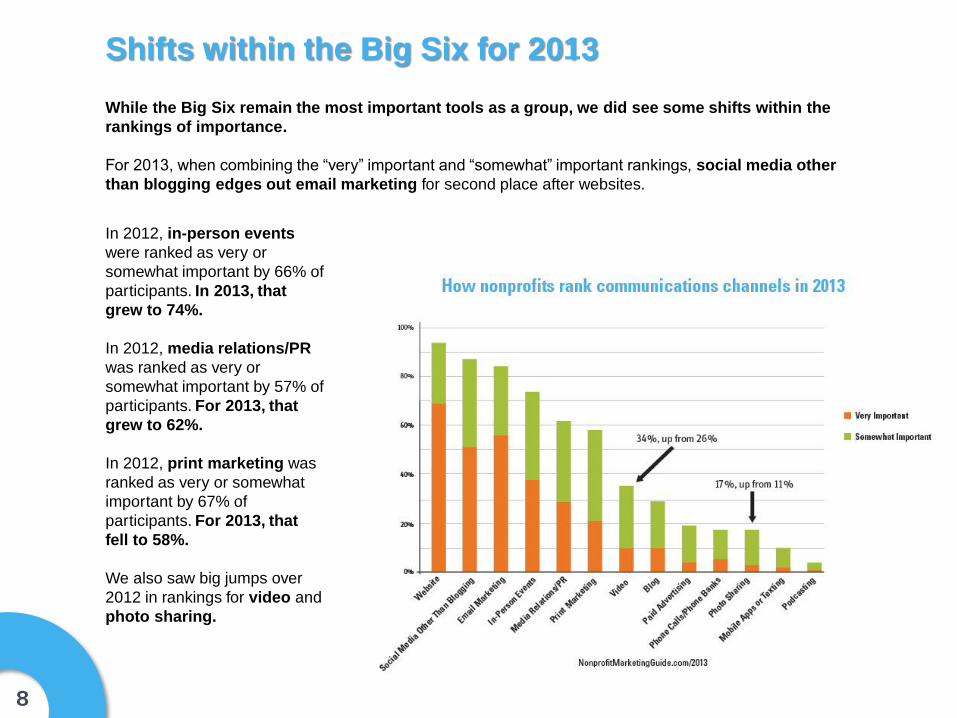
While the Big Six remain the most important tools as a group, we did see some shifts within the
rankings of importance.
For 2013, when combining the “very” important and “somewhat” important rankings, social media other
than blogging edges out email marketing for second place after websites.
Shifts within the Big Six for 2013
In 2012, in-person events
were ranked as very or
somewhat important by 66% of
participants. In 2013, that
grew to 74%.
In 2012, media relations/PR
was ranked as very or
somewhat important by 57% of
participants. For 2013, that
grew to 62%.
In 2012, print marketing was
ranked as very or somewhat
important by 67% of
participants. For 2013, that
fell to 58%.
We also saw big jumps over
2012 in rankings for video and
photo sharing.
9 Source: NonprofitMarketingGuide.com/2013
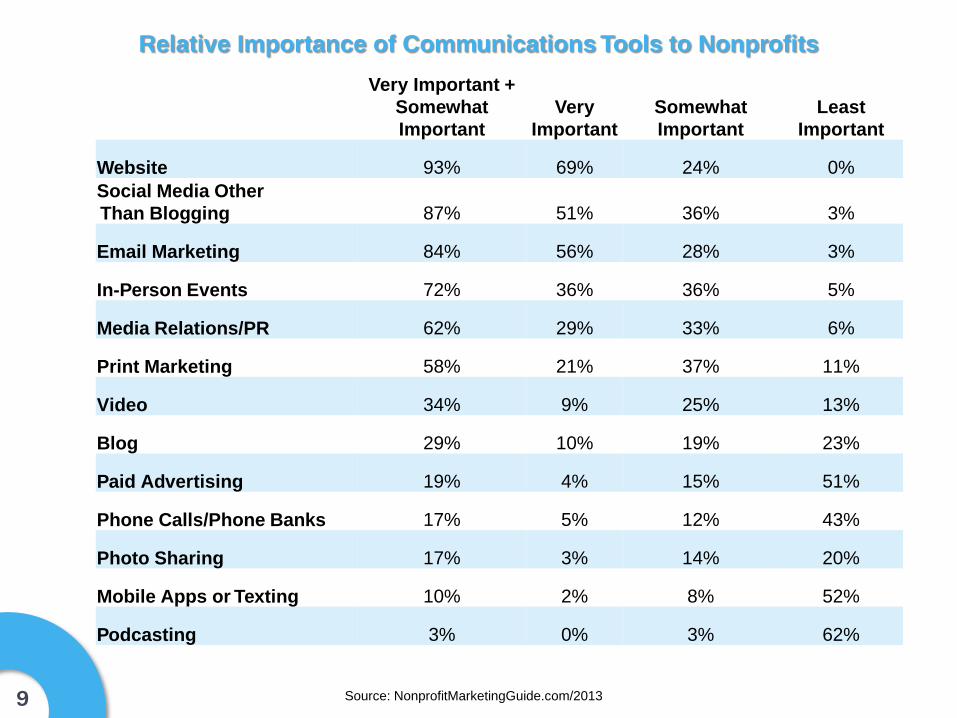
Relative Importance of Communications Tools to Nonprofits
Very Important +
Somewhat
Important
Very
Important
Somewhat
Important
Least
Important
Website 93% 69% 24% 0%
Social Media Other
Than Blogging 87% 51% 36% 3%
Email Marketing 84% 56% 28% 3%
In-Person Events 72% 36% 36% 5%
Media Relations/PR 62% 29% 33% 6%
Print Marketing 58% 21% 37% 11%
Video 34% 9% 25% 13%
Blog 29% 10% 19% 23%
Paid Advertising 19% 4% 15% 51%
Phone Calls/Phone Banks 17% 5% 12% 43%
Photo Sharing 17% 3% 14% 20%
Mobile Apps or Texting 10% 2% 8% 52%
Podcasting 3% 0% 3% 62%
10
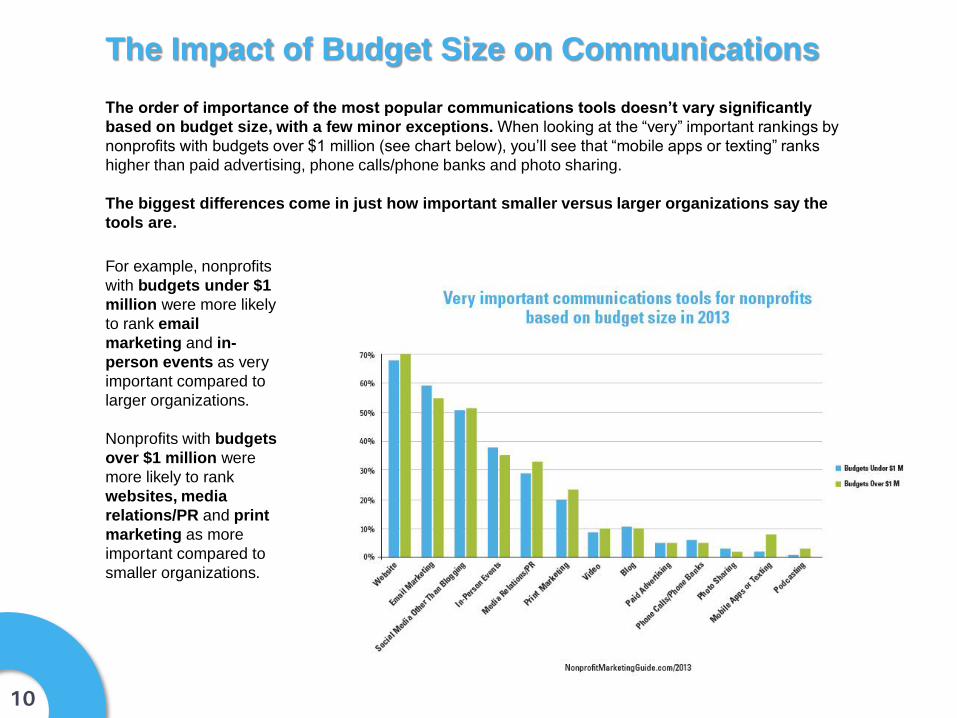
The Impact of Budget Size on Communications
The order of importance of the most popular communications tools doesn’t vary significantly
based on budget size, with a few minor exceptions. When looking at the “very” important rankings by
nonprofits with budgets over $1 million (see chart below), you’ll see that “mobile apps or texting” ranks
higher than paid advertising, phone calls/phone banks and photo sharing.
The biggest differences come in just how important smaller versus larger organizations say the
tools are.
For example, nonprofits
with budgets under $1
million were more likely
to rank email
marketing and in-
person events as very
important compared to
larger organizations.
Nonprofits with budgets
over $1 million were
more likely to rank
websites, media
relations/PR and print
marketing as more
important compared to
smaller organizations.
11
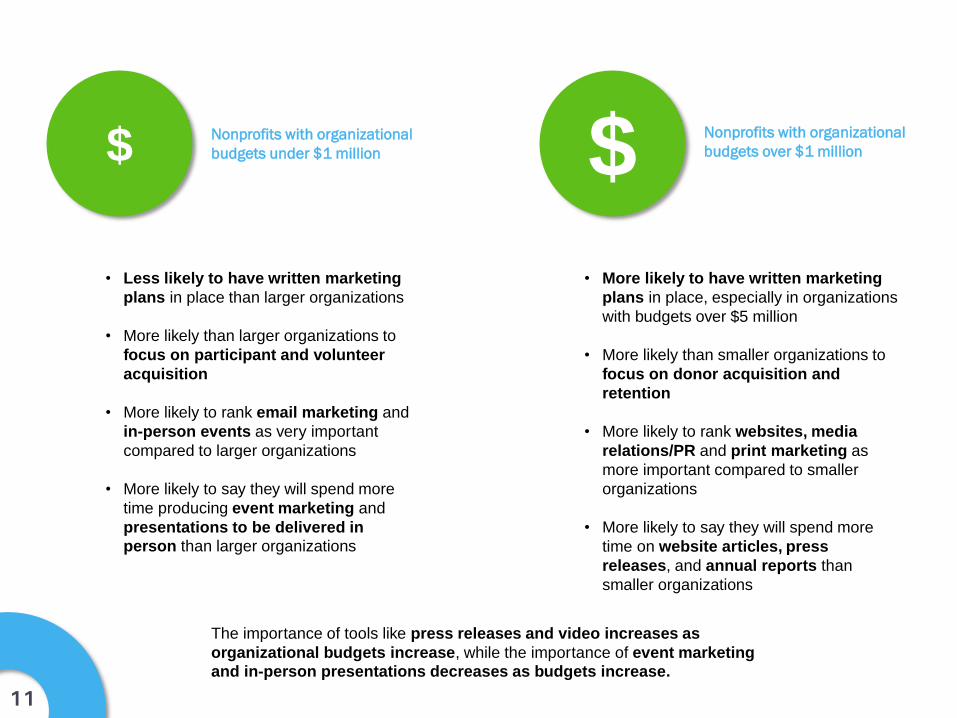
• More likely to have written marketing
plans in place, especially in organizations
with budgets over $5 million
• More likely than smaller organizations to
focus on donor acquisition and
retention
• More likely to rank websites, media
relations/PR and print marketing as
more important compared to smaller
organizations
• More likely to say they will spend more
time on website articles, press
releases, and annual reports than
smaller organizations
$ $ Nonprofits with organizational
budgets under $1 million
Nonprofits with organizational
budgets over $1 million
• Less likely to have written marketing
plans in place than larger organizations
• More likely than larger organizations to
focus on participant and volunteer
acquisition
• More likely to rank email marketing and
in-person events as very important
compared to larger organizations
• More likely to say they will spend more
time producing event marketing and
presentations to be delivered in
person than larger organizations
The importance of tools like press releases and video increases as
organizational budgets increase, while the importance of event marketing
and in-person presentations decreases as budgets increase.
12
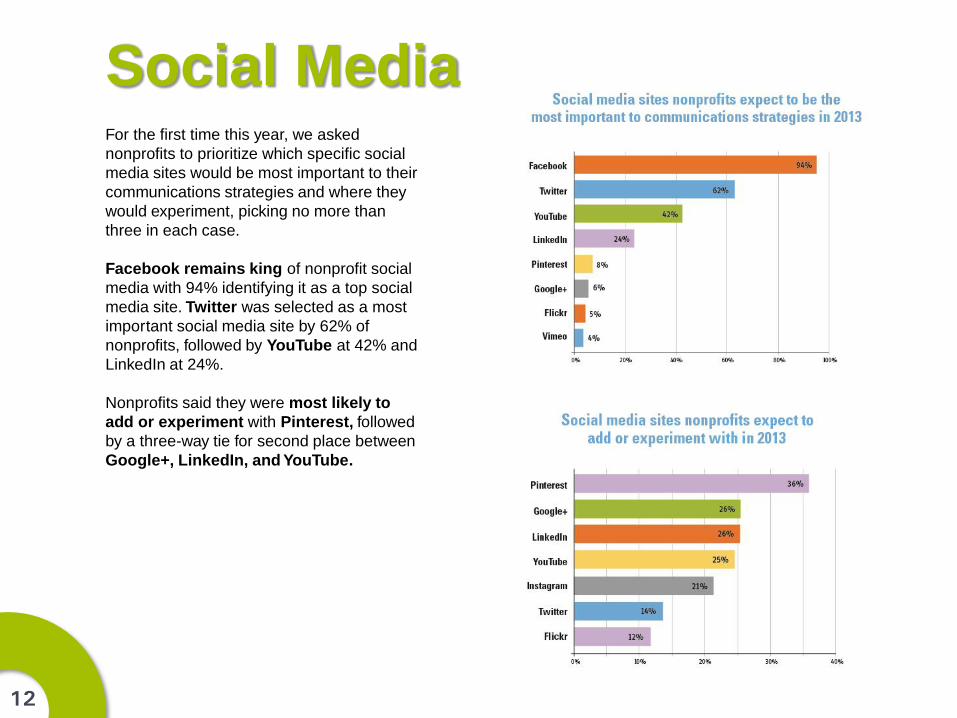
For the first time this year, we asked
nonprofits to prioritize which specific social
media sites would be most important to their
communications strategies and where they
would experiment, picking no more than
three in each case.
Facebook remains king of nonprofit social
media with 94% identifying it as a top social
media site. Twitter was selected as a most
important social media site by 62% of
nonprofits, followed by YouTube at 42% and
LinkedIn at 24%.
Nonprofits said they were most likely to
add or experiment with Pinterest, followed
by a three-way tie for second place between
Google+, LinkedIn, and YouTube.
Social Media
13
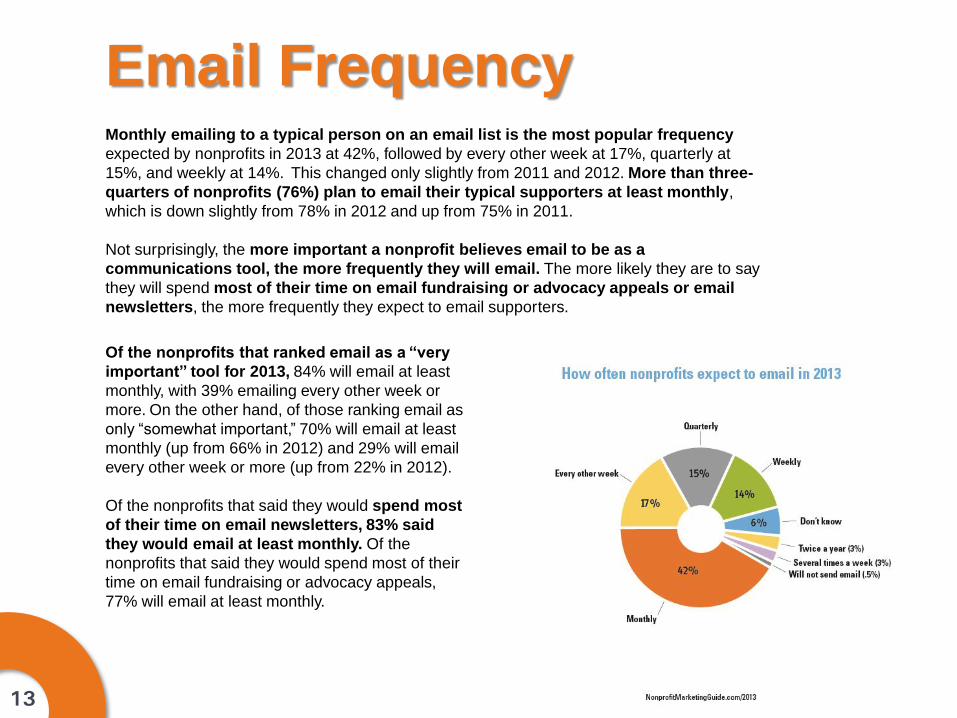
Monthly emailing to a typical person on an email list is the most popular frequency
expected by nonprofits in 2013 at 42%, followed by every other week at 17%, quarterly at
15%, and weekly at 14%. This changed only slightly from 2011 and 2012. More than three-
quarters of nonprofits (76%) plan to email their typical supporters at least monthly,
which is down slightly from 78% in 2012 and up from 75% in 2011.
Not surprisingly, the more important a nonprofit believes email to be as a
communications tool, the more frequently they will email. The more likely they are to say
they will spend most of their time on email fundraising or advocacy appeals or email
newsletters, the more frequently they expect to email supporters.
Email Frequency
Of the nonprofits that ranked email as a “very
important” tool for 2013, 84% will email at least
monthly, with 39% emailing every other week or
more. On the other hand, of those ranking email as
only “somewhat important,” 70% will email at least
monthly (up from 66% in 2012) and 29% will email
every other week or more (up from 22% in 2012).
Of the nonprofits that said they would spend most
of their time on email newsletters, 83% said
they would email at least monthly. Of the
nonprofits that said they would spend most of their
time on email fundraising or advocacy appeals,
77% will email at least monthly.
14
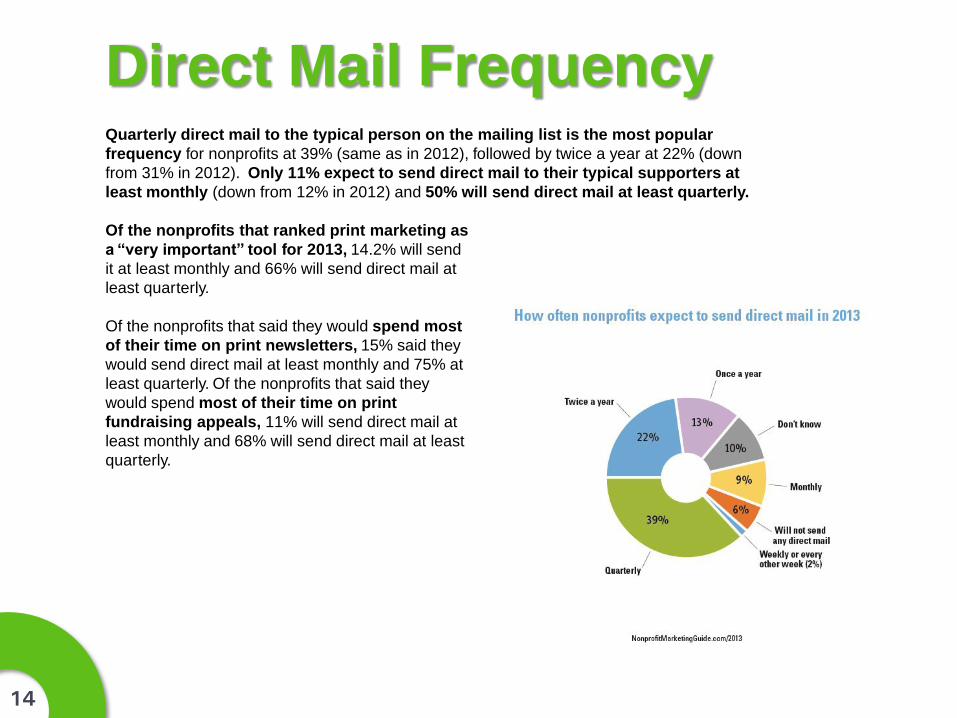
Quarterly direct mail to the typical person on the mailing list is the most popular
frequency for nonprofits at 39% (same as in 2012), followed by twice a year at 22% (down
from 31% in 2012). Only 11% expect to send direct mail to their typical supporters at
least monthly (down from 12% in 2012) and 50% will send direct mail at least quarterly.
Direct Mail Frequency
Of the nonprofits that ranked print marketing as
a “very important” tool for 2013, 14.2% will send
it at least monthly and 66% will send direct mail at
least quarterly.
Of the nonprofits that said they would spend most
of their time on print newsletters, 15% said they
would send direct mail at least monthly and 75% at
least quarterly. Of the nonprofits that said they
would spend most of their time on print
fundraising appeals, 11% will send direct mail at
least monthly and 68% will send direct mail at least
quarterly.
15
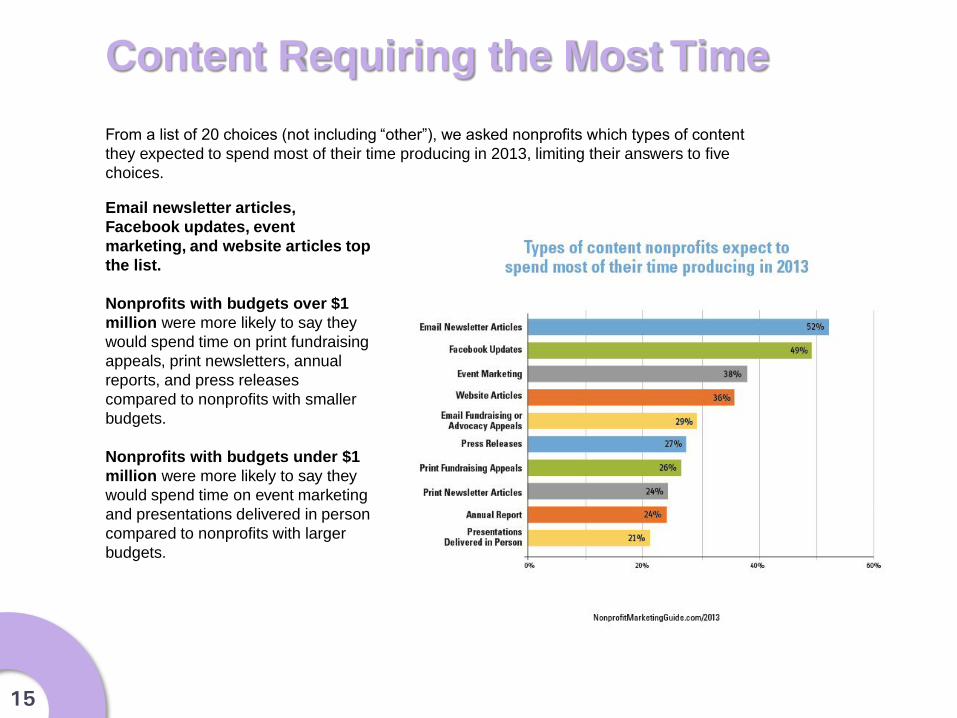
From a list of 20 choices (not including “other”), we asked nonprofits which types of content
they expected to spend most of their time producing in 2013, limiting their answers to five
choices.
Content Requiring the Most Time
Email newsletter articles,
Facebook updates, event
marketing, and website articles top
the list.
Nonprofits with budgets over $1
million were more likely to say they
would spend time on print fundraising
appeals, print newsletters, annual
reports, and press releases
compared to nonprofits with smaller
budgets.
Nonprofits with budgets under $1
million were more likely to say they
would spend time on event marketing
and presentations delivered in person
compared to nonprofits with larger
budgets.
16
Total
Budgets over
$1 Million
Budgets under
$1 Million
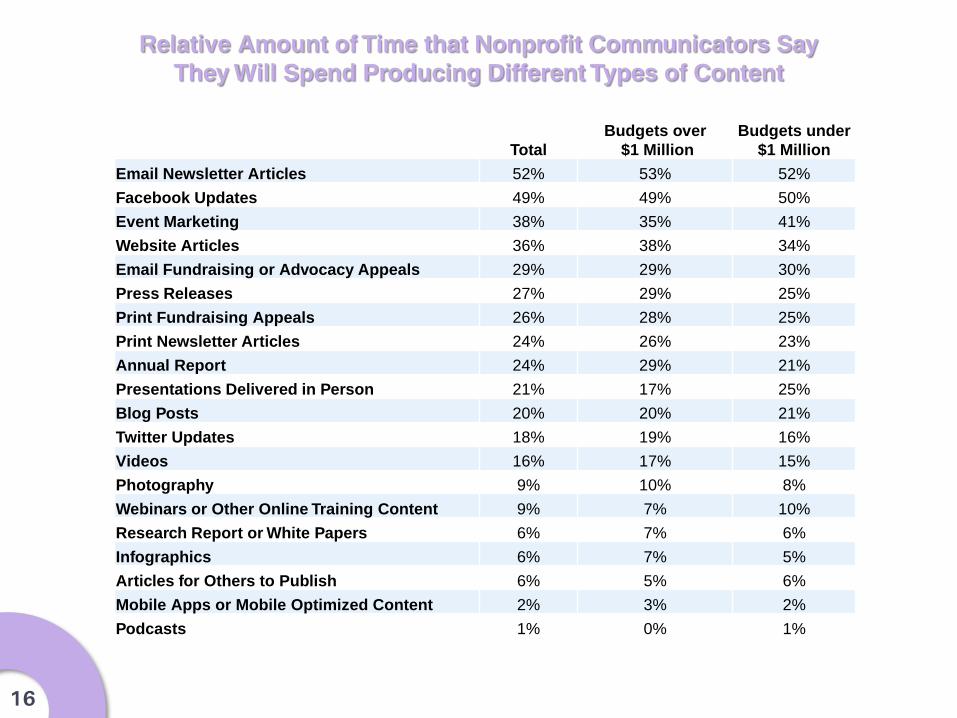
Email Newsletter Articles 52% 53% 52%
Facebook Updates 49% 49% 50%
Event Marketing 38% 35% 41%
Website Articles 36% 38% 34%
Email Fundraising or Advocacy Appeals 29% 29% 30%
Press Releases 27% 29% 25%
Print Fundraising Appeals 26% 28% 25%
Print Newsletter Articles 24% 26% 23%
Annual Report 24% 29% 21%
Presentations Delivered in Person 21% 17% 25%
Blog Posts 20% 20% 21%
Twitter Updates 18% 19% 16%
Videos 16% 17% 15%
Photography 9% 10% 8%
Webinars or Other Online Training Content 9% 7% 10%
Research Report or White Papers 6% 7% 6%
Infographics 6% 7% 5%
Articles for Others to Publish 6% 5% 6%
Mobile Apps or Mobile Optimized Content 2% 3% 2%
Podcasts 1% 0% 1%
Relative Amount of Time that Nonprofit Communicators Say
They Will Spend Producing Different Types of Content
17
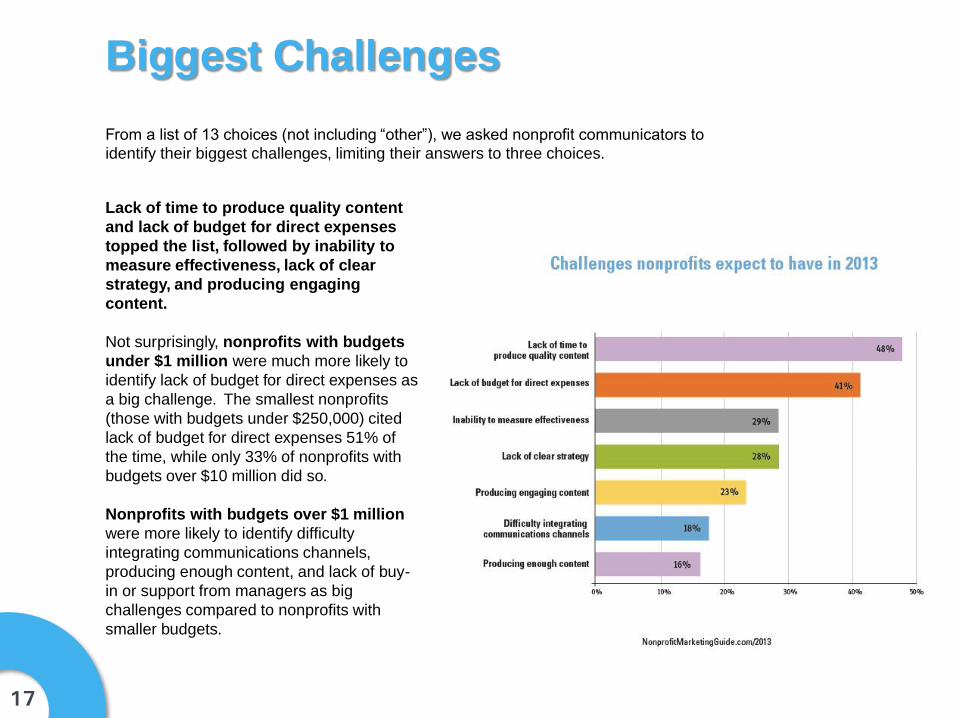
Biggest Challenges
From a list of 13 choices (not including “other”), we asked nonprofit communicators to
identify their biggest challenges, limiting their answers to three choices.
Lack of time to produce quality content
and lack of budget for direct expenses
topped the list, followed by inability to
measure effectiveness, lack of clear
strategy, and producing engaging
content.
Not surprisingly, nonprofits with budgets
under $1 million were much more likely to
identify lack of budget for direct expenses as
a big challenge. The smallest nonprofits
(those with budgets under $250,000) cited
lack of budget for direct expenses 51% of
the time, while only 33% of nonprofits with
budgets over $10 million did so.
Nonprofits with budgets over $1 million
were more likely to identify difficulty
integrating communications channels,
producing enough content, and lack of buy-
in or support from managers as big
challenges compared to nonprofits with
smaller budgets.
18
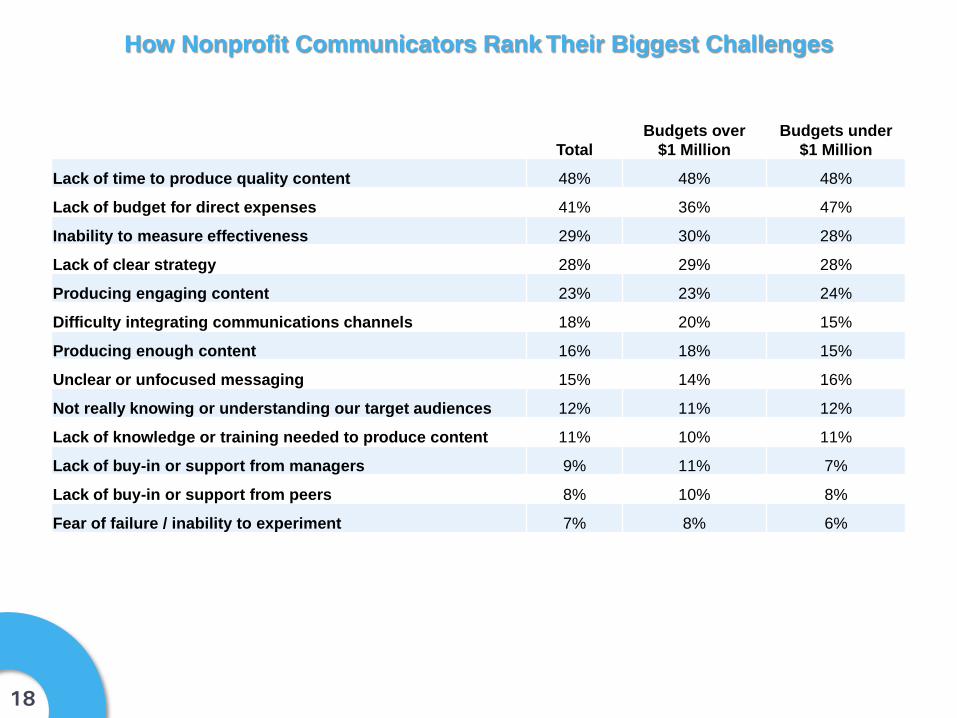
Total
Budgets over
$1 Million
Budgets under
$1 Million
Lack of time to produce quality content 48% 48% 48%
Lack of budget for direct expenses 41% 36% 47%
Inability to measure effectiveness 29% 30% 28%
Lack of clear strategy 28% 29% 28%
Producing engaging content 23% 23% 24%
Difficulty integrating communications channels 18% 20% 15%
Producing enough content 16% 18% 15%
Unclear or unfocused messaging 15% 14% 16%
Not really knowing or understanding our target audiences 12% 11% 12%
Lack of knowledge or training needed to produce content 11% 10% 11%
Lack of buy-in or support from managers 9% 11% 7%
Lack of buy-in or support from peers 8% 10% 8%
Fear of failure / inability to experiment 7% 8% 6%
How Nonprofit Communicators Rank Their Biggest Challenges
19
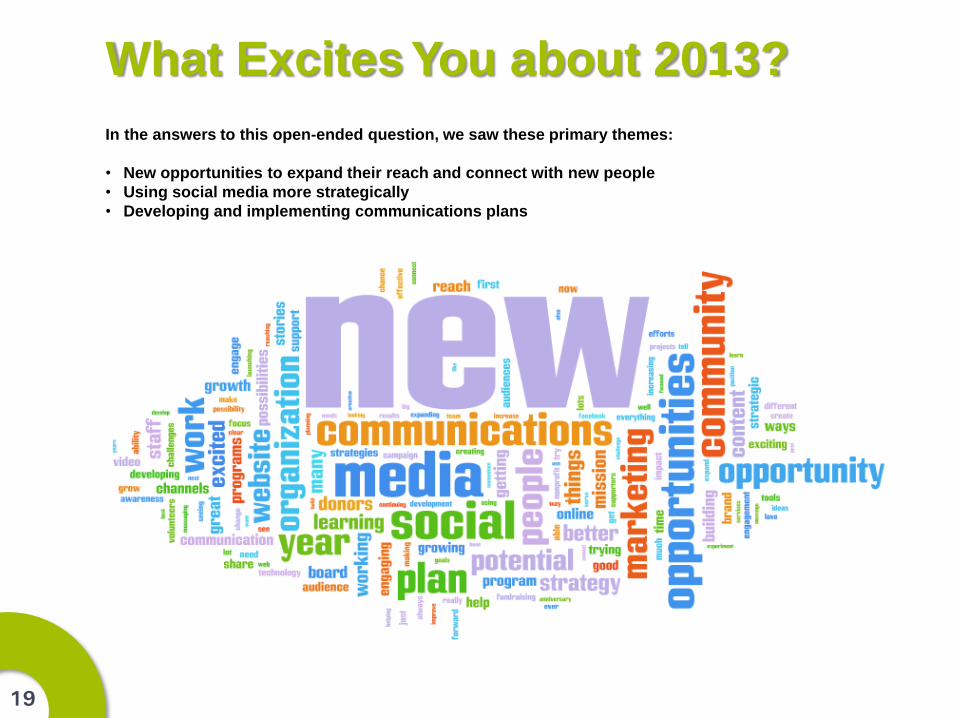
What Excites You about 2013?
In the answers to this open-ended question, we saw these primary themes:
• New opportunities to expand their reach and connect with new people
• Using social media more strategically
• Developing and implementing communications plans, often for the first time
20
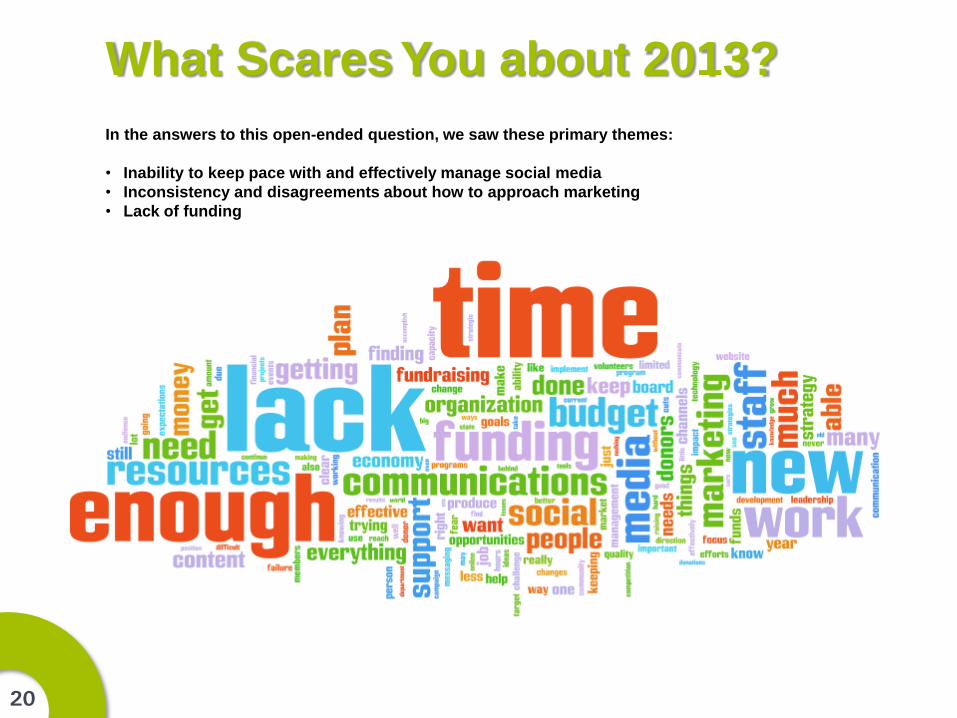
What Scares You about 2013?
In the answers to this open-ended question, we saw these primary themes:
• Inability to keep pace with and effectively manage social media
• Inconsistency and disagreements about how to approach marketing
• Lack of funding and staff
21
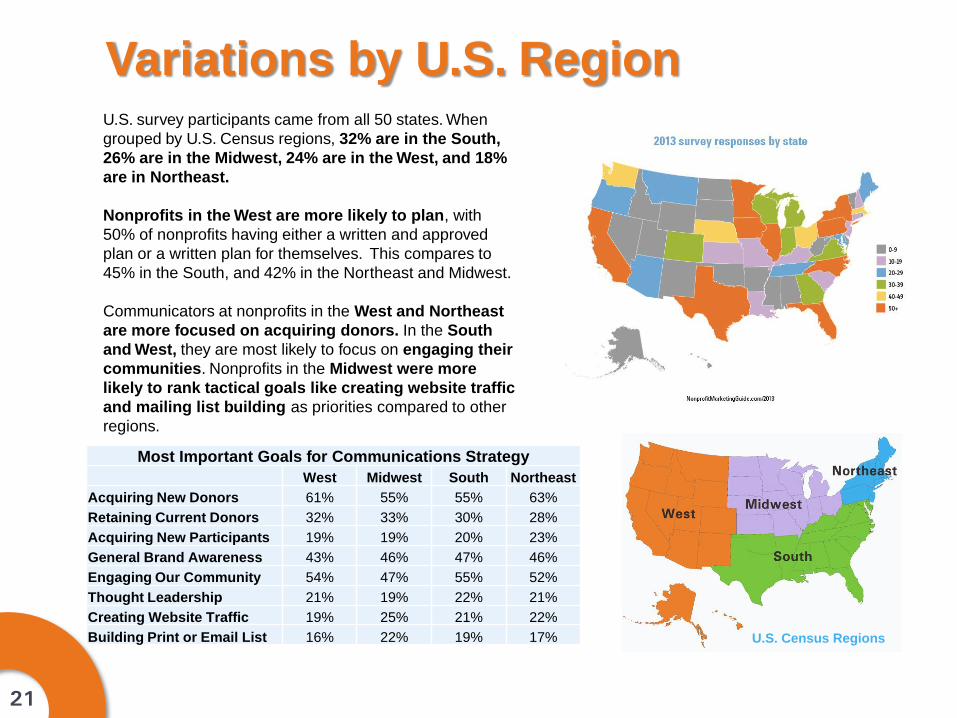
Variations by U.S. Region U.S. survey participants came from all 50 states. When
grouped by U.S. Census regions, 32% are in the South,
26% are in the Midwest, 24% are in the West, and 18%
are in Northeast.
Nonprofits in the West are more likely to plan, with
50% of nonprofits having either a written and approved
plan or a written plan for themselves. This compares to
45% in the South, and 42% in the Northeast and Midwest.
Communicators at nonprofits in the West and Northeast
are more focused on acquiring donors. In the South
and West, they are most likely to focus on engaging their
communities. Nonprofits in the Midwest were more
likely to rank tactical goals like creating website traffic
and mailing list building as priorities compared to other
regions.
U.S. Census Regions
Most Important Goals for Communications Strategy
West Midwest South Northeast
Acquiring New Donors 61% 55% 55% 63%
Retaining Current Donors 32% 33% 30% 28%
Acquiring New Participants 19% 19% 20% 23%
General Brand Awareness 43% 46% 47% 46%
Engaging Our Community 54% 47% 55% 52%
Thought Leadership 21% 19% 22% 21%
Creating Website Traffic 19% 25% 21% 22%
Building Print or Email List 16% 22% 19% 17%
22
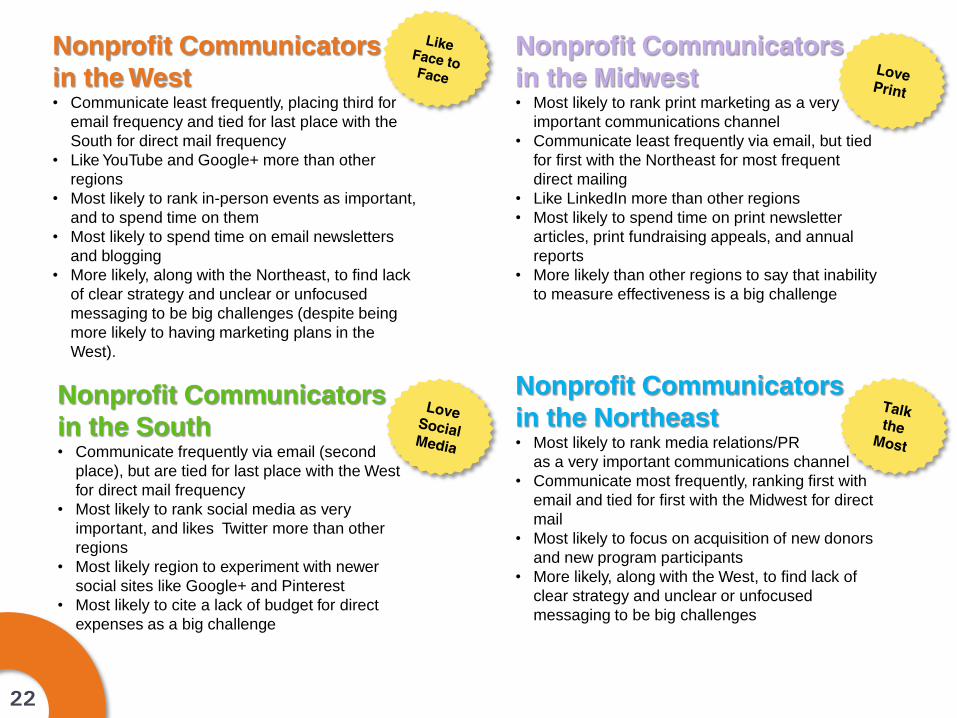
Nonprofit Communicators
in the West • Communicate least frequently, placing third for
email frequency and tied for last place with the
South for direct mail frequency
• Like YouTube and Google+ more than other
regions
• Most likely to rank in-person events as important,
and to spend time on them
• Most likely to spend time on email newsletters
and blogging
• More likely, along with the Northeast, to find lack
of clear strategy and unclear or unfocused
messaging to be big challenges (despite being
more likely to having marketing plans in the
West).
Nonprofit Communicators
in the Northeast • Most likely to rank media relations/PR
as a very important communications channel
• Communicate most frequently, ranking first with
email and tied for first with the Midwest for direct
• Most likely to focus on acquisition of new donors
and new program participants
• More likely, along with the West, to find lack of
clear strategy and unclear or unfocused
messaging to be big challenges
Nonprofit Communicators
in the Midwest • Most likely to rank print marketing as a very
important communications channel
• Communicate least frequently via email, but tied
for first with the Northeast for most frequent
direct mailing
• Like LinkedIn more than other regions
• Most likely to spend time on print newsletter
articles, print fundraising appeals, and annual
reports
• More likely than other regions to say that inability
to measure effectiveness is a big challenge
Nonprofit Communicators
in the South • Communicate frequently via email (second
place), but are tied for last place with the West
for direct mail frequency
• Most likely to rank social media as very
important, and likes Twitter more than other
regions
• Most likely region to experiment with newer
social sites like Google+ and Pinterest
• Most likely to cite a lack of budget for direct
expenses as a big challenge
23
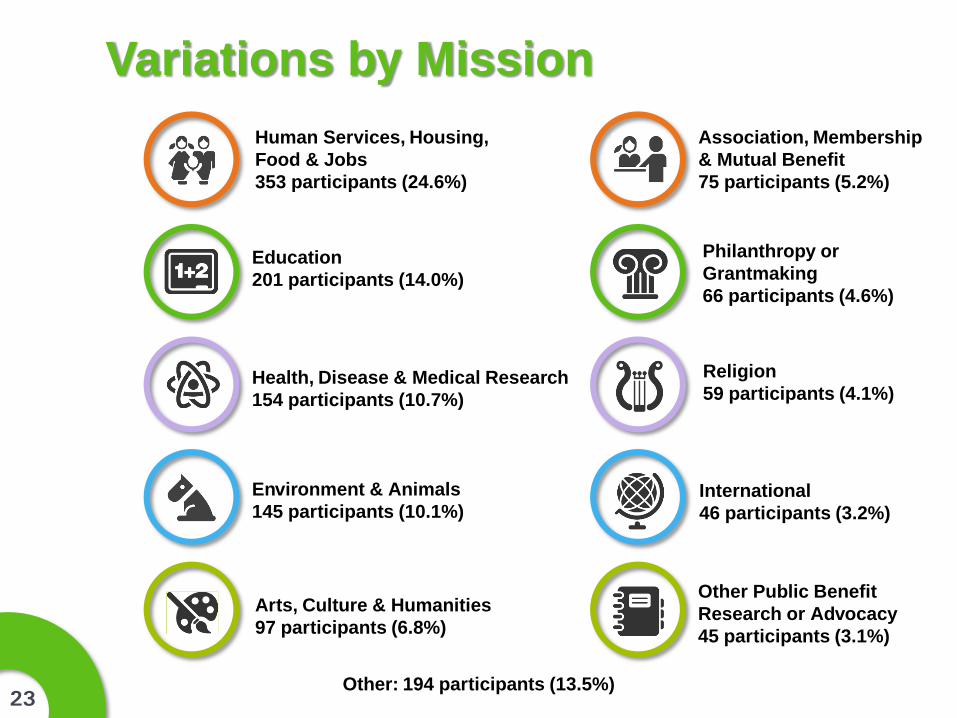
Arts, Culture & Humanities
97 participants (6.8%)
Education
201 participants (14.0%)
Environment & Animals
145 participants (10.1%)
Health, Disease & Medical Research
154 participants (10.7%)
Human Services, Housing,
Food & Jobs
353 participants (24.6%)
International
46 participants (3.2%)
Religion
59 participants (4.1%)
Association, Membership
& Mutual Benefit
75 participants (5.2%)
Other Public Benefit
Research or Advocacy
45 participants (3.1%)
Philanthropy or
Grantmaking
66 participants (4.6%)
Other: 194 participants (13.5%)
Variations by Mission
24
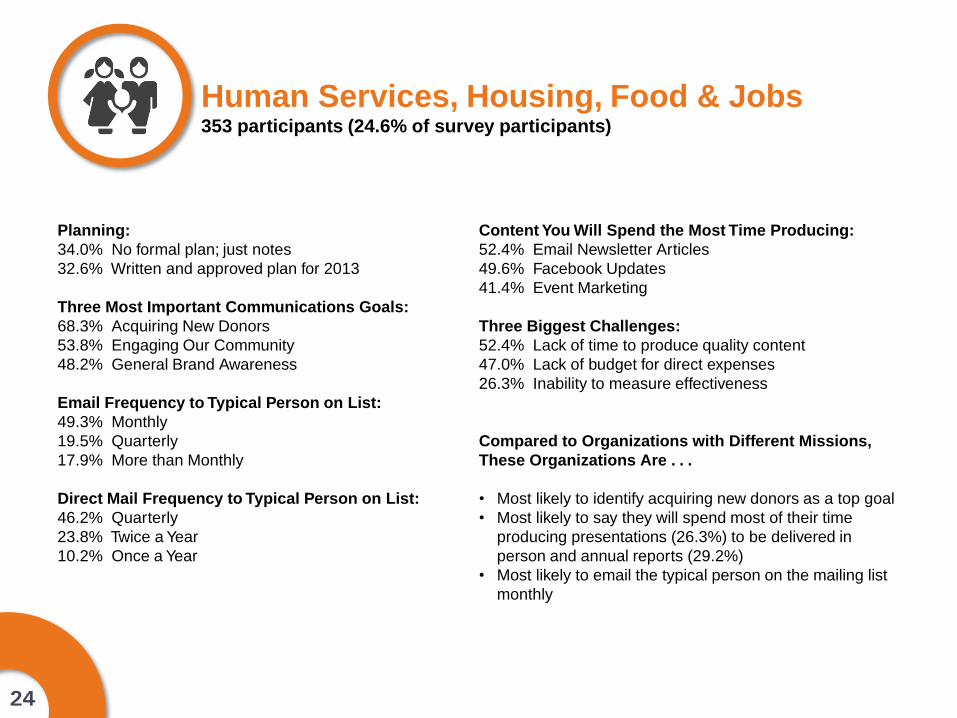
Human Services, Housing, Food & Jobs 353 participants (24.6% of survey participants)
Planning:
34.0% No formal plan; just notes
32.6% Written and approved plan for 2013
Three Most Important Communications Goals:
68.3% Acquiring New Donors
53.8% Engaging Our Community
48.2% General Brand Awareness
Email Frequency to Typical Person on List:
49.3% Monthly
19.5% Quarterly
17.9% More than Monthly
Direct Mail Frequency to Typical Person on List:
46.2% Quarterly
23.8% Twice a Year
10.2% Once a Year
Content You Will Spend the Most Time Producing:
52.4% Email Newsletter Articles
49.6% Facebook Updates
41.4% Event Marketing
Three Biggest Challenges:
52.4% Lack of time to produce quality content
47.0% Lack of budget for direct expenses
26.3% Inability to measure effectiveness
Compared to Organizations with Different Missions,
These Organizations Are . . .
• Most likely to identify acquiring new donors as a top goal
• Most likely to say they will spend most of their time
producing presentations (26.3%) to be delivered in
person and annual reports (29.2%)
• Most likely to email the typical person on the mailing list
monthly
25
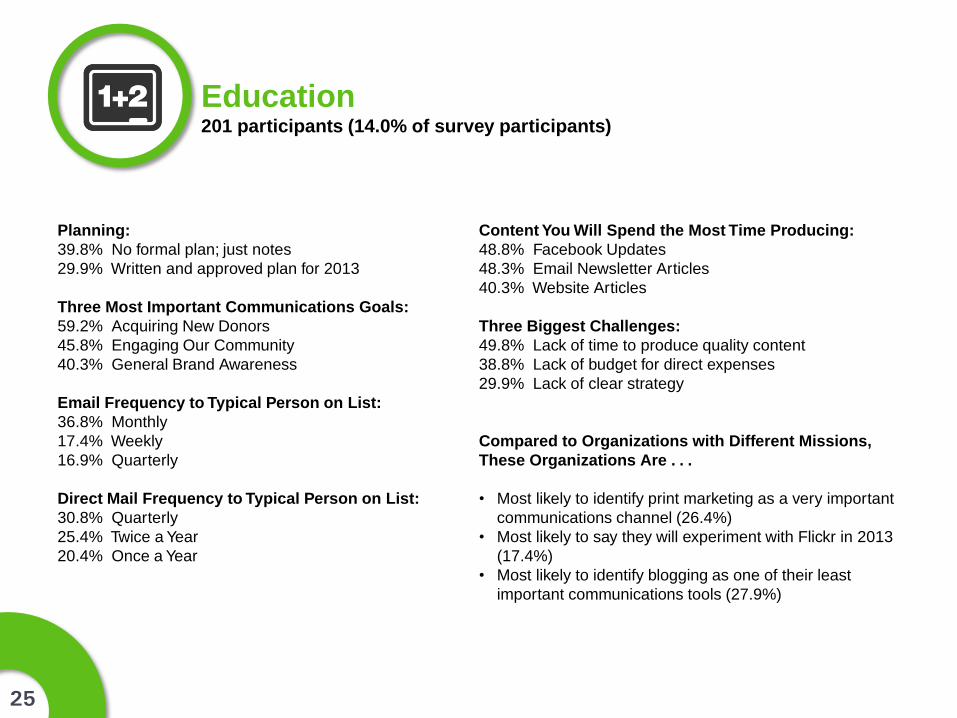
Education 201 participants (14.0% of survey participants)
Planning:
39.8% No formal plan; just notes
29.9% Written and approved plan for 2013
Three Most Important Communications Goals:
59.2% Acquiring New Donors
45.8% Engaging Our Community
40.3% General Brand Awareness
Email Frequency to Typical Person on List:
36.8% Monthly
17.4% Weekly
16.9% Quarterly
Direct Mail Frequency to Typical Person on List:
30.8% Quarterly
25.4% Twice a Year
20.4% Once a Year
Content You Will Spend the Most Time Producing:
48.8% Facebook Updates
48.3% Email Newsletter Articles
40.3% Website Articles
Three Biggest Challenges:
49.8% Lack of time to produce quality content
38.8% Lack of budget for direct expenses
29.9% Lack of clear strategy
Compared to Organizations with Different Missions,
These Organizations Are . . .
• Most likely to identify print marketing as a very important
communications channel (26.4%)
• Most likely to say they will experiment with Flickr in 2013
(17.4%)
• Most likely to identify blogging as one of their least
important communications tools (27.9%)
26
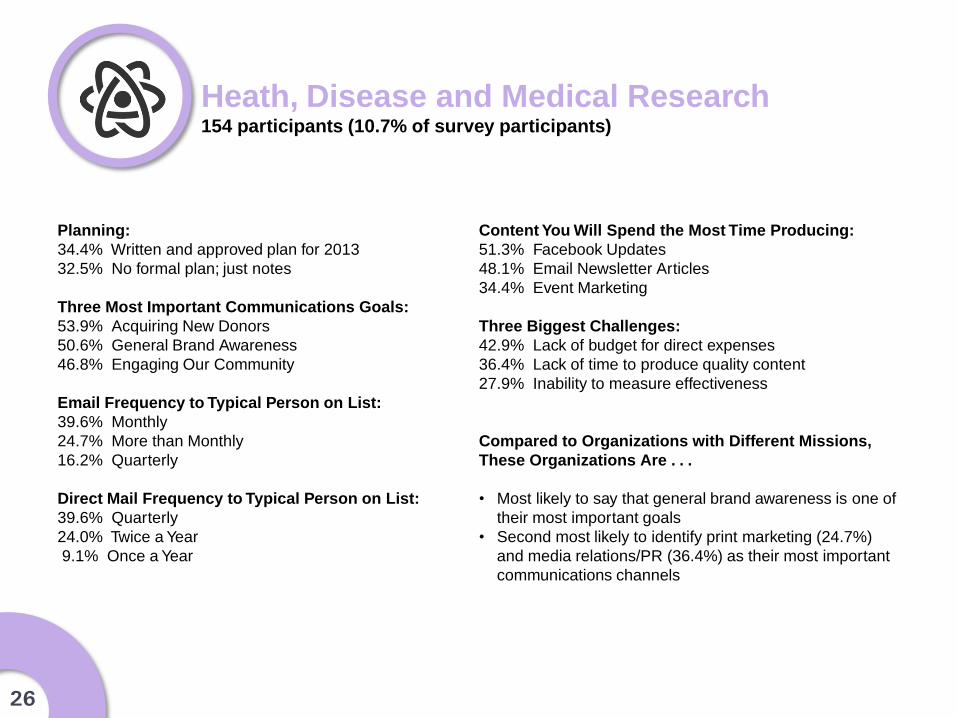
Heath, Disease and Medical Research 154 participants (10.7% of survey participants)
Planning:
34.4% Written and approved plan for 2013
32.5% No formal plan; just notes
Three Most Important Communications Goals:
53.9% Acquiring New Donors
50.6% General Brand Awareness
46.8% Engaging Our Community
Email Frequency to Typical Person on List:
39.6% Monthly
24.7% More than Monthly
16.2% Quarterly
Direct Mail Frequency to Typical Person on List:
39.6% Quarterly
24.0% Twice a Year
9.1% Once a Year
Content You Will Spend the Most Time Producing:
51.3% Facebook Updates
48.1% Email Newsletter Articles
34.4% Event Marketing
Three Biggest Challenges:
42.9% Lack of budget for direct expenses
36.4% Lack of time to produce quality content
27.9% Inability to measure effectiveness
Compared to Organizations with Different Missions,
These Organizations Are . . .
• Most likely to say that general brand awareness is one of
their most important goals
• Second most likely to identify print marketing (24.7%)
and media relations/PR (36.4%) as their most important
communications channels
27
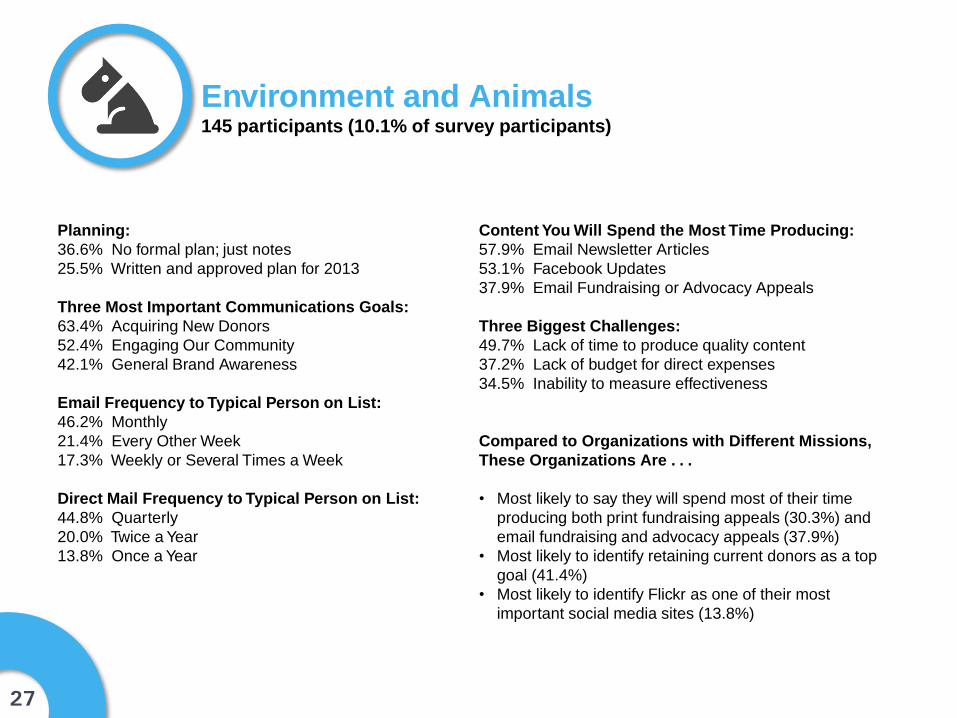
Environment and Animals 145 participants (10.1% of survey participants)
Planning:
36.6% No formal plan; just notes
25.5% Written and approved plan for 2013
Three Most Important Communications Goals:
63.4% Acquiring New Donors
52.4% Engaging Our Community
42.1% General Brand Awareness
Email Frequency to Typical Person on List:
46.2% Monthly
21.4% Every Other Week
17.3% Weekly or Several Times a Week
Direct Mail Frequency to Typical Person on List:
44.8% Quarterly
20.0% Twice a Year
13.8% Once a Year
Content You Will Spend the Most Time Producing:
57.9% Email Newsletter Articles
53.1% Facebook Updates
37.9% Email Fundraising or Advocacy Appeals
Three Biggest Challenges:
49.7% Lack of time to produce quality content
37.2% Lack of budget for direct expenses
34.5% Inability to measure effectiveness
Compared to Organizations with Different Missions,
These Organizations Are . . .
• Most likely to say they will spend most of their time
producing both print fundraising appeals (30.3%) and
email fundraising and advocacy appeals (37.9%)
• Most likely to identify retaining current donors as a top
goal (41.4%)
• Most likely to identify Flickr as one of their most
important social media sites (13.8%)
28
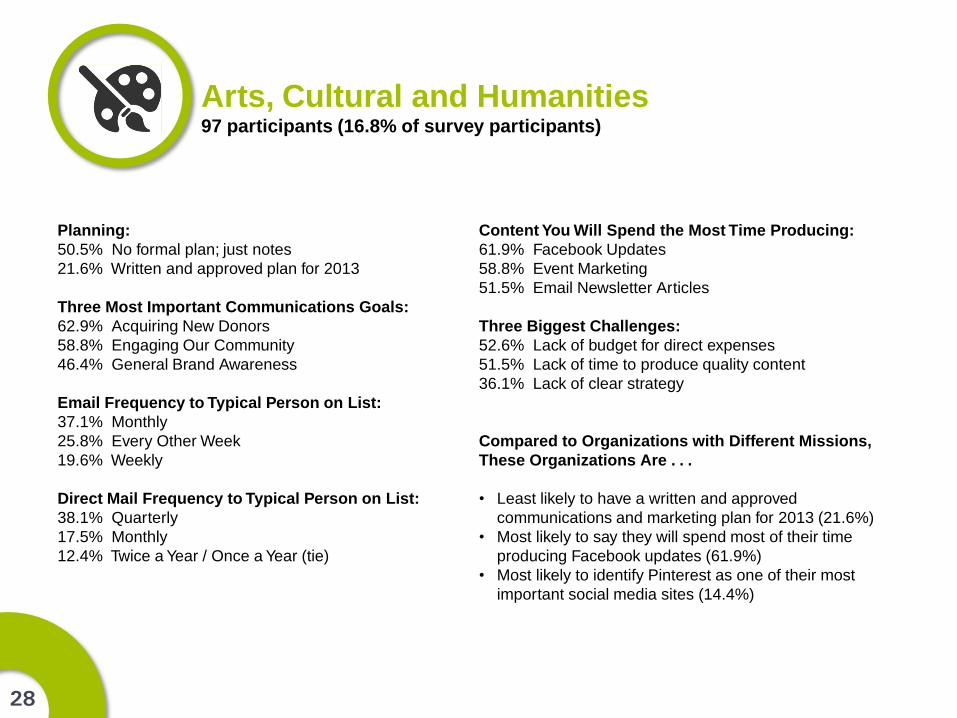
Arts, Cultural and Humanities 97 participants (16.8% of survey participants)
Planning:
50.5% No formal plan; just notes
21.6% Written and approved plan for 2013
Three Most Important Communications Goals:
62.9% Acquiring New Donors
58.8% Engaging Our Community
46.4% General Brand Awareness
Email Frequency to Typical Person on List:
37.1% Monthly
25.8% Every Other Week
19.6% Weekly
Direct Mail Frequency to Typical Person on List:
38.1% Quarterly
17.5% Monthly
12.4% Twice a Year / Once a Year (tie)
Content You Will Spend the Most Time Producing:
61.9% Facebook Updates
58.8% Event Marketing
51.5% Email Newsletter Articles
Three Biggest Challenges:
52.6% Lack of budget for direct expenses
51.5% Lack of time to produce quality content
36.1% Lack of clear strategy
Compared to Organizations with Different Missions,
These Organizations Are . . .
• Least likely to have a written and approved
communications and marketing plan for 2013 (21.6%)
• Most likely to say they will spend most of their time
producing Facebook updates (61.9%)
• Most likely to identify Pinterest as one of their most
important social media sites (14.4%)
29
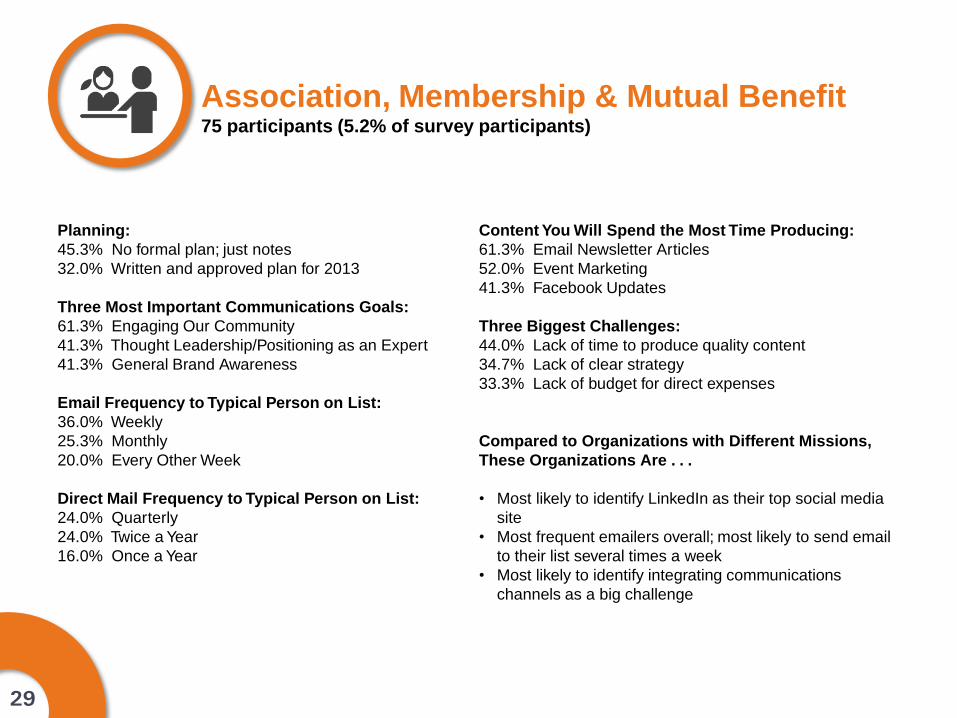
Association, Membership & Mutual Benefit 75 participants (5.2% of survey participants)
Planning:
45.3% No formal plan; just notes
32.0% Written and approved plan for 2013
Three Most Important Communications Goals:
61.3% Engaging Our Community
41.3% Thought Leadership/Positioning as an Expert
41.3% General Brand Awareness
Email Frequency to Typical Person on List:
36.0% Weekly
25.3% Monthly
20.0% Every Other Week
Direct Mail Frequency to Typical Person on List:
24.0% Quarterly
24.0% Twice a Year
16.0% Once a Year
Content You Will Spend the Most Time Producing:
61.3% Email Newsletter Articles
52.0% Event Marketing
41.3% Facebook Updates
Three Biggest Challenges:
44.0% Lack of time to produce quality content
34.7% Lack of clear strategy
33.3% Lack of budget for direct expenses
Compared to Organizations with Different Missions,
These Organizations Are . . .
• Most likely to identify LinkedIn as their top social media
site
• Most frequent emailers overall; most likely to send email
to their list several times a week
• Most likely to identify integrating communications
channels as a big challenge
30
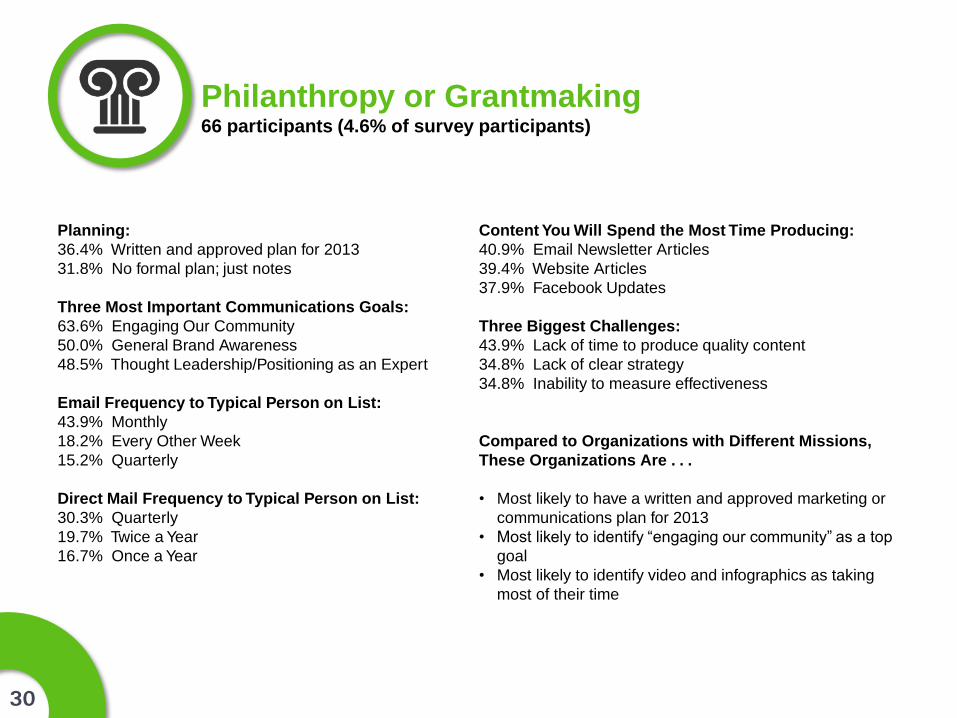
Philanthropy or Grantmaking 66 participants (4.6% of survey participants)
Planning:
36.4% Written and approved plan for 2013
31.8% No formal plan; just notes
Three Most Important Communications Goals:
63.6% Engaging Our Community
50.0% General Brand Awareness
48.5% Thought Leadership/Positioning as an Expert
Email Frequency to Typical Person on List:
43.9% Monthly
18.2% Every Other Week
15.2% Quarterly
Direct Mail Frequency to Typical Person on List:
30.3% Quarterly
19.7% Twice a Year
16.7% Once a Year
Content You Will Spend the Most Time Producing:
40.9% Email Newsletter Articles
39.4% Website Articles
37.9% Facebook Updates
Three Biggest Challenges:
43.9% Lack of time to produce quality content
34.8% Lack of clear strategy
34.8% Inability to measure effectiveness
Compared to Organizations with Different Missions,
These Organizations Are . . .
• Most likely to have a written and approved marketing or
communications plan for 2013
• Most likely to identify “engaging our community” as a top
goal
• Most likely to identify video and infographics as taking
most of their time
31
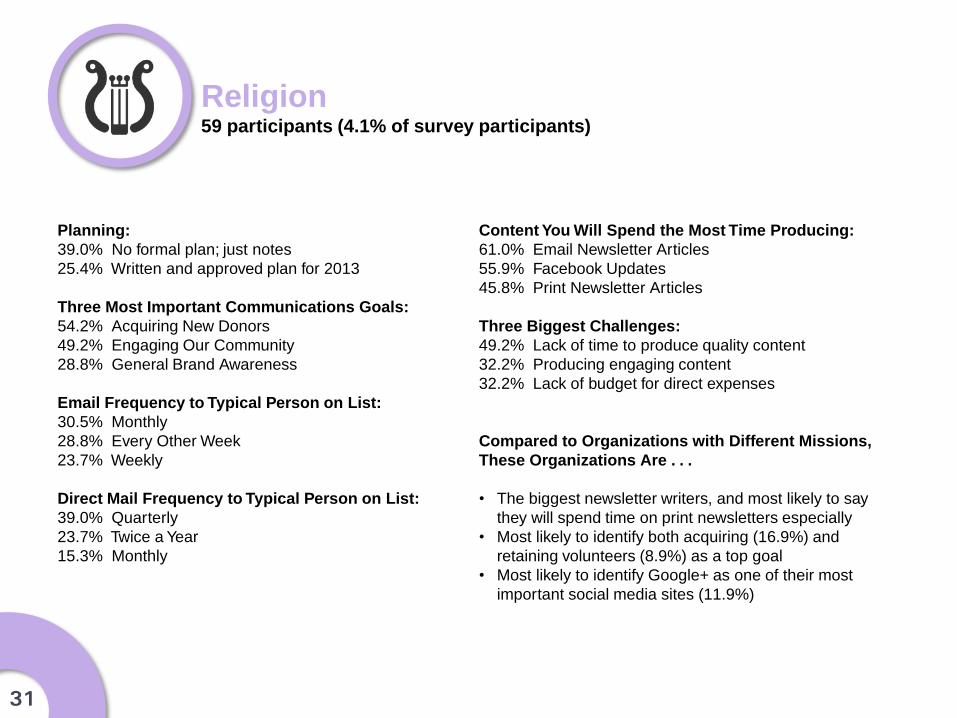
Religion 59 participants (4.1% of survey participants)
Planning:
39.0% No formal plan; just notes
25.4% Written and approved plan for 2013
Three Most Important Communications Goals:
54.2% Acquiring New Donors
49.2% Engaging Our Community
28.8% General Brand Awareness
Email Frequency to Typical Person on List:
30.5% Monthly
28.8% Every Other Week
23.7% Weekly
Direct Mail Frequency to Typical Person on List:
39.0% Quarterly
23.7% Twice a Year
15.3% Monthly
Content You Will Spend the Most Time Producing:
61.0% Email Newsletter Articles
55.9% Facebook Updates
45.8% Print Newsletter Articles
Three Biggest Challenges:
49.2% Lack of time to produce quality content
32.2% Producing engaging content
32.2% Lack of budget for direct expenses
Compared to Organizations with Different Missions,
These Organizations Are . . .
• The biggest newsletter writers, and most likely to say
they will spend time on print newsletters especially
• Most likely to identify both acquiring (16.9%) and
retaining volunteers (8.9%) as a top goal
• Most likely to identify Google+ as one of their most
important social media sites (11.9%)
32
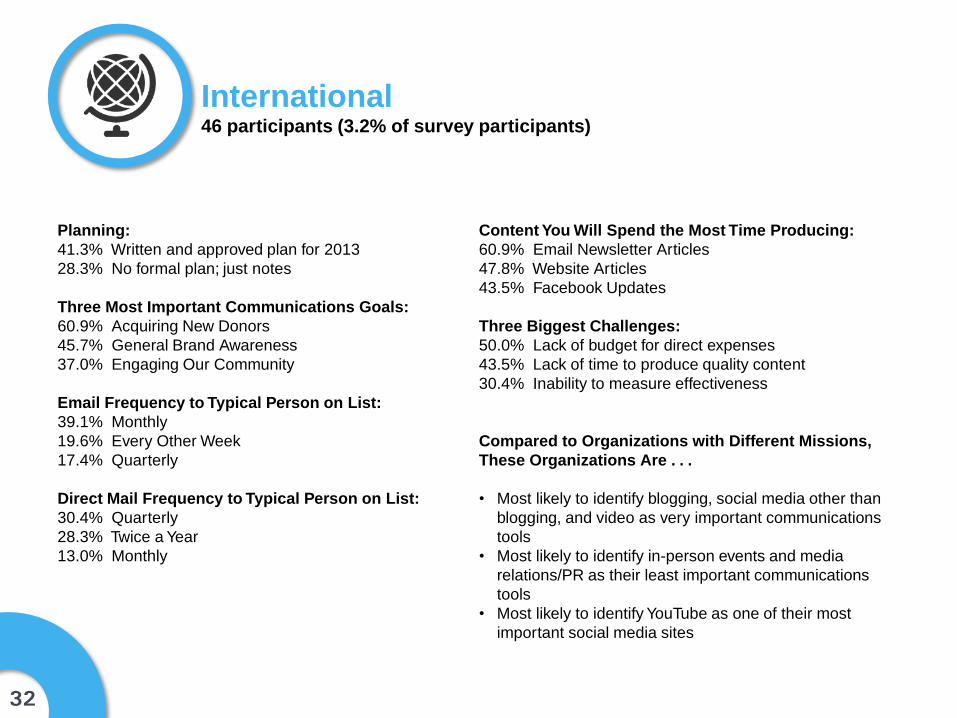
International 46 participants (3.2% of survey participants)
Planning:
41.3% Written and approved plan for 2013
28.3% No formal plan; just notes
Three Most Important Communications Goals:
60.9% Acquiring New Donors
45.7% General Brand Awareness
37.0% Engaging Our Community
Email Frequency to Typical Person on List:
39.1% Monthly
19.6% Every Other Week
17.4% Quarterly
Direct Mail Frequency to Typical Person on List:
30.4% Quarterly
28.3% Twice a Year
13.0% Monthly
Content You Will Spend the Most Time Producing:
60.9% Email Newsletter Articles
47.8% Website Articles
43.5% Facebook Updates
Three Biggest Challenges:
50.0% Lack of budget for direct expenses
43.5% Lack of time to produce quality content
30.4% Inability to measure effectiveness
Compared to Organizations with Different Missions,
These Organizations Are . . .
• Most likely to identify blogging, social media other than
blogging, and video as very important communications
tools
• Most likely to identify in-person events and media
relations/PR as their least important communications
tools
• Most likely to identify YouTube as one of their most
important social media sites
33
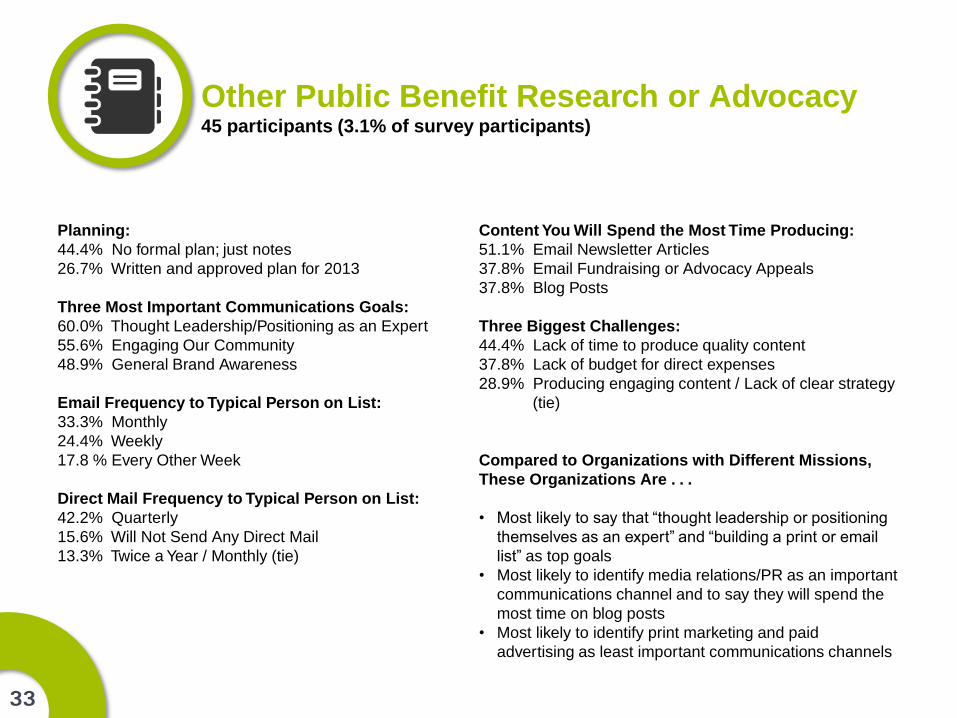
Other Public Benefit Research or Advocacy 45 participants (3.1% of survey participants)
Planning:
44.4% No formal plan; just notes
26.7% Written and approved plan for 2013
Three Most Important Communications Goals:
60.0% Thought Leadership/Positioning as an Expert
55.6% Engaging Our Community
48.9% General Brand Awareness
Email Frequency to Typical Person on List:
33.3% Monthly
24.4% Weekly
17.8 % Every Other Week
Direct Mail Frequency to Typical Person on List:
42.2% Quarterly
15.6% Will Not Send Any Direct Mail
13.3% Twice a Year / Monthly (tie)
Content You Will Spend the Most Time Producing:
51.1% Email Newsletter Articles
37.8% Email Fundraising or Advocacy Appeals
37.8% Blog Posts
Three Biggest Challenges:
44.4% Lack of time to produce quality content
37.8% Lack of budget for direct expenses
28.9% Producing engaging content / Lack of clear strategy
(tie)
Compared to Organizations with Different Missions,
These Organizations Are . . .
• Most likely to say that “thought leadership or positioning
themselves as an expert” and “building a print or email
list” as top goals
• Most likely to identify media relations/PR as an important
communications channel and to say they will spend the
most time on blog posts
• Most likely to identify print marketing and paid
advertising as least important communications channels
34
If you are looking for tips and training on how to
produce smart and savvy marketing,
communications, and fundraising for your good
cause, stop by NonprofitMarketingGuide.com.
Get your free membership to our Learning Center at
NonprofitMarketingGuide.com/members
Keep up with the latest daily news, resources, and
advice on Kivi’s Nonprofit Communications Blog at
NonprofitMarketingGuide.com/blog
Sign up for our weekly Marketing Tips e-newsletter
at NonprofitMarketingGuide.com/enews
Download this report and graphics from it at
NonprofitMarketingGuide.com/2013
This work is licensed
under a Creative
Commons Attribution-
NonCommercial-
ShareAlike 3.0 License


![Whitepaper - Align Corporate Communications To Achieve Business Goals V2[1]](https://img.pdfslide.us/doc/110x75/5573897dd8b42a9f288b4ae2/whitepaper-align-corporate-communications-to-achieve-business-goals-v21.jpg)