Embed Size (px)
Citation preview

Vol. 149: 23-34. 1997 MARINE ECOLOGY PROGRESS SERIES
Mar Ecol Prog Ser l
Published April 10
Nonparametric regression modelling of green sea turtle growth rates (southern Great Barrier Reef)
Colin Limpus, Milani Chaloupka*
Queensland Department of Environment. PO Box 155, Brisbane Albert Street. Queensland 4002, Australia
ABSTRACT: Somatic growth rates recorded between 1974 and 1991 for green sea turtles Chelorl~a rnydas resident in the southern Great Barrier Reef (sGBR) foraging grounds of the sGBR genetic stock were modelled using nonparametrlc regression. The sampling deslgn in this long-term mark-recapture program was mixed longitudinal and ~ncluded growth records for female and male turtles 1-anglng between 39 and 116 cm CCL (curved carapace length). Distinct sex-specific growth patterns were found, adults displayed constant negligible growth while inter-annual variability in immature female growth attributable to major oceanographic events was evident. Females grew faster than the males from ca 62 to 65 cm CCL with divergent growth patterns following distinct juvenile growth spurts. The expected female size-specific growth rate function was nonmonotonic, rising from recruitment size (>35 cm CCL) to maximum growth of 2.1 cm yr.' at ca 60 cm CCL before declining to negligible growth approaching sexual maturlty at ca 95 to 100 cm CCL. The male size-specific growth rate function was nonmonotonic rising from the sdme recruitment size to maxlmum groiuth of 2 .2 cm yr.' at ca 63 cm CCL before declining faster than females to negligible grotzlth approachlnq sexual maturity at a significantly smaller size, 595 cm CCL Assumlng a post-hatchling pelagic phase of 5 yr, the mean age at sexual maturity for each sex was estimated at 2-40 yr using numer~cal Integration of the expected slze-specific growth rate functions. Expc.cted age-specific growth rate functions for each sex derlved by numerical differentiat~on showed that the juvenile growth s p u ~ t for females resident in the sGBR foraglng grounds occurs at around 9 yr at large since recruitment (60 cm CCL. 214 yr old) and for males at ca 11 yr a t large (63 cm CCL, 216 yr old). Juvenile growth spurts, sex-specific growth, slow size-specific growth rates, inter-annual growth variability of immatures and many decades to sexual maturity are growth characteristics for green sea turtles resident in the sGBR foraging grounds of the sGBR genetic stock.
K E Y WORDS: Somatic growth . Green sea turtles . Great Barrier Reef Nonparametrlc regression
INTRODUCTION
The green sea turtle Chelonia rnydas is a threatened marine turtle species with a broad pantropical distrib- ution and distinct regional population substructures (Bowen et al. 1992). The green turtle has been subject to a long history of extensive human exploitation for meat and egg harvests (Parsons 1962, Nietschmann 1979, Frazier 1980, Mortimer 1992). Green turtle stocks are in decline in many Indo-Pacific regions (Limpus 1993~1, Horikoshi et al. 1994) with the northern Australian genetic stocks (see Norman et al. 1994) rep-
'Addressee for correspondence. E-mail: [email protected]
resenting some of the few remaining stocks with seem- ingly viable breeding populations.
In northern Australian waters, greens have a low probability of being caught incidentally in prawn fish- ery trawls despite being abundant and they also have a low probability of drowning once caught (Poiner & Harris 1996). While the green turtle is not seriously at risk from trawling it is nonetheless caught in large numbers in the northern prawn fishery due to the large fleet size and is also heavily harvested for meat in nearby Torres Strait (Harris et al. 1995), Papua New Guinea (Hirth & Rohovit 1992) and Indonesian waters (Limpus 1994). Moreover, green turtle foraging grounds in coastal habitats are at risk globally from human settlement and coastal land development
0 Inter-Research 1997 R e ~ d l e of full article not perrnrlted

24 Mar Ecol Prog S
(National Research Council 1990). Clearly the green sea turtle is under threat globally and a t increasing risk in northern Australian waters so that improved knowl- edge of this species is needed to ensure the long-term viability of various regional stocks.
We present a comprehensive statistical analysis of green turtle growth rates obtained from a long-term mark-recapture program (Limpus & Reed 1985, Lim- pus 1992) of the southern Great Barrier Reef (sGBR) genetic stock (Norman et al. 1994) resident in sGBR foraging grounds (Limpus et al. 1992). Post-natal somatic growth for most species of sea turtle comprises separate compartments: (1) a n epipelagic post-hatch- ling feeding phase and (2) a benthic feeding phase. This study considers only the benthic phase for green turtles (135 cm CCL, curved carapace length, to sexu- ally mature adults) r e s~den t in sGBR foraging grounds. Greens 135 cm CCL have not been recorded from sGBR foraging grounds so the growth functions pre- sented are not applicable to the as-yet unobserved epipelagic phase (ca 5 to 35 cm CCL). Nonetheless, the growth analysis presented here provides a basis for a better understanding of sea turtle growth dynamics, which is not well known (Chaloupka & Musick 1997), and for modelling of green turtle population dynamics as shown by Chaloupka & Limpus (1996b).
METHODS AND MATERIALS
Data set (green turtle growth rates). The data set comprised 1037 growth records for 537 green turtles (principally from the sGBR genetic stock) tagged with titanium tags in the sGBR feeding grounds between 1974 and 1991. All the rookeries in the sGBR comprise the same panmictic interbreeding stock and are dis- tinct genetically from the northern Great Barrier Reef, Gulf of Carpentaria and Western Australian stocks (Norman et al. 1994). The data set included growth records for both female and male green turtles span- ning the entire post-recruitment phase from 39 to 116 cm CCL, with 27% of the records derived from sexually mature individuals. The 537 individual turtles comprised 261 females and 276 males, providing 532 and 505 growth records respectively, with 41 % of individuals recaptured 2 or more times. All size mea- surements were recorded as midline CCL (cm CCL) m.easured with a fibreglass tape marked in 0.1 cm in- tervals-instrumental measurement error is k0.05 cm but a full analysis of all sources of measurement error (observer, instrumental, calculation) is beyond the scope of this study. Further details of this long-term mark-recapture program can be found elsewhere (Limpus & Reed 1985, Limpus 1992) while Chaloupka & Musick (1997) provide an overview of the sampling
and tagging protocols inherent in sea turtle mark- recapture programs.
Capture-recapture profiles recorded for each turtle included the following: CCL at first capture and recap- tures, sex and maturity determined from visual exami- nation of the reproductive organs using laparoscopy (see Limpus & Reed 1985), year of first capture and years a t large since first capture or previous recapture. Only turtles with recapture intervals 21 yr were in- cluded to help minimise measurement error on growth rate estimation. Recapture intervals ranged from 1 to 12 yr for females and 1 to 10 yr for males, with the median recapture interval being 2 yr for both sexes. Absolute growth rates were derived from these cap- ture-recapture profiles (Chaloupka & Limpus 1997). Both negative and zero growth rates were included in the analysis since, as noted elsewhere (Chaloupka &
Limpus 1996a, Chaloupka & Musick 1997), there is no valid reason to do otherwise.
Sampling design. Somatic growth is a complex time- varying demographic process comprising age, year and cohort effects (Chaloupka & Musick 1997). Year effect is a n environmental factor while the cohort effect is a genetic factor. Confounded time effects can result in biased growth estimates so analyses need to uncouple the time effects. This is not always possible due to limitations imposed by the mark-recapture sam- pling design and because of limitations in reliable aging of sea turtles. The implicit sampling design in this study was mixed longitudinal sampling (sampling with partial replacement) with 41% of individual green turtles recaptured 2 or more times. But because age was unknown, as in most sea turtle studies, the implicit sampling design here confounds year and cohort effects. A discussion of time-varying demo- graphic sampling designs in relation to sea turtle stud- ies is presented in Chaloupka & Musick (1997).
Statistical modelling approach. The relationship between absolute growth rates recorded for each green turtle and specific growth rate predictors (covariates) was modelled statistically using a non- parametric regression approach known as generalized additive modelling (GAM; Hastie & Tibshirani 1990). GAM enables robust analysis of regression models with both nonlinear covanate functional ~ O I - m and non- normal error terms. The GAM regression model pre- sented here used (1) an identity link since no other response tranformation was necessary, (2) a robust quasi-likelihood error function (Hastie & Tibshirani 1990) to minimise any outlier effects on parameter esti- mates and (3) flexible cubic smoothing splines (Hastie & Tibshirani 1990) to model the nonlinear functional relationship between the response and covariates. A quasi-likelihood error function is general, depending only on an empirical mean-variance relationship

L~nlpus & Chaloupka: Nonparametric regression modelling of turtle growth rates 25
derived from the data itself, and is useful for accounting to some extent for correlated error inherent in mixed longitudinal data sets (McCullagh & Nelder 1989).
The GAM fit summary used here comprises 2 parts: (1) a n estimate of the contribution of each predictor to the overall model fit using t-ratio statistical inference and (2) an estimate of the nonlinearity for each contin- uous predictor (nonparametric term) using a nonpara- metric F-ratio test. The basis for using t- and F-ratio in- ference in GAM modelling is well discussed elsewhere (Hastie & Tibshirani 1990, Hastie 1993). Both summary parts are arranged into a tabular format for ease of re- porting and interpretation. A more detailed outline of the GAM approach, rationale for its use in sea turtle growth modelling and the summary format used here was presented in Chaloupka & Limpus (1997)
RESULTS
The GAM model comprised 1 response variable (absolute growth rates) and 5 potential growth factors (sex, maturity.group, year, mean.size, recapture.inter- val-see Table 1). The sex factor is self evident with the remaining 4 factors (maturity.group, year, mean. size, recapture.interva1) nested within sex to form 2 submodels (Fig 1). Maturity.group is the maturity sta- tus for each turtle (where l = immature, 2 = sexually mature adult: see Fig. l a , e ) . Recall that maturity status was determined using laparoscopy (see 'h4ethods and
materials'). Just because an individual was large did not necessarily mean that it was a mature adult- equally, just because a turtle was less than mean adult size did not necessarily mean that it wasn't a sexually mature adult. Without laparoscopy the assignment of individuals to maturity classes based on size criteria would have been erroneous.
Year is an estimate of the effective Julian year of the growth record and was included to account for the implicit time-dependent sampling design (Fig. l b , f ) . The year effect is also a source of growth val-iability due to environmental factors but, because of the mixed longitudinal sampling design inherent in the current study, it is confounded with unknown cohort effects (see Chaloupka & Musick 1997). Moreover, the year effect is imprecise here because not all growth records were for 1 and only l yr duration. While the minimum growth or recapture interval was 1 yr, the median recapture interval was 2 yr Therefore, the year effect was measured in this study with error of 2 yr, making assignment to a specific calendar year inaccurate.
Nonetheless, the year covariate as defined here is a useful proxy of the year effect and should be included in a model because i t is a sampling design constraint inherent In all mark-recapture programs-it is simply an unavoidable part of any growth study that records growth over time (i.e. any longitudinal 01- mixed longi- tudinal sarnpllng program).
Mean.size is the arithmetic mean of CCL at first cap- ture and CCL at subsequent recapture (see Fig l c , g) .
Table 1. Summary of GAM parameter estimates with quasi-likelihood error term and c u b ~ c smoothing splines fitted to green tur- tle growth rates nested within sex. The log-likcllhood ratio test for sex (female and male submodels below) = (303.2 - 198.6) = 104.6 deviance on (518.2 - 491.2) = 27 df, Prob(X2) < 0.0001 npar. nonparametric (nonlinear) effects; df: degrees of freedom; ns: not significant; Prob(F) based on npar df and res~dual deviance df. A significant npar Fmeans the covariate was nonlinear-if a linear model was used then it would have been concluded erroneously that the covariate functiondl relationship with the
response was linear If the t-test for a covaridtc is not significant then the npar F-tcst for nonhnearity is irrelevant
Parameter Est~rnate Asymptotic t-ratio Prob(t) Nonlinear effects (nonpararnetric) standard error npar df npar F Prob(R
P- P
Female submodel (constant) -0.0294 0.7679 -0.038 n s maturity.group -0.4550 0.1268 -3.587 p < 0.001 year -0.0404 0.0089 4.492 p < 0.001 2.9 21.340 p < 0.0001 meansize -0.0258 0.0024 -10.768 p < 0.001 2.9 32.495 p < 0.0001 recapture.interva1 0.0451 0.0187 2.417 p < 0.02 3.0 1.673 ns
Null deviance = 637.3, null df = 531, residual de\ .~ance = 303.2, residual df = 518.2, quasi-llkellhood dispersion parameter = 0.482. K- = (637.3 - 303.2)/637.3 = 0.52
Male submodel (constant) 3.0036 0.6080 4.939 p < 0.001 maturity.group -0.6106 0.0923 -6.615 p c 0.001 year 0.0071 0.0071 1.009 n s 2.9 7.450 p <O 0001 meamsize -0.0289 0.0026 -11.256 p < 0 001 2.9 5 1.822 p <O 0001 recapture.interva1 0 0166 0.0146 1.139 n S 3.0 3.259 p < 0 05
Null deviance = 685.5, null df = 504, residual deviance = 198 6, residual df = 491.2, quasl-likel~hood dispersion parameter = 0 316, R-! - (685 5 - 198.6)/685.5 = 0.71

40
60
80
mea
n si
ze
Fig
. 1.
Gra
phic
al s
umm
ary
of G
AM
mod
el f
it ne
sted
wit
hin
sex
and
sum
mar
ised
in
Tab
le 1
. Fem
ale
grow
th r
espo
nses
sho
wn
In (
a) to
(d
), m
ale
grow
th r
espo
nses
sho
wn
in
(e) t
o (h
). R
espo
nse
vari
able
(gr
owth
rate
) sh
own
on t
he y
-axi
s as
a c
entr
ed s
moo
thed
fun
ctio
n sc
ale
to e
nsur
e va
lid
poin
twis
e 9
5%
con
fide
nce
band
s. C
ovar
iate
sho
wn
on
the
x-ax
is: (
a, e
) mat
urit
y.gr
oup
(1 =
imm
atur
e, 2
= s
exua
lly
mat
ure
adul
ts);
(b, f
) yea
r (g
row
th y
ear
inde
x); (
c, g
) mea
n.si
ze [
mea
n C
CL
(cm
) bet
wee
n fi
rst
capt
ure
and
nex
t re
capt
urel
; (d
, h)
reca
ptur
e.in
terv
a1 in
yea
rs. (
a, e
) Th
e w
idth
of
the
mea
n f
acto
r re
spon
se i
s pr
opor
tion
al t
o sa
mpl
e si
ze w
ith
the
95
% c
onfi
denc
e in
terv
al s
how
n by
cro
ss
bars
. Sol
id c
urve
s in
(b
) to
(d) a
nd
(f)
to (
h) a
re th
e cu
bic
smoo
thin
g sp
line
fit
s fo
r ea
ch c
onti
nuou
s co
vari
ate
cond
itio
ned
on a
ll o
ther
cov
aria
tes
in t
he G
AM
mod
el f
or e
ach
sex
(see
Tab
le 1
). D
otte
d cu
rves
in (
b) to
(d)
an
d (I)
to (
h) a
re p
oint
wis
e 95
%) c
onfi
denc
e cu
rves
aro
und
the
fits

Limpus & Chaloupka: Nonpal-arnetr~c regl-esslon modell~ng of turtle groufth rates 2 7
Mean size is the appropriate size met- ternale green sea turlles male green sea turiles
ric for indexing size-specific growth 3.0 1 I l I I I I 3 0 I I I I I I I
assuming that growth is locally linear a b within a sampling interval (see 2.5 - - 2.5 - Chaloupka & Limpus 1997). This assumption is reasonable if short sam- , 2,0 pling intervals are used, however, in g long-term mark-recapture programs sampling intervals usually span a con- siderable time range. For instance, in the current study sampling intervals ;: ranged from 1 to 12 yr (median = 2 yr) 3 so that this factor (recapture.interva1) 0.5 - has also been included in the model to account for potential bias due to vari-
0.0 - able sampling interval (see Fig. Id , h).
The GAM regression analysis found I I I I I I I I , , , ,
that both maturity.group and mean. -0.5
40 50 60 70 80 90 100 110 120 40 50 60 70 80 90 100 110 120 size nested within sex have a signifi- cant effect on green turtle growth rates Size (CCL cm) Size (CCL cm)
(Table 1). Immature green turtles, irre- Fig. 2. Chelonia mydas. Estimated size-specific growth rate functions for (a) fe-
spective of sex' grew much faster than male and (b) male green turtles from the southern Great Barrier Reef genetic mature bearing in mind that stock derived from the GAM model fit summarised in Table 1 ( 0 ) Fitted values many adults (assessed by laparoscopy) from the GAM model (see Table 1); some plotted circles appear as filled simply are no larger than many large imma- because of many overlapping values. Thc solid curve in each panel is a cubic
tures (Table l , la , e), M ~ ~ ~ , ~ ~ ~ ~ B-spline smooth fitted to those predicted GAM model values to highlight the underlying size-specific growth rate function conditioned on all the covariates
was not only a significant factor affect- ing sex-specific growth rates but was also distinctly nonlinear for either sex (Table 1, Fig. l c , increase in growth rates during the early 1980s g ) . The female growth submodel was significantly dif- (Table 1, Fig. 1b)-a period coincidental with the ferent from the male submodel (Table 1) inferring dis- strongest El Nino-Southern Oscillation (ENSO) event tinct sex-specific growth characteristics (Table 1, log- t h ~ s century (see Wang 1995). On the other hand, nei- likelihood ratio test = 104.6, df = 27, p < 0.0001). The ther year nor recapture.interva1 were factors affecting female size-specific growth rate function (Fig. l c ) is dis- male growth (Table 1) despite the year effect also tinct from the male growth function (Fig. l g ) with the displaying an abrupt but temporary functional form females diverging significantly from males after reach- (Fig. If). ing maximum growth rates around 60 to 65 cm CCL. The GAM nonparametric regression model for either Overall, absolute growth rates for green sea turtles in sex was a good fit to the sex-specific growth data, evi- the sGBR genetic stock are sex, size and maturity status dent in a small residual deviance relative to residual dependent. Moreover, both female and male adult degrees of freedom (Table l ) , acceptable nonparamet- green turtles displayed constant negligible growth fol- ric R2 values (Table 1) and no aberrant residual behav- lowing the onset of sexual maturity around 95 to 100 cm ioural patterns assessed using data visualization (see CCL (Fig. 2 ) . Mature adult males also displayed signifl- Cleveland 1993). Both robust quasi-likelihood disper- cantly slower growth relative to immature males than sion parameters (Table 1) suggest that arbitrary error was evident for mature adult females relative to imma- functions were warranted (see McCullagh & Nelder ture females (cf. maturity.group parameter estimates 1989). However, the R2 = 0.52 for females (Table 1) for each sex in Table 1). indicated that while the GAM model accounted for
Year and recapture.interva1 were also found to 52% of the growth variance, female green turtles still be important factors affecting female growth rates displayed significant individual growth variation when (Table l , Fig. l b , d , respectively). The year effect indi- compared with male growth where 71 % of the vari- cates significant inter-annual growth variation, infer- ance was accounted for (Table 1). In other words, the ring an environmental influence on immature female GAM model explains male growth much better than it growth rates since adult females hardly grow at all. explains female growth. Female growth was clearly For female growth the year effect was distinctly non- more variable than male growth and apparently influ- linear, suggesting an abrupt and somewhat temporary enced by environmental factors.
28 Mar Ecol Prog Ser 149. 23-34, 1997
The advantage of using GAM rather than a linear parametric model is quite apparent when the results of both approaches are compared. For instance, a linear parametric model (GLM; see Draper & Smith 1981) of female growth including quadratic polynomial year and mean.size functions in addition to all other covari- ates only accounted for 39 % of the variance compared to the GAM fit of 52% shown In Table 1. A similar GLM model for male growth accounted for 58 % of the variance compared to the GAM fit of 71 % in Table 1. Yet the GLM models (GLMs) found a significant year effect for male growth, an effect that was discounted by the GAM models (GAMs) when the correct nonlin- ear functional form for the covariates was used. More- over, the GLMs did not find the significant difference between immatuie and mature female growth that was clearly evident in the data using data visualization (Cleveland 1993) and supported by the GAMs.
Overall, the GAMs were good fits while the GLMs were poor fits to the green turtle growth data. It seems that statistical modelling of sea turtle growth data can be more effective using nonparametric regression models that incorporate nonlinear functional form, non-normal error structures and robust parameter esti- mation. Nonetheless, it is important to recall that since the sampling design was mixed longitudinal with unknown age, no growth model (GAM or any other) can account adequately for bias due to confounded year and cohort effects. Therefore, while a strong year effect was evident for immature females, it remains confounded with cohort effects limiting the power of the inference about environmental affects on growth rates.
Covariate function plots for a GAM fit (Fig. 1) are centred on the response scale by subtracting a weighted mean to ensure valid pointwise 95% confi- dence bands (Hastie & Tibshirani 1990). While essen- tial for analytical purposes, centred plots are more dif- ficult for the user to decode on the original response (i.e. growth rate) scale. To aid interpretation of the size-specific growth functions the predicted model val- ues were replotted on the uncentred growth rate scale for each sex with cubic B-spline smooths superimposed to highlight the underlying nonlinear functions (Fig. 2). Note then that Fig. 2 is simply the curves in Fig. l c , g , replotted on the growth rate scale rather than the cen- tred GAM scale. Pointwise confidence bands are no longer valid in this format but the fitted model values provide a clear indication of the expected growth vari- ability around the smoothed sex-specific growth func- tions in Fig. 2.
Distinct sex-specific growth patterns are clearly evi- dent in Figs. lc , g & 2 with immature female green tur- tles growing faster than immature males once they had both reached a size around 60 to 65 cm CCL (Fig. 2).
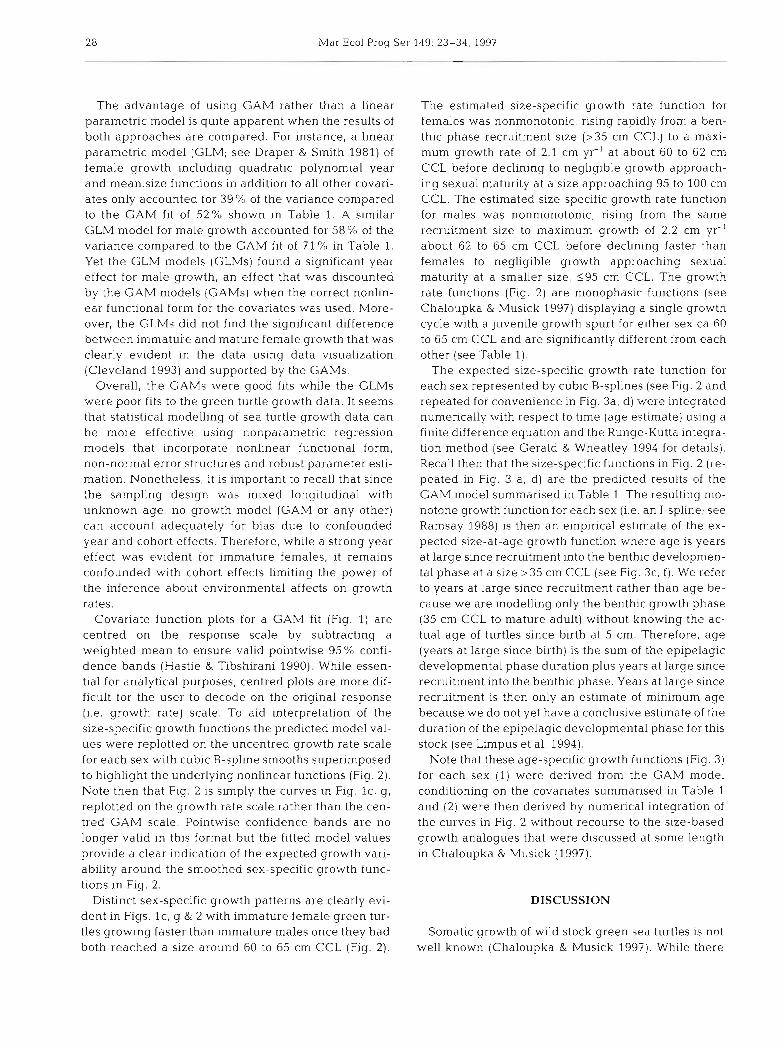
The estimated size-specific growth rate function for females was nonmonotonic, rising rapidly from a ben- thic phase recruitment size (>35 cm CCL) to a maxi- mum growth rate of 2.1 cm yr-' at about 60 to 62 cm CCL before declining to negligible growth approach- ing sexual maturity at a size approaching 95 to 100 cm CCL. The estimated size-specific growth rate function for males was nonmonotonic, rising from the same recruitment size to maximum growth of 2.2 cm yr-' about 62 to 65 cm CCL before declining faster than females to negligible growth approaching sexual maturity at a smaller size, 195 cm CCL. The growth rate functions (Fig. 2) are monophasic functions (see Chaloupka & Musick 1997) displaying a single growth cycle with a juvenile growth spurt for either sex ca 60 to 65 cm CCL and are significantly different from each other (see Table 1).
The expected size-specific growth rate function for each sex represented by cubic B-splines (see Fig. 2 and repeated for convenience in Fig. 3a, d) were integrated numerically with respect to time (age estimate) using a finite difference equation and the Runge-Kutta integra- tion method (see Gerald & Wheatley 1994 for details). Recall then that the size-specific functions in Fig. 2 (re- peated in Fig. 3 a , d) are the predicted results of the GAM model summarised in Table 1 The resulting mo- notone growth function for each sex (i.e. an I-spline; see Ramsay 1988) is then an empirical estimate of the ex- pected size-at-age growth function where age is years at large since recruitment into the benthic developmen- tal phase at a size >35 cm CCL (see Fig. 3c, f ) . We refer to years at large since recruitment rather than age be- cause we are modelling only the benthic growth phase (35 cm CCL to mature adult) without knowing the ac- tual age of turtles since birth at 5 cm. Therefore, age (years at large since birth) is the sum of the epipelagic developmental phase duration plus years at large since recruitment into the benthic phase. Years at large since recruitment is then only an estimate of minimum age because we do not yet have a conclusive estimate of the duration of the epipelagic developmental phase for this stock (see Limpus et al. 1994).
Note that these age-specific growth functions (Fig. 3) for each sex (1) were derived from the GAM model conditioning on the covariates summarised in Table 1 and (2) were then derived by numerical integration of the curves in Fig. 2 without recourse to the size-based growth analogues that were discussed at some length in Chaloupka & Musick (1997).
DISCUSSION
Somatic growth of wild stock green sea turtles is not well known (Chaloupka & Musick 1997). While there

Limpus & Chaloupkd. Nonparametric regl-esslon niodell~ng of turtle growth rates 2 9
Curved Carapace length (cm) Years at Large
Curved Carapace lenglh (cm) Years at Large
0 10 20 30 40 50 60 70 80 90 100
Years at Large
35 0 10 20 30 40 50 60 70 80 90
Years at Large
Fig. 3. Chelonia mydas. Estimated age- and size-specific growth functions for each sex derived from the GAM model fi t that was conditioned on all the covariates (Table 1). Female growth functions shown In (a) to (c); corresponding male functions in (d) to ( f ) . (a, d ) The size-specific growth rate functions derived using cubic B-spline fit to the GAM predicted values are reproduced (see Fig. 2). Those functions were integrated numerically to give the expected size-at-age (age = years a t large) functions for (c) females and ( f ) males, conditioned on all the covariates in the GAM model. The expected size-at-age spline functions (c) and ( f ) were then differentiated numerically with respect to time to give the expected age-specific growth rate functions shown for ( b ) females and ( e ) males. 95% confidence curves are not included because the functions (c, f ) are arbitrary smooth functions
denved from other smooth functions (a , d ) with no feasible way to estimate valid pointwise standard errors
are several compilations of growth rates of green turtles reared in captivity (Zug et al. 1986, Godinez- Dominguez et al. 1993) these data bear little re- semblance to growth observed in wild stocks. For in- stance, green turtle growth in captivity is generally much faster than growth in wild stocks (Bjorndal 1985)-that is, captive reared sea turtles reach a given carapace size or maturity at an earlier time. Moreover, capt~vity studies involve longitudinal sam- pling wlth known age, resulting in confounded age and year effects. On the other hand, wild stock growth studies invariably involve mixed longitudinal sampling with unknown age, confounding cohort and year effects. The sampling designs implicit in captive and wild stock growth studies lead to different sam- pling biases for time-dependent demographic pro- cesses such as growth (Chaloupka & Musick 1997) and so are not strictly comparable. Hence there is no
substitute for growth studies based on wild sea turtle stocks, especially where these data are then used in population dynamic models for evaluating conserva- tion policy options.
The green turtles considered in the current study were from the sGBR genetic stock (Norman et al. 1994) resident in the sGBR foraging grounds (Limpus et al. 1992) Rookeries for this stock occur on most coral cays in the sGBR region. The green turtles in this sample spanned the entire post-pelagic phase ranging from 39 to 116 cm CCL in size, with both sex and maturity confirmed using laparoscopy (see Limpus & Reed 1985). Therefore the size- and age-specific growth functions developed here for green turtles resident in sGBR waters are the first substantive somatic growth functions presented for any wild sea turtle stock for the entire post-pelagic ontogenetic phase (see Chaloupka & Musick 1997).

30 Mar Ecol Prog Ser 149: 23-34, 1997
Size-specific growth rate functions
The usual approach adopted for analysis of sea tur- tle growth with unknown age has been size-based analogues of age-based parametric growth curves (Chaloupka & Musick 1997). This approach has sev- eral shortcomings: (1) a parametric function (e.g. von Bertalanffy, logistic, Gompertz) must be arbitrarily pre-specified, (2) factors affecting growth such as maturity status, sampling design constraints and sex are not taken into account when deriving the size- specific growth function and (3) the growth parame- ters derived from such analogues are not equivalent to age-based parameters and so cannot be substituted into age-based functions to derive size-at-age curves, despite this being a common practice (Chaloupka & Musick 1997).
The 2-stage modelling approach of Chaloupka & Limpus (1996a) adopted in the current study com- prised: (1) a nonparametric statistical model of growth rates for unknown age sea turtles to derive the expected size-specific growth rate function for each sex conditioned on informative covariates and sam- pling design constraints, followed by (2) numerical integration of the size-specific growth rate functions to derive an estimate of the expected size-at-age growth functions for each sex. This 2-stage approach, while analytically demanding, is more likely to help unravel the interactions involved in the complex growth dynamics of sea turtles.
The statistical growth rate modelling In the current study found distinct nonmonotonic size-specific growth rate patterns for each sex (Table 1. Fig. 2). The distinct growth pattern with a single growth spurt (monophasic; see Chaloupka & Musick 1997) for either juvenile female or male greens at around 60 to 65 cm CCL (see Fig. 2) is characteristic of this sGBR stock. A similar GAM modelling approach was used by Chal- oupka & Limpus (1997) to analyse somatic growth rates for hawksbill turtles also resident in sGBR waters. They also found nonmonotonic growth patterns with a single juvenile growth spurt around 60 cm CCL and slow immature growth rates, suggesting that these might be growth features characteristic of sea turtle species from sGBR waters.
Sex-specific growth
The female and male green size-specific growth functions in the current study were found to be statisti- cally different, with large juvenile females growing faster a t all sizes >60 cm CCL than comparably sized males (Table 1, Fig. 2), implying significant sexual dimorphism in size at maturity. Chaloupka & Limpus
(1997) also found sex-specific growth rate functions for hawksbill turtles resident in sGBR waters.
Sex-specific growth has not been recorded previ- ously for any other stocks of green sea turtles. Yet adult size dimorphism is well known for breeding green sea turtles (Limpus 199313). The sex-specific growth func- tions (Fig. 2) indicate that mature male green turtles from the sGBR genetic stock resident in sGBR foraging grounds are smaller on average than mature females. Mean breeding size for male sGBR genetic stock tur- tles resident in sGBR foraging grounds was estimated a t 98 cm CCL with mean female breeding size esti- mated at 103 cm CCL (Limpus & Reed 1985). Numeri- cal integration of the growth functions shown in Fig. 3 gives mean adult size estimates consistent with these empirical estimates of mean breeding size for female and male green sea turtles from the sGBR stock.
The only previous statistical analysis of growth rates in a wild green turtle stock was presented by Bolten et al. (1992) using a linear regression model. They found that growth rates of immature green turtles restricted to a developmental habitat in the Bahamas displayed a monotonic and linear decreasing function of size for the observed size range (25 to 70 cm straight carapace length, SCL). They concluded that there was no sex- specific difference in mean growth rates but the female and male subgroups were nonequivalent due to varia- tion in sex ratios among size classes and so are not strictly comparable-males were disproportionately smaller than females, indicative of either a cohort effect or that males in fact grew more slowly than females at the same size.
Environmental effects on growth
A significant environmental influence on immature females growth rates was found in this study (Table 1, Fig. l b) that has not been reported elsewhere for any other sea turtle species. It seems there was an abrupt but temporary increase in immature female growth rates during the early 1980s coincident with the strongest El Nino-Southern Oscillation (ENSO) event this century (Wang 1995). The physiological mecha- nism underlying this environmental effect is unknown at this stage but would seem most likely to be a func- tion of nutrition and reproductive ecology. Limpus & Nicholls (1994) have shown using laparoscopy that the proportion of female green turtles in the sGBR prepar- ing to breed in a given year is a delayed response to the onset of ENSO events, which are themselves a function of sea surface temperature anomalies. This functional relationship between acceleration of juve- nile growth rates, proportion of breeding females and the onset of ENSO events has been incorporated into a

Lln~pus & Chaloupka . Nonpararnetric regl -esslon modelling of turtle groivth rates 3 1
stochastic simulation model of sGBR green turtle pop- ulation dynamics (see Chaloupka & Limpus 199613).
Nonetheless, caution in interpreting the apparent environmental affect is warranted. The year effect on growth suggested by the GAM model is only a proxy measure of all the environmental ~nfluences actually experienced by the green turtles in the sGBR foraging grounds. Also the timing of the year effect is imprecise because of sampling error due to the variable recap- ture intervals. Only if all recapture intervals were of 1 yr duration would this then not be an issue, but recapture ~ntervals in such s tud~es invariably span many years because of field sampling logistics. Recap- ture intervals in the current study ranged from 1 to 12 yr with a median recapture interval of 2 yr. The observed year effect (Table 1, Fig. l b ) therefore com- prises variability due to measurement error in addition to environmentally induced variability. Moreover, the year effect is also confounded with cohort effects due to sampling design constraints inherent in a mixed lon- gitudinal sample with unknown age further making it difficult to draw strong inferences about environmen- tal effects.
Given the 2 issues of confounded cohort effects and imprecise year effect coding (see 'Methods and materi- als'), only a weak form of inference about environmen- tal effects is possible-an environmental effect on immature female growth rates was evident but incon- clusive due to the study limitations. Conclusive infer- ence about environmental effects on sea turtle somatic growth will only be possible when ( l ) reliable age esti- mates for individual green sea turtles and (2) a large data set of individual growth records estimating growth rates for 1 and only 1 yr duration are available. Further studies of green turtle stocks are required to develop better insight into the complexity of environ- mental effects on sea turtle somatic growth rates.
Geographical growth patterns
The current study found distinct nonmonotonic size- specific growth patterns for either sex for the sGBR green turtle stock (Fig. l c , g). Several studies (Frazer & Ehrhart 1985, Bjorndal & Bolten 1988, Boulon & Frazer 1990, Bjorndal et al. 1995) have proposed or implied that green turtle stocks resident in western Atlantic- Caribbean waters display monotonic decreasing size- specific growth rates implying no growth spurts. Yet Ehrhardt & Witham (1992) found a nonmonotonic age- specific growth rate pattern with a growth spurt esti- mated at 10 to 11 yr of age for a sample of immature head-started (known age) green turtles from the same region. Several other studies of wild stock green sea turtle growth have also found nonmonotonic size-spe-
cific growth patterns (see Chaloupka & Musick 1997). For instance, Collazo e t al. (1992) found nonmonotonic growth for wild stock immature greens resident in Puerto Rican waters as did Green (1993) for immature wild stock greens from the Eastern Pacific (Galapagos Archipelago).
While there are a number of sampling protocol and statistical concerns with all these sea turtle growth studies (see Chaloupka & Musick 1997) it would seem that a nonmonotonic size- or age-specific growth rate pattern is a characteristic observed in many green sea turtle stocks. If this is so, then such stocks display luve- nile or mid-adolescent growth spurts possibly indica- tive of a significant ontogenetic shift associated with developmental migrations or dietary changes.
There also appear to be significant regional differ- ences in the magnitude of immature growth rates. Size-specific growth rates for immature sGBR green turtle stock recorded from the current study are slower than those recorded for stocks from western Atlantic- Caribbean waters, irrespect~ve of whether monotonic (Frazer & Ehrhart 1985, Boulon & Frazer 1990, Bjorndal et al. 1995) or nonrnonotonic (Collazo et al. 1992) growth rates were implied. For instance, Boulon &
Frazer (1990) found a mean growth rate for immature greens in US Virgin lsland waters of 4.8 cm SCL yr-' (SE = 0.46) while Collazo et al. (1992) for a similar size range found a mean growth rate in Puerto Rican waters of 5.1 cm SCL yr-' (SE = 0.83). On the other hand, the mean growth rate for a comparable size range of immature greens in the current study (sGBR) was 1.7 cm CCL yr-l (SE = 0.03).
Balazs et al. (1994) also found slow growth (mean =
1.9 cm SCL yr-', SE = 0.13) for immature greens resi- dent in southern Hawaiian waters while Green (1993) recorded even slower growth rates for immature green turtles from the Galapagos Archipelago. Even allow- ing for transformation of SCL to CCL growth values, limited data sets and stock-specific mature adult size it seems that immature green turtles grow much slower in the Western, Central and Eastern Pacific regions than in western Atlantic-Caribbean waters (see also Green 1993). These general growth patterns are also consistent with the broad phylogenetically derived population substructures proposed by Bowen et al. (1992) for green sea turtles.
Geographical differences in imm.atu.re growth rates might also explain why mature female greens in the Pacific Ocean are apparently smaller than greens nest- ing for instance at rookeries in the western Atlantic- Caribbean and southwestern Indian Ocean (van Bus- kirk & Crowder 1994). Whether these inter-regional differences in immature growth rates are real is incon- clusive for the moment since most green turtle data sets are too small for comparative analysis. On the

Mar Ecol Prog Ser 149: 23-34, 1997
other hand, adult green turtle growth is consistently recorded across regions as either negligible or perhaps having ceased altogether. For instance, Carr & Good- man (1970) found that female greens nesting at Tor- tuguero (Costa Rica) grew at 10.4 cm SCL yr-'. The current study for the sGBR genetic stock found mature adult female growth rates of 0.12 cm yr-' (SE = 0.04) at 100 to 105 cm CCL and for mature adult males of 0.07 cm yr-' (SE = 0.02) at 95 to 99 cm CCL. Adult male or female somatic growth is clearly negligible once sexual maturity is reached at some size around 95 to 100 cm CCL for the sGBR genetic stock (see Fig. 2).
Expected size-at-age function
The size-specific growth functions for sGBR genetic stock (Fig. 3a, d) were numerically integrated to yield expected size-at-age growth functions (Fig. 3c, f ) use- ful for trying to estimate sex-specific age at adult matu- rity or for modelling population dynamics. Chaloupka & Limpus (1996a) fitted a system of Weibull-type growth equations to similar expected size-at-age func- tions represented by the monotone splines in Fig. 3c, f (a description of this system of nonlinear equations will be presented elsewhere although the single equation form is given in Chaloupka & Musick 1997). They esti- mated that green turtles from this stock increase in size from recruitment size (mean = 44.1 cm CCL, SE = 0.61; Limpus unpubl. data) to an asymptote (mean adult size) of 106 cm CCL for females and 99 cm CCL for males. Taking these estimates in conjunction with Fig. 3c, f , suggests that the estimated mean age of breeding females or males in the sGBR green turtle stock is 275 yr at large since recruitment, which is also a minimum estimate of mean life expectancy since green turtle growth is negligible or ceased by this age or size. These age estimates for mean adult size must not be confused with estimates of mean age at sexual maturity or first breeding, which is reached at a smaller size (and hence younger age) than the mean breeding size inferred by using the estimated size-at-age asymptotes (see discussion below).
Age-specific growth rate function
The estimated size-at-age growth functions (Fig. 3c, f ) presented in the current study were also differenti- ated numerically with respect to time to yield age-spe- cific growth rate functions (Fig. 3b, e) , which suggest that the observed juvenile growth spurt for females in the sGBR stock occurs about 9 to 10 yr at large (60 cm CCL) and about 11 to 12 yr at large (63 cm CCL) for males. Ehrhardt & Witham (1992) found that a juvenile
growth spurt occurred around 10 to 11 yr of age for their head-started (known age) immature green turtle stock in the Western Atlantic.
Assuming that the unobserved post-hatchling pelagic phase for the sGBR stock is 25 yr (see Limpus et al. 1994) then it is estimated that the female juvenile growth spurt occurs around 214 yr of age while the male juvenile growth spurt occurs around 216 yr of age. Growth slows rapidly following the juvenile or mid-adolescent growth spurt and hence turtles from this sGBR stock take many years to reach sexual maturity.
Age at maturity estimation
It is common practice to use somatic growth func- tions (size-at-age curve) to estimate mean age at sex- ual maturity. The difficulty in using growth functions for this purpose is the lack of conclusive growth criteria to indicate onset of sexual maturity. Minimum or mean female nesting size are commonly used criteria that assume amongst many things that growth is not sex- specific.
For instance, Ehrhardt & Witham (1992) fitted a para- metric growth function to a small sample of immature green turtles and suggested that sexual maturity was reached at 19 yr based on the minimum nesting female size criterion. But it is doubtful whether the minimum nesting size criterion is valid, because large mature adults tend also to have more rapid growth and devel- opment and therefore reach maturity at a younger age, resulting in an anomalous mean age at maturity esti- mate (see Frazer & Ehrhart 1985). Moreover, the age at maturity estimate proposed by Ehrhardt & Witham (1992) corresponds with turtles still growing at close to estimated maximum growth rates indicating that tur- tles in that stock had not reached anywhere near sex- ual maturity by 19 yr-sexually mature green sea tur- tles display negligible growth (Carr & Goodman 1970, Limpus 1993b, this study). The mean nesting size crite- rion applied to the growth functions presented by Ehrhardt & Witham (1992) suggests that an estimate of mean age at maturity approaching 40 yr might be far more reasonable.
But whether the mean nesting size criterion is itself a valid estimate of onset of sexual maturity is also ques- tionable. However, without reliable estimates of size- or age-specific maturity rates it is not possible to resolve this issue. There are no explicit size- or age- specific maturity rate functions for green sea turtles but the basis for such estimates exist using laparoscopy and the reproductive and maturity status scoring crite- ria of Limpus (1992). Nonetheless, Limpus & Reed (1985) and Limpus et al. (1994) presented quasi-size-

Linlpus & Chaloupka: Nonparametric regression modelling of turtle growth rdtes
specific maturity functions based on 5 cm CCL size classes, indicating that the mean transition from pubescent immature to sexually mature adult status occurs around 90 to 95 cm CCL for the sGBR green stock (i.e. 50% of 90 to 95 cm CCL turtles were classi- fied as mature adults using laparoscopy).
Without explicit sex-specific maturity functions it is difficult to estimate with any reliability the mean age at sexual maturity for the current study although the tur- tles displayed negligible growth by 595 cm CCL (ca 35 yr at large) for either sex, implying this as a plausi- ble size threshold to be reached prior to onset of sexual maturity (see Fig. 3a, b, d , e ) . The onset of negligible growth rates by 95 cm CCL is consistent with the crude maturity rate estimates proposed by Limpus & Reed (1985) and Limpus et al. (1994) for the same genetic stock. Given these considerations it would seem rea- sonable to conclude that the mean age at sexual matu- rity would be 240 y r for the sGBR stock-35 yr at large plus say 5 yr as a reasonable crude estimate for the epipelagic phase duration (see Limpus et al. 1994 for recapture of ~mnlature greens marked as hatchlings in the sGBR).
It seems apparent then that maturity estimates for either male or female greens in the sGBR would be grossly overestimated using a mean breeding size cri- terion rather than a negligible growth criterion or, preferably, an explicit maturity rate function. Nonethe- less, green sea turtles in the sGBR stock clearly grow slowly and hence take many decades to reach sexual maturity as proposed by Limpus (1993b).
Acknowledgements. This work was funded in part by grants from the Australian Nature Conservation Agency, Australian Department of Science (Marine Science and Technology) and the Great Barrier Reef Marine Park Authority. Field assis- tance was provided by S. Allen. D. Walter, A. Fleay, P. Reed, E. Gyuris, D. Reimer and numerous volunteer assistants. We thank K. Bjorndal, A. Meylan. J . Miller and the anonymous referees for helpful comments on the manuscript.
LITERATURE CITED
Balazs GH, Dudley WC, Hallacher LE, Coney JP, Koga SK (1994) Ecology and cultural significance of sea turtles at Punalu'u, Hawall. In: Bjorndal KA, Bolten AB, Johnson DA, El~azar PJ (eds) Proceedings of the Fourteenth Annual Symposium on Sea Turtle Biology and Conservation. NOAA Tech Memo NMFS-SEFSC-351: 10-13
Bjorndal KA (1985) Nutritional ecology of sea turtles. Copeia 1985:736-751
Bjorndal KA, Bolten AB (1988) Growth rates of immature green turtles, Chelonia mydas, on feeding grounds in the southern Bahamas. Copeia 1988:555-564
Bjorndal KA. Bolten AB. Coan AL. Kleiber P (1995) Estimation of green turtle (Chelonia mydas) growth rates from length-frequency analysis. Copeia 1995:71-77
Bolten AB, Bjorndal KA, Grumbles JS, Owens DM' (1992) Sex ratio and sex-specific growth rates in immature green tur-
tles. Chelon~a n~ydas , In the southern Bahamas. Copeia 1992.1098-1103
Boulon RH, Frazer NB (1990) Growth of wild juvenile Caribbean green turtles, Chelon~a n~ydas . J Herpetol 24:44 1-445
Bowen BW. Meylan AB. Ross JP, Limpus C'J, Ildlazs C H , A v ~ s e J C (1992) Global population structure! and natural history of the green turtle (Chelonia mydas) In terms of matriar- chal phylogeny. Evolution 46365-881
Carr A, Goodman D (1970) Ecolog~cal implications of size an6 growth in Chelonia. Copela 1970:783-786
Chaloupka MY, Limpus CJ (1996a) Robust statistical model- l ~ n g of Chelonia mydas growth rates-southern Great Barrier Reef. In: Keinath JA, Barnard DE, Musick JA, Bell BA (compliers) Proceedings of the Fifteenth Annual Sym- posium on Sea Turtle Biology and Conservation. NOAA Tech Memo NMFS-S1:I:SC-387:62-65
Chaloupka MY, Limpus CJ (1996b) Heuristic modelling ol Chelonia mydas population dynamics-southern Great Barrier Reef. In: Keinath JA, Barnard DE, Musick JA, Bell BA (comp~lers) Proceedings of the Fifteenth Annual Sym- posium on Sea Turtle Biology and Conservation. NOAA Tech Memo NMFS-SEFSC-38?:66-69
Chaloupka MY, L~mpus CJ (1997) Robust statistical modelling of hawksbill sea turtle growth rates (southern Great Bar- rler Reef) Mar Ecol Prog Ser 146:l-8
Chaloupka MY. Muslck JA (1997) Age, growth and popula- tion dynarnlcs. In. Lutz PJ, Musick JA (eds) The biology of sea turtles. Chap 9. CRC Marine Science Senes , CRC Press Inc. Boca Raton, p 235-278
Cleveland WS (1993) Visualizing data. Hobart Press, Summit. NJ
Collazo JA. Boulon RH, Tallevast TL (1992) Abundance and growth patterns of Chelonia mydas in Culebra, Puertc Rico. J Herpeto126:293-300
Draper NR. Smith H (1981) Applied regression analysis, 2nd edn. John Wiley and Sons, New York
Ehrhardt NM, Witham R (1992) Analysis of growth of the green sea turtle (Chelonia mydas) in the western central Atlantic. Bull Mar Sci 50:275-281
Frazer NB, Ehrhart LM (1985) Preliminary growth models for green, Chelonia mydas, and loggerhead, Caretta caretta turtles in the wild. Copeia 1985:73-79
Frazier J (1980) Exploitation of marine turtles in the Indian Ocean. Human Ecol 8:329-370
Gerald CF, Wheatley PO (1994) Applied numerical analysis, 5th edn Add~son-Weslt?y Publishing Company, Reading, MA
Godlnez-Domlnguez E , Carretero-Montes RE, Silva-Batiz Fdt~,!, Ku~z S, Aguilar B (1993) Crecimiento de neonatos de Chelon~a agassizii (Testudines: Chelonldae) e n cau- tlvel-10. Rev B101 Trop 41:253-260
Green I> (1993) Growth rates of wild Immature green turtles In the Galapagos Islands, Ecuador. J Herpetol 27:338-341
Har r~s AN, Dews G, Bishop M, Pitcher C (1995) Transfer of traditional fisheries monitoring in Torres Strait to AFMA w ~ t h training: annual estimate of the catch of dugong and turtle. TSI5AC Rcport No. 23, April 1995, CSIRO Division of Fisher~es. ('lt.vcland, Australia
Hastie TJ (1993) Lcneralized additive models. In: Chambers JM. H a s t ~ e TJ (cds) Statistical models In S , Chap 7. Chap- man and Hall, New York, p 249-307
Hastie TJ, T ~ b s h i r a n ~ RJ (1990) Generalized additive models. Monographs on statistics and applied probability, 43. Chapman and Hall. London
Hirth HF, Rohovit DL (1992) Marketing patterns of green and hawksbill turtles in Port Moresby, Papua New Guinea. Oryx 26:39-42
34 Mar Ecol Prog Ser 149: 23-34, 1997
Horikoshi K, Suganuma H, Tachikawa H, Sato F, Yamaguchi M (1994) Decline of Ogasawara green turtle population in Japan. In: Bjorndal KA, Bolten AB, Johnson DA, Eliazar PJ (eds) Proceedings of the Fourteenth Annual Symposium on Sea Turtle Biology and Conservat~on. NOAA Tech Memo NMFS-SEFSC-351:235-237
Limpus CJ (1992) The hawksbill turtle, Eretrnochelys imbn- cata, in Queensland: population structure within a south- ern Great Barrier Reef feeding ground. Wildl Res 19. 489-506
Lirnpus CJ (1993a) The worldwide status of rnanne turtle con- servation. In: Nacu A, Trono R, Palma JA, Torres D, Agas F (eds) Proceedings of the First ASEAN Symposium- Workshop on Marine Turtle Conservation. World Wildlife Fund, Manila, p 43-61
Limpus CJ (1993b) The green turtle, Chelonia mydas, In Queensland: breeding males in the southern Great Barner Reef. Wildl Res 20:513-523
Limpus CJ (1994) Current declines in southeast Asian turtle populations. In: Schroeder BA, Witherington BE (eds) Pro- ceedings of the Thirteenth Annual Symposium on Sea Turtle Biology and Conservation. NOAA Tech Memo NMFS-SEFSC-34 1:89-91
Limpus CJ. Couper PJ, Read MA (1994) The green turtle, Chelonia rnydas, in Queensland: population structure in a warm temperate feeding area. Mem Queensland Mus 35: 139-154
Limpus CJ, Miller J D , Parmenter CJ, Reimer D , McLachlan N, Webb R (1992) Migrat~on of green (Chelonia mydas) and loggerhead (Caretta caretta) turtles to and from eastern Australian rookeries. Wildl Res 19:347-358
Limpus CJ, Nicholls N (1994) Progress report on the study of the interaction of the El Nino-Southern Oscillation on annual Chelonia mydasat the southern Great Barrier Reef rookeries In: James R (ed) Proceedings of the Marine Tur- tle Conservation Workshop. Austral~an National Parks
This article was submitted to the editor
and Wildlife Service, Canberra, p 73-78 Limpus CJ. Reed PC (1985) The green turtle. Chelonia my-
das, in Queensland: a preliminary description of the popu- lation structure in a coral reef feeding ground. In: Grigg G, Shine R, Ehmann H (eds) Biology of Australasian frogs and reptiles. Royal Society of New South Wales, Sydney, p 47-52
McCullagh P, Nelder JA (1989) Generalized linear models, 2nd edn. Monographs on statistics and applied probabil- ity, 37. Chapman and Hall, London
Mortimer JA (1992) Marine turtle conservation in Malaysia Malayan Nat J 45:353-361
National Research Council (1990) Decline of sea turtles. causes and prevention. National Academy Press, Wash- ington, DC
Nietschmann B (1979) Ecological change, inflation, and migrat~on in the far western Caribbean. Geogr Rev 69: 1-24
Norman JA, Moritz C, Limpus CJ (1994) Mitochondrial DNA control region polymorphisms: genetic markers for ecolog- ical studies of marine turtles. Molec Ecol3:363-373
Parsons JJ (1962) The green turtle and man. University of Florida Press, Gainesville
Poiner IR. Harris ANM (1996) The incidental capture, direct mortality and delayed mortality of turtles in Austral~a's northern prawn fishery. Mar Biol 125:813-825
Ramsay J (1988) Monotone splines in action (with discussion). Statist Sci 3:425-461
van Busklrk J , Crowder LB (1994) Life-hlstory variation in marine turtles. Copeia 1994:66-81
Wang B (1995) Interdecadal changes in El Nino onset In the last four decades. J Clim 8: 267-285
Zug GR. Wynn AH, Ruckdeschel C (1986) Age determination of loggerhead sea turtles, Caretta caretta, by incremental growth marks in the skeleton. Sm~thsonian Contrib Zoo1 427:l-34
Manuscript first received: September 24, 1996 Revised version accepted: February 7, 1997


![Applied Nonparametric Regression [Hardle]](https://img.pdfslide.us/doc/110x75/551eb84d497959cf398b4b76/applied-nonparametric-regression-hardle.jpg)
![(eBook-PDF) - Statistics - Applied Nonparametric Regression[1]](https://img.pdfslide.us/doc/110x75/55cf99ab550346d0339e92b5/ebook-pdf-statistics-applied-nonparametric-regression1.jpg)


![[Smith, Kohn, 2000] Nonparametric Seemingly Unrelated Regression](https://img.pdfslide.us/doc/110x75/577cd1081a28ab9e7893727a/smith-kohn-2000-nonparametric-seemingly-unrelated-regression.jpg)