Embed Size (px)
Citation preview

Nonparametric Interrogation of TranscriptionalRegulation in Single-Cell RNA and ChromatinAccessibility Multiomic DataYuriko Harigaya
University of North CarolinaZhaojun Zhang
University of PennsylvaniaHongpan Zhang
University of VirginiaChongzhi Zang
University of VirginiaNancy Zhang ( [email protected] )
University of Pennsylvania https://orcid.org/0000-0002-0880-5749Yuchao Jiang
University of North Carolina
Article
Keywords: single-cell multiomics, transcriptional regulation, transcription factor, chromatin accessibility
Posted Date: September 28th, 2021
DOI: https://doi.org/10.21203/rs.3.rs-930184/v1
License: This work is licensed under a Creative Commons Attribution 4.0 International License. Read Full License

Nonparametric Interrogation of Transcriptional Regulation in Single-Cell RNA and
Chromatin Accessibility Multiomic Data
Yuriko Harigaya1, Zhaojun Zhang2, Hongpan Zhang3,4, Chongzhi Zang3,4,5, Nancy R
Zhang2,*, Yuchao Jiang6,7,8,*
1 Curriculum in Bioinformatics and Computational Biology, School of Medicine, University of
North Carolina, Chapel Hill, NC 27599, USA.
2 Department of Statistics, The Wharton School, University of Pennsylvania, Philadelphia, PA
19104, USA.
3 Center for Public Health Genomics, University of Virginia, Charlottesville, VA 22908, USA.
4 Department of Biochemistry and Molecular Genetics, University of Virginia, Charlottesville,
VA 22908, USA.
5 Department of Public Health Sciences, University of Virginia, Charlottesville, VA 22908,
USA.
6 Lineberger Comprehensive Cancer Center, University of North Carolina at Chapel Hill, NC
27599, USA.
7 Department of Genetics, School of Medicine, University of North Carolina, Chapel Hill, NC
27599, USA.
8 Department of Biostatistics, Gillings School of Global Public Health, University of North
Carolina, Chapel Hill, NC 27599, USA.
* To whom correspondence should be addressed: [email protected],
2
Abstract 1
Epigenetic control of gene expression is highly cell-type- and context-specific. Yet, 2
despite its complexity, gene regulatory logic can be broken down into modular 3
components consisting of a transcription factor (TF) activating or repressing the 4
expression of a target gene through its binding to a cis-regulatory region. Recent 5
advances in joint profiling of transcription and chromatin accessibility with single-cell 6
resolution offer unprecedented opportunities to interrogate such regulatory logic. Here, 7
we propose a nonparametric approach, TRIPOD, to detect and characterize three-way 8
relationships between a TF, its target gene, and the accessibility of the TF’s binding site, 9
using single-cell RNA and ATAC multiomic data. We apply TRIPOD to interrogate cell-10
type-specific regulatory logic in peripheral blood mononuclear cells and contrast our 11
results to detections from enhancer databases, cis-eQTL studies, ChIP-seq experiments, 12
and TF knockdown/knockout studies. We then apply TRIPOD to mouse embryonic brain 13
data during neurogenesis and gliogenesis and identified known and novel putative 14
regulatory relationships, validated by ChIP-seq and PLAC-seq. Finally, we demonstrate 15
TRIPOD on SHARE-seq data of differentiating mouse hair follicle cells and identify 16
lineage-specific regulation supported by histone marks for gene activation and super-17
enhancer annotations. 18
19
Keywords: single-cell multiomics, transcriptional regulation, transcription factor, 20
chromatin accessibility. 21
3
Context-specific regulation of gene transcription is central to cell identity and function in 22
eukaryotes. Precision of transcriptional control is achieved through multitudes of 23
transcription factors (TFs) that bind to the cis-regulatory regions of their target genes, 24
dynamically modulating chromatin accessibility and recruiting transcription complexes in 25
response to developmental and environmental cues1. Dissecting this regulatory logic is 26
fundamental to our understanding of biological systems and our study of diseases. Over 27
the past decades, molecular studies have elucidated the structure of TF complexes and 28
provided mechanistic models into their function2. Methods based on high-throughput 29
sequencing have enabled the genome-wide profiling of gene expression3, TF binding4, 30
chromatin accessibility5, and 3D genome structure6. TF knockdown/knockout studies 31
have also identified, en masse, their species-, tissue-, and context-specific target genes7. 32
Concurrently, novel statistical approaches have allowed for more precise identification 33
and modeling of TF binding sites8, and expression quantitative trait loci (eQTLs) 34
databases now include associations that are tissue-specific9 and will soon be cell-type 35
specific10. Yet, despite this tremendous progress, our understanding of gene regulatory 36
logic is still rudimentary. 37
When a TF 𝑗 activates or represses the expression of a gene 𝑔 through binding to 38
a regulatory element 𝑡 in cis to the gene, we call such a relationship a regulatory trio. 39
Despite its complexity, gene regulatory logic can be broken down into modular 40
components consisting of such peak-TF-gene trios. In this paper, we focus on the 41
identification of regulatory trios using multiomic experiments that jointly profile gene 42
expression and chromatin accessibility at single-cell resolution. 43
Single-cell RNA sequencing (scRNA-seq) and single-cell assay of transposase-44
accessible chromatin sequencing (scATAC-seq), performed separately, have already 45
generated detailed cell-type-specific profiles of gene expression and chromatin 46
accessibility. When the two modalities are not measured in the same cells, the cells can 47
be aligned by computational methods11, followed by association analyses of gene 48
expression and peak accessibility. While these methods have been shown to align well-49
differentiated cell types correctly, they often fail for cell populations consisting of transient 50
states. Additionally, the alignment of cells necessarily assumes a peak-gene association 51
model, which is often learned from other datasets. Then, the post-alignment association 52
4
analysis is plagued by logical circularity, as it is difficult to disentangle new findings from 53
prior assumptions that underlie the initial cell alignment. 54
Single-cell multiomic experiments that sequence the RNA and ATAC from the 55
same cells directly enable joint modeling of a cell’s RNA expression and chromatin state, 56
yet methods for the analysis of such data are still in their infancy. Almost all existing 57
methods for detecting and characterizing regulatory relationships between TF, regulatory 58
region, and target gene rely on marginal relationships. For example, Signac12 and Ma et 59
al.13 use marginal associations between peaks and genes to identify putative enhancer 60
regions, while Signac12 and Seurat V414 link differentially expressed TFs to differentially 61
accessible motifs across cell types. Such pairwise marginal associations are sometimes 62
examined manually, in tandem, using low-dimensional embedding. One exception is in 63
PECA15, which uses a parametric model to characterize the joint distribution of TF 64
expression, regulatory site accessibility, chromatin remodeler expression, and target 65
gene expression. Although PECA was designed to be applied to matched bulk 66
transcriptomic and epigenomic data, such joint modeling concepts could potentially be 67
very powerful for single-cell multiomic data. Yet, PECA relies heavily on parametric 68
assumptions, is computationally intensive to fit to large datasets, and is difficult to 69
diagnose. 70
Context-specific gene regulation may be masked in marginal associations, as we 71
will show in examples later. We explore in this paper the use of higher-order models that 72
interrogate conditional and three-way interaction relationships for the identification of 73
regulatory trios. First, as proof of principle, we show that a simple model that integrates 74
TF expression with cis-peak accessibility significantly improves gene expression 75
prediction, as compared to a comparable model that utilizes peak accessibility alone. We 76
present TRIPOD, a computational framework for transcription regulation interrogation 77
through nonparametric partial association analysis of single-cell multiomic sequencing 78
data. TRIPOD detects two types of trio relationships, which we call conditional level 1 and 79
conditional level 2, through robust nonparametric tests that are easy to diagnose. A novel 80
influence measure allows the detection and visualization of cell states driving these 81
regulatory relationships, applicable both to discrete cell types, as well as continuous cell 82
trajectories. 83
5
We first apply TRIPOD to single-cell multiomic data of human peripheral blood 84
mononuclear cells (PBMCs) and compare the regulatory trios detected to relationships 85
detected through marginal associations. We show that the detections are coherent with 86
the vast amounts of existing knowledge from enhancer databases, bulk cell-type-specific 87
chromatin immunoprecipitation followed by sequencing (ChIP-seq) experiments, tissue-88
specific TF knockdown/knockout studies, and cis-eQTL studies, but that conditional and 89
marginal models identify different sets of relationships. We next apply TRIPOD to the 90
interrogation of lineage-specific regulation in the developing mouse brain, where 91
relationships detected by TRIPOD are compared against those derived from existing 92
ChIP-seq and proximity ligation-assisted ChIP-seq (PLAC-seq) data. Here, TRIPOD 93
identifies known trio relationships, as well as putative novel regulatory crosstalk between 94
neuronal TFs and glial-lineage genes. We also apply TRIPOD to SHARE-seq data on 95
mouse hair follicle cell differentiation to illustrate trio detection and influence analysis in 96
data collected from different protocols. Through these analyses, we demonstrate how to 97
harness single-cell multiomic technologies in the study of gene regulation, and how the 98
data from these technologies corroborate and complement existing data. 99
100
Results 101
A simple interaction model between TF expression and peak accessibility improves 102
RNA prediction. We started our analyses by making gene expression predictions, a 103
standard procedure carried out by existing methods11. We benchmarked against: (i) 104
Signac12 and Cicero16, which compute the gene activity matrix by summing the ATAC 105
reads in gene bodies and promoter regions; (ii) MAESTRO17, which adopts a regulatory 106
potential model by taking the weighted sum of the ATAC reads based on existing gene 107
annotations; and (iii) sci-CAR18, which performs a regularized regression using gene 108
expression as the outcome and peak accessibilities as the predictors. We also use a 109
regularized regression model (referred to as peak-TF LASSO model), where instead of 110
peak accessibility, interactions between TF expressions and peak accessibilities serve as 111
predictors. The model considers only peaks within a certain range of the gene’s 112
transcription start site (TSS) and only interactions between TFs and peaks containing 113

6
high-scoring binding motifs for the TFs. To avoid overfitting, we perform leave-one-out 114
prediction and adopt independent training and testing sets. See Methods for details. 115
We analyzed single-cell multiomic datasets from different human and mouse 116
tissues generated by different platforms – PBMC by 10X Genomics, embryonic mouse 117
brain by 10X Genomics, mouse skin by SHARE-seq13, and adult mouse brain by SNARE-118
seq19. Data summaries are included in Supplementary Table 1; reduced dimensions via 119
uniform manifold approximation and projection (UMAP)20 are shown in Fig. 1a and 120
Supplementary Fig. 1,2a. To mitigate the undesirable consequences of sparsity and 121
stochasticity in the single-cell data, we clustered cells to form metacells14, and pooled 122
gene expression and chromatin accessibility measurements within each metacell. 123
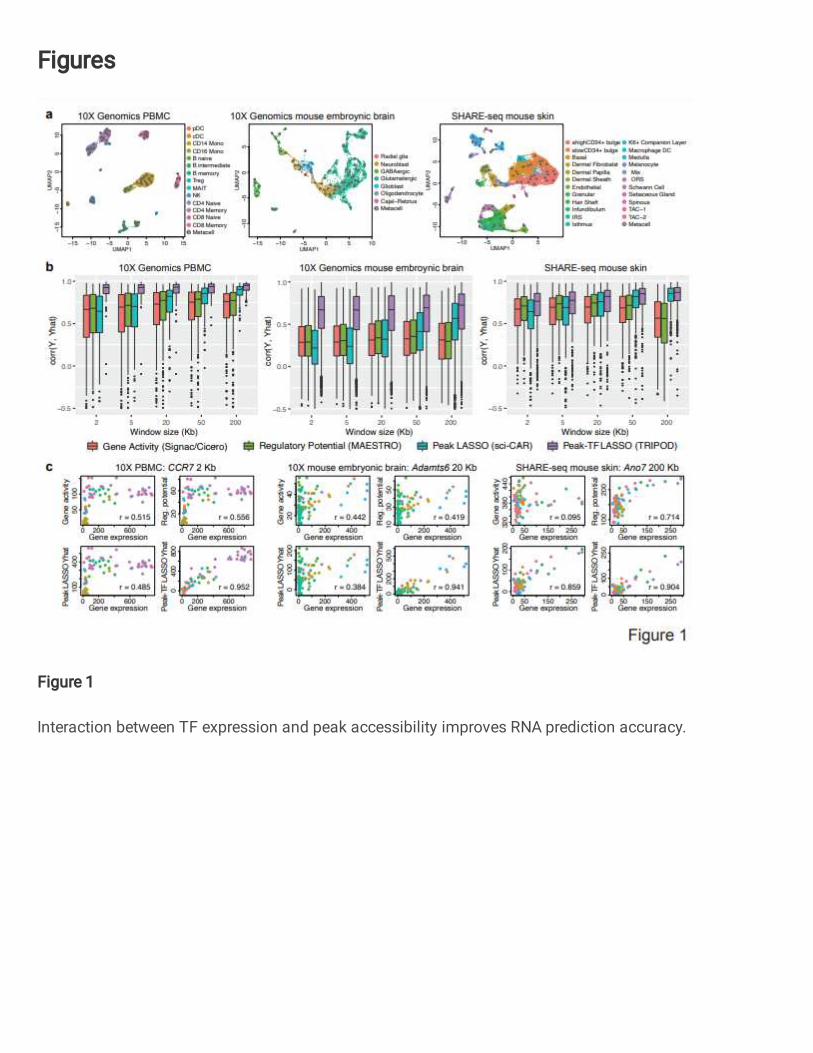
Our results show that, across window sizes, the peak-TF LASSO model 124
significantly improves prediction accuracy across the transcriptome (Fig.1b), with 125
examples shown in (Fig. 1c). This improvement in prediction accuracy holds true when 126
an independent dataset is used for validation (Supplementary Fig. 3). For the SNARE-127
seq data19, sequencing depth is substantially shallower (Supplementary Fig. 4), thus the 128
improvement of the peak-TF LASSO model is diminished but still evident (Supplementary 129
Fig. 2b). This demonstrates that the product of TF expression and peak accessibility 130
significantly improves RNA prediction accuracy beyond simply using peak accessibility, 131
offering strong empirical evidence of three-way interaction relationships between TF 132
expression, peak accessibility, and target gene expression that can be extracted from 133
such multiomic experiments. However, we will not rely on coefficients from the LASSO 134
model to screen for such trios, as their significance is difficult to compute due to the 135
hazards of post-selection inference21. Additionally, accessibility of peaks and expression 136
of TF affecting the same gene are often highly correlated, in which case LASSO tends to 137
select the few with the highest associations and ignore the rest. In such cases, we believe 138
it is more desirable to report all trios. 139
140
TRIPOD for the detection of peak-TF-gene trio regulatory relationships by single-141
cell multiomic data. We propose TRIPOD, a nonparametric method that screens single-142
cell RNA and ATAC multiomic data for conditional associations and three-way 143
interactions between the expression of a TF 𝑗 , the accessibility of a peak region 144
7
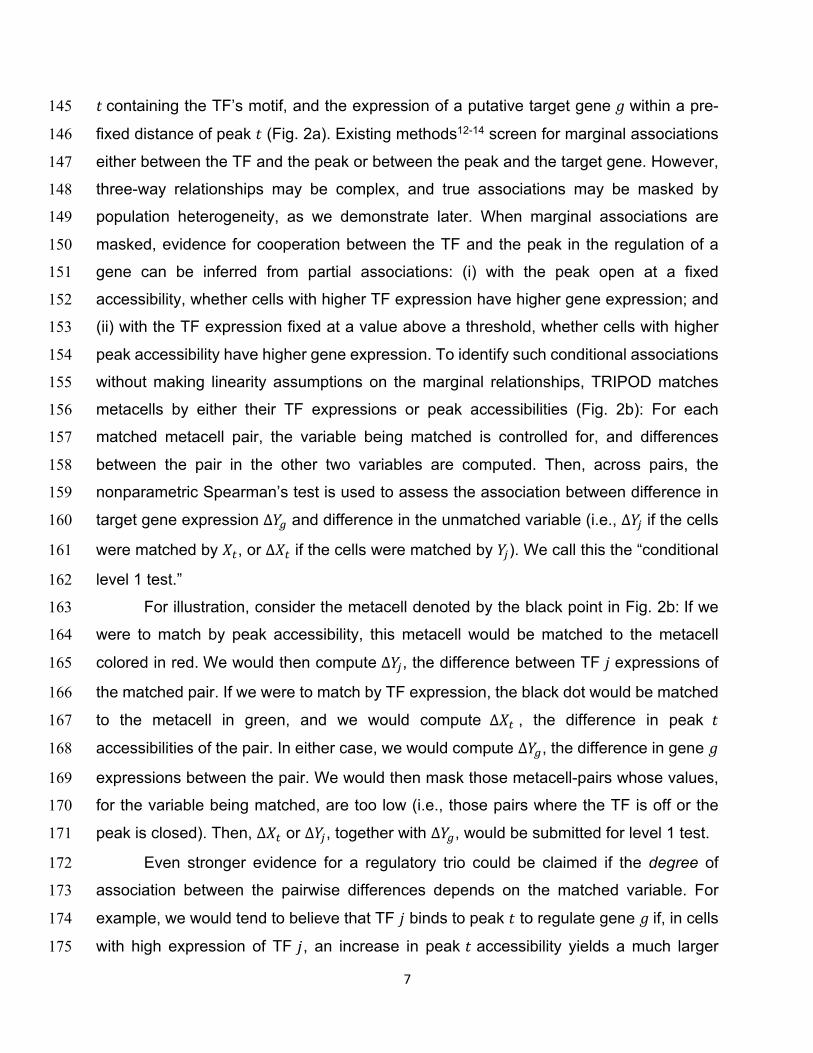
𝑡containing the TF’s motif, and the expression of a putative target gene 𝑔 within a pre-145
fixed distance of peak 𝑡 (Fig. 2a). Existing methods12-14 screen for marginal associations 146
either between the TF and the peak or between the peak and the target gene. However, 147
three-way relationships may be complex, and true associations may be masked by 148
population heterogeneity, as we demonstrate later. When marginal associations are 149
masked, evidence for cooperation between the TF and the peak in the regulation of a 150
gene can be inferred from partial associations: (i) with the peak open at a fixed 151
accessibility, whether cells with higher TF expression have higher gene expression; and 152
(ii) with the TF expression fixed at a value above a threshold, whether cells with higher 153
peak accessibility have higher gene expression. To identify such conditional associations 154
without making linearity assumptions on the marginal relationships, TRIPOD matches 155
metacells by either their TF expressions or peak accessibilities (Fig. 2b): For each 156
matched metacell pair, the variable being matched is controlled for, and differences 157
between the pair in the other two variables are computed. Then, across pairs, the 158
nonparametric Spearman’s test is used to assess the association between difference in 159
target gene expression Δ𝑌! and difference in the unmatched variable (i.e., Δ𝑌" if the cells 160
were matched by 𝑋#, or Δ𝑋# if the cells were matched by 𝑌"). We call this the “conditional 161
level 1 test.” 162
For illustration, consider the metacell denoted by the black point in Fig. 2b: If we 163
were to match by peak accessibility, this metacell would be matched to the metacell 164
colored in red. We would then compute Δ𝑌", the difference between TF 𝑗 expressions of 165
the matched pair. If we were to match by TF expression, the black dot would be matched 166
to the metacell in green, and we would compute Δ𝑋# , the difference in peak 𝑡 167
accessibilities of the pair. In either case, we would compute Δ𝑌!, the difference in gene 𝑔 168
expressions between the pair. We would then mask those metacell-pairs whose values, 169
for the variable being matched, are too low (i.e., those pairs where the TF is off or the 170
peak is closed). Then, Δ𝑋# or Δ𝑌", together with Δ𝑌!, would be submitted for level 1 test. 171
Even stronger evidence for a regulatory trio could be claimed if the degree of 172
association between the pairwise differences depends on the matched variable. For 173
example, we would tend to believe that TF 𝑗 binds to peak 𝑡 to regulate gene 𝑔if, in cells 174
with high expression of TF 𝑗, an increase in peak 𝑡 accessibility yields a much larger 175
8
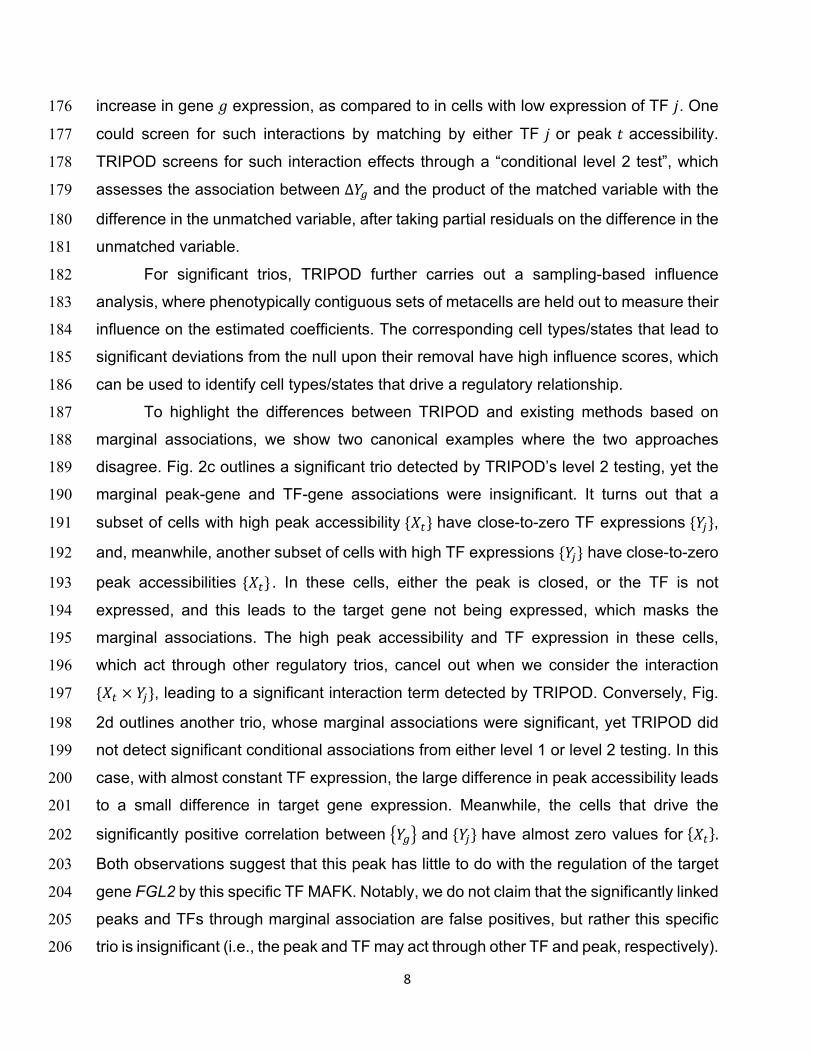
increase in gene 𝑔 expression, as compared to in cells with low expression of TF 𝑗. One 176
could screen for such interactions by matching by either TF 𝑗 or peak 𝑡 accessibility. 177
TRIPOD screens for such interaction effects through a “conditional level 2 test”, which 178
assesses the association between Δ𝑌! and the product of the matched variable with the 179
difference in the unmatched variable, after taking partial residuals on the difference in the 180
unmatched variable. 181
For significant trios, TRIPOD further carries out a sampling-based influence 182
analysis, where phenotypically contiguous sets of metacells are held out to measure their 183
influence on the estimated coefficients. The corresponding cell types/states that lead to 184
significant deviations from the null upon their removal have high influence scores, which 185
can be used to identify cell types/states that drive a regulatory relationship. 186
To highlight the differences between TRIPOD and existing methods based on 187
marginal associations, we show two canonical examples where the two approaches 188
disagree. Fig. 2c outlines a significant trio detected by TRIPOD’s level 2 testing, yet the 189
marginal peak-gene and TF-gene associations were insignificant. It turns out that a 190
subset of cells with high peak accessibility {𝑋#} have close-to-zero TF expressions {𝑌"}, 191
and, meanwhile, another subset of cells with high TF expressions {𝑌"} have close-to-zero 192
peak accessibilities {𝑋#} . In these cells, either the peak is closed, or the TF is not 193
expressed, and this leads to the target gene not being expressed, which masks the 194
marginal associations. The high peak accessibility and TF expression in these cells, 195
which act through other regulatory trios, cancel out when we consider the interaction 196
{𝑋# × 𝑌"}, leading to a significant interaction term detected by TRIPOD. Conversely, Fig. 197
2d outlines another trio, whose marginal associations were significant, yet TRIPOD did 198
not detect significant conditional associations from either level 1 or level 2 testing. In this 199
case, with almost constant TF expression, the large difference in peak accessibility leads 200
to a small difference in target gene expression. Meanwhile, the cells that drive the 201
significantly positive correlation between +𝑌!, and {𝑌"} have almost zero values for {𝑋#}. 202
Both observations suggest that this peak has little to do with the regulation of the target 203
gene FGL2 by this specific TF MAFK. Notably, we do not claim that the significantly linked 204
peaks and TFs through marginal association are false positives, but rather this specific 205
trio is insignificant (i.e., the peak and TF may act through other TF and peak, respectively). 206
9
In summary, TRIPOD puts peak-TF-gene trios into one unified model, complementing 207
existing methods based on marginal associations and allowing for simultaneous 208
identification of all three factors and prioritization of a different set of regulatory 209
relationships. 210
211
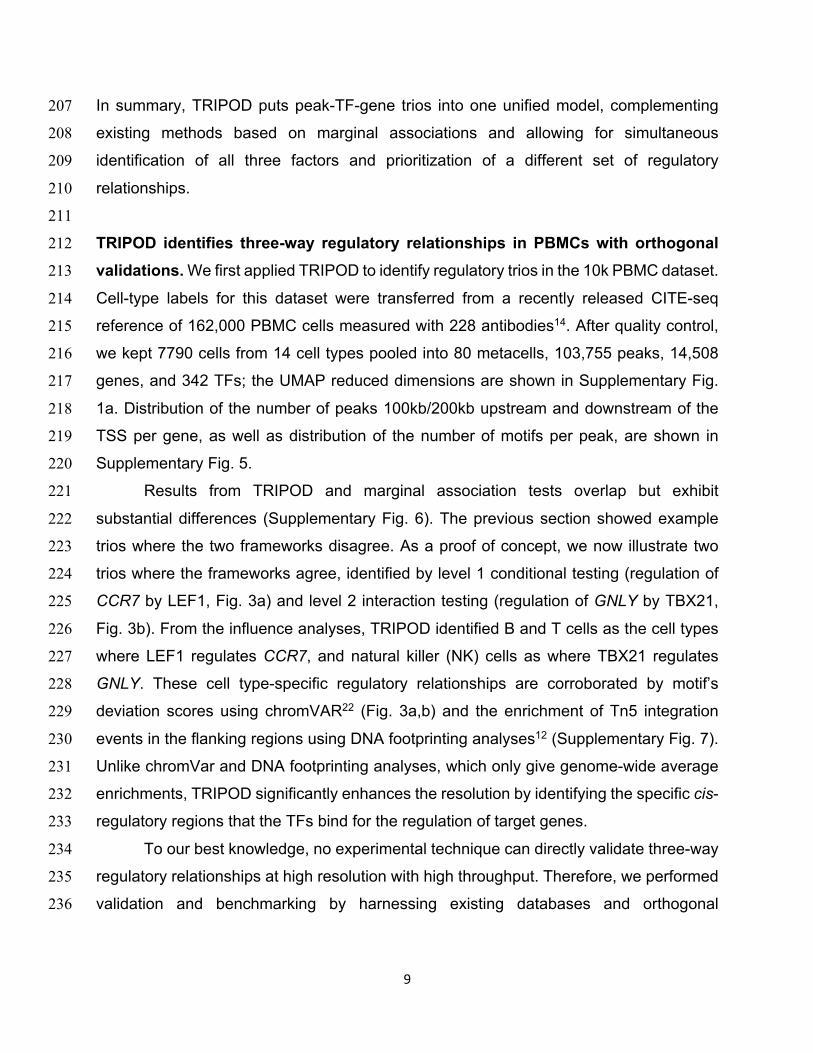
TRIPOD identifies three-way regulatory relationships in PBMCs with orthogonal 212
validations. We first applied TRIPOD to identify regulatory trios in the 10k PBMC dataset. 213
Cell-type labels for this dataset were transferred from a recently released CITE-seq 214
reference of 162,000 PBMC cells measured with 228 antibodies14. After quality control, 215
we kept 7790 cells from 14 cell types pooled into 80 metacells, 103,755 peaks, 14,508 216
genes, and 342 TFs; the UMAP reduced dimensions are shown in Supplementary Fig. 217
1a. Distribution of the number of peaks 100kb/200kb upstream and downstream of the 218
TSS per gene, as well as distribution of the number of motifs per peak, are shown in 219
Supplementary Fig. 5. 220
Results from TRIPOD and marginal association tests overlap but exhibit 221
substantial differences (Supplementary Fig. 6). The previous section showed example 222
trios where the two frameworks disagree. As a proof of concept, we now illustrate two 223
trios where the frameworks agree, identified by level 1 conditional testing (regulation of 224
CCR7 by LEF1, Fig. 3a) and level 2 interaction testing (regulation of GNLY by TBX21, 225
Fig. 3b). From the influence analyses, TRIPOD identified B and T cells as the cell types 226
where LEF1 regulates CCR7, and natural killer (NK) cells as where TBX21 regulates 227
GNLY. These cell type-specific regulatory relationships are corroborated by motif’s 228
deviation scores using chromVAR22 (Fig. 3a,b) and the enrichment of Tn5 integration 229
events in the flanking regions using DNA footprinting analyses12 (Supplementary Fig. 7). 230
Unlike chromVar and DNA footprinting analyses, which only give genome-wide average 231
enrichments, TRIPOD significantly enhances the resolution by identifying the specific cis-232
regulatory regions that the TFs bind for the regulation of target genes. 233
To our best knowledge, no experimental technique can directly validate three-way 234
regulatory relationships at high resolution with high throughput. Therefore, we performed 235
validation and benchmarking by harnessing existing databases and orthogonal 236
10
sequencing experiments that interrogate each pairwise relationship among the three 237
factors (Table 1). 238
First, to validate the cis-linkage between peak region and target gene, we used the 239
enhancer databases of blood and non-cancerous cells from FANTOM523 (from HACER24), 240
4DGenome25 (from HACER24), and EnhancerAtlas 2.026, as well as cis-eQTLs in the 241
whole blood reported by the GTEx consortium9. We collapsed TRIPOD’s trio calls into 242
peak-gene relationships and benchmarked against Signac’s LinkPeaks12 on single cells 243
and marginal testing on metacells; for each target gene, we performed a hypergeometric 244
test for enrichment of the peak-gene linkages in the regulatory databases and annotations 245
(see Methods for details). For all four databases, TRIPOD’s 𝑝-values for enrichment are 246
substantially significant (Fig. 3c). 247
Second, to validate the TF-gene edge in the TRIPOD-identified trios, we referred 248
to knockTF7, a TF knockdown/knockout gene expression database, and hTFtarget27, a 249
database of known TF regulatory targets. Specifically, in knockTF, we found seven TF 250
knockdown/knockout RNA-seq experiments in the peripheral blood category. For these 251
TFs, we identified significantly linked genes by marginal association and by TRIPOD and 252
found TRIPOD’s results to have significantly higher precision and recall (Fig. 3d). For 253
hTFtarget, we obtained, for each highly variable gene, its blood-specific TFs, and 254
calculated the gene-specific precision-recall rates – TRIPOD is more sensitive compared 255
to marginal association testing, although both suffered from inflated “false positives,” 256
which are likely due to the low sensitivity in the “gold-standard” in silico calls by hTFtarget 257
(Fig. 3e). 258
Third, to validate the TF-peak edge representing TF binding to peak regions, in 259
addition to the DNA footprinting analysis shown in Supplementary Fig. 7e, we 260
downloaded from the Cistrome portal28 non-cancerous ChIP-seq data from sorted human 261
blood cells (B lymphocyte, T lymphocyte, and monocyte (Supplementary Table 2). The 262
peaks identified by TRIPOD had a substantially higher percentage of overlap with the 263
ChIP-seq peaks (Fig. 3f). In summary, existing databases and public data of different 264
types from a wide range of studies extensively support each of the three pairwise links in 265
the trios reported by TRIPOD, demonstrating its effectiveness in uncovering true 266
regulatory relationships. 267
11
268
TRIPOD identifies known and novel putative regulatory relationships during mouse 269
embryonic brain development. We next applied TRIPOD to single-cell multiomic data 270
of 5k mouse embryonic brain cells at day 18 by 10X Genomics. The cell type labels were 271
transferred from an independent scRNA-seq reference29 using both Seurat V311 and 272
SAVERCAT30. We kept 3,962 cells that had consistent transferred labels from seven 273
major cell types: radial glia, neuroblast, GABAergic neuron, glutamatergic neuron, 274
glioblast, oligodendrocyte, and Cajal−Retzius neuron (Supplementary Fig. 1b). We 275
applied TRIPOD to 633 TFs, 1000 highly variable genes, and ATAC peaks 200kb 276
up/downstream of the genes’ TSSs. 277
First, we investigate a known regulatory trio involving target gene Sox10, TF Olig2 278
(binding motif CAGCTG), and a cis-regulatory element known as the U2 enhancer (chr15: 279
79201691-79201880 from mm10) that has been experimentally validated31 The 280
expression of Sox10 and Olig2 across the seven cell types, and the ATAC-seq profiles of 281
the region containing the U2 enhancer and Sox10, are shown in Fig. 4a. This known 282
regulatory trio was found to be conditional level 2 significant by TRIPOD (Fig. 4b). 283
Importantly, the U2 enhancer resides in one of three cis-regulatory elements that were 284
identified by TRIPOD to be enhancers for Sox10 involving TF Olig2; all three significantly 285
linked peaks were validated by Olig2 ChIP-seq data (Fig. 4a). 286
On the genome scale, the union of TRIPOD’s level 1 and 2 tests gave a larger 287
number of unique peak-gene pairs and TF-gene pairs than LinkPeaks12 and marginal 288
metacell association tests (Supplementary Fig. 8a). To evaluate results, we first examined 289
whether the peak-gene links were enriched in previously reported enhancer-promoter 290
chromatin contacts using PLAC-seq data of mouse fetal brain32 (Table 1, Fig. 4c, 291
Supplementary Fig. 8b). We observed that the regulatory links detected by both marginal 292
association and TRIPOD showed significant enrichment in those supported by PLAC-seq 293
(Fig. 4d, Supplementary Fig. 8c). Importantly, TRIPOD detected sets of trio relationships 294
that were overlapping but distinct from the sets obtained by the marginal model, and a 295
substantial fraction of the links identified by TRIPOD but not by the marginal method were 296
validated by PLAC-seq. This suggests that TRIPOD identifies real regulatory relationships 297
that complement those detected by existing methods. To validate the links between TFs 298
12
and peaks, we used publicly available ChIP-seq data of mouse embryonic brain for 299
Olig233, Neurog234, Eomes34, and Tbr135, TFs that play key roles in embryonic brain 300
development (Table 1). TF binding peaks identified by TRIPOD were significantly 301
enriched in the TF ChIP-seq peaks across all embryonic brain datasets; Olig2 ChIP-seq 302
data of mature oligodendrocytes (mOL) serves as a negative control and has insignificant 303
enrichment (Fig. 4e). 304
The validations and global benchmarking demonstrate TRIPOD’s effectiveness in 305
finding real regulatory relationships. Next, we focused on a set of TFs known to play 306
essential roles during mouse embryonic brain development. Specifically, we chose Pax6, 307
Neurog2, Eomes, Neurod1, and Tbr1, major TFs mediating glutamatergic neurogenesis36, 308
and Olig2, Sox10, Nkx2-2, Sox9, Nfia, and Ascl1, which initiate and mediate gliogenesis37; 309
the known regulatory cascade is shown in Fig. 4f. TRIPOD’s level 1 and level 2 testing 310
successfully captured six out of the seven known regulatory links; interestingly, TRIPOD’s 311
results also suggest substantial crosstalk between the two cascades, where 312
neurogenesis-specific TFs activate gliogenesis-specific TFs (Fig. 4g). ChIP-seq data of 313
Neurog2, Eomes, and Tbr1 supported four of the crosstalk links: regulation of Sox9 by 314
Neurog2 and regulation of Nfia by Neurog2, Eomes, and Tbr1, respectively 315
(Supplementary Fig. 9). These crosstalk links that were validated by ChIP-seq are highly 316
significant by both marginal and conditional associations. Thus, we think it is highly 317
plausible that neurogenesis TFs activate gliogenesis genes at day 18 of embryonic 318
mouse brain development, which is exactly when the switch is being made from 319
neurogenesis to gliogenesis. To our best knowledge, these possible links between 320
neurogenesis and gliogenesis pathways have not been systematically explored and thus 321
warrant future investigation. Finally, for each of the neurogenesis and gliogenesis TFs, 322
we performed a gene ontology (GO) analysis of their significantly linked target genes 323
using DAVID38; the enriched terms were largely consistent with the regulatory functions 324
of the TFs during neurogenesis and gliogenesis (e.g., negative regulation of neuron 325
differentiation and oligodendrocyte differentiation) (Fig. 4h). 326
So far, we have taken advantage of the cross-cell-type variation to identify the trio 327
regulatory relationships. To dissect cell-type-specific regulation, we next applied the 328
influence analysis framework (see Methods for details) to the significant trios involving 329
13
neurogenesis and gliogenesis TFs. For a given TF, the number of trios, for which a given 330
cell type was influential (FDR < 0.01), is summarized in Fig. 4i, with details for specific 331
example trios given in Supplementary Fig. 10. The analyses underpinned the cell types 332
in which the transcriptional regulation was active, and, reassuringly, the neurogenesis 333
and gliogenesis TFs have the most regulatory influence in neuroblasts and glioblasts, 334
respectively. Additionally, Ascl1 is active in GABAergic neurons in addition to neuroblasts 335
and glioblasts, consistent with its role as a GABAergic fate determinant39. Notably, the 336
highly influential cell types that lead to the significant trios involving several neurogenesis-337
specific TFs include not only neuroblast but also glioblast, supporting our previous 338
findings on the crosstalk between the two cascades. Overall, TRIPOD allows fine 339
characterization of cell-type- and cell-state-specific functions of the TFs during 340
neurogenesis and gliogenesis. 341
342
TRIPOD infers lineage-specific regulatory relationships in differentiating mouse 343
hair follicle cells. As a last example, we applied TRIPOD to SHARE-seq13 data 344
(Supplementary Fig. 1c) of mouse hair follicle cells, consisting of four broadly defined cell 345
types – transit-amplifying cells (TAC), inner root sheath (IRS), hair shaft, and medulla 346
cells – along a differentiation trajectory. The cell-type labels were curated based on 347
marker genes, TF motifs, and ATAC peaks from the original publication13; pseudotime 348
was inferred using Palantir40 and overlaid on the cisTopic41 reduced dimensions of the 349
ATAC domain. Cells were partitioned using both the pseudotime and the UMAP 350
coordinates to construct metacells (Fig. 5a). Due to the low RNA coverage 351
(Supplementary Fig. 4), we focused on 222 highly-expressed TFs, 794 highly expressed 352
genes reported to have more than ten linked cis-regulatory peaks13, and peaks 100kb 353
up/downstream of the genes’ TSSs. 354
For validation, we used H3K4me1 and H3K27ac ChIP-seq data from an isolated 355
mouse TAC population42 (Table 1). H3K4me1 and H3K27ac are marks for active 356
enhancers and are used to benchmark TRIPOD’s linked peaks against previously 357
reported domains of regulatory chromatin (DORCs)13, as well as randomly sampled peaks. 358
The linked peaks by TRIPOD have higher scores for both H3K4me1 and H3K27ac, than 359
DORCs, the latter identified through marginal associations (Fig. 5b). To further validate 360
14
the regulatory effects of the linked peaks, we obtained previously characterized super-361
enhancers (SEs) in mouse TACs42. Target genes of the 381 SEs were assigned based 362
on the gene’s proximity to the SE, as well as the correlation between loss of the SE and 363
loss of the gene transcription42. TRIPOD was able to successfully recapitulate the SE 364
regions for the genes considered, with four examples shown in Fig. 5c, where significantly 365
linked peaks mostly reside in the SEs. 366
To demonstrate, Fig. 5d shows regulatory trios that are specific to the IRS lineage, 367
the hair shaft lineage, and the medulla lineage. These trios also show significant pairwise 368
marginal associations (Fig. 5e), lending confidence that they are real. The cell types 369
where the regulation happens are identified by influence analysis, for which the 𝑝-values 370
are smoothed along the differentiation trajectory and overlaid on the UMAP embedding 371
(Fig. 5f). DNA footprinting analyses surveyed the enrichment of Tn5 integration events 372
surrounding the corresponding motif sites and showed cell-type-specific enrichment (Fig. 373
5g), corroborating TRIPOD’s results. 374
375
Discussion 376
We have considered the detection of regulatory trios, consisting of a TF binding to a 377
regulatory region to activate or repress the transcription of a nearby gene, using single-378
cell RNA and ATAC multiomic sequencing data. The presented method, TRIPOD, is a 379
new nonparametric approach that goes beyond marginal relationships to detect 380
conditional associations and interactions on peak-TF-gene trios. We applied TRIPOD to 381
three single-cell multiomic datasets from different species and protocols with extensive 382
validations and benchmarks. We started our analyses with predicting gene expression 383
from both peak accessibility and TF expression. Supervised frameworks have been 384
proposed to predict gene expression from DNA accessibility43, and vice versa44, using 385
matched bulk transcriptomic and epigenomic sequencing data. Blatti et al.45 showed that 386
joint analysis of DNA accessibility, gene expression, and TF motif binding specificity 387
allows reasonably good prediction of TF binding as measured by ChIP-seq. However, 388
none of these methods incorporate TF expression. By selecting peaks near the genes’ 389
TSSs and TFs with high motif scores in the selected peaks, we constructed biologically 390
15
meaningful peak-TF pairs as predictors and showed that such a mechanistic model 391
significantly boosts the prediction accuracy of gene expression. 392
We next considered the detection and significance assessment for individual peak-393
TF-gene trios, comprehensively comparing our detections with those made by tissue- and 394
cell-type-matched PLAC-seq and ChIP-seq experiments, by cis-eQTL and TF 395
knockdown/knockout studies, and by those recorded in the main enhancer databases. 396
Our current study is limited in several ways. A study in Drosophila46 modeled motif binding 397
specificities and chromatin accessibilities in bulk RNA and ATAC sequencing data to 398
predict the cooperative binding of pairs of TFs, using in vitro protein-protein binding 399
experiments for validation. The detection of synergies between multiple TFs and peaks 400
on the genome-wide scale and in a cell-type-specific manner needs further investigation. 401
Additionally, while we have not differentiated between positive and negative regulation, 402
TRIPOD reports both types of relationships and categorizes them by sign. While we 403
describe the trios with a positive sign to be enhancers, it is not clear how to interpret the 404
trios with negative signs, the latter having lower overlap with other benchmarking datasets. 405
Transcription activation and repression have been active research areas in biology, with 406
a lot yet unknown47. TRIPOD’s results provide potential targets for experimental follow-407
up and detailed characterization. 408
Our analysis focused on three datasets where the RNA and ATAC modalities have 409
sufficient depths of coverage. For the SHARE-seq data, the sequencing depth for RNA is 410
very low, and thus we focused only on highly expressed genes and TFs (Fig. 5). For 411
SNARE-seq data, whose coverage in both modalities is even lower, we focused on 412
prediction models and not trio detection, where we saw only marginal improvement 413
beyond existing methods19 (Supplementary Fig. 2). For data where the coverage is even 414
lower, e.g., PAIRED-seq, cross-modality metacells could not be stably formed, making 415
such analyses impossible (Supplementary Table 1, Supplementary Fig. 4). With rapidly 416
increasing sequencing capacity and technological advancement, TRIPOD, applied to 417
more cells sequenced at higher depth, can uncover novel regulatory relationships at a 418
finer resolution. 419
420
16
Methods 421
Data input and construction of metacells. Denote 𝑋$# as the peak accessibility for peak 422
𝑡(1 ≤ 𝑡 ≤ 𝑇) in cell 𝑖(1 ≤ 𝑖 ≤ 𝑁), 𝑌$! as the gene expression for gene 𝑔(1 ≤ 𝑔 ≤ 𝐺), and 423
𝑌$" as the TF expression for TF 𝑗(1 ≤ 𝑗 ≤ 𝑀). The TF expression matrix is a subset of the 424
gene expression matrix, and for single-cell multiomic data, the cell entries are matched. 425
To mitigate the effect of ATAC sparsity48 and RNA expression stochasticity49, as a first 426
step, TRIPOD performs cell-wise smoothing by pooling similar cells into “metacells.” This, 427
by default, is performed using the weighted-nearest neighbor method by Seurat V414 to 428
jointly reduce dimension and identify cell clusters/states across different modalities. In 429
practice, the metacells can also be inferred using one modality – for example, RNA may 430
better separate the different cell types29, and in other cases, chromatin accessibility may 431
prime cells for differentiation13. To account for peaks overlapping with other genes 432
(Supplementary Fig. 5b), TRIPOD has the option to either remove the overlapped peaks 433
or to adjust the peak accessibilities by the expressions of the overlapped genes, in a 434
similar fashion to MAESTRO17. Library size is adjusted for both the RNA and ATAC 435
domain by dividing all counts by a metacell-specific size factor (total read counts divided 436
by 10%). 437
438
RNA prediction by TF expression and peak accessibility. To predict RNA from ATAC, 439
Signac12 and Cicero16 take the sum of peak accessibilities in gene bodies and promoter 440
regions to construct a pseudo-gene activity matrix: 𝑌9$! = ∑ 𝑋$##∈'!, where 𝐸! is the set of 441
peaks within gene bodies and upstream regions of TSSs. Instead of directly taking the 442
sum, MAESTRO17 adopts a “regulatory potential” model by taking the weighted sum of 443
accessibilities across all nearby peaks: 𝑌9$! = ∑ 𝑤#!𝑋$##∈'!, with weights {𝑤#!} pre-444
calculated based on existing gene annotations. Specifically, the method weighs peaks by 445
exponential decay from TSS, sums all peaks on the given gene exons as if they are on 446
the TSS, normalizes the sum by total exon lengths, and excludes the peaks from 447
promoters and exons of nearby genes. The strategy to take the unweighted/weighted sum 448
of accessibility as a proxy for expression has been adopted to align the RNA and ATAC 449
modalities when scRNA-seq and scATAC-seq are sequenced in parallel from the same 450
cell population but not the same cells11. For single-cell multiomic data, sci-CAR18 performs 451

17
feature selection to identify cis-linked peaks via a LASSO regression: 𝑌$!~∑ 𝛽#!𝑋$##∈'!, 452
where an L1 regularization is imposed on 𝛽#!. Compared to MAESTRO, which pre-fixes 453
the weights {𝑤#!}, {𝛽#!} are estimated from the data by regressing RNA against matched 454
ATAC data. What we propose is a feature selection model involving both peak 455
accessibility and TF expression: 𝑌$!~∑ ∑ 𝛽#"!𝑋$#𝑌$""∈("#∈'!, where 𝑓# contains the set of 456
TFs with high-scoring binding motifs in peak 𝑡 inferred from the JASPAR database50. 457
458
TRIPOD model and trio regulatory relationship. For a given target gene 𝑔, a peak 𝑡 459
within a window centered at the gene’s TSS, and a TF 𝑗 whose binding motif is high-460
scoring in the peak, TRIPOD infers the relationship between a regulatory trio (𝑡, 𝑗, 𝑔). 461
TRIPOD focuses on one trio at a time and goes beyond the marginal associations to 462
characterize the function 𝑌! = 𝑓B𝑋# , 𝑌"C. In what follows, we first describe TRIPOD’s 463
matching-based nonparametric approach and then describe a linear parametric approach, 464
followed by a discussion on the connections and contrasts between the two approaches. 465
For each cell 𝑖 whose TF expression is above a threshold 𝛿 (we only carry out 466
testing in cells that express the TF), we carry out a minimum distance pairwise cross-467
match based on {𝑌$"|𝑌$" > 𝛿}. Let {(𝑖), 𝑖)∗)} be the optimal matching, after throwing away 468
those pairs that have |𝑌$$" − 𝑌$$∗"| > 𝑒. For each pair 𝑝, 𝑖) and 𝑖)∗ are two metacells with 469
matched TF expression, for which we now observe two, possibly different, values 470
{𝑋$$# , 𝑋$$∗#} for peak 𝑡, as well as two corresponding values {𝑌$$!, 𝑌$$∗!} for gene 𝑔. We 471
then compute the following auxiliary differentials within each pair: 472
Δ𝑋)# = 𝑋$$# − 𝑋$$∗# , 473
Δ𝑌)! = 𝑌$$! − 𝑌$$∗!, 474
as well as 475
𝑌I)" = (𝑌$$" + 𝑌$$∗")/2. 476
For level 1 testing of conditional association, we estimate �̂�#! = 𝜌B𝛥𝑋)# , 𝛥𝑌)!C, where 𝜌 is 477
Spearman correlation, and test 𝐻*: 𝑟#! = 0. For level 2 testing of interaction, we perform a 478
regression 𝛥𝑌)! = 𝛼𝛥𝑋)# + 𝛾𝑌I)" × 𝛥𝑋)# , set 𝛾U#" to be the least-squares solution for 𝛾, and 479
test 𝐻+: 𝛾#" = 0. For visualization of the model fitting, we take the partial residuals of 𝛥𝑌)! 480

18
and 𝑌I)" × 𝛥𝑋)# on𝛥𝑋)#, respectively. Note that even though TF expression is not included 481
in the model as a main term, it is controlled for (and not just in the linear sense) by the 482
matching. Similarly, we can also perform this procedure matching by peak accessibility. 483
As a summary, for level 1 testing of conditional association, we have: 484
Match by 𝑌", 𝛼 = 𝜌BΔ𝑌!, Δ𝑋#C, 485
Match by 𝑋#, 𝛽 = 𝜌BΔ𝑌!, Δ𝑌"C. 486
For level 2 testing of (TF expression)×(peak accessibility) interaction effects, we have: 487
Match by 𝑌", 𝛥𝑌! = 𝛼∗𝛥𝑋# + 𝛾*B𝑌I" × 𝛥𝑋#C, 488
Match by 𝑋#, 𝛥𝑌! = 𝛽∗𝛥𝑌" + 𝛾+B𝑋I# × 𝛥𝑌"C. 489
To test for the conditional associations and interactions, we can also use apply a 490
parametric method, such as multiple linear regression: 491
𝑌! = 𝜇 + 𝛼-𝑋# + 𝛽-𝑌" , 492
𝑌! = 𝜇 + 𝛼-∗𝑋# + 𝛽-∗𝑌" + 𝛾-𝑋#𝑌" . 493
See Supplementary Fig. 11 for linear testing results for trios shown in Fig. 3 and Fig. 5. 494
The estimated coefficients from the nonparametric and parametric methods are 495
correlated on the global scale (Supplementary Fig. 12), and their interpretations are 496
similar: 𝛼 and 𝛼- estimate the change in gene expression per change in peak 497
accessibility, fixing TF expression; 𝛽 and 𝛽- estimate the change in gene expression per 498
change in TF expression, fixing peak accessibility; 𝛾* and 𝛾- measure how the change in 499
gene expression per change in peak accessibility at each fixed TF expression relies on 500
the TF expression; 𝛾+ and 𝛾- measure how the change in gene expression per change in 501
TF expression at each fixed peak accessibility relies on the peak accessibility. However, 502
the underlying models and assumptions are different. Matching controls for not just the 503
linear variation in the matched variable, but also any nonlinear variation. This contrasts 504
with adding the variable as a covariate in the linear regression, where we simply remove 505
linear dependence. The main motivation for using the matching model above is our 506
reluctance to assume the simple linear relationship. Additionally, we use the rank-based 507
Spearman correlation, which will not be driven by outliers – a “bulk” association between 508
ranks is needed for significance. Thus, the nonparametric model of TRIPOD is more 509
stringent (Supplementary Fig. 13) and more robust to outliers. 510
19
511
Identifying regulatory cell type(s) and cell state(s). For the significant trios detected 512
by TRIPOD, we next seek to identify the underlying regulatory cell type(s). Specifically, 513
we carry out a cell-type-specific influence analysis to identify cell types that are highly 514
influential in driving the significance of the trio. Traditional approaches (e.g., the Cook’s 515
distance and the DFFITs) delete observations one at a time, refit the model on remaining 516
observations, and measure the difference in the predicted value from the full model and 517
that from when the point is left out. While they can be readily adopted to detect ”influential” 518
metacells one at a time (Supplementary Fig. 7a,b), these methods do not adjust for the 519
degree of freedom properly when deleting different numbers of metacells from different 520
cell types. That is, they do not account for the different numbers of observations that are 521
simultaneously deleted. Additionally, both methods adopt a thresholding approach to 522
determine significance, without returning 𝑝-values that are necessary for multiple testing 523
correction. We, therefore, develop a sampling-based approach to directly test for the 524
influence of multiple metacells and to return 𝑝-values (Supplementary Fig. 7c). 525
Here, we focus on the linear model for its ease of computation: 𝑌9! = �̂� + 𝛼U𝑋# +526
𝛽W𝑌" + 𝛾U𝑋#𝑌" . Given a set of observations 𝐼 = {𝑖: 𝑖thmetacellbelongstoacelltype}, we 527
remove these metacells, fit the regression model, and make predictions: 𝑌9!(/) = �̂�(/) +528
𝛼U(/)𝑋# + 𝛽W(/)𝑌" + 𝛾U(/)𝑋#𝑌" . The test statistics are the difference in the fitted gene 529
expressions g𝑌9! − 𝑌9!(/)g. We generate the null distribution via sampling. Specifically, within 530
each sampling iteration, we sample without replacement the same number of metacells, 531
denoted as a set of 𝐼∗, delete these observations, and refit the regression model on the 532
remaining observations: 𝑌9!(/∗) = �̂�(/∗) + 𝛼U(/∗)𝑋# + 𝛽W (/∗)𝑌" + 𝛾U(/∗)𝑋#𝑌" . The 𝑝 -value is 533
computed across 𝐾 sampling iterations as 𝑝1! = ∑ 1i∑|𝑌9! − 𝑌9!(/)| ≥ ∑|𝑌9! − 𝑌9!(/∗)|k/∗ 𝐾⁄ , 534
where 1() is the indicator function. In addition to testing each cell type separately, the 535
framework can be extended to test for the influence of cell-type groups. For example, in 536
Fig. 3a,b, we reconstruct the cell-type hierarchy using expression levels of highly variable 537
genes from the RNA domain and carry out the aforementioned testing scheme at each 538
split for its descendent cell types in the hierarchical structure. 539
20
For transient cell states, TRIPOD first identifies the neighbors of each metacell 540
along the trajectory and then carries out metacell-specific testing by simultaneously 541
removing each metacell and its neighbors using the framework described above. The 542
resulting 𝑝-values are, therefore, smoothed and can be visualized in the UMAP plot, as 543
shown in Fig. 5f and Supplementary Fig. 10, to identify the underlying branches/segments 544
that are key in defining the significant regulatory trio. This approach can be directly applied 545
to cells with branching dynamics without the need to isolate cell subsets or to identify cell 546
types. 547
548
Validation resources and strategies. Resources for validating the trio regulatory 549
relationships are summarized in Table 1. To validate the peak-gene relationships, we 550
referred to existing enhancer databases: FANTOM523 links enhancers and genes based 551
on enhancer RNA expression; 4DGenome25 links enhancers and genes based on 552
physical interactions using chromatin-looping data including 3C, 4C, 5C, ChIA-PET, and 553
Hi-C; EnhancerAtlas 2.026 reports enhancers using 12 high-throughput experimental 554
methods including H3K4me1/H3K27ac ChIP-seq, DNase-seq, ATAC-seq, and GRO-seq. 555
We only focused on blood and non-cancerous cells from these databases (Fig. 3c). A list 556
of cis-eQTLs within the whole blood mapped in European-American subjects was 557
downloaded from the GTEx consortium9 (Fig. 3c). For the mouse embryonic brain dataset, 558
we additionally adopted H3K4me3-mediated PLAC-seq data32, which reported enhancer-559
promoter chromatin contacts mapped in mouse fetal forebrain (Fig. 4c,d). For the mouse 560
skin dataset, we adopted TAC-specific ChIP-seq data of H3K4me1 and H3K27ac42, both 561
of which are histone marks for active enhancers (Fig. 5b); we also obtained previously 562
reported super-enhancers in mouse TACs from in vivo studies42 (Fig. 5c). Genomic 563
coordinates were lifted over from mm9 to mm10 when necessary. 564
To validate the TF-gene relationships, we utilized the knockTF7 and the hTFtarget27 565
databases. knockTF interrogates the changes in gene expression profiles in TF 566
knockdown/knockout experiments to link the TFs to their target genes in a tissue- or cell-567
type-specific manner. We downloaded 12 experiments, corresponding to 12 TFs 568
(BCL11A, ELK1, GATA3, JUN, MAF, MYB, NFATC3, NFKB1, STAT3, STAT6, TAL1, and 569
ZNF148) in the peripheral blood category, and focused on seven TFs that have at least 570

21
one linked gene by any model benchmarked (Fig. 3d). hTFtarget computationally predicts 571
TF-gene relationships using ChIP-seq data, and we manually downloaded the TFs 572
associated with each of the top 100 highly variable genes in the blood tissue (Fig. 3e). 573
To validate the peak-TF relationships, we downloaded non-cancerous cell-type-574
specific ChIP-seq data of human blood (B lymphocyte, T lymphocyte, and monocyte) from 575
the Cistrome28 portal for the PBMC data (Fig. 3f, Supplementary Table 2), and ChIP-seq 576
data of Olig233, Neurog234, Eomes34, and Tbr135 for the mouse embryonic brain data. The 577
Olig2 ChIP-seq data were generated in three types of rat cells: data from oligodendrocyte 578
precursor cells (OPC) and immature oligodendrocytes (iOL) were used for validation, 579
while data from mature oligodendrocytes (mOL) serve as a negative control33. Genomic 580
coordinates were converted from rn4 to mm10. The Neurog2 and Eomes ChIP-seq data 581
were generated in mouse embryonic cerebral cortices at day 14.534; the Tbr1 ChIP-seq 582
data was generated in the whole cortex dissected from embryos at day 15.535. In addition, 583
DNA footprinting signatures were corrected for Tn5 sequence insertion bias and stratified 584
by cell types using the Signac package and can be used to validate the identified 585
TFs/motifs in a cell-type-specific manner (Fig. 5g, Supplementary Fig. 7e). 586
For peak enrichment analysis compared to the existing enhancers, cis-eQTLs, and 587
enhancer-promoter contacts, we carried out a hypergeometric test as follows. Let 𝑘 be 588
the number of significantly linked peaks, 𝑞 be the number of significantly linked peaks that 589
overlap with annotations (e.g., annotated enhancers), 𝑚 be the number of peaks that 590
overlap with the annotations, and 𝑛 be the number of peaks that do not overlap with 591
annotations. The 𝑝-value of enrichment is derived from the hypergeometric distribution 592
using the cumulative distribution function, coded as phyper(q, m, n, k, lower.tail=F) in R. 593
We used this hypothesis testing framework to validate and benchmark the reported peak-594
gene links, with results shown in Fig. 3c and Fig. 4d. A similar analysis was carried out to 595
test for peak enrichment in TF binding sites by ChIP-seq, thus validating the peak-TF 596
relationships (Fig. 4e). 597
598
Data availability 599
This study analyzed existing and publicly available single-cell RNA and ATAC multiomic 600
data. 10X Genomics single-cell multiomic datasets of PBMC (10k and 3k) and mouse 601
22
embryonic brain were downloaded https://support.10xgenomics.com/single-cell-602
multiome-atac-gex/datasets. SNARE-seq data of adult mouse brain and SHARE-seq 603
data of mouse skin are available from the Gene Expression Omnibus (GEO) database 604
with accession numbers GSE126074 and GSE140203. A detailed data summary is 605
provided in Supplementary Table 1. Validation resources based on existing databases 606
and high-throughput sequencing data are summarized in Table 1 and Supplementary 607
Table 2. 608
609
Code availability 610
TRIPOD is compiled as an open-source R package available at 611
https://github.com/yharigaya/TRIPOD. Scripts used for analyses carried out in this paper 612
are deposited in the GitHub repository. 613
614
Acknowledgments 615
This work was supported by the National Institutes of Health (NIH) grant R35 GM133712 616
(to C.Z.), R01 HG006137 (to N.R.Z), R01 GM125301 (to N.R.Z.), and R35 GM138342 (to 617
Y.J.). The authors thank Dr. Sai Ma for support and guidance on the SHARE-seq data, 618
Manas Tiwari for help on accessing the hTFtarget database, and Drs. Yun Li, Michael 619
Love, Li Qian, and Jason Stein for helpful discussions and comments. 620
621
Author contributions 622
N.R.Z. and Y.J. initiated and envisioned the study. Y.H., N.R.Z., and Y.J. formulated the 623
model, developed the algorithm, and performed data analysis. Z.Z. processed reference 624
datasets and performed cell-type label transfer. H.Z. and C.Z. provided support on 625
validation, offered consultation, and contributed to result interpretation. Y.H., N.R.Z., and 626
Y.J. wrote the manuscript, which was read and approved by all authors. 627
628
Competing Interests 629
The authors declare no competing interests. 630
631
23
Figure Legends 632
Fig. 1 | Interaction between TF expression and peak accessibility improves RNA 633
prediction accuracy. a, UMAP embedding of 10x Genomics PBMC (left), 10x Genomics 634
embryonic mouse brain (center), and SHARE-seq mouse skin (right) cells from single-635
cell RNA and ATAC multiomic sequencing. Cell-type labels were transferred from existing 636
single-cell references or curated based on marker genes, motifs, and peaks; metacells 637
were constructed to mitigate sparsity and stochasticity. b, Genome-wide distributions of 638
Pearson correlations between observed and leave-one-out predicted RNA expression 639
levels, with varying window sizes. c, Predicted and observed RNA expression levels for 640
highly variable genes, CCR7, Adamts6, and Ano7, from the three datasets, respectively. 641
642
Fig. 2 | TRIPOD infers peak-TF-gene trio regulatory relationships using single-cell 643
multiomic data. a, Data input and schematic on a peak-TF-gene trio. b, Overview of 644
TRIPOD for inferring regulatory relationships. TRIPOD complements existing methods 645
based on marginal associations by identifying conditional associations through matching 646
by TF expression or peak accessibility. c, An example trio identified by TRIPOD, but not 647
by the marginal associations due to heterogeneity of cell-type-specific regulations. d, An 648
example trio identified by the marginal associations, but not by TRIPOD. The peak and 649
TF are significantly linked to the gene, yet they act through other TF and peak, and thus 650
the regulatory trio is insignificant. The points represent metacells (left two panels) and 651
pairs of matched metacells (right two panels). Genomic coordinates for the peaks are 652
from hg38. 653
654
Fig. 3 | TRIPOD identified trio regulatory relationships in PBMC single-cell 655
multiomic dataset. a-b, Example trios identified by TRIPOD. Violin plots show cell-type-656
specific distributions of gene expression, peak accessibility, and TF expression. 657
Scatterplots show TRIPOD’s level 1 and level 2 testing, respectively. Inner and outer 658
circles around the points are color-coded based on the cell types of the matched metacells. 659
Hierarchical clustering is performed on RNA expression levels of highly variable genes. 660
Red/gray circles indicate whether removal of the corresponding branches of metacells 661
significantly changes the model fitting; crosses indicate that removal of the groups of 662
24
metacells resulted in inestimable coefficients. Genomic coordinates for the peaks are 663
from hg38. c, Peak-gene validation based on enhancer databases (FANTOM5, 664
4DGenome, and EnhancerAtlas) and tissue-specific cis-eQTL data from the GTEx 665
Consortium. Box plots show distributions of 𝑝-values from gene-specific hypergeometric 666
tests. d, TF-gene validation based on lists of TF-gene pairs from the knockTF database. 667
e, Precision and recall rates for TF-gene pairs using ground truths from the hTFtarget 668
database. f, Peak-TF validation based on eight cell-type-specific TF ChIP-seq datasets 669
(B lymphocytes, monocytes, and T lymphocytes). Percentages of significantly linked 670
peaks and all peaks that overlap with the ChIP-seq peaks are shown. 671
672
Fig. 4 | TRIPOD identified known and novel regulatory relationships during mouse 673
neurogenesis and gliogenesis. a, TRIPOD identified a previously reported regulatory 674
trio with gene Sox10, TF Olig2, and cis-regulatory U2 element. TRIPOD identified two 675
additional linked peaks; all three cis-regulatory elements were validated by Olig2 ChIP-676
seq data. b, TRIPOD’s level 2 testing matching peak accessibility for the Sox10 gene, the 677
Olig2 TF, and the U2 enhancer. c, Venn diagram of the number of peak-gene pairs 678
captured by PLAC-seq, the marginal model, and the union set of TRIPOD’s level 1 and 679
level 2 testing matching TF expression. d, Enrichment of peak-gene pairs captured by 680
LinkPeaks, marginal association, and TRIPOD in enhancer-promoter contacts by PLAC-681
seq. e, Peak-TF validation by ChIP-seq data. Olig2 ChIP-seq data of precursor/immature 682
oligodendrocytes (OPC/iOL) were used for validation; data from mature oligodendrocytes 683
(mOL) served as a negative control. f, A schematic of well-characterized TF regulatory 684
cascades during neurogenesis and gliogenesis. g, Trio examples from known regulatory 685
relationships, as well as from crosstalks supported by ChIP-seq data, captured by 686
TRIPOD. h, GO analysis of putative target genes of the neurogenesis and gliogenesis 687
TFs. The number of TRIPOD-identified target genes in the GO categories is shown. The 688
background heatmap shows negative log 𝑝-values (FDR adjusted) from hypergeometric 689
tests examining enrichment of ATAC peaks in ChIP-seq peaks. i, Bar plots showing the 690
number of putative cell-type-specific trios mediated by the neurogenesis- and gliogenesis-691
specific TFs. 692
693

25
Fig. 5 | TRIPOD identified regulatory relationships in mouse hair follicles with 694
transient cell states. a, UMAP embedding of hair follicle cells from the mouse skin data. 695
Cells are colored by cell types (TAC, IRS, hair shaft, and medulla) and pseudotime. b, 696
H3K4me1 and H3K27ac ChIP-seq scores for linked peaks identified by TRIPOD, DORCs 697
(regulatory domains identified by gene-peak correlations), and randomly sampled peaks. 698
c, TRIPOD’s linked peaks for four representative genes were significantly enriched in 699
previously annotated super-enhancers in the mouse TAC population. d, Trios detected 700
by TRIPOD that were active in IRS (top), medulla (middle), and hair shaft (bottom), 701
respectively. e, Dot plots of gene expressions, peak accessibilities, and TF expressions 702
across different cell types. f, Influence analyses identified segments along the 703
differentiation trajectory where the regulation took effect. The colors in the UMAP 704
embedding correspond to the smoothed 𝑝-values from a sampling-based approach. g, 705
DNA footprinting assays showed cell-type-specific enrichments of Tn5 integration events. 706
The findings were consistent with those from the influence analyses. 707
708
Table 1 | Resources for validating peak-TF-gene regulatory relationship. While there 709
is no existing experimental approach to validate all three factors in a trio at high resolution 710
with high throughput, we resort to existing databases and orthogonal sequencing data to 711
validate peak-gene, peak-TF, and TF-gene pairs, completing the loop. 712
713
References 714
1. Gasperini, M., Tome, J.M. & Shendure, J. Towards a comprehensive catalogue of validated and 715
target-linked human enhancers. Nat Rev Genet 21, 292-310 (2020). 716
2. Hobert, O. Gene regulation by transcription factors and microRNAs. Science 319, 1785-1786 717
(2008). 718
3. Mortazavi, A., Williams, B.A., McCue, K., Schaeffer, L. & Wold, B. Mapping and quantifying 719
mammalian transcriptomes by RNA-Seq. Nat Methods 5, 621-628 (2008). 720
4. Johnson, D.S., Mortazavi, A., Myers, R.M. & Wold, B. Genome-wide mapping of in vivo protein-721
DNA interactions. Science 316, 1497-1502 (2007). 722
5. Buenrostro, J.D., Giresi, P.G., Zaba, L.C., Chang, H.Y. & Greenleaf, W.J. Transposition of native 723
chromatin for fast and sensitive epigenomic profiling of open chromatin, DNA-binding proteins 724
and nucleosome position. Nat Methods 10, 1213-1218 (2013). 725
6. Lieberman-Aiden, E. et al. Comprehensive mapping of long-range interactions reveals folding 726
principles of the human genome. Science 326, 289-293 (2009). 727
7. Feng, C. et al. KnockTF: a comprehensive human gene expression profile database with 728
knockdown/knockout of transcription factors. Nucleic Acids Res 48, D93-D100 (2020). 729
26
8. Tompa, M. et al. Assessing computational tools for the discovery of transcription factor binding 730
sites. Nat Biotechnol 23, 137-144 (2005). 731
9. Consortium, G. Genetic effects on gene expression across human tissues. Nature 550, 204-213 732
(2017). 733
10. Kim-Hellmuth, S. et al. Cell type-specific genetic regulation of gene expression across human 734
tissues. Science 369 (2020). 735
11. Stuart, T. et al. Comprehensive Integration of Single-Cell Data. Cell 177, 1888-1902 e1821 (2019). 736
12. Stuart, T., Srivastava, A., Lareau, C. & Satija, R. Multimodal single-cell chromatin analysis with 737
Signac. bioRxiv, 2020.2011.2009.373613 (2020). 738
13. Ma, S. et al. Chromatin Potential Identified by Shared Single-Cell Profiling of RNA and Chromatin. 739
Cell 183, 1103-1116 e1120 (2020). 740
14. Hao, Y. et al. Integrated analysis of multimodal single-cell data. Cell 184, 3573-3587 e3529 (2021). 741
15. Duren, Z., Chen, X., Jiang, R., Wang, Y. & Wong, W.H. Modeling gene regulation from paired 742
expression and chromatin accessibility data. Proc Natl Acad Sci U S A 114, E4914-E4923 (2017). 743
16. Pliner, H.A. et al. Cicero Predicts cis-Regulatory DNA Interactions from Single-Cell Chromatin 744
Accessibility Data. Mol Cell 71, 858-871 e858 (2018). 745
17. Wang, C. et al. Integrative analyses of single-cell transcriptome and regulome using MAESTRO. 746
Genome Biol 21, 198 (2020). 747
18. Cao, J. et al. Joint profiling of chromatin accessibility and gene expression in thousands of single 748
cells. Science 361, 1380-1385 (2018). 749
19. Chen, S., Lake, B.B. & Zhang, K. High-throughput sequencing of the transcriptome and chromatin 750
accessibility in the same cell. Nat Biotechnol 37, 1452-1457 (2019). 751
20. Becht, E. et al. Dimensionality reduction for visualizing single-cell data using UMAP. Nat Biotechnol 752
(2018). 753
21. Taylor, J. & Tibshirani, R.J. Statistical learning and selective inference. Proc Natl Acad Sci U S A 112, 754
7629-7634 (2015). 755
22. Schep, A.N., Wu, B., Buenrostro, J.D. & Greenleaf, W.J. chromVAR: inferring transcription-factor-756
associated accessibility from single-cell epigenomic data. Nat Methods 14, 975-978 (2017). 757
23. Andersson, R. et al. An atlas of active enhancers across human cell types and tissues. Nature 507, 758
455-461 (2014). 759
24. Wang, J. et al. HACER: an atlas of human active enhancers to interpret regulatory variants. Nucleic 760
Acids Res 47, D106-D112 (2019). 761
25. Teng, L., He, B., Wang, J. & Tan, K. 4DGenome: a comprehensive database of chromatin 762
interactions. Bioinformatics 32, 2727 (2016). 763
26. Gao, T. & Qian, J. EnhancerAtlas 2.0: an updated resource with enhancer annotation in 586 764
tissue/cell types across nine species. Nucleic Acids Res 48, D58-D64 (2020). 765
27. Zhang, Q. et al. hTFtarget: A Comprehensive Database for Regulations of Human Transcription 766
Factors and Their Targets. Genomics Proteomics Bioinformatics 18, 120-128 (2020). 767
28. Mei, S. et al. Cistrome Data Browser: a data portal for ChIP-Seq and chromatin accessibility data 768
in human and mouse. Nucleic Acids Res 45, D658-D662 (2017). 769
29. La Manno, G. et al. Molecular architecture of the developing mouse brain. Nature 596, 92-96 770
(2021). 771
30. Huang, M., Zhang, Z. & Zhang, N.R. Dimension reduction and denoising of single-cell RNA 772
sequencing data in the presence of observed confounding variables. bioRxiv, 773
2020.2008.2003.234765 (2020). 774
31. Kuspert, M., Hammer, A., Bosl, M.R. & Wegner, M. Olig2 regulates Sox10 expression in 775
oligodendrocyte precursors through an evolutionary conserved distal enhancer. Nucleic Acids Res 776
39, 1280-1293 (2011). 777
27
32. Zhu, C. et al. An ultra high-throughput method for single-cell joint analysis of open chromatin and 778
transcriptome. Nat Struct Mol Biol 26, 1063-1070 (2019). 779
33. Yu, Y. et al. Olig2 targets chromatin remodelers to enhancers to initiate oligodendrocyte 780
differentiation. Cell 152, 248-261 (2013). 781
34. Sessa, A. et al. The Tbr2 Molecular Network Controls Cortical Neuronal Differentiation Through 782
Complementary Genetic and Epigenetic Pathways. Cereb Cortex 27, 5715 (2017). 783
35. Notwell, J.H. et al. TBR1 regulates autism risk genes in the developing neocortex. Genome Res 26, 784
1013-1022 (2016). 785
36. Mira, H. & Morante, J. Neurogenesis From Embryo to Adult - Lessons From Flies and Mice. Front 786
Cell Dev Biol 8, 533 (2020). 787
37. Emery, B. & Lu, Q.R. Transcriptional and Epigenetic Regulation of Oligodendrocyte Development 788
and Myelination in the Central Nervous System. Cold Spring Harb Perspect Biol 7, a020461 (2015). 789
38. Huang da, W., Sherman, B.T. & Lempicki, R.A. Systematic and integrative analysis of large gene 790
lists using DAVID bioinformatics resources. Nat Protoc 4, 44-57 (2009). 791
39. Achim, K., Salminen, M. & Partanen, J. Mechanisms regulating GABAergic neuron development. 792
Cell Mol Life Sci 71, 1395-1415 (2014). 793
40. Setty, M. et al. Characterization of cell fate probabilities in single-cell data with Palantir. Nat 794
Biotechnol 37, 451-460 (2019). 795
41. Bravo Gonzalez-Blas, C. et al. cisTopic: cis-regulatory topic modeling on single-cell ATAC-seq data. 796
Nat Methods 16, 397-400 (2019). 797
42. Adam, R.C. et al. Pioneer factors govern super-enhancer dynamics in stem cell plasticity and 798
lineage choice. Nature 521, 366-370 (2015). 799
43. Natarajan, A., Yardimci, G.G., Sheffield, N.C., Crawford, G.E. & Ohler, U. Predicting cell-type-800
specific gene expression from regions of open chromatin. Genome Res 22, 1711-1722 (2012). 801
44. Zhou, W. et al. Genome-wide prediction of DNase I hypersensitivity using gene expression. Nat 802
Commun 8, 1038 (2017). 803
45. Blatti, C., Kazemian, M., Wolfe, S., Brodsky, M. & Sinha, S. Integrating motif, DNA accessibility and 804
gene expression data to build regulatory maps in an organism. Nucleic Acids Res 43, 3998-4012 805
(2015). 806
46. Kazemian, M., Pham, H., Wolfe, S.A., Brodsky, M.H. & Sinha, S. Widespread evidence of 807
cooperative DNA binding by transcription factors in Drosophila development. Nucleic Acids Res 808
41, 8237-8252 (2013). 809
47. Panigrahi, A. & O'Malley, B.W. Mechanisms of enhancer action: the known and the unknown. 810
Genome Biol 22, 108 (2021). 811
48. Urrutia, E., Chen, L., Zhou, H. & Jiang, Y. Destin: toolkit for single-cell analysis of chromatin 812
accessibility. Bioinformatics 35, 3818-3820 (2019). 813
49. Jiang, Y., Zhang, N.R. & Li, M. SCALE: modeling allele-specific gene expression by single-cell RNA 814
sequencing. Genome Biol 18, 74 (2017). 815
50. Fornes, O. et al. JASPAR 2020: update of the open-access database of transcription factor binding 816
profiles. Nucleic Acids Res 48, D87-D92 (2020). 817
818
Figures
Figure 1
Interaction between TF expression and peak accessibility improves RNA prediction accuracy.
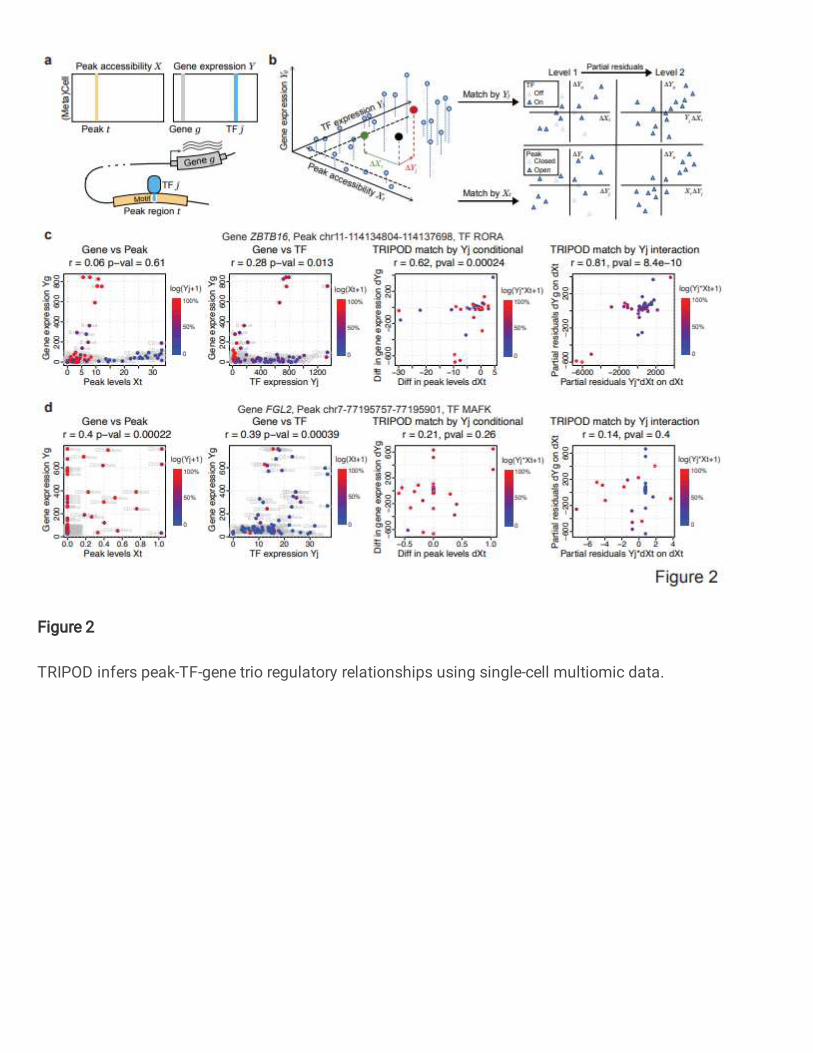
Figure 2
TRIPOD infers peak-TF-gene trio regulatory relationships using single-cell multiomic data.
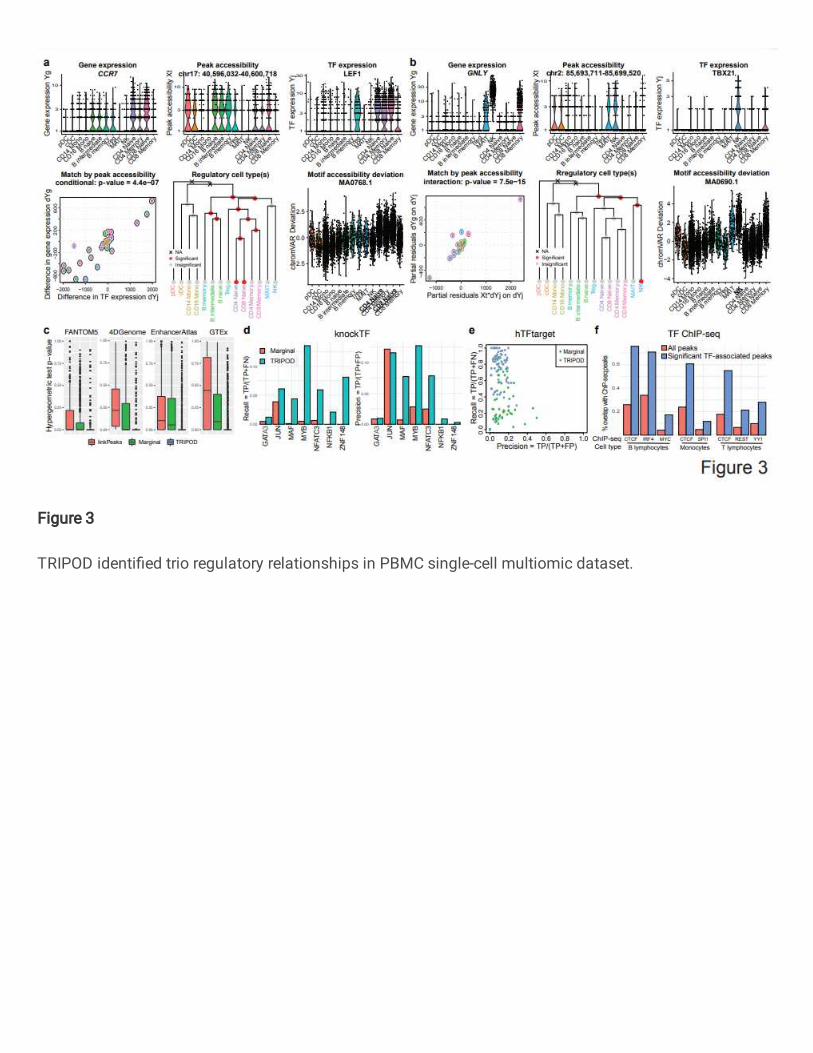
Figure 3
TRIPOD identi�ed trio regulatory relationships in PBMC single-cell multiomic dataset.
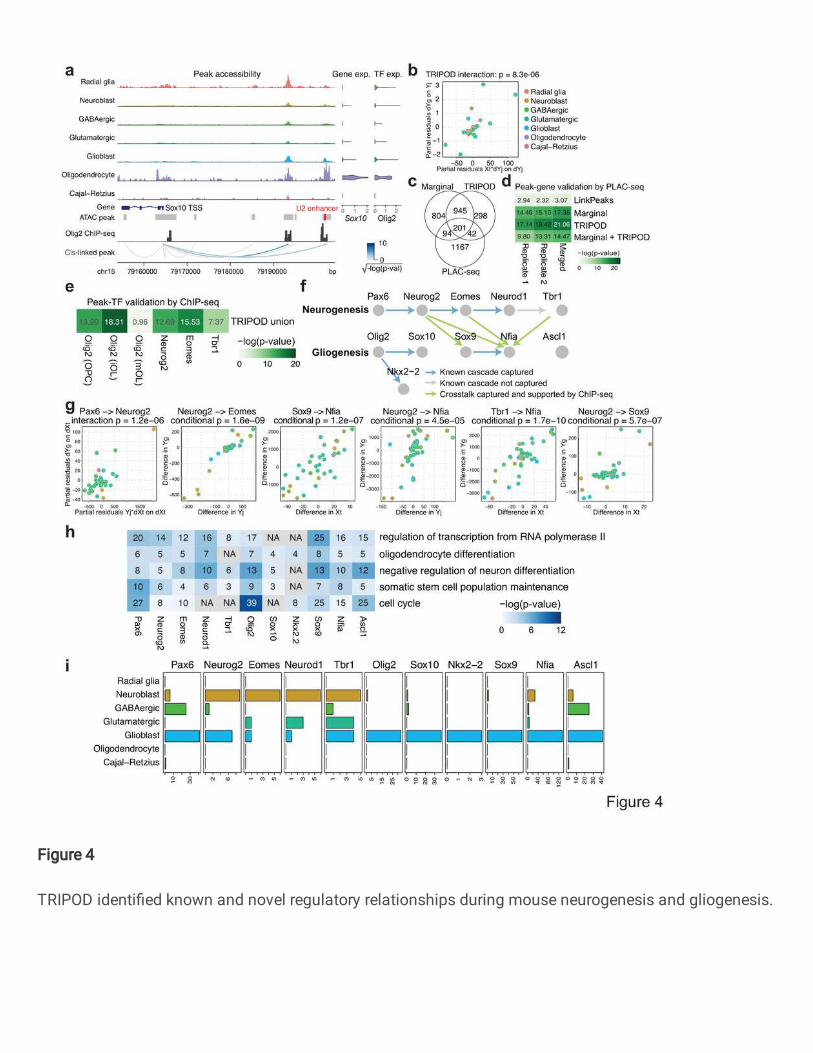
Figure 4
TRIPOD identi�ed known and novel regulatory relationships during mouse neurogenesis and gliogenesis.

Figure 5
TRIPOD identi�ed regulatory relationships in mouse hair follicles with transient cell states.
Supplementary Files
This is a list of supplementary �les associated with this preprint. Click to download.

Table1validationresources.pdf
TRIPODsupplementsv4.pdf