Embed Size (px)
Citation preview

Introduction
Proposed Methodology
Application
Nonparametric causal e↵ects based on
incremental propensity score interventions
Edward Kennedy
Department of Statistics & Data Science
Carnegie Mellon University
ICHPS, 11 Jan 2018
0 / 22

Introduction
Proposed Methodology
Application
Take away
Standard causal methods require strong statistical assumptions
I e.g., all must have non-zero chance of treatment and control
I need parametric models if more than a few timepoints
We propose incremental propensity score interventions instead
I e.g., what would happen if we shifted everyone’s PS?
I these completely avoid positivity and parametric assumptions
1 / 22

Introduction
Proposed Methodology
Application
Motivating example
2 / 22

Introduction
Proposed Methodology
Application
Motivating example
2 / 22

Introduction
Proposed Methodology
Application
Motivating example
Incarceration is a colossal industry in the US
I currently 2.3 million confined in correctional facilities
I another 4.6 million on probation/parole
Important to study unintended consequences of mass incarceration
I e.g., e↵ects on employment, health, psychology, social ties...
We will consider e↵ects on entry into marriage
I impacts family/social support, children’s outcomes, recidivism
3 / 22

Introduction
Proposed Methodology
Application
Data & setup
We use data from National Longitudinal Survey of Youth 1997.
Observe iid sample (Z1, ...,Zn) for
Z = (X1,A1,X2,A2, ...,XT ,AT ,Y ) = (XT ,AT ,Y )
where T = 10 years (2001-2010), n = 4781 subjects, and
I Xt = covariates at time t
(demographics, delinquency indicators, employment, earnings...)
I At = exposure at time t (whether incarcerated at year t)
I Y = outcome (whether married in 2010)
4 / 22

Introduction
Proposed Methodology
Application
Standard approaches
Let Y aT denote potential outcome that would have been observedunder exposure sequence aT = (a1, ..., aT )
I let Ht = (Xt ,At�1) denotes past covariate/exposure history
Standard causal methods target deterministic intervention e↵ects
(Y aT ) = m(aT ;�) (MSM)
(Y at ,0 � Yat�1,0 | Ht ,At) = �t(ht , at ; ✓) (SNM)
or similar related quantities (Robins 1986, 1994, 2000)
5 / 22

Introduction
Proposed Methodology
Application
Issue 1: Parametric modeling
MSMs/SNMs have curse of dimensionality in T . Even in RCT:
I for T = 10, if n < 5k then > 99% chance of non-empty cell,need n ⇡ 12k to guarantee < 1% chance of empty cell
Parametric models reduce variance but can give extreme bias
I lots of parameters =) hard to interpret/visualize
I fewer parameters =) probably severely wrong
Let’s be honest:We use parametric models because they make life easier
6 / 22

Introduction
Proposed Methodology
Application
Issue 2: Positivity
Let ⇡t(ht) = (At = 1 | Ht = ht) denote propensity score at t.
Standard MSMs/SNMs require positivity assumptions of the form
{0 < ⇡t(Ht) < 1} = 1
i.e., everyone has to have chance at treatment/control. But:
I very sick may always take trt, very healthy may never
I multi-year incarceration, many have ⇡t(ht) ⇡ 0
Even near-violations can wreak havoc for finite n! (even if T = 1)
7 / 22
Introduction
Proposed Methodology
Application
Related work
Restrictive modeling/positivity assumptions can be weakened byshifting focus to e↵ects of other types of interventions! Lots of recent interest in dynamic & stochastic interventions:
I T = 1: Pearl (00), Tian (08), Diaz & van der Laan (12, 13),Moore et al (12), Haneuse & Rotnitzky (13)
I T > 1: Murphy et al (01), Robins et al (04), vdL & Petersen(07), Taubman et al (09), Cain et al (10), Young et al (11, 14)
But none of these approaches simultaneously
I are completely nonparametric, even when T is large
I avoid positivity conditions entirely
8 / 22

Introduction
Proposed Methodology
Application
Our proposal
We propose incremental propensity score intervention e↵ects andcorresponding estimators
Advantages:
I completely nonparametric even with large T
I no positivity required
I estimators can converge at fast parametricpn rates, even if
constructed via machine learning / high-dimensional regression
I can be used in general longitudinal studies
I yields neat Fisher-type test of no longitudinal trt e↵ect
9 / 22

Introduction
Proposed Methodology
Application
Incremental PS interventions
Incremental PS interventions shift ⇡t values instead of setting At
Let YQ(�) be potential outcome under the fluctuated trt process
qt(ht ; �,⇡t) =�⇡t(ht)
�⇡t(ht) + 1� ⇡t(ht)
where � 2 (0,1) is an increment parameter
I qt = ⇡t if � = 1, qt ! 1 as � ! 1, qt ! 0 as � ! 0
10 / 22

Introduction
Proposed Methodology
Application
The increment � is just an OR
The increment parameter is easy to interpret if we notice
� =qt(ht)/{1� qt(ht)}
⇡t(ht)/{1� ⇡t(ht)}=
oddsQ(At = 1 | Ht = ht)
odds (At = 1 | Ht = ht)
when 0 < ⇡t < 1 (else qt = ⇡t) =) � is simply an odds ratio
Example: Suppose � = 1.5, so odds of treatment increase by 50%
I if ⇡t = 50% then qt = 60%
I if ⇡t = 25% then qt ⇡ 33%
I if ⇡t = 5% then qt ⇡ 7.3%
11 / 22

Introduction
Proposed Methodology
Application
0.0 0.2 0.4 0.6 0.8 1.0
0.0
0.2
0.4
0.6
0.8
1.0
δ = 0.52
Propensity score at t = 1
Prop
ensi
ty s
core
at t
= 2
●
●
●
●●●
●
●
●●
●
●
●
●
●
●
●
●
●
●
12 / 22

Introduction
Proposed Methodology
Application
0.0 0.2 0.4 0.6 0.8 1.0
0.0
0.2
0.4
0.6
0.8
1.0
δ = 1.93
Propensity score at t = 1
Prop
ensi
ty s
core
at t
= 2
●
●●
●●●●
●
●●
●
●
●
●
●
●
●
●
●●
12 / 22
Introduction
Proposed Methodology
Application
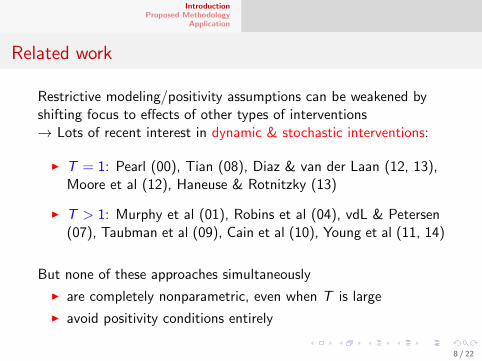
Identification
We focus on estimating mean (�) = (YQ(�))
I mean outcome if odds of treatment were multiplied by �
Assume: 1. Consistency: Y = YAT
2. Exchangeability: At ?? YaT | Ht
Identification follows from Robins’ extended g-formula:
(�) =X
aT
Z
Xµ(ht , at)
TY
t=1
qt(at | ht) d (xt | ht�1, at�1)
! no positivity needed! since qt = ⇡t if ⇡t = 0, 1 for 0 < � < 1
13 / 22

Introduction
Proposed Methodology
Application
E�ciency theory
Understanding the e�cient influence function (EIF) is crucial
I variance gives us e�ciency bound ! estimation benchmark
I recipe for constructing estimators that are e�cient yet robust
I clarifies regularity conditions needed for e�cient estimation
Uncentered EIF for T = 1 case:
�⇡(X)�1(Z) + {1� ⇡(X)}�0(Z)
�⇡(X) + {1� ⇡(X)}+�{µ(X, 1)� µ(X, 0)}{A� ⇡(X)}
{�⇡(X) + 1� ⇡(X)}2
for �a =(A=a)⇡(a|X) {Y � µ(X,A)}+ µ(X, a) EIF for {µ(X, a)}
14 / 22

Introduction
Proposed Methodology
Application
Estimation
It is easy to construct an IPW estimator of (�):
⇤ipw (�) = n
(TY
t=1
(�At + 1� At)Y
�⇡t(Ht) + 1� ⇡t(Ht)
)
But for general ⇡t this won’t bepn-consistent & asymp. normal
! only if ⇡t constructed with correct parametric models
Or can solve EIF estimating equation ⇤(�) = n{'(Z; ⌘, �)}
I can bepn CAN even if ⌘ = (⇡t , mt) converge at slower rates
I but must restrict complexity of ⌘ (random forests, boosting?)
15 / 22

Introduction
Proposed Methodology
Application
Sample-splitting estimator
Can exploit K -fold sample splitting to use arbitrary ML methods:
(�) = n{'(Z; ⌘-S , �)}
where S 2 {1, ...,K} is splitting rv, ⌘-s is fit excluding fold s
I still need faster than n�1/4 rate for ⌘ = (⇡t , mt) for CAN,
as with estimating equation estimator
16 / 22

Introduction
Proposed Methodology
Application
Large-sample properties
Suppose D = [�`, �u] is bounded with 0 < �` �u < 1, and:
I⇣sup� kmt,� �mt,�k+ k⇡t � ⇡tk
⌘k⇡s � ⇡sk = o (1/
pn) for s t
Then normalized (·) converges to mean-zero Gaussian process:
(�)� (�)
�(�)/pn (�) in `1(D)
where �2(�) = n[{'(Z; ⌘-S , �)� (�)}2]
I for pointwise CIs: empirical variance of estimated IF
I for uniform CIs can use multiplier bootstrap (Chernozhukov etc)
! very easy to compute (don’t need to do any refitting!)
17 / 22

Introduction
Proposed Methodology
Application
Testing no e↵ect
Given a uniform CI, we can invert to test no e↵ect hypothesis
H0 : (�) = (Y ) for all � 2 D [ {1}
! note: this null is somewhere in between Fisher and Neyman
Specifically, for lower/upper uniform limits `/u,↵
p = sup
⇢↵ : inf
�2D u,↵(�) � sup
�2D `,↵(�)
�
is a valid p-value for testing H0.
I this is just biggest ↵ giving CI that contains straight line
18 / 22

Introduction
Proposed Methodology
Application
Back to NLSY application
Recall we have data across T = 10 years for n = 4781 individuals
I goal: learn about e↵ects of incarceration on marriage
We estimated nuisance functions (⇡t ,mt) with random forests
I used K = 5 fold sample splitting
I need to do T + 1 = 11 fits for each � value (and split)
I but the ranger package in R is very fast
Implemented our proposed methods, also standard MSM analysis
19 / 22

Introduction
Proposed Methodology
Application
Standard MSM analyses
Model: (Y aT ) = �0 + �1P
t at
Estimate Robust.SE z.val p.val(Intercept) -2.72e+15 8.15e+14 -3.34 0.001totincarc -1.12e+13 1.25e+14 -0.09 0.928
After stabilization:
Estimate Robust.SE z.val p.val(Intercept) -0.8592 0.033315 -25.79 0.000totincarc -0.3241 0.112994 -2.87 0.004
Model: (Y aT ) = �0 +P
t �tat
Error in solve.default... system is computationally singular...
20 / 22

Introduction
Proposed Methodology
Application
0.20
0.25
0.30
0.35
Incarceration odds ratio δ
Mar
riage
pre
vale
nce ψ
(δ)
0.1 0.2 0.5 1 2 5
EstimatePointwise 95% CIUniform 95% CI
P−value for testingno effect: p=0.024
21 / 22

Introduction
Proposed Methodology
Application
Summary
Available causal methods require positivity/parametrics/both
I especially in longitudinal studies with e.g., 5+ timepoints
We propose incremental propensity score interventions
I no parametric assumptions or positivity required
I e�cient estimators that can incorporate machine learning
I uniform inference ! novel tests of no e↵ect
22 / 22

Introduction
Proposed Methodology
Application
The paper is in press at JASA and on arxiv:arxiv.org/abs/1704.00211
You can implement the method with the R package “npcausal”http://www.ehkennedy.com/code.html
Feel free to email with any questionsor if you want to collaborate in applying these methods:
Thank you!
22 / 22

Introduction
Proposed Methodology
Application
22 / 22

Introduction
Proposed Methodology
Application
Taxonomy of intervention types
Restrictive modeling/positivity assumptions can be weakened byshifting focus to e↵ects of other types of interventions
1. Deterministic
a. static: A⇤t = at
b. dynamic: A⇤t = dt(Ht) for some dt : Ht 7! A
2. Stochastic
a. static: A⇤t ⇠ Bern(qt)
b. dynamic: A⇤t ⇠ Bern{qt(Ht)} for some qt : Ht 7! [0, 1]
23 / 22

Introduction
Proposed Methodology
Application
Identification when T = 1
When T = 1 the identifying expression for (�) simplifies:
(�) =
�⇡(X)µ(X, 1) + {1� ⇡(X)}µ(X, 0)
�⇡(X) + 1� ⇡(X)
�
where µ(X,A) = (Y | X,A) is regression function
24 / 22

Introduction
Proposed Methodology
Application
EIF for T > 1
EIF (again uncentered) in longitudinal studies is more complicated:
' =TX
t=1
At{1� ⇡t(Ht)}� (1� At)�⇡t(Ht)
�/(� � 1)
�( 1X
a=0
mt(Ht , a)qt(a | Ht)
)
⇥
(tY
s=1
(�As + 1� As)
�⇡s(Hs) + 1� ⇡s(Hs)
)+
TY
t=1
(�At + 1� At)Y
�⇡t(Ht) + 1� ⇡t(Ht)
where for mT+1 = Y we recursively define
mt(Ht ,At) =1X
a=0
nmt+1(Ht+1, a)qt+1(a | Ht+1)
��� Ht ,At
o
25 / 22

Introduction
Proposed Methodology
Application
Estimation algorithm
8�, k , with D0 / D1 train/test data, resp., with D = D0 [D1:
1. Regress At ⇠ Ht in D0, obtain preds ⇡t(Ht) in D.
2. Compute weights Wt =�At+1�At
�⇡t(Ht)+1�⇡t(Ht)in D1.
3. Compute cumulative product weight fWt =Qt
s=1Ws in D1.
4. For each time t = T ,T � 1, ..., 1 (starting with RT+1 = Y ):(a) Regress Rt+1 ⇠ (Ht ,At) in D0, obtain preds mt(Ht , a) in D.(b) Construct pseudo-outcome Rt =
Pa mt(Ht , a)qt(a | Ht) in D.
5. Compute weights Vt =At{1�⇡t(Ht)}�(1�At)�⇡t(Ht)
�/(��1)in D1.
6. Set k(�) as average of ' = fWTY +P
tfWtVtRt vals in D1.
! Set (�) as average of K estimators k(�), k = 1, ...,K .
26 / 22

Introduction
Proposed Methodology
Application
Uniform inference
Easy to get pointwise CIs: empirical variance of estimated IF
I for uniform CIs can use multiplier bootstrap (Chernozhukov etc)
i.e., to find critical value c↵ such that⇢ (�)�
c↵�(�)pn
(�) (�) +c↵�(�)pn
, 8� 2 D
�= 1� ↵+ o(1)
we can generate ⇠i ⇠ N(0, 1) and solve sup�2D
�����pn n
"⇠
('(Z; ⌘
-S , �)� (�)
�(�)
)#����� � c↵
��� Z1, ...,Zn
!= ↵
! very easy to compute (don’t need to do any refitting!)
27 / 22