Embed Size (px)
Citation preview

This article was downloaded by: [University of California Santa Barbara]On: 17 December 2014, At: 16:37Publisher: Taylor & FrancisInforma Ltd Registered in England and Wales Registered Number: 1072954 Registered office: Mortimer House,37-41 Mortimer Street, London W1T 3JH, UK
Journal of Earthquake EngineeringPublication details, including instructions for authors and subscription information:http://www.tandfonline.com/loi/ueqe20
NONLINEAR SHAKE TABLE IDENTIFICATION ANDCONTROL FOR NEAR-FIELD EARTHQUAKE TESTINGJ. GEOFFREY CHASE∗ a , NICOLAS H. HUDSON† a , JESSICA LIN† a , RODNEY ELLIOT‡ a &
AYLWIN SIM† aa Department of Mechanical Engineering , University of Canterbury , Private Bag 4800,Christchurch, New ZealandPublished online: 04 Sep 2008.
To cite this article: J. GEOFFREY CHASE∗ , NICOLAS H. HUDSON† , JESSICA LIN† , RODNEY ELLIOT‡ & AYLWIN SIM† (2005)NONLINEAR SHAKE TABLE IDENTIFICATION AND CONTROL FOR NEAR-FIELD EARTHQUAKE TESTING, Journal of EarthquakeEngineering, 9:4, 461-482, DOI: 10.1080/13632460509350551
To link to this article: http://dx.doi.org/10.1080/13632460509350551
PLEASE SCROLL DOWN FOR ARTICLE
Taylor & Francis makes every effort to ensure the accuracy of all the information (the “Content”) containedin the publications on our platform. However, Taylor & Francis, our agents, and our licensors make norepresentations or warranties whatsoever as to the accuracy, completeness, or suitability for any purpose of theContent. Any opinions and views expressed in this publication are the opinions and views of the authors, andare not the views of or endorsed by Taylor & Francis. The accuracy of the Content should not be relied upon andshould be independently verified with primary sources of information. Taylor and Francis shall not be liable forany losses, actions, claims, proceedings, demands, costs, expenses, damages, and other liabilities whatsoeveror howsoever caused arising directly or indirectly in connection with, in relation to or arising out of the use ofthe Content.
This article may be used for research, teaching, and private study purposes. Any substantial or systematicreproduction, redistribution, reselling, loan, sub-licensing, systematic supply, or distribution in anyform to anyone is expressly forbidden. Terms & Conditions of access and use can be found at http://www.tandfonline.com/page/terms-and-conditions

Journal of Earthquake Engineering, VoI. 9, No. 4 (2005) 461-482 @ Imperial College Press
wnw.lcprsss.co.uk
NONLINEAR SHAKE TABLE IDENTIFICATION AND CONTROL FOR NEAR-FIELD EARTHQUAKE TESTMG
J. GEOFFREY CHASE', NICOLAS H. HUDSONt, JESSICA L I N ~ , RODNEY ELLIOT$ and AYLWN S I M ~
Department of Mechanicd Engineering, University of Canterbury Priuate Bag 4800, Christchurrch, New Zealand
Received 27 December 2003 Reviewed 11 May 2004
Accepted 2 October 2004
The primary focus of a structural shake table system is the accurate reproduction of acceleration records for testing. However, many systems deliver variable and less than optimal performance, particdarly when reproducing large near-field seismic events that require extreme table performance. Improved identification and control methods are developed for large hydraulic servo-actuated shake table systems that can exhibit unac- ceptable tracking response for large, near- field seismic testing. The research is presented in the context of a Stonne shake table facility at the University of Canterbury that is of typical design. The system is identified using a frequency response approach that accounts for the actual magnitudes and frequencies of motion encountered in seismic test- ing. The models and methods developed are experimentally verified and the impact of different feedback variables such as acceleration, velocity and displacement are examined.
The methods show that shake table control in testing large near-field seismic events is often a trade off between accurate tracking and nonlinear velocity saturation of the hydraulic valves that can result in severe acceleration spikes. Control methods are deve1- oped to improve performance and include both acceleration and displacement feedback
'
to reduce the acceleration spikes, and record modification, where the reference signal is modified to conform to the shake table's operational parameters. RRsults show record modification gives exact tracking for near-field ground motions, and optimal system response for reference signals with velocity components greater then the system cap* bilities. Overall, the rwearch presents a methodology for simple effective identification, modelling, diagnosis and control of structural shake table systems that can be readily generalised and applied to any similar facility.
Keywords: Shake table; control; nodinear models; system identification; velocity satu- rat ion; earthquake engineering; near- field earthquakes.
1. Introduction
Accurate reproduction of acceleration records is required to simulate an earthquake in full size or model structures. Understanding the dynamics of the shake table
' Associate Professor/Reader, Email: geoff .chas&canterbury.ac.nz %search Assistant S~cience Officer
Dow
nloa
ded
by [
Uni
vers
ity o
f C
alif
orni
a Sa
nta
Bar
bara
] at
16:
37 1
7 D
ecem
ber
2014

462 J. G. Chase et al.
system used to reproduce the earthquake, including the nonlinear characteristics of the actuation system, is essential before an e%ective controller can be designed. This paper describes the system identification, modelling, and control design methods used to improve the performance of an experimental shake table system. These results can be generalised and applied to a wide class of serveactuated shake tables.
A shake table typically consists of a table capable-of moving in one degree of freedom (DOF) or direction, on linear bearings, actuated by current driven, displacement feedback controlled servovalves designed to ensure the table tracks a desired reference input motion. Multi-direction shake tables are less common and this research deals with the single direction configuration. Large shake table systems can have trouble tracking near field seismic inputs to the desired accuracy due to actuation limitations and/or poor control design for these inputs. More specifically, many existing shake table facilities were designed prior to the significant near-field earthquakes in Northridge, California and Kobe, Japan in the 1990s to reproduce the far-field vibratory ground motions common in research and design. Shake table response to these near-field ground motions, which are characterised by large aixeleration puhes and velocities, can include large acceleration spikes up to twice the magnitude of the input acceleration record. This problem has been accredited to the binding of the table on the linear bearings, due to moment loads induced from table-structure interaction, as well as variable friction and velocity saturation [Kusner et ol., 19921. This research shows that the primary cause is velocity saturation leading to compromises in control design.
There are several methods of creating an accurate shake table model. Recent methods include.breaking down the system into several subsystems and analysing each subsystem in either the state space [Kuehn et al., 19991, or Laplace domain [Conte and Trombetti, 20001. However, these works use a low amplitude white noise signal containing frequencies up to 200Hz as the reference input signal to identify the table dynamics. Such small, high frequency signals are not representative of the actual motions required for precision reproduction of earthquake inputs and may lead to responses that are not representative at higher amplitude motions. The identification of individual subsystems, while intuitive, may not fully capture the complete system's dynamics, reducing the effectiveness of the control design based on these system models. Finally, they create linear models that may not capture the fundamental dynamics necessary to accurately reproduce the desired seismic input. This research presents a more pragmatic approach based on analysing the total
system transfer function for input signals of a magnitude similar to those found dur- ing typical usage and then identifying dominant nonlinear effects from the difference between modelled and measured behaviour. F'rom this approach an accurate non- linear model can be created that captures the fundamental dynamics of the shake table system.
More specifically, this research derives transfer functions from experimental bode plots, which proves highly effective in identifying the system dynamics and
Dow
nloa
ded
by [
Uni
vers
ity o
f C
alif
orni
a Sa
nta
Bar
bara
] at
16:
37 1
7 D
ecem
ber
2014

Nonlinear Shake Table Identification and Control 463
non-linearities of the system. Controllers using displacement, velocity and acceler- ation feedback are designed, analysed and then implemented on the shake table. The performance and limitations of several control methods are evaluated, and rec- ommendations to their implementation on this and similar shake table systems are discussed. The overall structure of the paper therefore describes the experimental shake table system used in this research, followed by identification of its dynamics and ending with the development and analysis of different control methods.
2. Experimental System
The University of Canterbury shake table, shown in Fig. 1, is a uni-directional table which has an unloaded mass of 5000 kg, supported by two sets of linear Teflon
Fig. 1. Ex,perimental shake table system.
Dow
nloa
ded
by [
Uni
vers
ity o
f C
alif
orni
a Sa
nta
Bar
bara
] at
16:
37 1
7 D
ecem
ber
2014

464 J. G. Chase et d.
bearings. The system is driven by a 280kN double-acting hydraulic actuator, pow- ered by a 300Hp motor operating at 4000psi. The hydraulic actuator is controlled by a set of two Moog E072-054 senrovalves, capable of supplying up to 232 ipm each.
The servovalves are controlled by a TestStar control system from MTS Systems Corporation that includes a controller and signal conditioners to drive the current based servovalves and decode sensor signals. Table displacement is measured by a Linear Variable Dserential Thmducer (LVDT) , and displacement input reference signals are produced from an external computer.
For this research, a dSpaceTM real-time rapid prototyping system for digital control systems is used as an external data acquisition system, signal source, and external control system. The Analogue to Digital (A/D), and Digital to Ana- logue (D/A) modules are capable of sampling 12 AID channels and putting out 10 D/A channels at over 100kHz. The system is driven by two PowerPC chips programmed using compiled Sirnulink models, allowing filters and controllers to be rapidly developed into real- time software, downloaded, and then modified while running in real time.
As the existing Teststar controller is not capable of implementing some of the advanced control methods developed, it is taken out of the loop. The internal TestStar feedback loop, which would otherwise interfere with the external con- troller, is cancelled by setting the TestStar controller to a unity proportional gain, and by adding a feedforward cancellation signal to the reference signal as shown in Fig. 2. The feedforward cancellation signal is the LVDT signal, which cancels with the hardwired negative feedback loop of the current system, enabling complete external control.
The feedforward cancellation was verified by two tests. First, the table was commanded to track a zero reference signal from a non-zero starting point. Second, the table response was compared for three different earthquake records when driven, using the same control gains, by the built-in feedback loop and with the external controller. Test 1 determines whether the feedforward cancellation is exact when the table displacement is low or zero, and the table tracked to zero without any steady state offset. Test 2 confirms that the feedforward approach works for larger inputs, with identical response using either the internal controller or the external controller.
Reference Table Displacement
Built-in Feedback
Fig. 2. . External control setup using feedforward cancellation to remove hardwired feedback loop.
Dow
nloa
ded
by [
Uni
vers
ity o
f C
alif
orni
a Sa
nta
Bar
bara
] at
16:
37 1
7 D
ecem
ber
2014

Nonlinear Shake 'Table Identification and Control 465
3. System Transfer Function
A shake table system can be modelled as a large damped table mass (m) moving (x) in response to a driving force ( ~ ( t ) ) . Viscous damping (c) is assumed to account for friction on the bearings for convenience and because Coulomb friction is difficult to identify and can vary with conditions and speed of the table:
Transformed into the Laplace domain, the resulting SISO transfer function G(s ) is defined:
The servovalveactuator system, including the servovalves, hydraulic ram, and sig- nal processing hardware, has a transfer function, K(s) , that converts the refer- ence displacement input signal ( x d ( t ) ) into the corresponding force of the hydraulic ram, u(t). Combining K ( s ) and G(s) gives the open loop table transfer function G(s), where zd(t) is the commanded displacement input signal and s(t) is the actual table displacement.
The transfer function K(s) is not directly analysed, but is an implicit part of G(s). K(s ) can be nonlinear, especially near the performance limits of the system, and includes a time delay due to the lagged response of the servokves. However, it can be assumed to be a linear function, as shown in Trombetti et al. [2002], allowing the identification of a linear table transfer function G(s ) . Ideally, K(s) would be a zero order function, corresponding to the servovalve system giving direct signal feed through, resulting in the expected second order linear system transfer function G(s) .
The overall goal is to match the shake table's acceleration, x, to the desired acceleration input, xd. However, the actual method of controlling the table is to match the shake table's displacement, x, and hence, the resulting accelerations, to the commanded displacement xd. Displacement control is typically used for large tables as the hydraulic servo-mechanisms used to drive them are typically displace- ment controlled. Displacement tracking also eliminates the drift that can occur with pure acceleration tracking. It should be noted that to exactly obtain the desired acceleration, perfect displacement tracking must occur.
3.1. Empirical tmnsfer fvnction
The shake table system can be simply modelled as a control block, H ( s ) in series with the open loop system transfer fundion G(s), with negative unity feedback, as shown in Fig. 3. The open loop transfer function G(s) is experimentally determined by creating system bode plots using different controllers for H ( s ) . To create a system bode plot (z/zd), the magnitude and phase lag of the response to sinusoidal inputs
Dow
nloa
ded
by [
Uni
vers
ity o
f C
alif
orni
a Sa
nta
Bar
bara
] at
16:
37 1
7 D
ecem
ber
2014

466 J. G. Chase et al.
Fig. 3. Shake table system block diagram.
with amplitudes, fiom f 1 mm to f l20mm at frequencies ranging from 0.1 Hz to 6 Hz in 0.1 Hz increments are recorded. Fkequencies above 6 Hz were not analysed as the magnitude of the table response drops into the noise floor for this input magni- tude with the simple low-gain controllers used. Displacement data for the transfer function was measured directly using capacitive potentiometers with 0.04 mm reso- lution and by integrating acceleration data, with offset correction, from accelerom- eters with 0.029 resolution. The displacement data had only discretisation noise error and is very smooth, the acceleration data was low-pass filtered oaine with a fourth order W filter and corner frequency of 15 Hz. The process of numerically integrating added an additional level of noise reducing filtering.
The first system bode plot, Shown in Fig. 4 for unity proportional feedback ( H ( s ) = I), where dashed lines are experimental data and solid lines are modelled results. This data was used to derive an initial transfer function using first principles
to"
Phase
Fig. 4. Unity proportional feedback system bode plot with H ( s ) = 1.0.
Dow
nloa
ded
by [
Uni
vers
ity o
f C
alif
orni
a Sa
nta
Bar
bara
] at
16:
37 1
7 D
ecem
ber
2014

Nodinar Shake Table Ident i f i rn th and Cuntml 467
from dynamics and basic rules for sketching Bode plots available in any standard text:
x -- - HG G 2.3 2.3 . =-- where G = -. x d 1+HG l + G - s + 2 . 3 ' s (4)
However, although the zero valued pole matches the open loop rigid body motion of the table the system should be second order by Eq. (2) indicating that effective pole-zero cancellation has occurred. More specifically, Eq. (4) deviates from Fig. 4 in the phase plot at higher frequencies, indicating that there may be an additional pole at a higher frequency. In addition, the system shows no significant nonlinear behaviour with H ( s ) = 1 in this frequency range, as shown by the fact that the transfer function is independent of the amplitude of the commanded harmonic mot ions.
To estimate the change in frequency response of the table under load, a 5000 kg mass was fixed to the table, effectively doubling the table mass. As shown in Fig. 4, doubling the mass of the table caused no change in the table's response for a 50 mm amplitude sine wave input. The response of the table is effectively independent of the test mass due to the large effective mass of the system, resulting from the low compressibility of the hydraulic fluid and the large pump system used to drive the table. Note that the addition of this mass did not result in a significant enough drop in oil column natural frequency to impact the results obtained. A larger structural mass might have such an effect despite the size of the system accumulators and command signal low-pass filtering.
To improve the estimate of the transfer function, the proportional and. integral feedback gains, Kp and Ki, were changed to the values currently used for earthquake testing (Kp = 3.7, Ki = 0.6) resulting in a controller defined:
A higher order transfer function can be found by assuming the necessary second order open loop system, G(s), from Eq. (2) resulting in a third order system. The coefficients of the closed loop transfer function were fitted to the recorded data in Fig. 5 using a gradient descent opt imisation routine and quadratic. (least squares) error function, to obtain a linear system transfer function.
From this transfer function and the definition of H ( s ) in Eq. ( 5 ) , the open loop system transfer function, G(s) , is determined:
The open loop transfer function in Eq. (7), matches well with the bode plots in '
both Figs. 4 and 5 , as seen in the dashed line in Fig. 5. However, at higher input amplitude and frequency it still does not match the experimental results due to unmodelled nonlinearities that appear with the larger feedback gains in Eq. (5 ) .
Dow
nloa
ded
by [
Uni
vers
ity o
f C
alif
orni
a Sa
nta
Bar
bara
] at
16:
37 1
7 D
ecem
ber
2014

Phase
Fig. 5. Bode plot with Kp = 3.7, Ki = 0.6.
3.2. System limitations and nonlinearities
The slew rate, or maximum velocity, of hydraulic serv~actuated shake table sys- tern is limited by the flow rate restrictions through the servovalves driving the table. The experimental hydraulic system in this research has two servcwalves in parallel that provide a maximum flow rate of 7.7 L/s (462 Lpm) as specified by the manufacturer. Due to the pressure drop across the valves at the'maxirnum flow rate during working conditions, the maximum flow rate is reduced approximately 15% to 6.5.L/s (390 Lpm) as specified by the manufacturer. The surface area of the piston in the hydraulic ram is -240 cm2 according to the manufacturer. Using these latter two. parameters the maximum slew rate of the table can be estimated with reasonable precision:
. slew rate = flow rate (m3s-') - 6.57/1000 -
0.024 = 0.274 m/s.
surface area (ma)
The resulting velocity saturati0.n that occyrs with high amplitude and frequency sinusoidal reference signals commanding velocities above this limit is seen in the experimental displacement and acceleration response in Fig. 6, where saturation results in a constant velocity, response. The slope of the linear region of the dis- plicement response gives the actual m;udmum slew rate of the table of 0.24m/s, which is approximately 10% lower then the :estimated d u e in Eq. (8) due to:
Dow
nloa
ded
by [
Uni
vers
ity o
f C
alif
orni
a Sa
nta
Bar
bara
] at
16:
37 1
7 D
ecem
ber
2014

Nonlinear Shake Table Identifiation and Contrrol 469
Fig. 6. Table displacement and acceleration response to a 75 mm 2 Hz sine wave, commanding a peak velocity of 0.2425 m/s.
(1) Inaccurate estimation of the pistons surface area, which was estimated by mea- suring the outside ram diameter and the output shaft diameter, (2) frictional effects, or (3) error in the pressure differential across the valves.
Constant velocity during velocity saturation results in a sudden change to zero table acceleration, as seen in Fig. 6. After velocity saturation ceases, the shake table velocity changes abruptly, resulting in large acceleration spikes. The resulting acceleration profile that occurs with velocity saturation is characterised by a period of zero acceleration followed by an abrupt acceleration spikes, as shown in Fig. 6. Simply increasing the feedback control gains to obtain better tracking increases the acceleration spikes after velocity saturation ceases, as they respond even more strongly to the difference in commanded and actual displacement and velocity.
The nonlinear effect of velocity saturation can also be seen on the bode plot in Fig. 5. Instead of the bode plot for all of the sine wave reference signals being the same, the higher amplitude signals that command excessive velocity attenuate non- linearly at lower frequency. Hence, when velocity saturation occurs the frequency response plot reports it as greater attenuation because of the table's inability to produce greater amplitude.
The shake table displacement response in Fig. 6 can be approximated as a saw tooth wave, which means the waves amplitude is inversely proportional to the frequency of the wave for a constant slope. Velocity saturation does not occur for low amplitude or low frequency inputs because the required velocity to track these signals is still below the saturation point. Similarly, with low gain feedback, ( H ( s ) = 1) in Fig. 4, velocity saturation does not occur, as the table response never reaches the saturation velocity.
4: System Modelling
The system model identified consists of the open loop transfer function of Eq. (7) in series with the velocity limiter and a noise source, as shown in Fig. 7. The velocity
Dow
nloa
ded
by [
Uni
vers
ity o
f C
alif
orni
a Sa
nta
Bar
bara
] at
16:
37 1
7 D
ecem
ber
2014

470 J. G. Chase et ai.
s --d
. * . .
Fig. 7. Open loop system model.
limiter model is composed of a differentiator, which converts the displacement signal into velocity, a limiter that restricts the velocity to the maximum rate of 0.242 m s - I
and an integrator to convert the velocity back into displacement. The noise signal generated to simulate the noise source in Fig. 7 is defined as a series of zero mean sine waves and saw tooth waves with fiequencies and amplitudes that match the noise induced on sensor lines in the shake table laboratory to ensure the model accurately simulates the lab environment. The closed loop system consists of the open loop system model in a unity negative feedback 'loop with the system controller, H ( s ) , as shown in Fig. 3.
To test this system model the shake table response was determined for a vari- ety of earthquake reference signals and several sets of feedback gains. These pre- dictions were then verified by running the shake table system through the same tests. Figures 8 and 9 show the high correlation for both acceleration and dis- placement between the predicted model response (dashed line) and experimental data (solid line) for the near-field Kobe earthquake during the first 5.5 seconds of strong motion. Acceleration was measured using accelerometers with a 0.02 g noise floor. As a result, accelerations below this. value are essentially random and this
Command Displacement 0.04
0.m
1
E V
z 0 E !! - my2.m s
0.04 Achral Respume (FIIWred)
Predl- Model Response (Filtered)
1 .S 2 2.5 3 9.5 4 4.5 Ume (sec)
Fig. 8. Displacement response for the Kobe earthquake (Kp = 3.7, Ki = 0.6).
Dow
nloa
ded
by [
Uni
vers
ity o
f C
alif
orni
a Sa
nta
Bar
bara
] at
16:
37 1
7 D
ecem
ber
2014

Nudinear Shake Table Identaficatton and Contml 471
Command Acceleration
Predicted Model Response (Filtered)
Actual Response (Filterad)
Fig. 9. Acceleration response br the Kobe earthquake (Kp = 3.7, Ki = 0.6).
aspect is not modelled. This effect is most clearly seen in Fig. 9 around 3.6 and 4.0 seconds. The large difference between the reference displacement signal and the displacement response is due to the combined effects of velocity saturation and poor tracking control with the control gains used. Note that the full response is
Gain
m
-1 5 ------.----- ..... ---
Fig. 10. Model (solid lines) compared to experimental (dotted. Lines).
Dow
nloa
ded
by [
Uni
vers
ity o
f C
alif
orni
a Sa
nta
Bar
bara
] at
16:
37 1
7 D
ecem
ber
2014

similar, but not shown, as the results seen in Figs. 8 and 9 are unclear viewing the full response. The high level of correlation between the model and experimental data exceeds that of prior works and illustrates the effectiveness of the frequency response identification methods presented.
The system model was also verified by comparing the model bode plot to the bode plot of the physical system, as shown in Fig. 10. The phase lag in the model and the shake table are nearly identical. The velocity saturation effect is captured adequately at the onset, shown from the 50 mm amplitude response, and is suitably accurate at higher amplitudes. Severe velocity saturation effects differ between the model and the shake table, probably due to unmodelled vaive dynamics.
5. System Control
5.1. Control problem
The system is easily controlled except when velocity saturation occurs. High pro- portional displacement feedback gains enable the table to accurately track during the low velocity parts of the earthquake record. However, the strong proportional feedback causes high peak accelerations when velocity saturation occurs during the strong motion part of the earthquake record. The interaction of velocity saturation and control gains is shown schematically id Fig. 11 where the trade off is between
Time (sea
Fig. 11. Control gain trade off of velocity saturation versus poor tracking.
Dow
nloa
ded
by [
Uni
vers
ity o
f C
alif
orni
a Sa
nta
Bar
bara
] at
16:
37 1
7 D
ecem
ber
2014

high gains with accurate traclung over most of the earthquake record, and low feed- back gains that do not cause velocity saturation and acceleration spikes, but track poorly, during the strong motion portions. This trade off resuits in extremely poor performance for near field seismic events characterised by a few laxge velocity and acceleration spikes followed by much lower magnitude ground motions.
The experimental table controller currently employs low integral and propor- tional displacement feedback gains (Kp = 3.7, Ki = 0.6). By keeping the control gains low (Kp < 5 and Ki < 1) there is much less velocity saturation for strong motions as in the near field Kobe earthquake, however the tracking is poor as seen in Figs. 8 and 9.
5 2 . Accelemtion and velocity feedback
Acceleration and velocity feedback loops can be used to improve the system response. Acceleration control is an intuitively simple idea. The most important table output is the acceleration profile, so this controller trades off precise displace- ment tracking to capture the more important acceleration profile. By increasing the gains on an additional acceleration PI control input combined with the displace- ment feedback loop, as shown in Fig. 12, the table should track the acceleration profile more accurately. Note that as the table is driven by displacement commands, the acceleration feedback command signal is integrated twice to provide a displace- ment position command. To prevent table drift, the displacement feedback loop keeps the table approximately centred to prevent accumulated errors in accelera- tion tracking moving the table to its physical displacement limits. This approach is similar to the integrated centring control used for inertial actuators [Chase and Yim, 19991.
Tracking velocity can lead to improvements in the displacement and acceleration tracking, but requires the use of a low noise Boor, high-resolution velocity sensor. The concept behind an additional velocity feedback loop is that tracking velocity
Fig. 12. Combined acceleration, velocity and displacement feedback controller.
Dow
nloa
ded
by [
Uni
vers
ity o
f C
alif
orni
a Sa
nta
Bar
bara
] at
16:
37 1
7 D
ecem
ber
2014

will provide a trade oE of acceleration and dqlacement tracking while directly being able to directly account for velocity saturation. Figure 12 also includes this feedback bop.
In either case, the acceleration and velocity feedback gains require additional control feedback loops that are not standard on test equipment such as the Test- Star controller. The control gains are designed using the verified mod& developed. However, neither approach leads to a complete solution to the compromise between tracking for near-field ground motions, and nonlinear velocity saturation &d the resulting acceleration spikes.
5.3. Record modification
Once the table dynamics are. completely understood, i t is clear that any control system cannot give perfect tracking due to the velocity limit being exceeded by the peak velocities of certain near- field earthquake records. Designing the control system therefore becomes a question of trading off acceleration duration and ampli- tude, to obtain the best fit to the desired acceleration response. A third approach would modify the acceleration record to obtain a matching peak acceleration or spectrum such that velocity saturation is avoided.
Assuming zero velocity, v = 0 at time t = 0, then the area under the generic acceleration (a) curve in Fig. 13 is defined:
where t' is the time at some point after t = 0. Hence, the area under the acceleration curve is equal to the velocity at time t'. Velocity cannot, in thii case, physically exceed 0 . 2 4 2 1 ~ ~ - l , limiting the area A to A', as shown in Fig. 13.
The area A' represents the physical limits for the magnitude and duration of the acceleration profile that can be achieved by the shake table. Selecting an appropriate
Fig. 13. Modified maximum acceleration profiles.
Dow
nloa
ded
by [
Uni
vers
ity o
f C
alif
orni
a Sa
nta
Bar
bara
] at
16:
37 1
7 D
ecem
ber
2014

Nonlinear Shake Table Identificution and Contml 475
Fig. 14. Block diagram for record modification in real time.
acceleration profile for area A' < A to avoid saturation leads to either a low peak magnitude acceleration profile or a profile with the same peak acceleration but a reduced duration. By reducing the peak amplitude of an earthquake, the peak force applied to the structure is also reduced, which is arguably a worse compromise for earthquake testing. However, the record can be modified according to whatever transform might be most desirable for the testing being done.
Creating profiles with the same peak amplitude but reduced duration is straight- forward. Displacement information for a given earthquake (x) is differentiated into velocity (dz ld t ) , which is then limited to the maximum allowable velocity magni- tude. The new velocity profile is then integrated back into modified displacement input data (9). For the case where the maximum velocity is 0.242 m/sec, this trans- formation is defined:
I" if 1 3 1 5 0.242
i. / (z) dt , where f (z) = 0.242 if $ > 0.242 . (10)
This method can be implemented in real time, as shown by the block diagram in . Fig. 14. However, there is no particular need as the reference input can be modified of3ine before a test. Once the system input is suitable, the table can be made to track with PI displacement control, but with higher feedback gains to obtain much better tracking.
5.4. Improved controller simulation and performance evaluation
Several performance rnetrics were used to evaluate the effectiveness of the controller. Ei is the relative error of the shifted model acceleration response compared to reference acceleration:
where ii is the reference unmodified, acceleration vector, and 3 is the time shifted shake table model acceleration response, which minimises the La norm 11 a - 311, eliminating the impact of table lag. Eliminating table lag from the error measure- ments allows a better representation of the quality of shake table response.
Dow
nloa
ded
by [
Uni
vers
ity o
f C
alif
orni
a Sa
nta
Bar
bara
] at
16:
37 1
7 D
ecem
ber
2014

The metric Ed is the relative error of the time shifted shake table model out- put displacement response vector d, compared to the unmodified input reference displacement vector denoted (5, as measured using Lz norms similar to Eq. (11):
The maximum acceleration in g, contained in the acceleration reference vector is dehed as M,', and the peak model response acceleration is defined as M:. Com- paring ML and Mt indicates the quality of the controlled response, as well as the existence of acceleration spikes caused by velocity saturation.
Table 1 contains these metrics for the Taft, El Centro and Kobe earthquakes. The earthquakes are simulated on the table model using eight difTerent table con- trollers. The "Current" controller is the currently used shake table controller, using displacement feedback with low PI feedback gains. The "Strong Disp. Feedback" controller uses displacement feedback, but with increased PI gains. The "Acc and Disp" controller uses combined ameleration and displacement feedback loops to con- trol the shake table position and acceleration. "Acc and Disp 2" is the same as "Acc and Disp" , but with increased integral control for the acceleration. feedback loop (1 versus 0). The "Velo and Disp" controller uses combined velocity and displace- ment feedback loops to control the shake table position and velocity. The "Velo Disp Acc" controller uses combined velocity, displacement and acceleration feed- back loops. The "Modified Record" controller modifies the earthquake record using Eq. (lo), and uses displacement feedback and a strong PI controller to control the table position. Gain values are shown in the table for each controller.
The best performance based on the specified performance metrics, is the "mod- ified record" controller. It has the lowest shifted relative acceleration error, E:. The acceleration feedback methods provided much improved control, by reducing the acceleration spikes, as indicated by the maximum accelerations, and by giving closer tracking. Both strong displacement feedback and velocity and displacement feedback controllers created acceleration spikes in the response of the shake table, in some cases greater then twice the commanded maximum acceleration.
The near-field Kobe earthquake is the most effective record to consider when evaluating the impact of different controllers for accurately reproducing near-field ground motions. The Kobe earthquake contains a strong motion section in the record from 1 to 5 seconds, during which velocity saturation occurs for any high gain controller that provides good tracking on other inputs. Fkom 5 seconds to 16 seconds there is a weak motion section in the record in which the velocity of the table never reaches the saturation value of the table.
Figures 15 to 19 show the measured shake table response to the Kobe earthquake input for. some of these control methods. The original controller using low gain feedback, shown in Fig. 15, tracks low frequency acceleration at about half the desired amplitude and missed all of the high frequency acceleration components.
Dow
nloa
ded
by [
Uni
vers
ity o
f C
alif
orni
a Sa
nta
Bar
bara
] at
16:
37 1
7 D
ecem
ber
2014

Nonlinear Shake T d l e Identification and Contml 477
Dow
nloa
ded
by [
Uni
vers
ity o
f C
alif
orni
a Sa
nta
Bar
bara
] at
16:
37 1
7 D
ecem
ber
2014
4.8 I I I I I I I 1 I
1 2 . 3 4 5 6 7 8 9 10 Time (sec)
Fig. 15. Measured Kobe earthquake acceleration response with the current control gains.
I r I I d
Displacement Record 0.04 - Displacement Response - 0.02 -
iz V
c.
4.E
-0.m b I I I I I 1 1 1 I
t 2 3 4 5 6 7 0 9 1 O time (sec)
Fig.. 16. Measured Kobe earthquake displacement response with the current control gains.
0.5
h M) 0 w
C 0 .- - fi 4.5 - WJ
t -1
Fig. 17. gains.
Measured Kobe Earthquake acceleration response with strong displacement feedback
Dow
nloa
ded
by [
Uni
vers
ity o
f C
alif
orni
a Sa
nta
Bar
bara
] at
16:
37 1
7 D
ecem
ber
2014

Ndaneclr Shake Tdle Identification and Control 479
1 I I I L I . I t I
1 2 3 4 5 6 7 0 9 10 Time (ssc)
Fig. 18. Memured Knhe earthquake acceleration response with acceleration and displacement feed back.
Acceleration Record
4.8 fl 1 2 3 4 5 6 7 8 9 10
Time (see)
Fig. 19. Measured Kobe earthquake acceIeration response using record modification and strong displacement feedback.
While this controller does avoid saturation spikes, the controller is inadequate for responsive tracking of reference signals.
Acceleration and Displacement feedback gives considerably improved perfor- mance over the current control situation. This controller avoids significant satura- tion spikes, as can be seen from M,' and M: in Table 1. The measured response using this controller does not track the full amplitude of the reference signal, shown in Fig. 18. The lack of exact tracking could be partly due to the large amount of sig- nal lag. The slightly out of phase signals could deliver conflicting control responses, undermining the effectiveness of the controller. A system with less lag shows much better results in simulation and highlights the interaction between control system hardware and the type of control used.
Velocity feedback caused the table system to react more strongly to velocity saturation. As shown in Table 1, all trials containing velocity feedback have lsrge maximum acceleration values, Mf,, compared to the desired record acceleration, M:.
Dow
nloa
ded
by [
Uni
vers
ity o
f C
alif
orni
a Sa
nta
Bar
bara
] at
16:
37 1
7 D
ecem
ber
2014
480 J. G. Chase et aL
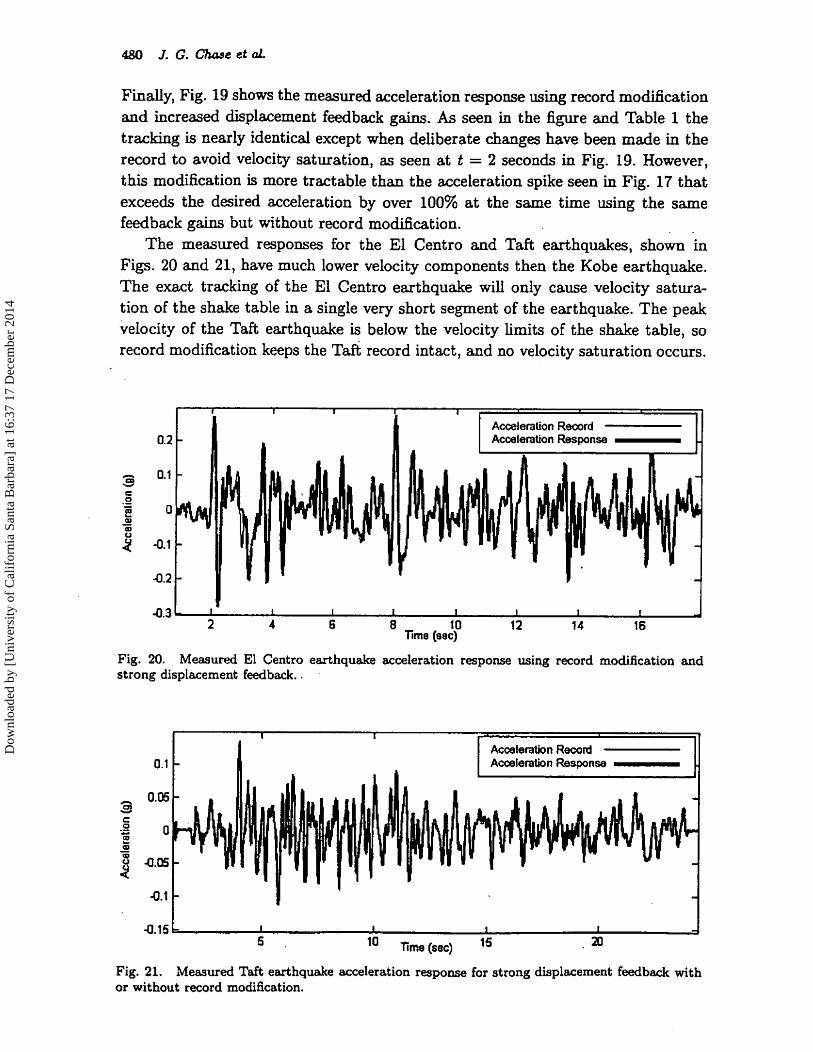
Finally* Fig. 19 shows the measured acceleration response using record modification and increased displacement feedback gains. As seen in the figure and Table 1 the tracking is nearly identical except when deliberate changes have been made in the record to avoid velocity saturation, as seen at t = 2 seconds in Fig. 19. However, this modification is more tractable than the acceleration spike seen in Fig. 17 that exceeds the desired acceleration by over 100% at the same time using the same feedback gains but without record modification. . .
The measured responses for the El Centro and Taft earthquakes, shown in Figs. 20 and 21, have much lower velocity components then the Kobe earthquake. The exact tracking of the El Centro earthquake will only cause velocity satura- tion of the shake table in a single very short segment of the earthquake. The peak velocity of the Taft earthquake is below the velocity limits of the shake table, so record modification keeps the Taft record intact, and no velocity saturation occurs.
0 . 3 1 I L I I I I 1 I 1 2 4 6 8 10 12 14 16
Time (see)
20. Measured El Centro earthquake acceleration response using record modification and - strong displacement feedback. .
Fig. 21. Measured Taft earthquake acceleration response for strong displacement feedback with or without record modification.
Dow
nloa
ded
by [
Uni
vers
ity o
f C
alif
orni
a Sa
nta
Bar
bara
] at
16:
37 1
7 D
ecem
ber
2014

Nudinar Shake Table Identification and Contml 481
Therefore, for the Taft record, using just strong displacement feedback, or in combi- nation with record modification, yields the same response. Hence, many commonly used far-field, vibratory ground motion records require little or no alteration of the record or controller. It is the large near field events of great interest in the structural engineering arena in recent years that require such attention.
Record modification is effectively an awareness system that identifies extreme reference inputs that are outside of the 'shake table's operational parameters and modifies the reference input to obtain near optimal control in these circumstances, where the system limits would be otherwise exceeded. Record Modification, in com- bination with strong displacement feedback, is the lowest cost alternative to imple- menting a new control system on the current shake table system, and gives the highest performance of any controller tested. All of the error in tracking occurs during parts of the record where velocity saturation would occur. This error is only significant during very long and large velocity periods, as seen in the Kobe earthquake shown in Fig. 18. This method delivers very effective performance with tracking errors less than 1-5% in an Lz sense for large near field effects as shown in Table 1.
It should be noted that a second, obviousiy optimal, solution would be to upgrade the servovalves to a system with greater flow capacity. Worldwide shake table systems are being upgraded, at significant cost, to account for these near-field events, in part for this reason. However, as research progresses these systems are almost inevitably pushed to their capacity and limits. Hence, upgrading the valves, while both very desirable and expensive, merely raises the bar. The record modi- fication approach is therefore a low-cost, very effective solution when these limits are reached regardless of the state of the equipment in question.
6, Conclusions
Improved system identification and control methods are presented for structural shake tables used in seismic structural testing. The new methods enable the deter- -
mination of the fundamental trade of& in designing control gains to accurately reproduce near-field seismic ground motions that are characterised by large accelera- tion pulses. These near- field events cause many typical hydraulically servo-actuated shake table systems diaculty in producing accurate acceleration profiles because they can push the system towards, or past, their performance capability.
For the University of Canterbury shake table facility, a typical hydraulic servo- actuated system, it is found that the cause of poor near-field acceleration tracking is velocity saturation of the hydraulic servo-valves. Hence, improved control was nec- essary as the current shake table system provided poor reference signal tracking, and is not capable of providing adequate control in the advent of velocity satura- tion. Velocity saturation occurs as the shake table system has a maximum possible velocity o f f O.242m/s, due to the flow rate limitations through the servovalve con- trolling the actuating hydraulic ram.
Dow
nloa
ded
by [
Uni
vers
ity o
f C
alif
orni
a Sa
nta
Bar
bara
] at
16:
37 1
7 D
ecem
ber
2014

482 3. G. Chase et al.
To design a suitable controller, an accurate system model was identified using frequency response methods based on inputs in the range of operating motions rather than low magnitude white noise tests. This approach is different horn white noise approaches to system identification and provided an extended understand- ing of the dynamics for these large shake table systems. It also clearly illustrated the fundamental nonhearities as the system approached its performance limits. The system model was verified using the near-field Kobe earthquake record, where the model showed almost perfect tracking of the experimental response.
Improved control methods were designed and optimised on the system model. Combined acceleration and displacement feedback loops provided more accurate feedback control and were capable of controlling the acceleration spikes seen dur- ing velocity saturation. Record modification, where the reference signal is modified to conform to the systems velocity limit, was developed to eliminate the need for more complex feedback codigurat ions that are not typically supported by standard equipment. This approach also avoids the need for compromising on displacement and/or acceleration tracking for near-field events that command significant veloc- ities. Almost perfect reference displacement and acceleration signal tracking was achieved, and the controller is able to deal with reference signals with velocity components greater then the shake table limitations. Record modification can be implemented previous to entering the signal into the shake table system, so the current controller hardware can be used by increasing the feedback gains.
References
Chase, J. G. and Yim, M. H. [I9991 "Integrated centering control for inertidly actuated axtive systems," Control Engineering Practice 7(9), 107S1084.
Conte, ' J. and Trombetti, T. [2000] "Linear dynamic modelling of a uni-axial servo- hydraulic shaking table sytem," Earthquuke Engng. Stmct. Dyn. 29, 13751404.
Kuehn, J., Epp, D. and Patten, D. [I9991 "High-fidelity control of a seismic shake table," Earthquake Engng. Stmct. Dyn. 28, 1235-1254.
Kusner, D. A., Rood, J. D. and Burton, G. W. [I9921 "Signal reproduction fidelity of servhydraulic testing equipment," Pmc. 10th World Conference on Earthquake Engi- neering, Rotterdam, pp. 2683-2688. D
ownl
oade
d by
[U
nive
rsity
of
Cal
ifor
nia
Sant
a B
arba
ra]
at 1
6:37
17
Dec
embe
r 20
14