Embed Size (px)
Citation preview

Nonlinear Optical Devices
I. Cristiani, V. Degiorgio, P. Minzioni, F. Bragheri, J. Parravicini, A. Trita
University of Pavia, Italy

Outline
• Cascaded Wavelength Conversion• Non-photorefractive crystals• Compensation of nonlinearity and dispersion in an optical communication link
• Silicon Photonics• Si-Ge waveguides
• Other activities that I will not discuss• Conical waves (talk by Francesca)• Writing by fs pulses (Daniela)• Nonlinear propagation in microstructured fibers (L. Tartara)• Tunable picosecond pulses (J. Yu, L. Tartara)• Biophotonics: a new optical tweezer (I. Cristiani, P. Minzioni)

Wavelength Conversion
Input fiber Output fiber
λ1 λ2
Wavelengthconverter
•Cascade of two second order effects
χ(2):χ(2)
Low conversion regime
( ) ( ) 22
p
3casc
Lχ
λ∝χ
2ωp
λsh
Cascading
λ λp
ωp
ωp
ωc
ωs
λcλs

Wavelength Conversion in PPLN Waveguides: Applications to Optical
Communications
• Wavelength shifting in WDM systems
• All-optical switching
• Noting that cascaded wavelength conversion is equivalent to an optical phase conjugation process, by inserting the wavelength converter in an optical communication link it is possible to compensate both nonlinearity and dispersion.

Photorefraction
• Photorefractive damage: “permanent” change of refractive indices under illumination with visible or near-infrared light
• Effects: modification of the phase-matching condition, beam distortion
• All the experiments using a CW pump are performed at a
temperature higher than 100°C: strong deterrent for applications
Cascading
ωp ωc
ωs 2ωpωp
λp λλcλs λsh
λp = 1550 nm λsh = 775 nm

Methods to reduce photorefractionKnown solutions :
•Stoichiometric crystals ([Nb]/([Nb]+[Li])=50 mol%)Reduced number of Lithium vacancies
•Magnesium-doped crystals (Mg2+ @ 5.5 mol%)Increased photoconductivity
New solution proposed by our group :
•Hafnium-doped crystals (Hf4+):Required dopant concentration is lower than that for MgCreation of periodically-poled structures during growth*
A set of congruent Lithium Niobate crystals with increasing concentration of HfO2 was grown by the Czochralski method at the Institute for Physical Research, National Academy of Sciences of Armenia

0 2 4 6 80.0
5.0x10⁻⁵
1.0x10⁻⁴
1.5x10⁻⁴
2.0x10⁻⁴
δΔn
Hf Concentration [mol %]
δΔn as a function of Hf concentration
Threshold value is around 4mol%
Experimental results
L. Razzari et al., Appl. Phys. Lett. 86, 131914 (2005)

Photorefractivity vs pump intensity
0 100 200 300 400 500 600 7000.0
1.0x10⁻⁴
2.0x10⁻⁴
3.0x10⁻⁴
4.0x10⁻⁴
5.0x10⁻⁴
B
irefr
inge
nce
chan
ge (δ
Δn)
Pump Intensity [W/cm2]
LN undopedLN:Hf 3mol%LN:Hf 4mol%LN:Hf 5mol%

Properties of Hf-doped LN
• Nonlinear coefficients
• Electrical poling
• Crystal composition
• Crystal homogeneity
• Electro-optical coefficients (D. Grando)

NonlinearityNonlinearity Cancellation in an Embedded Cancellation in an Embedded Link with Asymmetrical Power Profiles: Link with Asymmetrical Power Profiles: Experimental Demonstration of Experimental Demonstration of aa New New
Technique based on Optical Phase Technique based on Optical Phase ConjugationConjugation
P. Minzioni1, I. Cristiani1, V. Degiorgio1, L. Marazzi2, M. Martinelli2, C. Langrock3, M.M. Fejer3
1- University of Pavia, It 2- CoreCom Milan 3- University of Stanford, CA

IndexIndex
• Theory: compensation of the nonlinear effects in High
Bit-rate Systems through the Mid-Nonlinearity-Temporal-
Inversion (MNTI) technique
• Experiment: demonstration of Nonlinearity
Compensation in a 600-km-long embedded system

MNTIMNTI
Nonlinearity-compensation through MSSI has been demonstrated only in specifically designed links, with customized dispersion maps and amplification
schemes
Every system proposed in literature and experimentally tested yielding to nonlinearity compensation satisfies the MNTI symmetry-constraint
The graphical MNTI approach allows easily identifying simple and low cost solutions viable also for already installed communication links
Theory: Minzioni, Schiffini, Optics Express Vol. 13, 8460-8468 (2005)Experiment: Minzioni et al., IEEE Photon. Technol. Lett. Vol. 18, 995-997 (2006)

TX
RX
Experimental setupExperimental setup
1°Span 2°Span
6°Span
3°Span
5°Span 4°Span
SMF
CO
MM
ON
SYS
TEM
CO
MM
ON
SYS
TEM
0.23 dB km-1+16.1 ps nm-1 km-178 μm2G.652SMFDisp. Comp
0.22 dB km-1-2.9ps nm-1 km-155 μm2G.655NZDSFSpan
AttenuationDispersionAeffITUNameParameter
231 bitPRBS
45 psTFWHM
RZModulation
10Gb/sBit-Rate
ValueParameter
Double stage EDFATotal length: 600 kmEach span length ~ 100 km

1.00E-11
1.00E-10
1.00E-09
1.00E-08
1.00E-07
1.00E-06
1.00E-05
1.00E-04
1.00E-03
-14 -12 -10 -8 -6 -4 -2 0 2
Input Power [dBm]
BER
BTB W/O OPC BTB W OPC
Experimental Results Experimental Results --11
NO CONVERSION PENALTYNO CONVERSION PENALTY

1.00E-11
1.00E-10
1.00E-09
1.00E-08
1.00E-07
1.00E-06
1.00E-05
1.00E-04
1.00E-03
-14 -12 -10 -8 -6 -4 -2 0 2
Input Power [dBm]
BER
BTB W/O OPC
BTB W OPC
600 Km Standard (MSSI) [@+12dBm]
600 Km Optimized (MNTI) [@+12dBm]
Experimental Results Experimental Results --11
Improvement Improvement ≈≈ 1.3 dB1.3 dB

1.00E-11
1.00E-10
1.00E-09
1.00E-08
1.00E-07
1.00E-06
1.00E-05
1.00E-04
1.00E-03
-14 -12 -10 -8 -6 -4 -2 0 2
Input Power [dBm]
BER
BTB W/O OPC
BTB W OPC
600 Km Standard (MSSI) [@+12dBm]
600 Km Optimized (MNTI) [@+12dBm]
600 Km Standard (MSSI) [@+13dBm]
600 Km Optimized (MNTI) [@+13dBm]
Experimental Results Experimental Results --11
Improvement > 7 dB @BER = 1 10Improvement > 7 dB @BER = 1 10--77

Silicon Photonics
Optical circuit: Set of optical and electronic functions available as monolithically integrated blocks upon a single substrate.
Active Research Groups: Intel, UCLA, Cornell University

Active devicesbased on nonlinear effects
Raman amplification: light amplification
and lasing action in Silicon
Broadband amplification: Four Wave Mixing andFrequency conversion
• χ(2) ≈ 0• χ(3) high:
– Kerr effect– Raman effect– Two Photon Absorption– Free Carrier Absorption
Comparison with fiber:
– Kerr: 100 times higher– Raman: 1,000-10,000 times higher
Silicon Photonics

Raman amplification: light amplification
and lasing action in Silicon
Vibrational levelGround level
Virtual level
hνphνs
Stokes wave
Raman pump
Signal
Intel
Silicon Photonics

SiSiGeSi
Phase 1: planar waveguide
SiSiGeSi
Phase 3: applications
SiSiGeSi RIE
Phase 2: channel waveguide
Silicon-Germanium (SiGe): why?
• tailoring of waveguide properties (by choosing Ge content)
• symmetric channel waveguide structure
• low propagation losses
• high nonlinearity
Silicon Photonics

Silicon sample
Camera
Silicon sample
CameraObjective
Cylindricallens
Laser
Measurement of the output spatial profile
0 100 200 300 40040
50
60
70
80
90
100
110
outp
ut p
ower
(a.u
.)
waveguide output section (μm)
Intensity profile Intensity spatial distribution
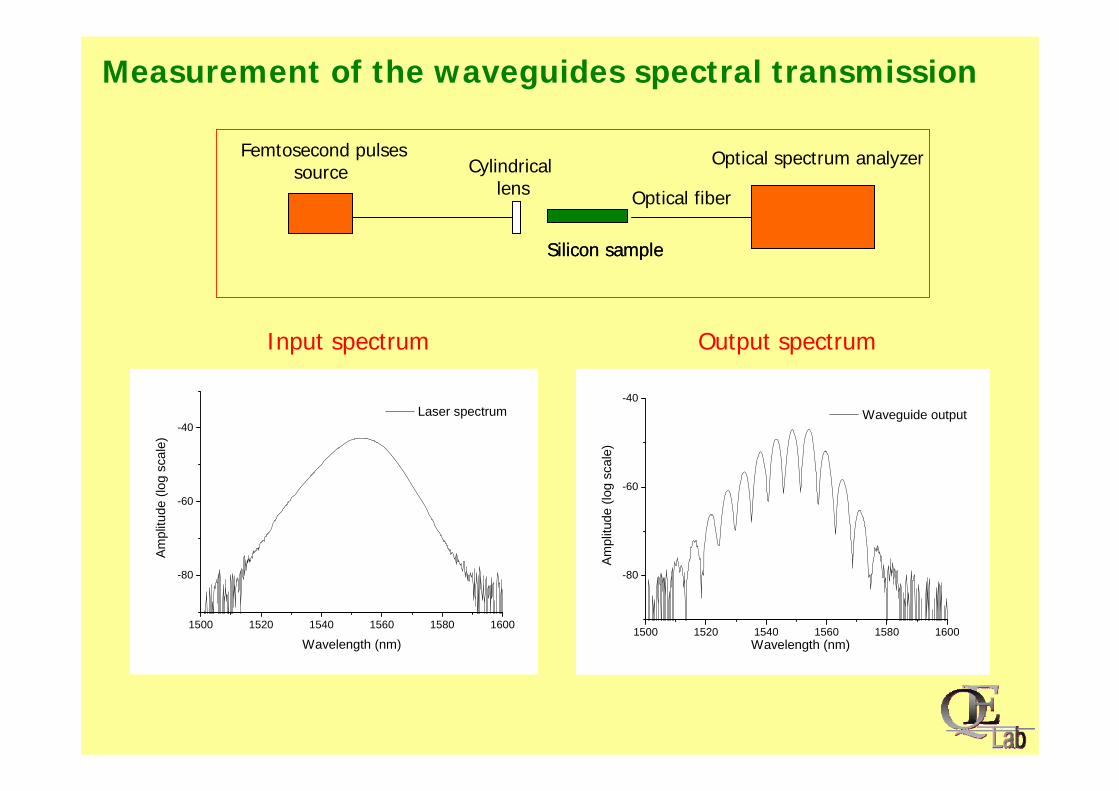
Measurement of the waveguides spectral transmission
Silicon sampleSilicon sample
Optical spectrum analyzer
Optical fiber
Cylindricallens
Femtosecond pulsessource
1500 1520 1540 1560 1580 1600
-80
-60
-40
Am
plitu
de (l
og s
cale
)
Wavelength (nm)
Laser spectrum
1500 1520 1540 1560 1580 1600
-80
-60
-40 Waveguide output
Am
plitu
de (l
og s
cale
)
Wavelength (nm)
Input spectrum Output spectrum