Embed Size (px)
Citation preview

NONLINEAR FINITE ELEMENT ANALYSIS OF
BEAM-COLUMN SUBASSEMBLIES
by
Gulsah Sagbas
A Thesis submitted in conformity with the requirements
for the Degree of Master of Applied Science
Graduate Department of Civil Engineering
University of Toronto
© Copyright by Gulsah Sagbas 2007

2
CHAPTER 1
Introduction
The accurate seismic assessment of beam-column subassemblies has been an
important objective for many research groups over the years. Experimental and
analytical research on different aspects of these members by various research groups has
provided numerous design and assessment techniques with little consensus amongst
these research groups. The need to understand the seismic performance of non-
seismically designed beam-column subassemblies is another aspect of this challenging
problem. The overall failure mechanisms under gravity and seismic loads have been
identified, but the relative contribution of each member to these failure mechanisms is
still being discussed. The most challenging aspect of reinforced concrete structures is the
combination of two different materials to resist applied loading conditions effectively
and efficiently. The difficulty of reinforced concrete design is best described by Paulay
(1994) as a “… skilful combination of two materials; one inherently brittle, the other
very ductile”.
While research on the structural behaviour of reinforced concrete structures is
continuing, the connection details for moment-resisting framed buildings are known to
be crucial for the survival of the building. As observed by earthquake reconnaissance
teams during site visits of disaster areas, the local failures of these members most likely
lead to global failure mechanisms. In spite of the ductility requirements of the seismic
codes around the world, these structures fail in brittle failure mechanisms. Insufficient
reinforcement anchorage lengths, unconfined member connections against counteracting
forces, and material quality deficiencies of the concrete and of the reinforcement are
mainly the reasons for these failures.
There is an ongoing effort in modelling reinforced concrete structures, either to
assess their seismic performance or to understand the effects of new rehabilitation
techniques applied to upgrade their response. Advanced and more applicable structural

3
modelling techniques are needed for the seismic assessment of existing buildings, and
for the development of new rehabilitation techniques.
The research in this study is focused on the modelling of beam-column
subassemblies, a crucial connection mechanism for load transfer in moment-resisting
framed structures. Through the years, various behaviour models to explain the load
transfer mechanisms within the joint panel region have been proposed and adopted by
reinforced concrete design codes around the world. The analytical studies were mostly
limited to specific types or failure mechanisms of beam-column subassemblies. Since
these members are subject to various failure mechanisms depending on material quality,
reinforcement detailing and connection types; engineers tended to focus on one aspect of
the problem to simplify the analysis procedure. However, the flexural and shear
deformations within the joint contribute to different failure mechanisms, and this makes
it difficult to develop a global model. Although, there are many models suggested in
previous studies, there is no scientific consensus on a model or a modelling tool that is
applicable to all conditions of beam-column subassemblies. The models that are
available to designers involve tedious data input and output procedures, and are mostly
dependent on empirical parameters or on the failure mechanism of the specimen
analyzed.
In this study, a nonlinear finite element program, VecTor2, is used for modelling
beam-column subassemblies. The beam-column subassemblies modelled here are
chosen to represent various challenging aspects of the problem, such as:
• Beam longitudinal reinforcement comprised of smooth (plain round)
reinforcement rather than deformed bars,
• Non-seismically designed beam-column subassemblies with unconfined joint
panels,
• Different failure mechanisms,
• Different types of connections; exterior and interior beam-column subassemblies

4
A diverse range of specimens was selected to investigate whether VecTor2
provides a reliable and applicable tool for modelling beam-column subassemblies.
The details of the nonlinear finite element models for beam-column
subassemblies will be discussed. A new rehabilitation technique for non-seismically
designed beam-column subassemblies, proposed by Pampanin and Christopoulos (2003)
and tested at the University of Canterbury, is also investigated numerically. The
analytical results for all specimens are presented and discussed in comparison to
experimental results in this thesis.
NONLINEAR FINITE ELEMENT PROGRAM, VecTor2
The nonlinear finite element modelling of beam-column subassemblies are
carried out using VecTor2, a two-dimensional nonlinear finite element analysis program
for reinforced concrete (NLFEARC) structures developed at the University of Toronto
over the past 20 years. VecTor2 is based on the Modified Compression Field Theory
(MCFT) by Vecchio and Collins (1986), and the Disturbed Stress Field Model (DSFM)
by Vecchio (2000).
The use of VecTor2 for the numerical analysis of two-dimensional reinforced
concrete membrane structures is facilitated by the pre-processor FormWorks (Wong,
2002). Augustus, the post-processor for VecTor2, (©Bentz, 1996-2007), is used to
observe the analysis results. VecTor2 is singled out as a user-friendly among other finite
element programs with the addition of these processors.
VecTor2 is capable of modelling two-dimensional reinforced concrete membrane
structures under monotonic, cyclic and reversed cyclic loading conditions. The
behavioural models for concrete, and for reinforcing or prestressed steel, are based on
models that are widely accepted by the scientific community. The post-cracking
influences on concrete, such as compression softening, tension stiffening, hysteretic
effects, dowel action of steel reinforcement, and bond mechanisms representing the

5
interaction between concrete and reinforcement, are some of the behaviour mechanisms
that are considered by VecTor2.
Most of the finite element modelling tools available for nonlinear analysis of
reinforced concrete structures require definition of the failure mechanism or are
dependent on empirical values obtained through similar experimental tests. VecTor2, on
the contrary, performs an analysis using only the sectional, material and loading system
details of the specimens necessary to define the structure. Additional information on
VecTor2 is given in the last section of Chapter 2, and further information about the
program is given in “VecTor2 & FormWorks User’s Manual” by Wong and Vecchio
(2002).
OBJECTIVE OF RESEARCH
The main focus of this study was to understand the modelling capabilities of
VecTor2 under reversed cyclic loading conditions for beam-column subassemblies.
Therefore, a variety in the types of connections, material properties and connection
details examined was crucial for confirming the applicability of the program or
identifying its limitations. The specimens consisted of exterior and interior, and
seismically and non-seismically designed, beam-column subassemblies that were
analyzed under simulated seismic loading conditions similar to those followed during
the experimental tests. The modelling efforts were utilized using the default behavioural
or constitutive model options in order to prove that the program successfully captures
the necessary response parameters without any modifications to the structure details.
The study of the bond material behaviour at the interface between reinforcement
and concrete was another focus of this research. Specimens with deformed and smooth
(plain round) reinforcement were specifically selected to assess the applicability of the
tools for modelling bond behaviour in reinforced concrete structures. The bond elements
and bond material behaviour models adopted by VecTor2 have been verified for
monotonic loading conditions, but needed to be assessed for cases where reversed cyclic
loading is applied. The details of modelling smooth reinforcement with VecTor2, and

6
improvements made to the program for future modelling purposes, are also described in
Chapter 2.
VecTor2, compared to other alternatives, is a user-friendly finite element
analysis program that successfully captures the response of different types of reinforced
concrete structures under different loading conditions. An important goal of this study
was to show the success of the program using only the default material constitutive
models in modelling the specimens. The results of this study will allow VecTor2 to be
used as a modelling tool for beam-column subassemblies, and will provide useful data
for the designer. A reliable and efficient finite element program is much needed at the
initial design stage for expensive experimental studies, and can provide seismic
assessment data for the structures before and after retrofitting techniques are applied.
OUTLINE OF CHAPTERS
Previous research on the modelling of beam-column subassemblies are
presented, and detailed information on the VecTor2 program are given in Chapter 2. The
models developed so far, and the capability of these models, is briefly explained.
The finite element modelling techniques and results are presented in two chapters
according to the reinforcement used in these specimens. Information and analysis results
on beam-column subassemblies designed with deformed reinforcement are given in
Chapter 3, while those for smooth reinforcement are given in Chapter 4. The
comparative results of the observed and predicted response of these specimens are also
given in these chapters for further discussion on the results of this analytical research.
The seismic response in terms of story shear force versus story displacement, sequence
of nonlinear events, failure mechanism and crack formation, energy dissipation capacity,
ductility and stiffness values are presented for comparison purposes.
General guidelines for modelling beam-column subassemblies with VecTor2 are
described in detail in Chapter 5. The focus of this chapter is on the interaction between
the concrete and the reinforcement; bond element modelling of beam-column

7
subassemblies with different reinforcement configurations in the joint panel zone is also
discussed.
Finally, the capabilities of the nonlinear finite element program VecTor2 are
summarized, and the ability of the program to adequately simulate the cyclic response of
beam-column subassemblies is discussed, in Chapter 6.

8
CHAPTER 2
Previous Research on the Modelling of Beam-Column Subassemblies
Experimental and analytical studies on the seismic behaviour of beam-column
subassemblies have provided extensive data for structural engineers over the years.
However, there is still an ongoing discussion on the contribution of different behaviour
mechanisms to the global performance of these structural members. In addition, there is
a need for an applicable and reliable seismic assessment tool for non-seismically
designed beam-column subassemblies. An advanced finite element program, which can
perform a nonlinear analysis on these structures before and after they are retrofitted, will
be very useful towards ongoing rehabilitation efforts.
The seismic behaviour of beam-column subassemblies involves the effects of
different load transfer and deformation mechanisms. The local behaviour parameters,
such as the bond-slip effects of the beam longitudinal reinforcement, and the shear
deformation mechanisms in the joint should be well integrated. These are the most
challenging aspects of finite element modelling of beam-column subassemblies. So far,
most of the modelling efforts on beam-column subassemblies have focused on one
single aspect of the problem, which resulted in models that were developed accordingly.
Analytical studies on both seismically and non-seismically designed beam-
column subassemblies are discussed in this chapter. The constitutive and behavioural
models used for finite element modelling, and the recently developed options for
modelling the bond-slip effects in VecTor2, are also explained in the last section of this
chapter.

9
2.1. ANALYTICAL RESEARCH ON BEAM-COLUMN SUBASSEMBLIES
The shear resistance mechanisms developed in beam-column subassemblies
under seismic forces were initially suggested by Park and Paulay (1975). It was
suggested that the diagonal compression strut and truss mechanism occurred
consecutively under seismic loading effects. Briefly, compressive forces acting on a
joint are carried by the equilibrium of concrete compressive forces and the bond forces
on the reinforcement through a single diagonal strut. The beam-column subassembly
follows this mechanism until the stress transfer mechanism at the joint is destroyed. This
stress transfer mechanism is dependent on the bond strength. Later, the truss mechanism
is active in the shear resistance. The diagonal concrete compression field and the
reinforcement in the orthogonal directions are needed to satisfy equilibrium in the joint
as illustrated in Fig. 2.1. The force transfer mechanisms on an exterior and an interior
beam-column subassembly suggested by Park (2002) are shown in Fig. 2.2.
Fig. 2.1 Diagonal Strut and Truss Mechanisms (Park and Paulay, 1975)

10
Fig. 2.2 Exterior and Interior Joints under Seismic Loading (Park, 2002)
This model is highly accurate in estimating the strength and the failure
mechanisms of beam-column subassemblies. However, it was found by Shiohara (2004)
to be inadequate in considering the effects of axial load applied to columns and the
flexural strengths of the adjoining members to the joint. As for non-seismically designed
or gravity load designed beam-column subassemblies, there is still no consensus on a
theory or a model that can be used for the seismic assessment of these structures.
Most of the modelling efforts concentrate on the shear deformation and neglect
the bond-slip effects in the joint. The assumption of perfect bond of the reinforcement in
the joint region was shown to be inaccurate by Shiohara (2001), Hakuto et al. (1999) and
Fleury et al. (2000). These members are subjected to high deformations at the joint panel
regions; therefore an integration of a bond-slip model is essential. However, this bond-
slip effect is completely different for deformed and smooth (plain round) reinforcing
bars. The bond-slip effect is further described in Sections 2.1.2, and 2.2.3. The
discussion on previous modelling studies is categorized as seismically, and non-
seismically designed members in this chapter.

11
2.1.1. SEISMICALLY DESIGNED MEMBERS
Experimental and analytical research on beam-column subassemblies first began
in the late 1970s to better understand the seismic performance of these members and
their contribution to the global behaviour mechanism of reinforced concrete moment
resisting framed buildings, (e.g., Bertero and Popov, 1977; Filippou et al., 1983;
Soroushian et al., 1988). Some research groups with the knowledge of these failure
mechanisms also undertook extensive research on the bond-slip behaviour of deformed
reinforcement in the joints, (e.g., Viwathanatepa et al., 1979; Eligehausen et al., 1983;
Soroushian et al., 1991), and used the results of these material models in their analytical
research.
Elmorsi et al. (2000) proposed a beam-column joint model which consisted of a
12-node inelastic plane stress element to represent the joint. This element was connected
to the beams and columns with 10-node inelastic plane stress transition elements as
shown in Fig. 2.3. The beams and columns were modelled with elastic beam line-
elements, and inelastic truss elements. The contact elements were also used on the beam
longitudinal reinforcement at the joint to represent the bond-slip effects.
Fig. 2.3 Elmorsi’s Model for Beam-Column Joint (Elmorsi et al., 2000)
A smeared crack approach was used for the concrete model, and the hysteretic
models were further developed to account for the shear deformations in the joint. The
J: Joint Element
T: Transition Element
EB: Elastic Beam Line Element
dcolumn
dcolumn dbeam
EB
T
T T
T
J

12
bilinear stress-strain curve proposed by Menegotto and Pinto (1973) was used for the
reinforcement material behaviour. A bond-slip model was developed based on
modifications applied to the model by Eligehausen et al. (1983). The only difference in
the proposed bond-slip model by Elmorsi et al. (2000) was the gradual increase path on
the friction branch of the cyclic curve. A gradual increase in the bond stress at the
friction curve was also suggested by Soroushian et al. (1991) and Filippou et al. (1983)
to Eligehausen’s cyclic bond stress-slip behaviour. A comparison of these bond-slip
models is given in Fig. 2.4. This model successfully considered both bond-slip and shear
deformation effect on beam-column subassemblies.
Fig. 2.4 Comparison of Bond-Slip Models (Elmorsi et al., 2000)
Limkatanyu and Spacone (2003) also studied the modelling of beam-column
subassemblies. The contributions of each member to the joint were modelled separately
and members were connected with rigid links. Failure mechanisms involving shear
deformations of the joint panel were neglected and only cases with bond-slip loss within
the joint were considered in this study. However, excessive shear deformations in the
joint panel region were observed by Dhakal et al. (2005) during an experimental study
on the seismic performance of gravity-load designed beam-column subassemblies under
different frequency excitations. This study suggested that both shear deformations and
bond-slip effects should be considered specifically for medium- or low-confined joints
or gravity-load designed beam-column subassemblies.
Elmorsi et al. (2000)
Eligehausen et al. (1983)
Bon
d St
ress
(MPa
)
Bond Slip (mm)
13
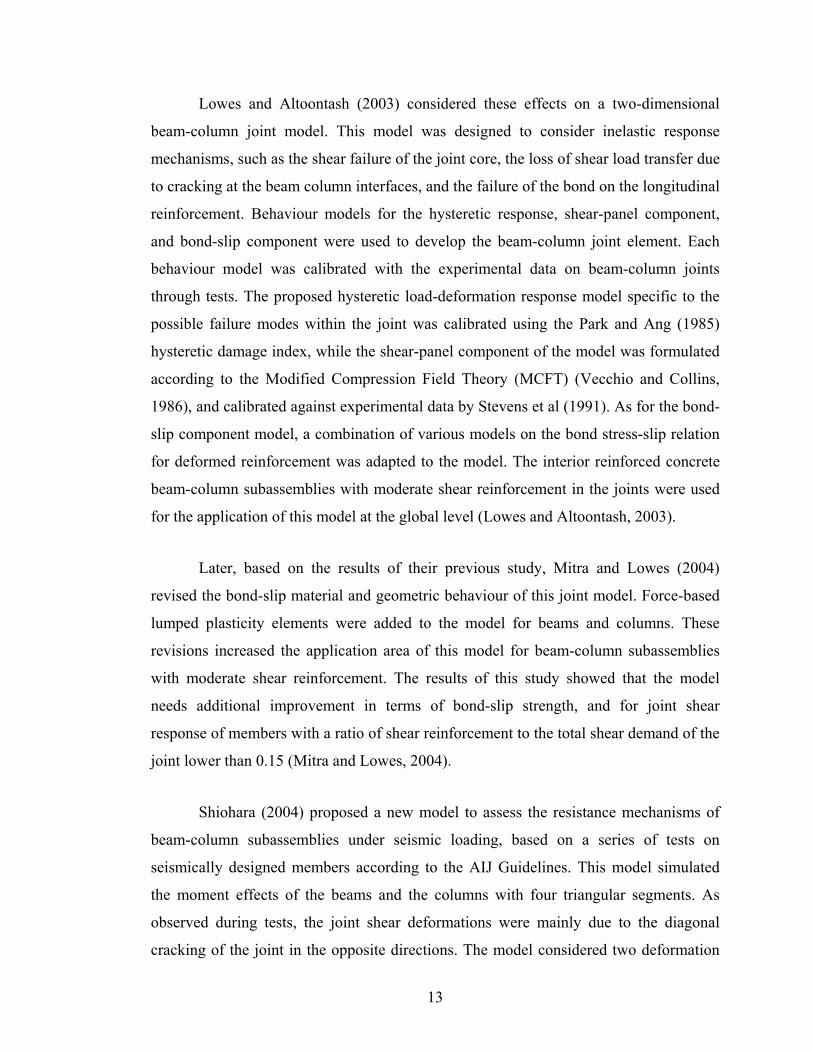
Lowes and Altoontash (2003) considered these effects on a two-dimensional
beam-column joint model. This model was designed to consider inelastic response
mechanisms, such as the shear failure of the joint core, the loss of shear load transfer due
to cracking at the beam column interfaces, and the failure of the bond on the longitudinal
reinforcement. Behaviour models for the hysteretic response, shear-panel component,
and bond-slip component were used to develop the beam-column joint element. Each
behaviour model was calibrated with the experimental data on beam-column joints
through tests. The proposed hysteretic load-deformation response model specific to the
possible failure modes within the joint was calibrated using the Park and Ang (1985)
hysteretic damage index, while the shear-panel component of the model was formulated
according to the Modified Compression Field Theory (MCFT) (Vecchio and Collins,
1986), and calibrated against experimental data by Stevens et al (1991). As for the bond-
slip component model, a combination of various models on the bond stress-slip relation
for deformed reinforcement was adapted to the model. The interior reinforced concrete
beam-column subassemblies with moderate shear reinforcement in the joints were used
for the application of this model at the global level (Lowes and Altoontash, 2003).
Later, based on the results of their previous study, Mitra and Lowes (2004)
revised the bond-slip material and geometric behaviour of this joint model. Force-based
lumped plasticity elements were added to the model for beams and columns. These
revisions increased the application area of this model for beam-column subassemblies
with moderate shear reinforcement. The results of this study showed that the model
needs additional improvement in terms of bond-slip strength, and for joint shear
response of members with a ratio of shear reinforcement to the total shear demand of the
joint lower than 0.15 (Mitra and Lowes, 2004).
Shiohara (2004) proposed a new model to assess the resistance mechanisms of
beam-column subassemblies under seismic loading, based on a series of tests on
seismically designed members according to the AIJ Guidelines. This model simulated
the moment effects of the beams and the columns with four triangular segments. As
observed during tests, the joint shear deformations were mainly due to the diagonal
cracking of the joint in the opposite directions. The model considered two deformation

14
modes; Joint Shear Mode (J-Mode) and Beam Flexural Mode (B-Mode). The theory was
not based on the common flexural theory of “plane sections remain plane” to consider
the local adhesion effects of reinforcement which were critical in the seismic
performance of these members. The strength and failure mode of the beam-column
subassemblies were estimated using the equilibrium conditions for each failure mode
and failure criteria for concrete, reinforcement and bond strength separately. The failure
mode and the shear strength were found from the combination of these parameters
(Shiohara, 2004). This model was proven to be successful for both exterior and interior
beam-column subassemblies, but not applicable to non-seismically designed beam-
column subassemblies.
2.1.2. NON-SEISMICALLY DESIGNED MEMBERS
The seismic behaviour of non-seismically designed beam-column subassemblies
are affected by various additional parameters. These members are prone to severe brittle
failure mechanisms due to the confinement problems at the beam-column joint, arising
from insufficient anchorage for beam and column reinforcement and the use of low
strength materials (smooth reinforcement and/or low strength concrete) (Pampanin et al.,
2006).
Non-seismically designed beam-column subassemblies are mostly designed with
hooked-end smooth beam bars. The bond-slip behaviour of smooth bars is significantly
different than that of deformed bars under seismic loading. The bond behaviour of
deformed bars is based on two parameters as stated by Abrams (1913): chemical
adhesion or “adhesive resistance”, and mechanical adhesion or “sliding resistance”. The
former is mainly based on the chemical interaction between mortar and concrete.
Mechanical adhesion, commonly referred to as mechanical interlock, occurs as a result
of the imperfections on the surface of the reinforcing bar. These imperfections are
mostly the lugs on the surface of deformed bars, which aren’t present on smooth bar
surfaces (Abrams, 1913). Therefore this mechanical adhesion isn’t available for smooth
bars; here, the only resistance mechanism against bond-slip effects is the chemical
adhesion.
15
The seismic performance of beam-column subassemblies is highly affected by
the application of these smooth bars. The behaviour is similar to that of deformed bars
until the adhesive bond is lost under seismic loading. After that, smooth bars tend to
push-pull freely under cyclic loading conditions. This was also observed during an
experimental investigation by Feldman and Bartlett (2005); contrary to deformed bar
behaviour, upon cracking, smooth reinforcement lost its grip to the concrete and the
adhesion between concrete and reinforcement was lost due to local slip of the bar. As a
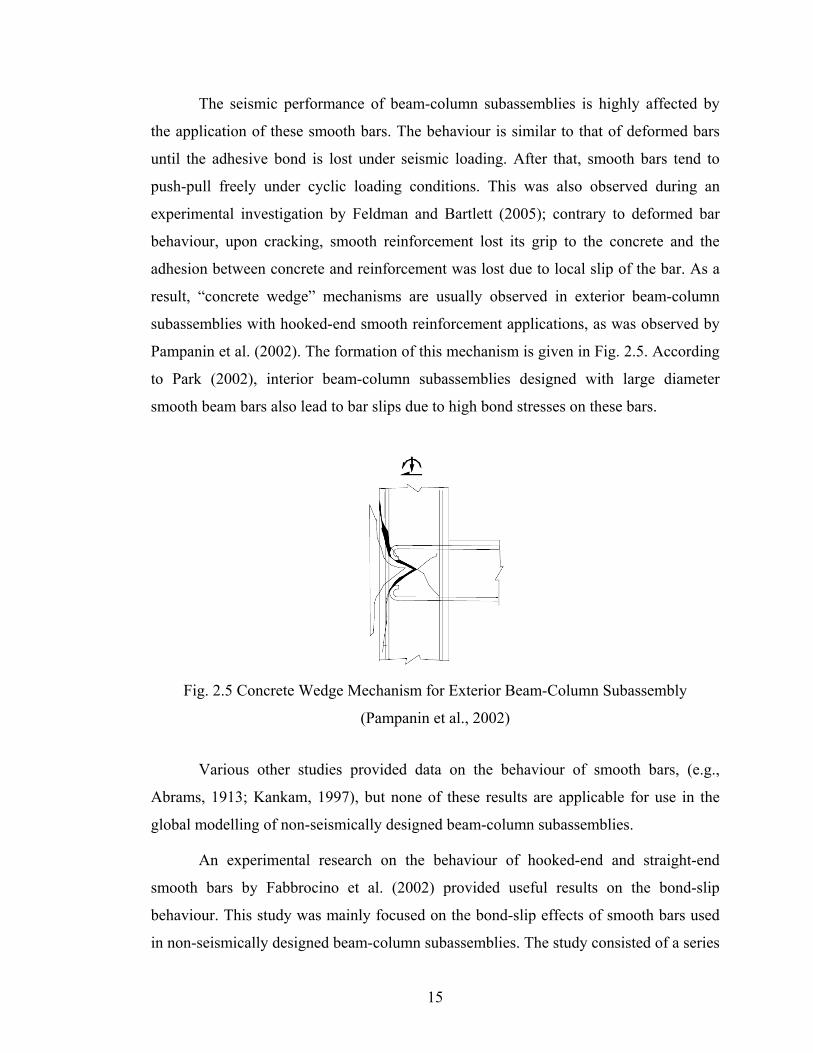
result, “concrete wedge” mechanisms are usually observed in exterior beam-column
subassemblies with hooked-end smooth reinforcement applications, as was observed by
Pampanin et al. (2002). The formation of this mechanism is given in Fig. 2.5. According
to Park (2002), interior beam-column subassemblies designed with large diameter
smooth beam bars also lead to bar slips due to high bond stresses on these bars.
Fig. 2.5 Concrete Wedge Mechanism for Exterior Beam-Column Subassembly
(Pampanin et al., 2002)
Various other studies provided data on the behaviour of smooth bars, (e.g.,
Abrams, 1913; Kankam, 1997), but none of these results are applicable for use in the
global modelling of non-seismically designed beam-column subassemblies.
An experimental research on the behaviour of hooked-end and straight-end
smooth bars by Fabbrocino et al. (2002) provided useful results on the bond-slip
behaviour. This study was mainly focused on the bond-slip effects of smooth bars used
in non-seismically designed beam-column subassemblies. The study consisted of a series

16
of monotonic and cyclic pull-out and beam tests on straight and 180o circular hooked-
end 12 mm and 16 mm smooth bars. The results of the bond stress-slip curve showed an
initial adhesion phase and a residual strength phase for these bars. No maximum plateau
after reaching maximum stress was observed for smooth bars. The same behaviour was
also seen by Feldman and Barlett (2005) during their experimental research on bond
strength of smooth (plain) round and square bars. Fabbrocino et al. (2002) also
compared the monotonic bond-slip behaviour of straight-shaped smooth bars to the
theoretical bond stress-slip behaviour suggested by CEB-FIB MC90 (1993), as
illustrated in Fig. 2.6.
Fig. 2.6 Experimental Results and CEB-FIB MC90 (1993) Provisions on Smooth Bars
(Fabbrocino et al., 2002)
The peak bond stress was higher than the peak bond stress suggested by the
CEB-FIB MC90 (1993), but the residual stress was similar to the CEB-FIB MC90
(1993) theoretical values, especially for 16 mm diameter bars. Later, another study by
Fabbrocino et al. (2004) on 12 mm diameter smooth bars bond-slip behaviour suggested
that the CEB-FIB MC90 (1993) formulations for “good bond” and “poor bond” can be
used for determining the peak and residual bond stress values. A comparison of this
study with the Model Code 90 formulations is given in Fig. 2.7. The results of this
research were later used for modelling non-seismically designed beam-column
Bond Slip (mm)
Bon
d St
ress
(MPa
)

17
subassemblies in this current study. Unfortunately, the derivation of a smooth bar bond
model based on this limited information wasn’t possible.
Fig. 2.7 Experimental Results and CEB-FIB MC90 (1993) Provisions on 12 mm Smooth
Bars (Fabbrocino et al., 2004)
Another modelling effort on non-seismically designed beam-column
subassemblies was a section-based model accounting for the inelastic behaviour
mechanisms of the joints proposed by Pampanin et al. (2003). This model was used for
exterior and interior beam-column subassemblies. Later, the hysteretic response models
were refined and used for modelling a series of non-seismically designed exterior beam-
column subassemblies (Chen, 2006). As shown in Fig. 2.8, one-dimensional frame
elements were used for structural members, and an equivalent moment rotational spring
for the joint panel. The joint panel model was developed considering the elastic and
inelastic mechanisms of the joint, and the beam and column elements were connected to
the joint panel with concentrated inelasticity at the critical section interface. The values
were defined through appropriate moment-curvature graphs based on the section
analysis. The cyclic behaviour of these specimens was adopted from the experimental
research to account for the pinching effect, and the joint panel hysteresis was calibrated
Bond Slip (mm)
Bon
d St
ress
(MPa
)

18
using values from the experimental data. This study was successful in modelling the
non-seismically designed beam-column subassemblies that were considered.
Fig. 2.8 Pampanin’s Analytical Model for Beam-Column Subassemblies
(Pampanin and Christopoulos, 2003)
2.2. VecTor2 - FINITE ELEMENT MODELLING
The nonlinear analysis of beam-column subassemblies was carried out using
VecTor2 in this study. As stated in Chapter 1, VecTor2 is a two-dimensional nonlinear
finite element analysis program developed at the University of Toronto for reinforced
concrete structures. Before proceeding to the analytical study, the material behaviour
models and the elements that are used in modelling the beam-column subassemblies are
described in this section. The detailed information on other elements or models is given
in the “VecTor2 & FormWorks User’s Manual” by Wong and Vecchio (2002).
VecTor2 is a nonlinear finite element analysis program with a user friendly pre-
processor FormWorks, (Wong and Vecchio, 2002), and post-processor Augustus,
Rotational Springs
Linear Elastic Frame Element
Potential Flexural Hinges
Rigid End Blocks

19
(©Bentz, 1996-2007) also developed at the University of Toronto. Any reinforced
concrete structure can be modelled either manually using ASCII text files or the
FormWorks program. The modelling of a structure starts with the selection of loading
conditions and material behaviour models. Then the regional properties, meshing
options and restraint conditions of the structure are described to simulate the actual
loading system. The element properties for concrete, reinforcement and bond regions are
individually assigned to the model. The finite elements that are available in the VecTor2
library are simple and low-powered elements which have linear displacement functions
leading to fewer suspicious and faulty behaviour results. Once the model is ready for
analysis, VecTor2 starts an iterative secant stiffness procedure for the nonlinear analysis
of the reinforced concrete structure under designated loading and restraint conditions.
The results of an analysis by VecTor2 can either be obtained from the ASCII result files
or simply by using the post-processor, Augustus. Most of the local and global member
behaviour can be observed using Augustus, however there are still some results that can
only be examined through the result text files.
2.2.1. CONCRETE
Plain or uniformly reinforced concrete regions can be modelled with three
different elements and various material behaviour models in VecTor2.
Elements:
The concrete element that has been used in this study is a four-node rectangular
element, as shown in Fig. 2.9. This is a plane stress rectangle with uniform thickness in
the out-of-plane direction. The element, having eight degrees of freedom, allows
translation at each node in x- and y-directions, and should be defined by a counter
clockwise sequence.

20
Fig. 2.9 Rectangular Concrete Element (Wong and Vecchio, 2002)
Reinforced concrete elements with smeared reinforcement can also be modelled
in this step. If the reinforcement is to be modelled as discrete reinforcement bars, then
this information should be given in the definition of reinforcement material and region.
The meshing of each model is at the user’s discretion while respecting the
necessary limitations of each element available for the concrete regions. The aspect ratio
of the element is advised not to be more than 3:2. There is also a feature that allows the
user to assign voids and nodes that are different than the assigned mesh parameters; this
is especially useful for restraint and force application nodes.
Behaviour Models:
Different constitutive and behavioural models are available in VecTor2. The
nonlinear behaviour of the structure changes according to the model that has been
selected. Therefore, it is extremely important for the user to have knowledge of all the
models that are available and the effects of these models on the behaviour of the
structure. The material models assigned to the beam-column subassemblies examined in
this study are discussed below.

21
The Concrete Pre-Peak Response was modelled using the default option. This is
a simple compression curve model for concrete regions, and can be observed in Fig.
2.10. The Hognestad Parabola can be used for concrete regions having a compressive
strength value less than 40 MPa. This model option computes the principal compressive
concrete stress before the compressive strain reaches the peak compressive strain value,
εp.
Fig. 2.10 Hognestad Parabola for Concrete Pre-Peak Response
(Wong and Vecchio, 2002)
The Concrete Post-Peak Response was modelled using the “Modified Park-Kent”
option, as illustrated in Fig. 2.11. This is a modified “Park and Kent” model that
accounts for the improved concrete compressive strength and ductility due to
confinement.
Fig. 2.11 Modified Park-Kent for Concrete Post-Peak Response (Wong and Vecchio, 2002)

22
This option computes the principal compressive concrete stress after the compressive
strain surpasses the peak compressive strain value, εp. The descending linear branch
after the peak strain is followed by a plateau at a value of 0.2 fp.
The Concrete Compression Softening models that are available in VecTor2 were
developed from a series of panel and shell elements tested at the University of Toronto
(Vecchio and Collins, 1992). The effect of concrete cracking on the compression
strength and stiffness are taken into account by either strength-and-strain softened or
strength-only softened models. From the four different models available in VecTor2, the
default model, “Vecchio 1992-A(e1/e2-Form)” was assigned to the concrete material
properties. Briefly, this is a strength-and-strain softened model in which both uniaxial
compressive strength and strain values are softened.
Concrete Tension Stiffening is the tensile resistance of cracked concrete arising
from the bond with the reinforcement within the cracked regions. This phenomenon is
especially important in finite element modelling. The coarseness of the element mesh
has an important effect on simulating this behaviour. The “Modified Bentz 2003” model,
which is a rigorous adaptation of previous Bentz (2000) model, was selected to represent
this behaviour. This model incorporates the bond actions to the tension stiffening
behaviour, and accounts for two-dimensional stress conditions and for the placement of
each type of reinforcement.
The Concrete Tension Softening model considers the post-cracking behaviour of
concrete that has been described in many fracture mechanics approaches of concrete
behaviour after cracking. This is an important behaviour to model especially for lightly
reinforced concrete members. The default “Linear” model, in which the concrete tensile
stresses represented by a linearly descending branch, was selected for the specimens
modelled in this study. The fracture energy used in this model is independent of element
size, and is assigned a value of 75 N/m.

23
Concrete Tension Splitting refers to the formation of splitting cracks parallel to
the reinforcement in tension due to the deformations occurring in the reinforcement. As
selected by default in VecTor2, this effect was not considered in any of the analyses.
Concrete Confinement is an option that is used to simulate the enhanced strength
and ductility effect of confined concrete under compression. The default
“Kupfer/Richard” model, utilized in this study, is a combination of a biaxial
compression model by Kupfer et al. (1969) and a model that considers the effect of
spiral reinforcement in columns by Richard et al. (1928).
Concrete Dilatation refers to the lateral expansion of concrete under compression
and the slight increase in strength and ductility of the member. The selected model,
“Variable Kupfer”, determines the Poisson’s ratio in relation to ascending compressive
strains. The Poisson’s ratio increases nonlinearly with the compressive strains.
The Concrete Cracking Criterion was modelled with the “Mohr-Coulomb
(Stress)” option. The cracking strength is a property that changes in relation to the stress
states. This effect is also taken into account to represent the tension and compression
dominant failure conditions in modelling with VecTor2. The Mohr-Coulomb criterion is
a two-parameter model that estimates the failure shear stress and failure plane in
frictional materials.
Concrete Crack Slip Check is an option in VecTor2 that limits the local stresses
at a crack to the maximum shear stress value. The “Vecchio-Collins 1986” model, which
is based on Walraven (1981) and Vecchio and Collins (1986), limits the local shear
stress at the crack depending on the concrete compressive strength, crack spacing, and
aggregate size. It should be noted that for the Disturbed Stress Field Model (DSFM)
analyses, the crack slip check is not utilized.
The Concrete Crack Width Check is specifically designed for shear-critical
reinforced concrete members having little or no shear reinforcement. The crack width
can be limited to one-quarter or one-half the aggregate size, or 1 mm, 2 mm, 5 mm and

24
10 mm widths. This option can also be neglected by choosing the “Stability Check
Omitted” option. The default option in VecTor2 for this parameter is “Agg/5 mm Max
Crack Width”. Other options of this parameter have been studied in modelling during
the course of this study.
The Concrete Hysteretic Response can be modelled with linear, nonlinear, or
nonlinear decay options. The default option in VecTor2, “Nonlinear with Plastic
Offsets” is found to be inadequate in modelling the reversed cyclic behaviour of beam-
column subassemblies. Another option, the “Palermo – Nonlinear with Cyclic Decay”
proposed by Palermo and Vecchio (2002), was assigned to model the hysteretic
behaviour of concrete in the beam-column subassemblies in this study. This model is
different in the way that it models the damage mechanisms in the reloading phases, and
in its consideration of partial loading and unloading phases. For the shape of the
unloading curves and the calculation of the instantaneous plastic offset strains in the
compression and tension domains, the model uses a different approach. The hysteretic
response figures in compression and tension for this model option are given in Fig. 2.12
and Fig. 2.13.
Fig. 2.12 Palermo Model for Concrete Hysteretic Response in Compression
(Wong and Vecchio, 2002)

25
Fig. 2.13 Palermo Model for Concrete Hysteretic Response in Tension
(Wong and Vecchio, 2002)
As explained above, the default models were chosen for most of the parameters.
The other available options were also selected to observe the effects on the nonlinear
behaviour of the specimens. The behavioural models that were used for the concrete in
this thesis are given in Table 2.1.

26
Table 2.1 Material Behaviour Models for Concrete
Material Property Model
Concrete Compression Pre-Peak Response Hognestad Parabola
Concrete Compression Post-Peak Response Modified Park-Kent
Concrete Compression Softening Vecchio 1992-A (e1/e2-Form)
Concrete Tension Stiffening Modified Bentz 2003
Concrete Tension Softening Linear
Concrete Tension Splitting Not Considered
Concrete Confined Strength Kupfer/Richard Model
Concrete Dilation Variable Kupfer
Concrete Cracking Criterion Mohr-Coulomb (Stress)
Concrete Crack Slip Check Vecchio-Collins 1986
Concrete Crack Width Check Agg/5 Max Crack Width/ Stability Check Omitted*/ 10 mm Max Crack Width*
Concrete Hysteretic Response Palermo 2002 (w/ Decay)* * non-default model
2.2.2. REINFORCEMENT
All reinforcement was modelled using discrete bar elements. This option of
modelling is useful when the area of interest is the local stress-strain or the bond-slip
response in the reinforcement. It is advised to use the smeared reinforcement option for
uniformly distributed reinforced concrete regions (e.g., stirrup reinforcement in beams
and ties in columns), while the discrete reinforcement option is best for other types of
reinforcement (e.g., longitudinal reinforcement in beams and columns and all
reinforcement in joint regions).

27
Elements:
Reinforcement bars can be discretely represented with two-node truss elements
which have nodal displacements in two directions and four degrees of freedom, as
illustrated in Fig. 2.14.
Fig. 2.14 Truss Element (Wong and Vecchio, 2002)
The monotonic stress-strain response is modelled with a trilinear stress-strain
behaviour. The strain hardening effect of reinforcement until rupture is considered in
VecTor2. The stress-strain response of reinforcement is shown in Fig. 2.15.
Fig. 2.15 Stress-Strain Response for Reinforcement (Wong and Vecchio, 2002)

28
Behaviour Models:
The different constitutive and behavioural models used for modelling the
reinforcement in this study are briefly described in this section.
The Reinforcement Hysteretic Response is important specifically in reversed
cyclic loading conditions. Using the monotonic stress-strain behaviour as a backbone,
the hysteretic response models define unloading and reloading curves depending on the
model selected from the VecTor2 library. The model described in this section is the
default option, “Seckin w/ Bauschinger Effect”, used for modelling purposes in this
study. This is a formulation developed by Seckin (1981) for the hysteretic response of
reinforcement which includes the Bauschinger effect. After the plastic prestraining, the
local stress changes upon load reversal result in premature yielding of reinforcement. As
shown in Fig. 2.16., the monotonic stress-strain curve is followed by a linear unloading
curve. The reloading curve is defined with a Ramsberg-Osgood formulation including
the Bauschinger effect.
Fig. 2.16 Seckin Model for Hysteretic Response of Reinforcement
(Wong and Vecchio, 2002)
The Reinforcement Dowel Action, which is the contribution to the shear
resistance provided by the reinforcement crossing cracks, is considered with this

29
parameter. Dowel action is important for the shear strength and post-peak ductility of
reinforced structures with low shear reinforcement ratios. The ‘Tassios (Strength)’ and
‘Tassios (Crack Slip)’ options are available for modelling the dowel action in VecTor2.
The shear resistance is estimated as a function of the shear slip at a crack, and the
amount of shear slip is reduced by subtracting this shear resistance from the local shear
stress value on the crack. The dowel action mechanism is shown in Fig. 2.17.
Fig. 2.17 Reinforcement Dowel Action (Wong and Vecchio, 2002)
Reinforcement Buckling model is considered effective in the analysis procedure
when discrete reinforcement (truss bar elements) are attached to concrete with bond
elements. In cases of buckling failure mechanisms due to high compressive stresses,
there is no contribution to the flexure and shear resistance of the structure by the
concrete cover and reinforcement. The ‘Asatsu Model’ option is considered when the
reinforcement is under excessive compressive stresses and the bond deterioration is
severe with a cumulative energy exceeding the fracture energy.
The constitutive and behavioural models that are used for the reinforcement in
this thesis are summarized in Table 2.2.
Table 2.2 Material Behaviour Models for Reinforcement
Material Property Model Reinforcement Hysteretic Response Seckin Model (Bauschinger)
Reinforcement Dowel Action Tassios Model (Crack Slip)
Tassios Model (Crack Strength)* Reinforcement Buckling Asatsu Model
* non-default model

30
2.2.3. BOND
The performance of the beam-column subassemblies in shear are highly affected
by the bond-slip behaviour of the beam longitudinal reinforcement. It is certain that the
nature of this bond behaviour between the concrete and the reinforcement needs to be
considered as an important parameter in modelling the seismic behaviour. Another part
of this research was to understand the effectiveness of this option under reversed cyclic
loading conditions. The reinforcement bond behaviour was modelled using the
“Embedded Deformed” or “Embedded Smooth Rebar” options in VecTor2.
Elements:
Two bond element types are available in VecTor2: i) Link Elements, and
ii) Contact Elements. The link elements (Ngo and Scordelis, 1967) were used to simulate
the behaviour between concrete and reinforcement in this study. The connections details
of these elements can be seen in Fig. 2.18. The link elements are two-node non-
dimensional elements which consist of two orthogonal springs that link the concrete and
discrete reinforcement. These two nodes can displace independently from each other
simulating the relative displacement effect between concrete and reinforcement
elements. The connection details of these link elements allow these two nodes to be able
to deform in both the x- and y- direction.
Fig. 2.18 Link Element (Wong and Vecchio, 2002), after Ngo and Scordelis (1967)

31
Behaviour Models:
The general parameters used in all bond models will be explained for both
deformed and smooth reinforcement, before each model is discussed individually.
Deformed and smooth reinforcement are modelled with the Embedded Rebar option.
The bond material property for embedded reinforcement is specified by either the
confinement pressure index (β) or by a user-defined bond stress-slip relationship.
Eligehausen et al. (1983) and CEB-FIB MC90 (1993) agreed on two bond regions based
on the failure mechanisms. Eligehausen et al. (1983) observed two distinct failure
mechanisms; i) Pull-out Failure and ii) Splitting Failure, and suggested that they are
mostly related to the transverse reinforcement provided and the clear distance between
the bars. For intermediate values of transverse reinforcement, the CEB-FIB MC90
(1993) suggests using a linear interpolation between these two cases. The values of
confinement pressure index for these two distinct cases are:
• β = 0 Unconfined Concrete - Splitting Failure Mechanism
• β = 1 Confined Concrete - Pull-out Failure Mechanism
The CEB-FIB MC90 (1993), mostly based on Eligehausen’s bond slip model,
defines the region as a confined region when the transverse pressure is high
(p≥7.5 MPa) or transverse reinforcement is closely spaced satisfying conditions of
ΣAsw≥nAs. The confinement pressure index (β) is a unitless parameter which is
estimated by using the ratio of the transverse reinforcement in sections. The transverse
reinforcement ratio within the bond region, ρv, is multiplied by the yield stress of the
reinforcement then divided by the high confinement pressure value of 7.5 MPa accepted
by CEB-FIB MC90 (1993). The values assigned for minimum concrete cover and
reinforcement layers through depth of the member are other important parameters for
each bond model. The minimum concrete cover is estimated through the concrete cover
values around the reinforcement and the minimum value of all the parameters are used
for definition, as illustrated in Fig. 2.19. The number of reinforcement layers through
depth of a structure is estimated as shown in Fig. 2.20.

32
Fig. 2.19 Minimum Concrete Cover
Fig. 2.20 Number of Reinforcement Layers through the Depth
The hooked bar option is another parameter that is described later in this chapter.
This option activates a bond-slip model specific to hooked end bars, and is given on the
bond property window (see Fig. 2.21).
Fig. 2.21 Bond Properties - Deformed Reinforcement Option
cmin = min (c1,c2,c3)
c1 c2
c3 c3
n=2

33
The reinforcement size related effects are considered by not only the diameter of
the reinforcement, but also the lug spacing, S, and lug height, H. The values of these two
parameters for deformed reinforcement are given in Table 2.3. The value of lug spacing
remains the same for smooth reinforcement, but the lug height is estimated as H=S/75.
Table 2.3 Reinforcement Properties of Embedded Deformed Bars
db (mm) S(mm) H(mm)≥ 55 39.4 2.55
43-55 30.6 2.2 35-43 25 1.79 29-35 20.9 1.48 25-29 17.6 1.26 19-25 13.6 0.98 15-19 11.2 0.72 11-15 7.9 0.45 0-11 0.70db 0.04db
Currently, the only distinction between deformed and smooth reinforcement in
VecTor2, is the value of the lug height. However, it was observed that this causes an
overestimation in the bond-stress behaviour for smooth reinforcement. Therefore, a user
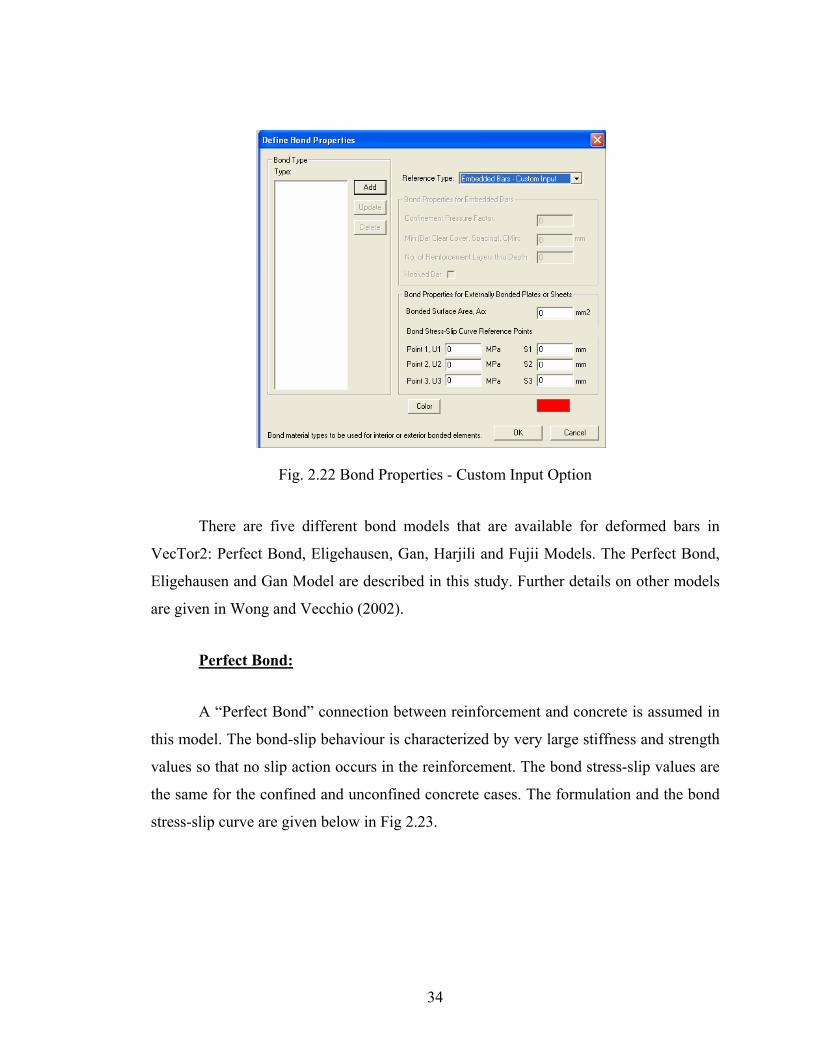
defined embedded bar option was added for improved modelling of smooth
reinforcement in VecTor2. This option allows the user to assign a selected bond stress-
slip curve for the bond-slip behaviour of the elements. The bond stress-slip relation is
assigned with three nodes to represent the stress-slip curve as shown in Fig. 2.22. The
bonded surface area input is left as zero.
34
Fig. 2.22 Bond Properties - Custom Input Option
There are five different bond models that are available for deformed bars in
VecTor2: Perfect Bond, Eligehausen, Gan, Harjili and Fujii Models. The Perfect Bond,
Eligehausen and Gan Model are described in this study. Further details on other models
are given in Wong and Vecchio (2002).
Perfect Bond:
A “Perfect Bond” connection between reinforcement and concrete is assumed in
this model. The bond-slip behaviour is characterized by very large stiffness and strength
values so that no slip action occurs in the reinforcement. The bond stress-slip values are
the same for the confined and unconfined concrete cases. The formulation and the bond
stress-slip curve are given below in Fig 2.23.

35
Fig. 2.23 Perfect Bond Model (Wong and Vecchio, 2002)
=== fτττ 21 250 MPa (2.1)
1.01 =Δ mm (2.2)
0.32 =Δ mm (2.3)
0.103 =Δ mm (2.4)
Eligehausen Model:
As previously described in Section 2.1.1., this is a model proposed by
Eligehausen et al (1983). Experimental research on the seismic performance of beam-
column subassemblies by Viwathanetpa et al. (1979), Eligehausen et al (1983), and
Filippou et al. (1983) suggested that the bond-slip behaviour of these members consisted
of two distinct regions: i) Confined and ii) Unconfined. These definitions were adopted
by the CEB-FIB MC90 (1993) based on previous research on bond-slip behaviour of
reinforcing bars. Later, similar studies by Soroushian et al. (1989), and
Pochanart et al. (1989) provided enough data to define the formulation based on
Eligehausen et al. (1983). In the Eligehausen Model, these two distinct cases are
computed as:
Δ
Bond Slip (mm)
Bon
d St
ress
(MPa
) τ1
Δ1 Δ2 Δ3

36
• For unconfined regions where β = 0, the bond stress-slip values of the monotonic
curve are calculated as:
( )αττ 11 sss ΔΔ= 1sΔ≤Δ (2.5)
2sττ = 21 ss Δ≤Δ<Δ (2.6)
⎥⎦
⎤⎢⎣
⎡−
Δ−ΔΔ−Δ
−= )()(
)(2
23
22 sfs
ss
ss ττττ 32 ss Δ≤Δ<Δ (2.7)
sfττ = Δ<Δ 3s (2.8)
where:
11'
748.0 pb
cs d
cfττ ≤= (2.9)
21 ss ττ = (2.10)
pfb
csf d
cfττ ≤=
'234.0 (2.11)
⎥⎥⎦
⎤
⎢⎢⎣
⎡⎟⎟⎠
⎞⎜⎜⎝
⎛Δ=Δ
1
111 ln1exp
p
sps τ
τα
(2.12)
22 ps Δ=Δ (2.13)
33 ps Δ=Δ (2.14)
4.0=α (2.15)
1pτ and pfτ are the confined region bond stress values, defined in Equations 2.20
and 2.22.

37
• In confined regions where β = 1, bond stress-slip values of the monotonic curve are:
( )αττ 11 pp ΔΔ== 1pΔ≤Δ (2.16)
2pττ = 21 pp Δ≤Δ<Δ (2.17)
⎥⎥⎦
⎤
⎢⎢⎣
⎡−
Δ−Δ
Δ−Δ−= )(
)()(
223
22 pfp
pp
pp ττττ 32 pp Δ≤Δ<Δ (2.18)
pfττ = Δ<Δ 3p (2.19)
where:
30'
4201
cbp
fd⎟⎠⎞
⎜⎝⎛ −=τ (2.20)
21 pp ττ = (2.21)
6.27'
07.05.5 cpf
fHS
⎟⎠⎞
⎜⎝⎛ −=τ (2.22)
30'
1c
pf
=Δ (2.23)
0.32 =Δ p mm (2.24)
Sp =Δ 3 (2.25)
4.0=α (2.26)

38
Fig. 2.24 Eligehausen Confined and Unconfined Bond Stress-Slip Model
• If the confinement pressure index is between 0 and 1, the behaviour of the bond
model is computed for the Eligehausen Model as:
( )αττ 11 spsp ΔΔ= 1spΔ≤Δ (2.27)
⎥⎥⎦
⎤
⎢⎢⎣
⎡−
Δ−Δ
Δ−Δ−= )(
)()(
223
11 spfsp
spsp
spsp ττττ 21 spsp Δ≤Δ<Δ (2.28)
⎥⎥⎦
⎤
⎢⎢⎣
⎡−
Δ−Δ
Δ−Δ−= )(
)()(
223
22 spfsp
spsp
spsp ττττ 32 spsp Δ≤Δ<Δ (2.29)
spfττ = Δ<Δ 3sp (2.30)
where:
)( 1111 spssp ττβττ −+= (2.31)
21 spsp ττ = (2.32)
)(1 sfpfsspf ττβττ −+= (2.33)
Δ
Confined Region
Unconfined Region
τs1= τs2
τsf
τp1= τp2
Δ1 Δ2 Δ3 Bond Slip (mm)
Bon
d St
ress
(MPa
)
τpf

39
11111 )( sspssp Δ≥Δ−Δ+Δ=Δ β (2.34)
22 psp Δ=Δ (2.35)
33 psp Δ=Δ (2.36)
Gan Model:
This model describes the same behaviour for confined regions as the Eligehausen
Model, but a slightly different response for unconfined regions where splitting failure
mechanisms are significant.
• In unconfined regions, bond stress-slip values of the monotonic curve are:
( )αττ 11 sss ΔΔ= 1sΔ≤Δ (2.37)
⎥⎦
⎤⎢⎣
⎡−
Δ−ΔΔ−Δ
−= )()(
)(1
12
11 sfs
ss
ss ττττ 21 ss Δ≤Δ<Δ (2.38)
sfττ = Δ<Δ 2s (2.39)
where:
11'
748.0 pb
cs d
cfττ ≤= (2.40)
12 15.0 ss ττ = (2.41)
2ssf ττ = (2.42)
⎥⎥⎦
⎤
⎢⎢⎣
⎡⎟⎟⎠
⎞⎜⎜⎝
⎛Δ=Δ
1
111 ln1exp
p
sps τ
τα
(2.43)
22 =Δ s mm (2.44)
33 ps Δ=Δ (2.45)

40
1pτ , 1pΔ and 3pΔ are the confined region bond stress-slip values, previously
defined in Equations 2.20, 2.23, and 2.25.
Fig. 2.25 Gan Confined and Unconfined Bond Stress-Slip Model
• If the confinement pressure index is between 0 and 1, the behaviour of the bond
model is computed for the Gan Model as follows;
)( 1111 spssp ττβττ −+= (2.46)
)( 2222 spssp ττβττ −+= (2.47)
sfsfpfsspf τττβττ <−+= )(1 (2.48)
11111 )( sspssp Δ≥Δ−Δ+Δ=Δ β (2.49)
⎩⎨⎧
Δ=Δ
22
0.2
psp
ifif
β
β<=
00
(2.50)
Hooked Bar Model:
The formulation of this model was implemented into VecTor2 by Gan (2000) based
on the research results by Eligehausen et al. (1983). They conducted tests on a confined
Δ
Confined Region
Unconfined Region
Bond Slip (mm)
Bon
d St
ress
(MPa
)
τs1= τs2
τsf
τp1= τp2
Δ1 Δp2 Δ3

41
concrete member with #8 (25 mm) deformed bar and average bond stress-slip values for
hooks confined in concrete were proposed. The bond stress-slip values used for this
model can be observed in Table 2.4 and in Fig. 2.26.
Table 2.4 Bond Stress-Slip Parameters of Hooked Bars (Eligehausen et al., 1983)
Parameter Hooks in Confined Concrete Δ1 1.0 Δ2 3.0 Δ3 100.0 τ1 22.0 τ2 4.0 α 0.20
The formulation in VecTor2 for this model is as follows:
τ = ( )α122 pΔΔ MPa 1Δ≤Δ (2.51)
τ = 22 MPa Δ<Δ1 (2.52)
α and 1pΔ is computed according to the model selected.
Fig. 2.26 Bond Stress-Slip Model for Hooked End Bars
Bond Slip (mm)
τ
Δ
Bon
d St
ress
(MPa
)

42
Bond Models in VecTor2 under Reversed Cyclic Loading:
The cyclic curve proposed by Eligehausen et al. (1983) is used for both the
Eligehausen and Gan models with regards to the bond stress-slip cyclic behaviour. The
cyclic curve for Eligehausen’s bond-slip model is given in Fig. 2.27. A preliminary
investigation on concrete blocks with embedded deformed bars was carried out to better
understand the bond-slip behaviour. After a careful investigation of the monotonic and
cyclic bond-slip behaviour in VecTor2, a difference between the Eligehausen and
VecTor2 cyclic behaviour was observed. Eligehausen’s model follows an unloading
branch up to a frictional bond stress, which was defined as a quarter of the maximum
bond stress value of the previous loading cycle. The bond stress remains constant under
further slippage in the negative direction, and increases following the backbone curve of
the monotonic bond slip curve.
Fig. 2.27 Cyclic Bond Stress-Slip Model by Eligehausen et al. (1983)
The bond stress-slip values are reduced compared to the actual monotonic
behaviour. The bond stress-slip behaviour displays a reduction in the bond resistance to
represent the additional loading, and the slip effects are computed by a reduction factor
denoted as the damage index parameter, D. The damage index is defined between zero
and one. The value is equal to 1 for full damage with a resulting zero bond stress value,
and represents the case where the bond is completely destroyed. If the damage index
A
B C
DE
FG
HI
J
K
Bon
d St
ress
(MPa
)
Bond Slip (mm)

43
parameter is zero, then the reduced curve will follow a similar behaviour to the
monotonic bond-slip curve. The damage index and the reduction of the bond stress value
are estimated using the Equations 2.60 to 2.64.
The reduced envelope that is followed in reversed cyclic loading conditions is
explained here. First, the stiffness parameters attained at the ith cycle, and then the bond
stress-slip values for unloading and reloading branches are given in the following
section.
During the ith cycle stiffness parameters are computes as follows:
E1= 0 (2.53)
Ei= Ei-1 + ΔEi (2.54)
(D1) for Δ im ≤ Δ 0.8max;
ΔEi= 0 (2.55)
(D2) for Δ 0.8max < Δ im ≤ Δ 1s;
ΔEi= τim Δ 1(Δ im/ Δ 1)(1+α)/(1+α) + 0.5*0.25τim Δim (2.56)
(D3) for Δ 1s < Δ im ≤ Δ 2s;
ΔEi= τ1i Δ 1s/(1+α) + 0.5(τ1i +τim)( Δim– Δ1) + 0.5*0.25τim Δim (2.57)
(D4) for Δ 2s < Δ im ≤ Δ 3s ;
ΔEi= τ1i Δ1/(1+α) + 0.5(τ1i+τ2i)( Δ3–Δ1) + 0.5(τ2i +τim)(Δim–Δ2) +0.5*0.25τimΔim (2.58)
(D5) for Δ im > Δ 3s ;
ΔEi= τ1i Δ1/(1+α)+0.5(τ1i+τ2i)(Δ3–Δ1)+0.5(τ2i +τfi)(Δ3–Δ2) +τfi )(Δim–Δ3)+….
…+0.5*0.25τimΔim (2.59)
where,
Ei = energy consumption index at i-th cycle;
Δ 0.8max = slip corresponding to 80% stress of τ1s;
τ1i, τ2i, and τfi = bond stresses corresponding to slips Δ1, Δ2, and Δ3;

44
These bond stress values are estimated using damage index which is described later;
τ1i= τ1s (1–Di) (2.60)
τ2i= τ2s (1–Di) (2.61)
τfi= τfs (1–Di) (2.62)
The damage index at ith cycle is computed by;
Di= 1–ea (2.63)
a = –1.2(Ei/E0)1.1 (2.64)
In this formula, Eo is different for confined and unconfined cases, and is computed from
the area enveloped by bond stress-slip curve limited by Δ3;
For unconfined cases:
Eo = τ1Δ1/(1+α)+ τ1(Δ3–Δ1)+0.5(τ1+τf)(Δ3– Δ2), (2.65)
For confined cases:
Eo =τ1s Δ1s/(1+α)+0.5(τ1s+τ2s)(Δ2s–Δ1s)+0.5(τ1s +τfs)(Δ3s–Δ2s) (2.66)
The bond stresses at the unloading and reloading branches are as follows:
• The i-th unloading cycle is given by,
τi = 0.25 τim 0 ≤ |Δi| < |Δip| (2.67)
τi = (Δi – Δip) τim/(Δim– Δi
p) |Δip| ≤ |Δi| < |Δim| (2.68)
τi = f(Δi) |Δim| ≤ |Δi| (2.69)
where
Δip= Δim – τim/G0 0 ≤ |Δi| < |Δi
p| (2.70)
G0= τ1 α 100(1–α) (2.71)
Δip is the plastic bond slip value that is attained at bond slip Δim, whereas Δim is the

45
maximum slip attained at the positive half cycle (for ith negative loading) or the
maximum slip attained at the negative half cycle (for ith positive loading). τim is the
absolute value of bond stress corresponding to this slip value, Δim.
• The i-th reloading cycle is given by
τi = f(Δi) ≥ –0.25 τim for τi ≥ 0 (2.72)
τi = f(Δi) ≤ –0.25 τim for τi < 0 (2.73)
where
f (Δi) in equations above is computed from the bond stress obtained from the base curve
reduced by the bond degradation at the current cycle.
The cyclic behaviour of the bond-slip model in VecTor2 is shown in Fig. 2.28.
As shown in this figure, this model doesn’t involve the frictional bond resistance in
Eligehausen’s model. The bond-slip behaviour decreases to the zero bond stress-slip
value and then increases in the negative loading branch following the monotonic
behaviour. The reduced envelope approach under reversed cyclic loading conditions is
applied similar to the Eligehausen’s model, but some of the energy dissipation capacity
of the specimens is lost between the unloading and reloading cycles as a result.
Fig. 2.28 Cyclic Bond Stress-Slip Model in VecTor2
A
B C
DE
FG
HI
J
K
Bon
d St
ress
(MPa
)
Bond Slip (mm)
D
H

46
CHAPTER 3
Analysis of Deformed Reinforcement Beam-Column Subassemblies
VecTor2, a two-dimensional nonlinear finite element analysis program, was used
for modelling the reinforced concrete beam-column subassemblies. In the search for an
applicable and reliable beam-column subassembly model, specimens were selected from
beam-column subassemblies which were different in type of connection, material
properties, reinforcement detailing, test set-up and loading system. All specimens were
modelled with the same material, geometric, and loading conditions applied during the
experimental testing program.
The specimens used for modelling purposes with VecTor2 are briefly described
here while additional information on these specimens can be found in the experimental
study reports and journal papers that are referenced in this thesis. The finite element
models of the specimens, and the results of the analytical studies in comparison to
experimental results, are also given for each test specimen following the specimen
details. Information on the beam-column subassemblies designed with deformed
reinforcement is given in this chapter; specimens with smooth (plain round)
reinforcement are treated in the next chapter, Chapter 4. The specimens in each chapter
are described in two sub-sections: exterior and interior beam-column subassemblies.
3.1. EXTERIOR BEAM-COLUMN SUBASSEMBLIES
3.1.1 SPECIMEN ED1
The beam-column subassemblies considered here were full-scale models from a
multi-storey moment resisting frame building with a 20 ft span and 10 ft storey height.
The beam-column subassemblies were designed according to the seismic requirements
of ACI 318-77 (Bond, 1969; Goyal, 1969). The specimen selected for this study was a
beam-column subassembly designed with deformed reinforcement and the joint panel
region was unconfined against shear deformations in the joint.

47
3.1.1.1. TEST SPECIMENS
Sectional and Material Properties:
The column was 15 by 15 inches (381 mm x 381 mm) with eight #8 longitudinal
bars, and the beam was 12 by 20 inches (305 mm x 508 mm) with five #9 bars. The
sectional details and reinforcement layout of the specimen are given in Fig 3.1.
Fig. 3.1 Reinforcement Layout for Specimen ED1
The concrete castings of the specimens were completed in three stages; lower
column, beam and upper column. The material properties of concrete and reinforcement
are given in Table 3.1 and 3.2.
Table 3.1 Material Properties of Concrete for Specimen ED1
Parameter Beam Joint Column
fc’ (ksi (MPa)) 4.51 (31.1) 4.51 (31.1) 5.58 (38.5)
Column 15”
15”
Beam 12”
20”
#3 @ 9″ #3 @ 3″
#3 @ 11″
#4 @ 3″
#4 @ 3″
#3 @ 11″

48
Table 3.2 Material Properties of Reinforcement for Specimen ED1
Type Area in2 (mm2)
fy ksi (MPa)
Es ksi (MPa)
fu ksi (MPa)
# 9 1.00 (645) 50.6 (349) 90 (620)
# 8 0.79 (510) 48.6 (335) 80 (552)
# 4 0.20 (129) 55 (379) 90 (620)
# 3 0.11 (71) 62 (428)
29000
(200000)
110 (758)
Test Set-Up and Loading:
Simulation of the seismic and gravity load conditions was accomplished by
applying a constant axial load to the center of the column with a Universal Hydraulic
Machine. The reversed vertical cyclic loading was applied to the tip of the beam with a
hydraulic jack. The hydraulic jack, connected to the reaction floor, was capable of
moving in each direction with a capacity of 16 tons. The lower column end was
restrained by a reinforced concrete pedestal mounted on the reaction floor, and the upper
column top was loaded through the head of the testing machine restricting the movement
of the column in the horizontal direction.
The axial load applied to the top of the column was kept constant during testing
at 500 kips (2225 kN). The hydraulic jack at the beam tip was connected at a distance of
10 ft (3050 mm) from the column centerline, and moved in the vertical direction to
simulate seismic loading of the beam-column subassembly. A detailed figure of the test
set-up is shown in Fig. 3.2. The loading protocol was defined during the testing based on
the failure status of the specimen.

49
Fig. 3.2 Test Set-up and Loading System for Specimen ED1
3.1.1.2. FINITE ELEMENT MODELLING
This specimen had no challenging aspects for modelling with VecTor2 in terms
of specimen geometry, material properties, test set-up or loading conditions. Details of
the concrete regions, and reinforcement and bond elements used for the non-linear
analysis of this specimen are given in this section.
Material and Regional Properties:
The material properties of the concrete and reinforcement were modelled as
described in the experimental test reports. The concrete regions were modelled with
rectangular elements, and truss elements were assigned to the reinforcement together
with bond-link elements. Smeared reinforcement was also assigned to the concrete
regions to represent the confinement effect of transverse bars. This effect was utilized in
Reaction Floor
Axial Loading
Cyclic Loading
Universal Hydraulic Machine (Baldwin)
10 ft = 3050 mm
10 ft
50
VecTor2 as the ratio of reinforcement in the out-of-plane direction, ρz. As all
reinforcement was modelled as discrete truss elements, the selection of a proper mesh
size was affected by the size of the connecting members and reinforcement layouts. The
coarseness of the mesh was gradually changed for a better representation of the model
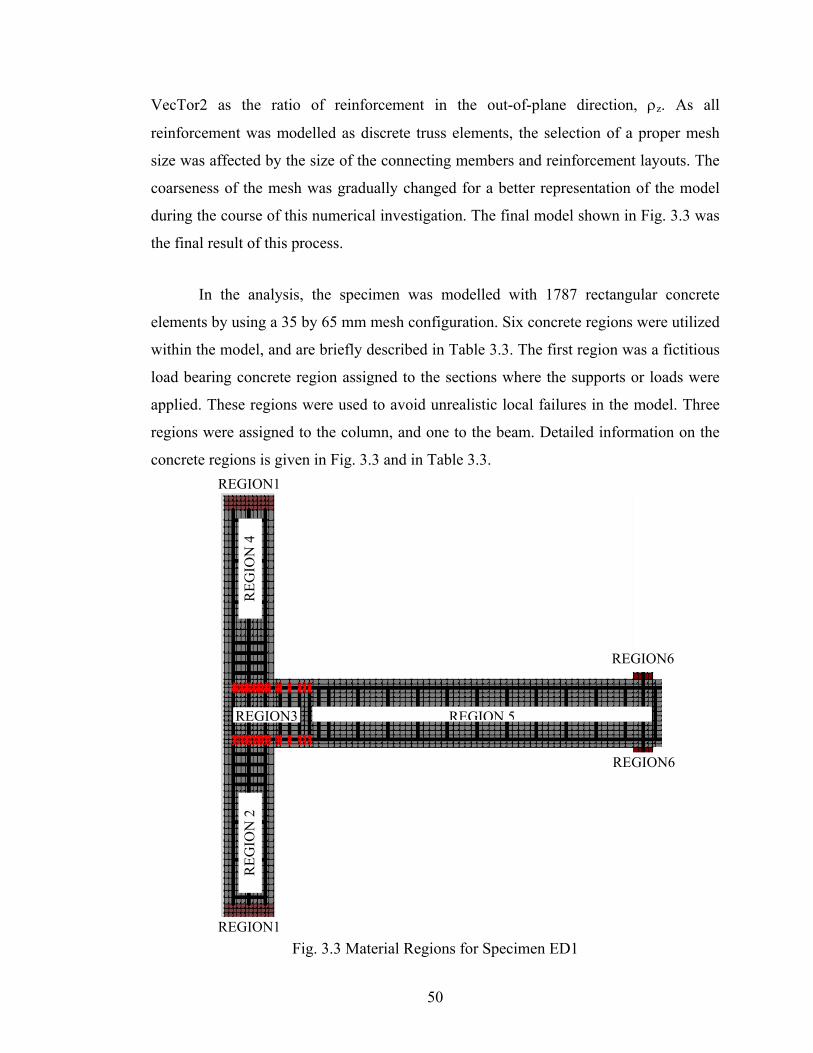
during the course of this numerical investigation. The final model shown in Fig. 3.3 was
the final result of this process.
In the analysis, the specimen was modelled with 1787 rectangular concrete
elements by using a 35 by 65 mm mesh configuration. Six concrete regions were utilized
within the model, and are briefly described in Table 3.3. The first region was a fictitious
load bearing concrete region assigned to the sections where the supports or loads were
applied. These regions were used to avoid unrealistic local failures in the model. Three
regions were assigned to the column, and one to the beam. Detailed information on the
concrete regions is given in Fig. 3.3 and in Table 3.3.
Fig. 3.3 Material Regions for Specimen ED1 REGION1
REGION 5
REG
ION
2
REGION1
REG
ION
4
REGION6
REGION6
REGION3

51
Table 3.3 Concrete Regions for Specimen ED1
Concrete Regions # 1 # 2 # 3 # 4 # 5 #6
Thickness (mm)
380 305
Mesh Size (mm)
35 x 65 35 x 65 35 x 35 35 x 65 65 x 35 65 x 65
Purpose Bearing Lower Column
Joint Upper Column
Beam Bearing
Reinforcement # 3 # 3 # 3
ρz (%) None
0.13 None
0.13 0.20 None
A total of 649 truss elements and 30 bond-link elements were used to represent
the reinforcement and bond details of the specimen. The representation of the
reinforcement and bond element configuration is shown in Fig. 3.4, and detailed
information about these properties is given in Table 3.4 and Table 3.5.
Table 3.4 Reinforcement Elements for Specimen ED1
Reinforcement Type Location
# 1 3 #8 Column Longitudinal Outer Reinforcement
# 2 2 #8 Column Longitudinal Center Reinforcement
# 3 3 # 9 Beam Top Layer Longitudinal Reinforcement
# 4 2 # 9 Beam Bottom Layer Longitudinal Reinforcement
# 5 1 # 4 Transverse Reinforcement on Columns
# 6 1 # 3 Transverse Reinforcement on Beams

52
Fig. 3.4 Reinforcement Regions for Specimen ED1
The bond elements were introduced in two regions. Soroushian et al. (1988)
suggested modeling these hooked bars with a stiff spring connected to the bond-slip
elements on the straight section of the reinforcement. As this beam-column joint was
unconfined and the beam longitudinal reinforcement was anchored into the joint with
180o hooks not extending into the column, this specimen was modelled with two bond
materials. The first utilized the perfect bond behaviour to represent the hook section of
the reinforcement. The perfect model is a bond-slip model where a larger stiffness
property was assigned to the bond elements to limit the slip of the reinforcement. The
second was the imperfect bond material for the straight section of the beam
reinforcement. The configuration of the bond-link elements and confinement pressure
Reinforcement # 3 Reinforcement # 4
Reinforcement # 1 Reinforcement # 2
Bond #1 Bond #2

53
index values selected for each bond-link element are given in Fig. 3.4 and in Table 3.5.
The confinement pressure values were estimated based on the definition given in the
CEB-FIB MC90 (1993). As explained in Chapter 2, the ratio of the transverse
reinforcement along the beam longitudinal bars is used for the definition of the
confinement pressure value. The concrete cover and number of reinforcement layers
through depth was another parameter as these are also effective values in determination
of failure mechanism in the bond-slip models.
Table 3.5 Bond Elements for Specimen ED1
Type Bond # 1 Bond # 2
Reinforcement Hooked End Straight Section
Bond Model Perfect Imperfect
Confinement Pressure (MPa) N/A 2.66
Loading and Restraint Conditions:
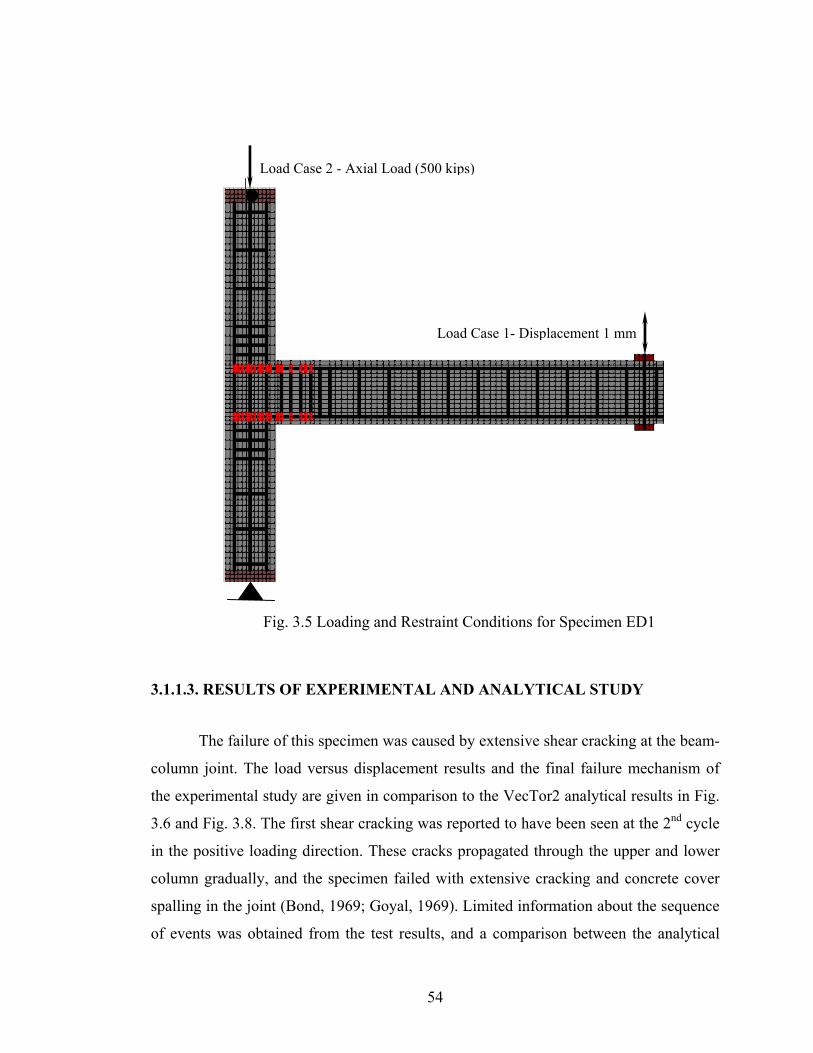
The loading protocol used during testing was followed exactly in the analysis,
including the small cycle intervals, as shown in Fig. 3.5. Load Case 1 was the
horizontally applied displacement-based reversed cyclic loading, and Load Case 2 was
the constant axial load applied to the top of the column. The restraint conditions
consisted of a pinned support at the end of lower column, and a pinned roller support at
the top of the upper column to limit the lateral movement of the column.
54
Fig. 3.5 Loading and Restraint Conditions for Specimen ED1
3.1.1.3. RESULTS OF EXPERIMENTAL AND ANALYTICAL STUDY
The failure of this specimen was caused by extensive shear cracking at the beam-
column joint. The load versus displacement results and the final failure mechanism of
the experimental study are given in comparison to the VecTor2 analytical results in Fig.
3.6 and Fig. 3.8. The first shear cracking was reported to have been seen at the 2nd cycle
in the positive loading direction. These cracks propagated through the upper and lower
column gradually, and the specimen failed with extensive cracking and concrete cover
spalling in the joint (Bond, 1969; Goyal, 1969). Limited information about the sequence
of events was obtained from the test results, and a comparison between the analytical
Load Case 1- Displacement 1 mm
Load Case 2 - Axial Load (500 kips)

55
and experimental results is given in Table 3.6. The ductility ratios in of the specimen the
positive and negative loading directions were estimated, and are given in Fig. 3.6 for
further comparison between the analytical and experimental results. The total energy
dissipation capacities obtained from the predicted and observed response of the
specimen are also compared in Fig. 3.7.
Fig. 3.6 Comparison of Story Shear vs. Story Displacement of Specimen ED1
Fig. 3.7 Comparison of Energy Dissipation of Specimen ED1
0
2
4
6
8
10
0 1 2 3Cycle Number
Ener
gy D
issi
patio
n (k
Nm
)
ΣEANA/ΣEEXP = 0.98
Experimental Analytical
-120
-80
-40
0
40
80
120
-80 -60 -40 -20 0 20 40 60 80
µ3 2 16 5 478
Beam Tip Deflection (mm)
Experimental Analytical
Bea
m T
ip F
orce
(kN
)
µ 1 2 3
µANA(+ve) /µEXP(+ve) = 1.01 µANA(-ve) /µEXP(-ve) = 0.82

56
Fig. 3.8 Comparison of Final Failure of Specimen ED1
Table 3.6 Sequence of Events for Specimen ED1
Experimental Analytical Event
Story Shear (kN)
Displacement (mm)
Story Shear (kN)
Displacement (mm)
Positive Loading Direction
2nd Cycle First Joint Shear Cracking
Max Story Shear 94.00 58.00 98.00 62.00
Negative Loading Direction
Max Story Shear 64.90 62.00 69.30 62.00
End of Testing Failure by Extensive Cracking in Joint Panel Region & Concrete Cover Spalling
In the analytical results, the first shear cracking at the joint was also observed at
the 2nd cycle of the positive loading. Later, the diagonal crack openings at the joint
gradually increased, and a concrete wedge mechanism appeared and was similar to the
experimental results. The expansion of the joint and column with extensive diagonal
Experimental Analytical

57
cracking in opposite directions were also predicted in the final failure figures of the
VecTor2 analysis.
The ratio of the predicted and observed ductility ratios for this specimen was
1.01 in the positive loading direction, and 0.82 in the negative loading direction. The
predicted energy dissipation capacity for this specimen was compared to the observed
value, and a ratio of 0.98 was obtained. As can be seen from the results above, the
VecTor2 analysis was successful in capturing not only the hysteretic behaviour of the
specimen, but the failure mechanism as well.

58
3.1.2 SPECIMEN ED2
The second specimen modelled is from a Benchmark Study (Shiohara and
Kusuhara, 2006) which consisted of seismically designed, interior and exterior beam-
column subassemblies. These specimens were seismically designed according to the AIJ
1999 code revisions. The specimen described in this section represents a ½-scale
exterior beam-column subassembly of a typical moment resisting reinforced concrete
framed building, tested by Shiohara and Kusuhara (2006) at the University of Tokyo,
Japan. There were four other interior beam-column subassemblies tested in the same
study, and these are discussed later in Section 3.2 of this chapter.
3.1.2.1. TEST SPECIMENS
Sectional and Material Properties:
Symmetric sectional details were chosen for both the columns and beams by the
research group in order to exclude dimensional effects. The beam and column were both
300 by 300 mm. The average compressive strength, Young’s modulus, and tensile
splitting strength were 28.3 MPa, 25900 MPa and 2.67 MPa, respectively. The sectional
details of this specimen can be observed in Fig. 3.9.
Fig. 3.9 Sectional Details of Specimen ED2 (Shiohara and Kusuhara, 2006)
Beam Section Column Section

59
Twenty D13 reinforcing bars were used for the longitudinal reinforcement of the
beams. A state-of-the-art data acquisition technique was used to observe the post-
yielding stress and strains on the reinforcement. The sections of the longitudinal bars
were reduced in some sections of beams and columns for this purpose. The reinforcing
bars represented in lighter colour in Fig. 3.9 were these grooved bars. Eight of the
longitudinal reinforcing bars in the beam, and two of the reinforcing bars in the column
was grooved in section. The sections of these bars were reduced by 29%. Detailed
information about the sectional details can be found in the Benchmark Test Report by
Shiohara and Kusuhara (2006). The transverse reinforcement was provided with a 50
mm spacing in all sections of the beam, column and joint. The material properties of the
reinforcement are given in Table 3.7.
Table 3.7 Reinforcement Details for Specimen ED2
Type Grade Diameter (mm)
Area (mm2)
fy (MPa)
Es (MPa)
fu (MPa)
D13 SD390 14 127 456 176000 582
D13 SD345 14 127 357 176300 493
D6 SD295 6 32 326 151300 488
Grooved Longitudinal Reinforcing Bars
D13 SD390 12.1 96 440 167000 566
D13 SD345 11.4 90 356 164000 460
Test Set-Up and Loading:
The beam-column subassemblies were tested under displacement-based reversed
cyclic loading conditions. The displacement-based horizontal loading, and a constant
axial load of 216 kN, were applied to the specimen. It was reported by Shiohara and
Kusuhara (2006) that the axial load was applied to the specimen before the horizontal
displacement loading started, and it was maintained at the same level during the testing.

60
The horizontal and axial loads were applied to the top of the column. The movement of
the free tip of the beam was limited in the vertical direction. The test set-up is shown in
Fig. 3.10.
Fig. 3.10 Test Set-up and Loading System for Specimen ED2
As stated by Shiohara and Kusuhara (2006), the reversed cyclic loading was
applied with increasing displacement amplitudes. The intervals started with 0.0625%
drift and were gradually increased to 1% drift ratio. After the 1% reversed cycle was
finalized, a 0.5% small drift was applied at the end of each 1% drift ratio. At the end of
the 4% drift cycle, the specimens were loaded monotonically until failure occurred. The
unit story drift value corresponded to 1470 mm for this specimen. The loading protocol
followed during testing is given in Fig. 3.11
Constant Axial Load- 216 kNDisplacement - 1 mm

61
Fig. 3.11 Loading Protocol for Specimen ED2
3.1.2.2. FINITE ELEMENT MODELLING
Material and Regional Properties:
The material properties of concrete and reinforcement were modelled using an
approach similar to the one used for Specimen ED1. Three concrete regions were
assigned to represent this beam-column subassembly. The specimen was modelled with
1308 rectangular concrete elements, with a 25 by 25 mm mesh configuration. As
illustrated in Fig. 3.12 and in Table 3.8, the first region is a fictitious concrete zone
added to the model for the reasons described earlier for Specimen ED1. The second and
third regions were assigned to the beams and columns as actual member sections.
-4.0
-3.0
-2.0
-1.0
0.0
1.0
2.0
3.0
4.0
5.0
6.0
Stor
y D
rift R
atio
(%)
Stor
y D
rift R
atio
(%
)
0.06
25 %
0.12
5 %
0. 2
5 %
0. 5
%
1.0
%
0. 5
%
2.0
%
0. 5
%
3.0
%
4.0
%
Positive Loading Direction
Negative Loading Direction

62
Fig. 3.12 Material Regions for Specimen ED2
Table 3.8 Concrete Regions for Specimen ED2
Concrete Regions # 1 #2 # 3 Thickness
(mm) 300
Mesh Size (mm)
25 x 25
Purpose Bearing Beam Column and Joint
Reinforcement D6
ρz (%) None
0.43
All in-plane reinforcement was modelled with discrete truss elements, and
additional smeared reinforcement was used to represent for out-of-plane confinement
effect. The bond elements were also assigned to represent the interaction between
REGION1 REGION2
REGION1
REGION1
REG
ION
3

63
concrete and reinforcement. A total of 655 truss elements and 120 bond-link elements
were used for this specimen. The reinforcement and bond element configuration is
shown in Fig. 3.13, and detailed information about the reinforcement regions is given in
Table 3.9.
Table 3.9 Reinforcement Elements for Specimen ED2
Reinforcement Type Location
# 1 5 D13 (Full Section)
# 2 5 D13 (25% Reduced Section)
Beam Longitudinal
# 3 3 D13 (29% Reduced Section)
# 4 3 D13 (Full Section)
# 5 2 D13 (Full Section)
Column Longitudinal
# 6 1 D6 (Full Section) Transverse Reinforcement

64
Fig. 3.13 Reinforcement and Bond Regions for Specimen ED2
The bond elements were introduced into the model in two regions. As the beam
reinforcement was welded to steel plates, and the transverse reinforcement along the
beam provided moderate confinement for this structure, this section was modelled as a
confined region. The bond-slip effect of the reinforcement was modelled by Bond #2 in
the joint. The section, which represented the interface between the longitudinal
reinforcement in beams outside the joint, was modelled as an unconfined region, and
defined by Bond #1. The confined and unconfined regions were assigned according to
the CEB-FIB MC90 (1993) definitions. The configuration of bond-link elements and
confinement pressure index values selected for each bond-link element is given in Fig.
3.12 and Table 3.10.
Reinforcement # 1 Reinforcement # 2
Reinforcement # 3
Reinforcement # 4
Reinforcement # 5
Bond #1 Bond #2

65
Table 3.10 Bond Elements for Specimen ED2
Type Bond # 1 Bond # 2
Reinforcement Beam Top and Bottom Layer Longitudinal
Confinement Pressure (MPa) 1.4 7.5
Loading and Restraint Conditions:
As described previously, the loading protocol employed during testing
(see Fig. 3.11) was followed in the analysis including the small cycle intervals. Load
Case 1 was the horizontally applied displacement-based reversed cyclic loading, and
Load Case 2 was the constant axial load applied to the top of the column. The lower end
of the column was restrained with a pinned support, and a pinned roller support was
used at the end of the beam allowing only lateral movement of the beam.
3.1.2.3. RESULTS OF EXPERIMENTAL AND ANALYTICAL STUDY
Specimen ED2 experienced flexural cracking at the beam-column interface, and
shear cracking in the joint. A comparison of the story shear versus story drift ratios from
the experimental and the VecTor2 analytical results given in Fig. 3.14, show very
similar behaviour. The sequence of events in positive and negative loading directions of
the specimen were also reported, and these are compared to the VecTor2 analytical
results in Table 3.11 and Table 3.12.
In the experiment, the first flexural and shear cracking was reported at the end of
the 1.0% drift ratio cycle. The yielding of beam longitudinal reinforcement occurred
between 1.0% and 2.0 % drift ratios. At the 2.0% drift cycle, flexural cracks were
reported observed at the upper and lower column ends. Horizontal cracks were reported
between the two steel anchorage plates at the end of the 3.0% drift ratio. The anchorage
plates were also reported to be pushed off from the concrete at the end of the test. The

66
alignment of the upper and lower column was gradually disturbed during testing. Later
these cracks propagated and joined the shear cracks at the center of the joint,
accompanied by the concrete cover spalling and the anchorage plate pushing off the
concrete (Shiohara and Kusuhara, 2006).
Fig. 3.14 Comparison of Story Shear vs. Story Drift Ratio of Specimen ED2
Fig. 3.15 Comparison of Energy Dissipation of Specimen ED2
Experimental Analytical
Story Drift Ratio (%)
Stor
y Sh
ear F
orce
(kN
)
µANA(+ve) /µEXP(+ve) = 0.97 µANA(-ve) /µEXP(-ve) = 0.95
µ 1 2 3 4
µ 4 3 2 1
0
510
15
2025
3035
0 2 4 6 8 10 12 14 16 18 20Cycle Number
Ener
gy D
issi
patio
n (k
Nm
)
ΣEANA/ΣEEXP = 0.97
Experimental Analytical
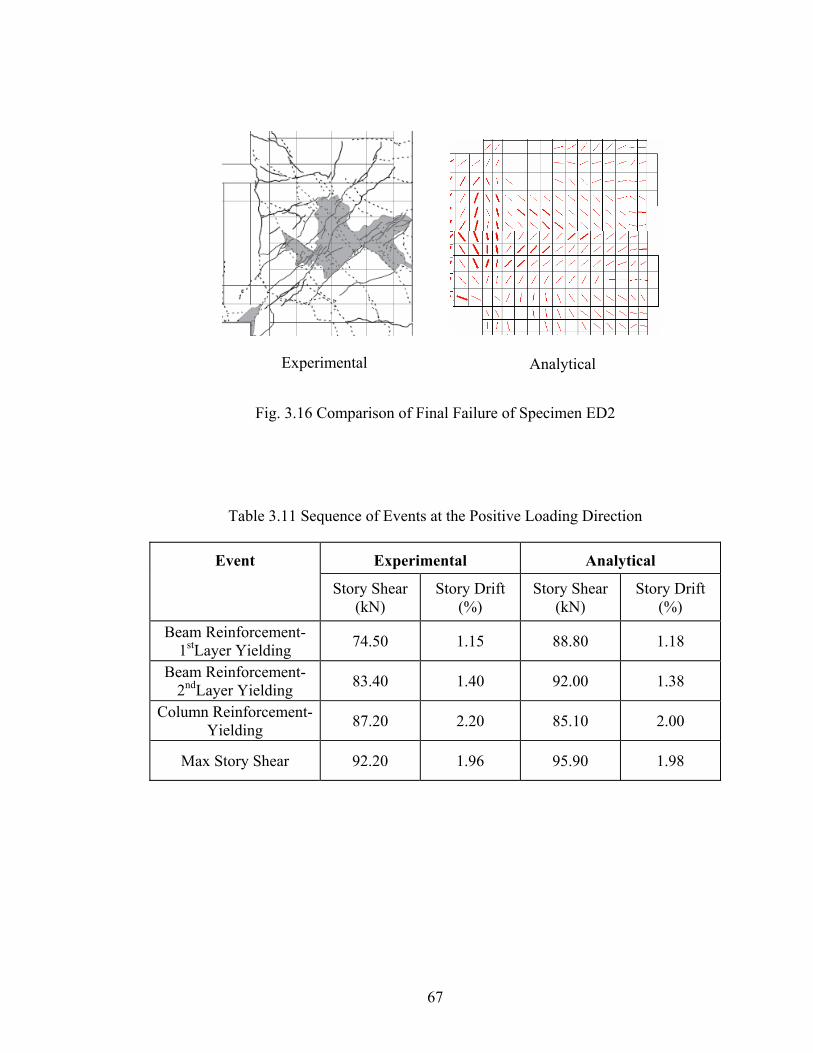
67
Fig. 3.16 Comparison of Final Failure of Specimen ED2
Table 3.11 Sequence of Events at the Positive Loading Direction
Experimental Analytical Event
Story Shear (kN)
Story Drift (%)
Story Shear (kN)
Story Drift (%)
Beam Reinforcement- 1stLayer Yielding 74.50 1.15 88.80 1.18
Beam Reinforcement- 2ndLayer Yielding 83.40 1.40 92.00 1.38
Column Reinforcement- Yielding 87.20 2.20 85.10 2.00
Max Story Shear 92.20 1.96 95.90 1.98
Experimental Analytical

68
Table 3.12 Sequence of Events at the Negative Loading Direction
Experimental Analytical Event
Story Shear (kN)
Story Drift (%)
Story Shear (kN)
Story Drift (%)
Beam Reinforcement- 1stLayer Yielding 63.70 0.98 68.10 0.79
Beam Reinforcement- 2ndLayer Yielding 79.30 1.38 81.20 1.19
Column Reinforcement- Yielding 87.20 1.55 85.00 1.58
Max Story Shear 91.10 1.95 88.90 1.98
The experimental results for the formation of cracks at 1.0%, 2.0% and 3.0%
drift ratios are also compared to the analytical results in Fig. 3.17, Fig. 3.18, and Fig.
3.19.
Fig. 3.17 Failure at the 1% Drift Ratio
Analytical Experimental

69
Fig. 3.18 Failure at the 2% Drift Ratio
Fig. 3.19 Failure at the 3% Drift Ratio
According to the crack formation figure that is given in Fig. 3.17, the shear
cracks at the joint and the flexural cracks at the beam-column interface were observed
similar to experimental results at the 1.0% drift cycle. Later at the 2.0% drift cycle,
analytical results showed the propagation of these flexural cracks in the beam, as shown
in Fig. 3.18. The flexural cracks between the anchorage plates were also observed at the
3.0% drift ratio which increased in the last cycle. The joint and the alignment of the
column were gradually disturbed with the formation of these cracks. However, the
specimen maintained its strength at the final loading cycle in both loading directions
contrary to the experimental hysteretic response.
Experimental Analytical
Experimental Analytical

70
The ratio of the predicted and observed ductility ratios for this specimen was
0.97 in the positive loading direction, and 0.95 in the negative loading direction. The
predicted energy dissipation capacity for this specimen was also compared to the
observed value, and a ratio of 0.97 was obtained.
A comparison of the results for this specimen suggests a reasonably good
correlation between the predicted and observed behaviour. Similar failure mechanisms
were captured with the VecTor2 analysis of this specimen. The crack formations and
crack widths were also predicted quite similar to the experimental results. As can be
seen in Table 3.12 and 3.13, the comparisons of the sequence of events at the positive
and negative loading directions were also a good match to the actual behaviour of the
specimen.

71
3.1.3 SPECIMEN ED3
Non-seismically designed beam-column subassemblies were also modelled using
VecTor2 in this thesis. These specimens were tested by Chen (2006) at the University of
Canterbury, New Zealand to obtain seismic assessment information for pre-1970s
reinforced concrete moment resisting frame buildings. The two specimens in this group
were 2/3-scale exterior beam-column subassemblies which were tested under simulated
gravity and seismic loading conditions. There are two subsets of specimens in this
group; i) beam-column subassemblies reinforced with deformed reinforcement and ii)
ones with smooth reinforcement. In this section, the deformed reinforcement specimens
are discussed. The smooth reinforcement specimens are examined in Chapter 4.
The specimens in this group were designed with structural deficiencies such as
unconfined beam-column joints and low quality concrete. Also, they did not adhere to
the weak beam-strong column design philosophy for ductile failure mechanism,
reflecting typical pre-1970s non-seismically designed structural members. Two of the
exterior beam-column subassemblies were identical in geometry, loading conditions, and
material properties. However, the reinforcement detailing was slightly different from
one group to the other.
3.1.3.1. TEST SPECIMENS
Sectional and Material Properties:
The specimens were designed using beams that were deep relative to the
columns. The beams were 200 by 330 mm, and the columns were 230 by 230 mm. The
material properties of the concrete were similar for each specimen, and can be seen in
Table 3.13.
All specimens were designed with the same column capacity and beam-column
joint detailing. The longitudinal reinforcement used for these specimens was D10
deformed reinforcing bars. Smooth reinforcing bars were used for the transverse

72
reinforcement with a 100 mm spacing in the columns and a 133 mm spacing in the
beams. The joint was reinforced with only one transverse R6 reinforcing bar, to address
the unconfined joint deficiency in non-seismically designed beam-column
subassemblies. The material properties of the reinforcement are given in Table 3.14.
Table 3.13 Material Properties of Concrete for Specimen ED3 (Chen, 2006)
Specimen fc
(MPa) Ec
(MPa)
TDD1 23.3 28700
TDD2 24.7 28700
Table 3.14 Material Properties of Reinforcement for Specimen ED3 (Chen, 2006)
Type Grade Diameter (mm)
Area (mm2)
fy (MPa)
Es (MPa)
fu (MPa)
D10 300 10 127 357 176300 493
R6 300 6 32 326 151300 488
Detailed information on the reinforcement layout is given in Fig. 3.20 and Table
3.15. The longitudinal reinforcement of the beam was different for the deformed and
smooth reinforcement specimens. The longitudinal reinforcement in the beam was
partially anchored into the joint, but the anchorage that was provided was insufficient to
supply enough confinement in the joint.

73
Table 3.15 Reinforcement Detailing for Specimen ED3 (Chen, 2006)
Beam Column Specimen
Longitudinal Transverse Longitudinal Transverse Joint
TDD1 4 D10 2 D10
3 D10 3 D10
TDD2 6 D10 4 D10
R6
@
133 mm 3 D10 3 D10
R6
@
100 mm
1-R6
Fig. 3.20 Reinforcement Detailing for Specimen ED3 (Chen, 2006)
Test Set-Up and Loading:
The test set-up was designed to simulate the behaviour of an exterior beam-
column subassembly under seismic loading conditions (see Fig. 3.21). A displacement-
controlled loading system was used to apply the horizontal force to the top of the column

74
until the lateral drift of the column reached a particular level. As reported by Chen
(2006), three different loads were applied to the top of the column in these specimens:
horizontal reversed cyclic loading, constant axial loading, and varying axial loading
based on the story shear force. The axial loading consisted of the constant 75 kN axial
load and the varying axial load equal to 1.8 times the shear force. The direction of this
second axial load changed based on the loading direction during testing. The test set-up
was designed to allow for a free rotation of the column and a horizontal rotation of the
beam end with pin roller restraints. A graphical representation of the linear relation
between shear force and axial load is given in Fig. 3.22.
Fig. 3.21 Test Set-up for Specimen ED3 (Pampanin et al, 2006)

75
Fig. 3.22 Axial Load vs. Story Shear for Specimen ED3
The loading protocol followed for these specimens is given in Fig. 3.23. They
were subjected to two consecutive cycles of drift ratios ranging from 0.1% to 4 %. After
the 0.5% drift level (first shear cracking in the joint region), a small cycle of 0.25% drift
following each main drift level was applied to the specimens (Chen, 2006).
Fig. 3.23 Loading Protocol for Specimen ED3
-5.0
-4.0
-3.0
-2.0
-1.0
0.0
1.0
2.0
3.0
4.0
5.0
Stor
y D
rift R
atio
(%)
Stor
y D
rift R
atio
(%
) Positive Loading Direction
Negative Loading Direction
0.25
%
0.1
%
0.2
%
0.5
%
0.25
%
1.0
%
2.0
%
2.5
%
3.0
%
4.0
%
1.5
%
0.25
%
0.25
%
0.25
%
0.25
%
0
25
50
75
100
125
150
-30 -20 -10 0 10 20 30
Vc, Story Shear (kN)
VA, C
olum
n A
xial
Loa
d (k
N)
VA = 75 ± 1.8 * Vc

76
3.2.2.2. FINITE ELEMENT MODELLING
Material and Regional Properties:
Seven concrete regions were defined in modelling these specimens. A total of
1796 rectangular concrete elements, with a 25 by 25 mm mesh configuration, were used
to represent these beam-column subassemblies. Due to different transverse
reinforcement configurations, additional regions were assigned to the specimen. Detailed
information about the concrete regions is given in Fig. 3.24 and Table 3.16.
Fig. 3.24 Material Regions for Specimen ED3
REGION3
REGION1
REGION1
REG
ION
2
REG
ION
2
REG
ION
4
REGION6
REGION7
REGION7
REGION5
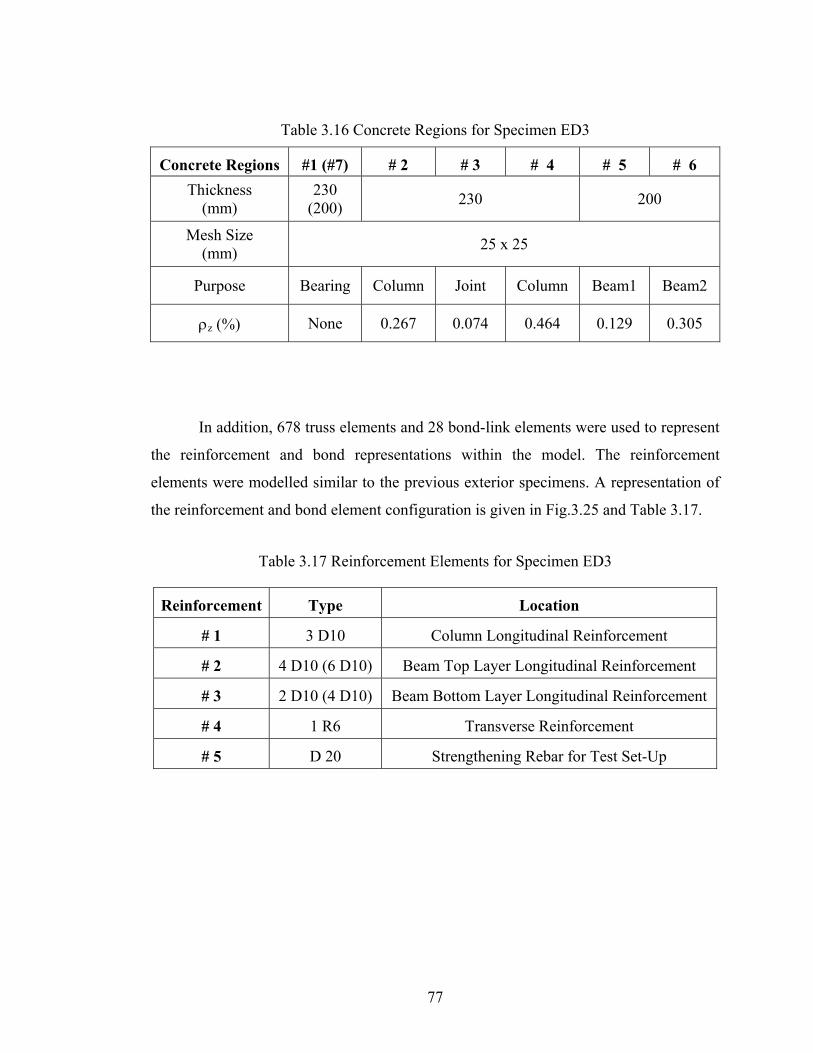
77
Table 3.16 Concrete Regions for Specimen ED3
Concrete Regions #1 (#7) # 2 # 3 # 4 # 5 # 6 Thickness
(mm) 230
(200) 230 200
Mesh Size (mm) 25 x 25
Purpose Bearing Column Joint Column Beam1 Beam2
ρz (%) None 0.267 0.074 0.464 0.129 0.305
In addition, 678 truss elements and 28 bond-link elements were used to represent
the reinforcement and bond representations within the model. The reinforcement
elements were modelled similar to the previous exterior specimens. A representation of
the reinforcement and bond element configuration is given in Fig.3.25 and Table 3.17.
Table 3.17 Reinforcement Elements for Specimen ED3
Reinforcement Type Location
# 1 3 D10 Column Longitudinal Reinforcement
# 2 4 D10 (6 D10) Beam Top Layer Longitudinal Reinforcement
# 3 2 D10 (4 D10) Beam Bottom Layer Longitudinal Reinforcement
# 4 1 R6 Transverse Reinforcement
# 5 D 20 Strengthening Rebar for Test Set-Up

78
Fig. 3.25 Reinforcement Regions for Specimen ED3
The bond at the interface between the reinforcement and concrete was modelled
in a similar way to Specimen ED1 in this chapter. Perfect bond was specified for the
hooked end, and an unconfined concrete region was used for the rest of the beam
longitudinal reinforcement based on the CEB-FIB MC90 (1993) definitions. The
configuration of the bond-link elements, and the confinement pressure index values
selected for each bond-link element, are given in Fig. 3.25 and in Table 3.18.
Reinforcement # 1
Reinforcement # 2
Bond #1 Bond #2
Reinforcement # 3

79
Table 3.18 Bond Elements for Specimen ED3
Type Bond # 1 Bond # 2
Reinforcement Hook End Straight Section
Bond Model Perfect Imperfect
Confinement Pressure (MPa) N/A 0.50
Loading and Restraint Conditions:
The loading protocol used during testing (see Fig. 3.23) was followed exactly in
the analyses including the small cycle intervals. Load Case 1 was the horizontally
applied displacement-based reversed cyclic loading, Load Case 2 had a constant axial
load applied to the top of the column, and Load Case 3 included the changing
component of the vertical column load which was a function of the storey shear force
experienced by the member. The simulated loading and the restraint conditions are
shown below in Fig. 3.26.
The loading for this type of testing was a challenge to model with VecTor2. It
could only be modelled approximately. Firstly, a reversed cyclic analysis was performed
only with the first and second load case, and then the lateral load values were obtained at
each cycle and were introduced in the third load case. As the number of load stages was
defined by the first load case, the changing axial load applied as the third load case was
implemented based on the loading procedure of the first load case. The restraints
included a pinned support on the lower end of the column, and two pinned roller
supports on the beam 1525 mm away from the centerline of the column.

80
Fig. 3.26 Loading and Restraint Conditions for Specimen ED3
3.1.2.3. RESULTS OF EXPERIMENTAL AND ANALYTICAL STUDY
Specimen TDD1
This specimen was reported to experience large flexural cracking at the beam-
column interface and concrete spalling from the back of the column at the joint. The
story shear force versus lateral displacement behaviour is given above in Fig. 3.27 in
comparison to VecTor2 analytical results. The observed and predicted response showed
very good correlation in terms of capturing the different peak story shear force and
ultimate displacement values. As the beam longitudinal reinforcement arrangements in
Load Case 2 Constant Axial Load – 75 kN
Load Case 1- Displacement – 1 mm
Load Case 3 Changing Axial Load - ±1.8*Vc

81
the top and bottom layer were at a ratio of 2:1, the shear force response of the specimen
followed a similar ratio, 16 kN and 8 kN, respectively.
Fig. 3.27 Comparison of Story Shear vs. Story Drift Ratio for Specimen TDD1
Fig. 3.28 Comparison of Energy Dissipation of Specimen TDD1
The ratio of the predicted to the observed ductility ratio for this specimen was
1.10 in the positive loading direction, and 1.08 in the negative loading direction. The
Story Drift Ratio (%)
Stor
y Sh
ear F
orce
(kN
)
Experimental Analytical
µANA(+ve) /µEXP(+ve) = 1.10 µANA(-ve) /µEXP(-ve) = 1.08
µ 1 2 3 4
µ4 3 2 1
012345678
0 2 4 6 8 10 12 14 16 18 20
Ener
gy D
issi
patio
n (k
Nm
)
ΣEANA/ΣEEXP = 1.27
Experimental Analytical
Cycle Number

82
predicted energy dissipation capacity for this specimen was also compared to the
observed value, and a ratio of 1.27 was obtained.
The flexural cracking failure mechanism at the beam-column interface was
successfully captured in the analytical study (see Fig. 3.29). However, the crack
formation and failure mechanism figure obtained from Augustus represented a flexural-
shear cracking zone at the beam-column face. This was the combination of separate but
close flexural cracks similar to the behaviour observed during the tests in Fig. 3.29. The
flexural cracking was observed extensively on the bottom surface of the beam similar to
the test results, but the crack formation shown in Fig. 3.29 was probably taken when
zero loading was applied to the specimen. The cracks on the top surface of the beam can
be seen in a picture from the back side of the specimen in Fig. 3.30. The shear cracks in
the joint that occurred at the column left lower side and right upper side during testing
were also observed in the predicted response. Although a wide area of shear crack
formation that might possibly form a concrete wedge was observed, the flexural
cracking at the beam-column face limited this formation and defined the failure
mechanism of this specimen. The sequence of events observed during the test and
computed during the analysis showed good correlation, as seen in Table 3.19.
Fig. 3.29 Comparison of Final Failure for Specimen TDD1
Experimental Analytical

83
Fig. 3.30 Final Failure at the back side of Specimen TDD1 (from Chen, 2006)
Table 3.19 Sequence of Events for Specimen TDD1
Experimental Analytical Event
Story Shear (kN)
Story Drift (%)
Story Shear (kN)
Story Drift (%)
Positive Loading Direction
Beam Hinging 16.00 0.50 17.30 0.50
Max Story Shear 18.00 3.00 18.00 3.00
Negative Loading Direction
Beam Hinging 8.00 0.50 9.20 0.50
Max Story Shear 10.00 2.00 9.80 3.00
Overall, the predicted response for this specimen was a good match to the
observed response. The only difference between observed and predicted response was
the story shear force at the final loading stage, which was approximately 60%. The
strength degradation at this final stage couldn’t be captured due to the lack of concrete
wedge effect at the column. As the shear cracking wasn’t captured in the analytical

84
response, the shear force versus displacement curve did not experience any pinching
effect at this final stage.
Specimen TDD2
A brittle joint failure mechanism was observed at the end of the testing.
According to the experimental results, the first shear crack within the joint was observed
at the 0.65% drift ratio in both loading directions. Later, a concrete wedge mechanism
was formed with the propagation of individual shear cracks at the 3.0% drift ratio. The
story shear force versus story drift ratio for his specimen is given in Fig. 3.31.
Fig. 3.31 Comparison of Story Shear vs. Story Drift Ratio for Specimen TDD2
Story Drift Ratio (%)
Stor
y Sh
ear F
orce
(kN
)
Experimental Analytical
µANA(+ve) /µEXP(+ve) = 0.92 µANA(-ve) /µEXP(-ve) = 1.15
µ 4 3 2 1
µ 1 2 3 4

85
The brittle joint failure was also observed in the VecTor2 analytical results, and a
comparison of the experimental and analytical results for the crack formation and failure
mode of this specimen is shown in Fig. 3.33. The VecTor2 analysis was also successful
in capturing the sequence of events, which is also given in comparison to the
experimental results in Table 3.20.
Fig. 3.32 Comparison of Energy Dissipation of Specimen TDD2
The ratio of the predicted and observed ductility ratios for this specimen was
0.92 in the positive loading direction, and 1.15 in the negative loading direction. The
predicted energy dissipation capacity for this specimen was also compared to the
observed value, and a ratio of 0.70 was obtained.
0
1
2
3
4
5
6
7
0 2 4 6 8 10 12 14 16 18 20 22 24 26
Cycle Number
Ener
gy D
issi
patio
n (k
Nm
)
ΣEANA/ΣEEXP = 0.70
Experimental Analytical

86
Fig. 3.33 Comparison of Final Failure for Specimen TDD2
Table 3.20 Sequence of Events for Specimen TDD2
Experimental Analytical Event
Story Shear (kN)
Story Drift (%)
Story Shear (kN)
Story Drift (%)
Positive Loading Direction
First Joint Shear Cracking 21.00 0.65 23.30 0.75
Concrete Wedge Mechanism 12.00 3.00 10.80 2.75
Max Story Shear 23.00 1.00 24.50 0.80
Negative Loading Direction
First Joint Shear Cracking 16.00 0.65 17.00 0.75
Concrete Wedge Mechanism 12.00 3.00 11.00 2.85
Max Story Shear 16.00 1.00 17.00 0.60
Experimental Analytical

87
Different crack formations and failure mechanisms successfully matched the
experimental results for both specimens. The excessive flexural cracking at the beam-
column interface observed at the Specimen TDD1, and the concrete wedge at the joint
due to extensive shear cracking at the Specimen TDD2, were also successfully captured
within the analytical results. The sequence of events were also compared in Table 3.19
and Table 3.20. Based on these comparisons, the first crack formation, and the
propagation of the cracks at each loading directions were close to the actual behaviour of
the specimen. The maximum story shear force was also estimated at similar drift ratios
by the VecTor2 analysis.
3.1.4. DISCUSSION ON EXTERIOR BEAM-COLUMN SUBASSEMBLIES
The VecTor2 analysis of the exterior beam-column subassemblies described in
the previous sections provided accurate simulations of the load-deformation responses.
The predicted peak shear force values for all exterior specimens designed with deformed
reinforcement are compared to the observed shear force values, in the positive and
negative loading directions, are given in Table 3.21 and Table 3.22.
A total of four exterior specimens were modelled, and the peak shear force
results suggest a mean of 1.04 and a coefficient of variation of 2.26 % for the positive
loading direction. The ultimate displacement results suggest a mean of 1.03 and a
coefficient of variation of 4.00 % in the same loading direction. As for the same
comparison at the negative loading direction, the ratio of the predicted to the observed
shear force capacity had a mean of 1.02, and a coefficient of variation of 4.28%. The
ultimate displacement results suggest a mean of 0.99 and a coefficient of variation of
1.21 %.
There is a better correlation in the positive loading direction. The possible reason
for that is the difference in the actual bond-slip behaviour and the model that is currently
used in VecTor2 under cyclic loading conditions. The changing bond-slip effects after
the loading direction was changed couldn’t be captured instantaneous as it was in the
actual behaviour. This might be the reason for slight overestimations in the strength in

88
the negative loading direction. This difference was further explained in Chapter 2.
Overall the predicted response of the exterior specimens designed with deformed
reinforcement was successful in estimating the crack formations, load-deformation
characteristics and energy dissipation capacity.
Table 3.21 Comparison of Peak Shear Force at the Positive Loading Direction
Specimen Vmax (EXP) (kN)
Vmax (VT2) (kN)
Vmax (VT2)/ Vmax (EXP)
ED1 94.0 98.0 1.04
ED2 92.2 95.6 1.04
ED31 (TDD1) 18.0 18.0 1.00
ED32 (TDD2) 23.0 24.5 1.07
Mean 1.04
St. Dev 0.02
COV (%) 2.26
Table 3.22 Comparison of Peak Shear Force at the Negative Loading Direction
Specimen Vmax (EXP) (kN)
Vmax (VT2) (kN)
Vmax (VT2)/ Vmax (EXP)
ED1 64.9 69.3 1.07
ED2 91.1 88.9 0.98
ED31 (TDD1) 10.0 9.8 0.98
ED32 (TDD2) 16.0 17.0 1.06
Mean 1.02
St. Dev 0.04
COV (%) 4.28

89
Table 3.23 Comparison of Ultimate Displacement at the Positive Loading Direction
Specimen Δmax (EXP) (mm)
Δmax (VT2) (mm)
Δmax (VT2)/ Δmax (EXP)
ED1 58.0 62.0 1.07
ED2 74.0 79.0 1.08
ED31 (TDD1) 60.0 59.6 0.99
ED32 (TDD2) 80.0 79.3 0.99
Mean 1.03
St. Dev 0.04
COV (%) 4.00
Table 3.24 Comparison of Ultimate Displacement at the Negative Loading Direction
Specimen Δmax (EXP) (mm)
Δmax (VT2) (mm)
Δmax (VT2)/ Δmax (EXP)
ED1 62.0 62.0 1.00
ED2 59.0 58.0 0.99
ED31 (TDD1) 60.0 59.6 0.99
ED32 (TDD2) 82.0 79.4 0.97
Mean 0.99
St. Dev 0.01
COV (%) 1.21
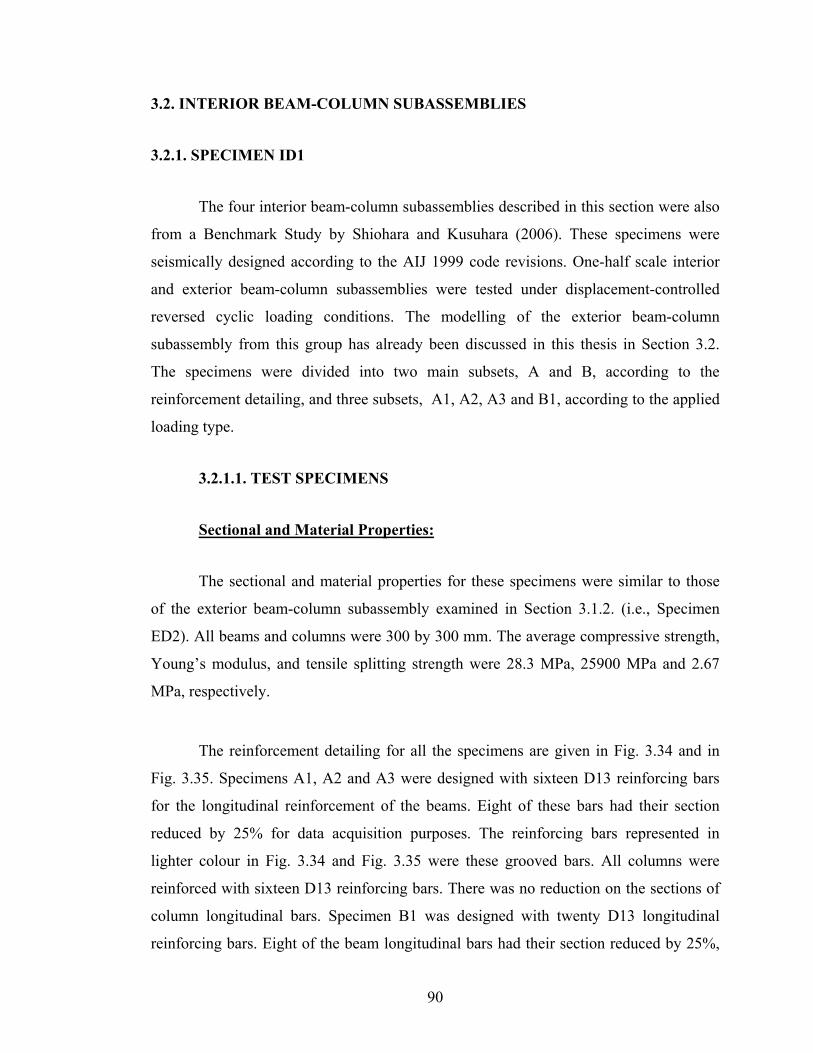
90
3.2. INTERIOR BEAM-COLUMN SUBASSEMBLIES
3.2.1. SPECIMEN ID1
The four interior beam-column subassemblies described in this section were also
from a Benchmark Study by Shiohara and Kusuhara (2006). These specimens were
seismically designed according to the AIJ 1999 code revisions. One-half scale interior
and exterior beam-column subassemblies were tested under displacement-controlled
reversed cyclic loading conditions. The modelling of the exterior beam-column
subassembly from this group has already been discussed in this thesis in Section 3.2.
The specimens were divided into two main subsets, A and B, according to the
reinforcement detailing, and three subsets, A1, A2, A3 and B1, according to the applied
loading type.
3.2.1.1. TEST SPECIMENS
Sectional and Material Properties:
The sectional and material properties for these specimens were similar to those
of the exterior beam-column subassembly examined in Section 3.1.2. (i.e., Specimen
ED2). All beams and columns were 300 by 300 mm. The average compressive strength,
Young’s modulus, and tensile splitting strength were 28.3 MPa, 25900 MPa and 2.67
MPa, respectively.
The reinforcement detailing for all the specimens are given in Fig. 3.34 and in
Fig. 3.35. Specimens A1, A2 and A3 were designed with sixteen D13 reinforcing bars
for the longitudinal reinforcement of the beams. Eight of these bars had their section
reduced by 25% for data acquisition purposes. The reinforcing bars represented in
lighter colour in Fig. 3.34 and Fig. 3.35 were these grooved bars. All columns were
reinforced with sixteen D13 reinforcing bars. There was no reduction on the sections of
column longitudinal bars. Specimen B1 was designed with twenty D13 longitudinal
reinforcing bars. Eight of the beam longitudinal bars had their section reduced by 25%,

91
and six of the longitudinal bars had their section reduced by 29%. As for the transverse
reinforcing bars, D6 reinforcing bars were used with a 50 mm spacing in the beams,
columns and joints. The material properties of reinforcing steel are given in Table 3.25.
Fig. 3.34 Sectional Details for Specimens A1, A2, A3 (Shiohara and Kusuhara, 2006)
Fig. 3.35 Sectional Details for Specimen B1 (Shiohara and Kusuhara, 2006)
Table 3.25 Material Properties of Reinforcement (Shiohara and Kusuhara, 2006)
Type Grade Diameter (mm)
Area (mm2)
fy (MPa)
Es (MPa)
fu (MPa)
D13 SD390 14 127 456 176000 582
D13 SD345 14 127 357 176300 493
D6 SD295 6 32 326 151300 488
Grooved Longitudinal Reinforcing Bars
D13 SD390 12.1 96 440 167000 566
D13 SD345 11.4 90 460 163000 460
Beam Section Column Section
Beam Section Column Section

92
Test Set-Up and Loading:
The beam-column subassemblies were tested under displacement-controlled
reversed cyclic loading conditions. The displacement-based load was applied
horizontally at different amplitudes, and the axial load was constant, 216 kN, at all
times. Three different loading types were reported by Shiohara and Kusuhara (2006).
The horizontal load and axial load were applied to the top of the upper column for the
Loading Type I case. The beam ends were restrained with pinned roller supports, and the
column with a pinned support. The test set-up for Loading Type I is shown in Fig. 3.36.
Fig. 3.36 Loading Type I
In the Loading Type II case, the loading system remained the same, but the
restraint conditions were changed slightly. The pinned roller support at the right beam
end was removed, and the rest of the restraint conditions were kept the same as
illustrated in Fig. 3.37.
Axial Load (Constant)
Horizontal Load
1350 mm 1350 mm
735 mm
735 mm

93
Fig. 3.37 Loading Type II
For the Loading Type III case, both the restraint conditions, and the loading
system were changed. The lateral load was applied to the end of the left beam, and the
pinned roller support at the end of this beam was kept. The end of the left beam however
was completely free to move in each direction. The pinned support at the end of the
lower column was also kept the same in this loading system (see Fig. 3.38).
Fig. 3.38 Loading Type III
Axial Load (Constant)
Horizontal Load
1350 mm 1350 mm
735 mm
735 mm
Free
735 mm
735 mm
Axial Load (Constant)
Horizontal Load
1350 mm 1350 mm
Free

94
As stated in the report by Shiohara and Kusuhara (2006), the loading protocol
employed during testing for all of these specimens is given in Fig. 3.39.
Fig. 3.39 Loading Protocol for Specimen ID1 (Shiohara and Kusuhara, 2006)
3.2.1.2. FINITE ELEMENT MODELLING
Material and Regional Properties:
The specimens were all modelled with three concrete regions, and with a total of
1782 concrete elements using a 25 by 25 mm mesh configuration. As shown in Fig. 3.40
and Table 3.26, the first region was the fictitious concrete region. The second and third
regions were assigned to the beams and columns of these specimens. The smeared
reinforcement ratio, ρz, was estimated using the transverse reinforcement ratio in the
out-of-plane direction in all sections of the specimens.
-4.0
-3.0
-2.0
-1.0
0.0
1.0
2.0
3.0
4.0
5.0
6.0St
ory
Drif
t Rat
io (%
)St
ory
Drif
t Rat
io (
%) 0.
0625
%
0.12
5 %
0. 2
5 %
0. 5
%
1.0
%
0. 5
%
2.0
%
0. 5
%
3.0
%
4.0
%
Positive Loading Direction
Negative Loading Direction

95
Fig. 3.40 Material Regions for Specimen ID1
Table 3.26 Concrete Regions for Specimen ID1
Concrete Regions # 1 # 2 # 3 Thickness
(mm) 300
Mesh Size (mm)
25 x 25
Purpose Bearing Beam and Joint Column
ρz (%) None 0.43
A total of 1039 truss elements and 188 bond-link elements for Specimens A1, A2
and A3, and 891 truss elements and 196 bond-link elements for Specimen B1 were used
for the reinforcement and bond representations in the models. The reinforcement was
modelled using discrete truss bar elements. The reinforcement and bond element
configuration is shown in Fig. 3.41, and detailed information about these properties is
given in Table 3.27. The layout for the reinforcement and bond regions are only shown
here for the Series A Specimens. As for Specimen B1, the beam reinforcement
REGION1 REGION2
REGION1
REGION1
REG
ION
3
REGION2 REGION1

96
configuration was similar to the exterior beam-column subassembly (i.e. Specimen ED2)
that was presented earlier in this chapter.
Table 3.27 Reinforcement Elements for Specimen ID1
Reinforcement Type Location
Specimen A1, A2, A3
# 1 4 D13 (Full Section)
# 2 4 D13 (25% Reduced Section)
Beam Longitudinal
# 3 5 D13 (Full Section)
# 4 2 D13 (Full Section)
Column Longitudinal
# 5 1 D6 (Full Section)
Transverse Reinforcement
Specimen B1
# 1 5 D13 (Full Section)
# 2 5 D13 (25% Reduced Section)
Beam Longitudinal
# 3 3 D13 (29% Reduced Section)
# 4 3 D13 (Full Section)
# 5 2 D13 (Full Section)
Column Longitudinal
# 6 1 D6 (Full Section) Transverse Reinforcement

97
As the transverse reinforcement along the beam provided moderate confinement
for member, bond elements were introduced into the model in confined and unconfined
bond regions. The confined region was located in the beam-column joint, and was
defined by Bond #2 in the model. The bond elements defined by Bond #1 were assigned
to the longitudinal bars away from the joint. The configuration of the bond-link elements
and confinement pressure index values selected for each bond-link element are given in
Fig. 3.41 and Table 3.28.
Fig. 3.41 Reinforcement Regions for Specimen ID1
Table 3.28 Bond Elements for Specimen ID1
Type Bond # 1 Bond # 2
Reinforcement Beam Top and Bottom Layer Longitudinal
Confinement Pressure (MPa) 1.4 7.5
Reinforcement #1
Reinforcement # 3
Reinforcement # 4
Reinforcement #1Reinforcement #2
Bond #1Bond #1 Bond #2
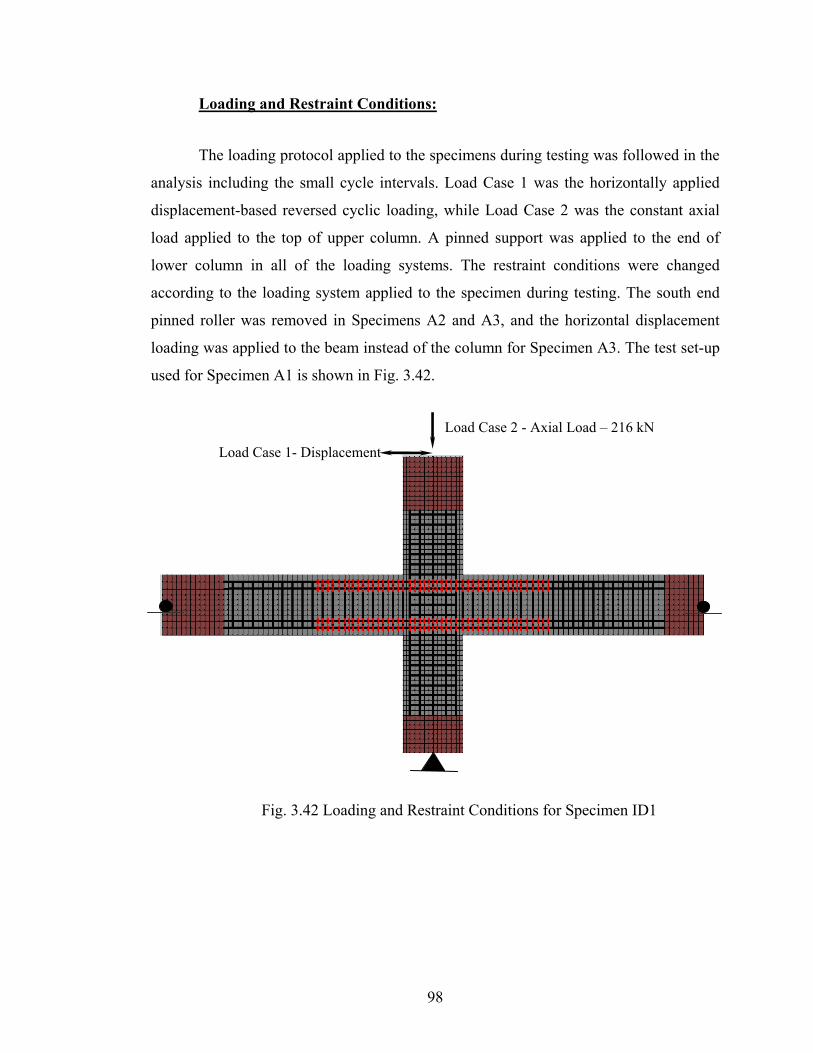
98
Loading and Restraint Conditions:
The loading protocol applied to the specimens during testing was followed in the
analysis including the small cycle intervals. Load Case 1 was the horizontally applied
displacement-based reversed cyclic loading, while Load Case 2 was the constant axial
load applied to the top of upper column. A pinned support was applied to the end of
lower column in all of the loading systems. The restraint conditions were changed
according to the loading system applied to the specimen during testing. The south end
pinned roller was removed in Specimens A2 and A3, and the horizontal displacement
loading was applied to the beam instead of the column for Specimen A3. The test set-up
used for Specimen A1 is shown in Fig. 3.42.
Fig. 3.42 Loading and Restraint Conditions for Specimen ID1
Load Case 2 - Axial Load – 216 kN Load Case 1- Displacement

99
3.2.1.3. RESULTS OF EXPERIMENTAL AND ANALYTICAL STUDY
In this section, the analysis results are compared to the experimental results in
terms of the hysteretic response, crack formation failure mechanisms, and sequence of
events. The results of each specimen in this group were individually discussed in
comparison to the predicted response by the VecTor2 analysis.
SPECIMEN A1
In the experiment, a pinched hysteresis response was observed in the story shear
force versus story displacement behaviour. The observed behaviour was summarized
from the Benchmark Test Report by Shiohara and Kusuhara (2006). This beam-column
subassembly failed under high shear deformations with the concrete cover bulging and
crushing at the beam end, near the joint, at the 2.0% story drift ratio. Later, concrete
cover spalling occurred at the 3.0% story drift ratio and severe joint deformation was
visible during the last cycle at the 4.0% story drift ratio. The beams remained elastic
with no deformation throughout the loading, but extensive shear deformations were
observed in the joint. No plastic hinging was observed in the beams. After the beam bars
yielded, the beam-column joint face rotation and the expansion of the joint were
significantly increased. (Shiohara and Kusuhara, 2006)
The predicted hysteretic response of this specimen shows a very close match to
the experimental results (see Fig. 3.43). The sequence of events of the specimen are also
given in comparison to the experimental results for both loading directions in Table 3.28
and Table 3.29. The predicted crack formations and the failure mechanisms at 1.0%,
2.0%, and 3.0% drift cycles were also compared to the observed behaviour, and are
shown in Fig. 3.46, Fig. 3.47 and Fig. 3.48. The analysis results predicted this excessive
shear cracking in the joint starting at the 1.0% drift cycle. At a drift ratio of 2.0%, these
diagonal cracks were propagating in the joint. As a result, the joint region was highly
disturbed, and the specimen started losing its strength at the end of this drift cycle. Later
these cracks gradually increased, and the specimen lost nearly half of its strength. The
difference in the energy dissipation capacity between the observed and predicted

100
response suggest that smaller bond-slip effects were experienced in the specimen during
testing. This suggestion was also confirmed by the difference in the shape of hysteresis
as it was more pinched compared to the observed behaviour.
Fig. 3.43 Comparison of Story Shear vs. Story Drift Ratio of Specimen A1
Fig. 3.44 Comparison of Energy Dissipation of Specimen A1
0
5
10
15
20
25
0 2 4 6 8 10 12 14 16 18 20
ΣEANA/ΣEEXP = 0.83
Experimental Analytical
Ener
gy D
issi
patio
n (k
Nm
)
Cycle Number
Experimental Analytical
Story Drift Ratio (%)
Stor
y Sh
ear F
orce
(kN
)
µANA(+ve) /µEXP(+ve) = 0.91 µANA(-ve) /µEXP(-ve) = 1.03
µ 1 2 3 4
µ 4 3 2 1

101
The ratio of the predicted and observed ductility ratios for this specimen was
0.91 in the positive loading direction, and 1.03 in the negative loading direction. The
predicted energy dissipation capacity for this specimen was also compared to the
observed value, and a ratio of 0.83 was obtained.
Fig. 3.45 Comparison of Final Failure of Specimen A1
Table 3.29 Sequence of Events at the Positive Loading Direction for Specimen A1
Experimental Analytical Event
Story Shear (kN)
Story Drift (%)
Story Shear (kN)
Story Drift (%)
Beam Reinforcement- 1stLayer Yielding 118.60 1.48 122.50 1.19
Beam Reinforcement- 2ndLayer Yielding 126.60 2.30 128.60 1.28
Column Reinforcement- Yielding 126.60 2.30 128.60 1.28
Max Story Shear 126.60 2.30 128.60 1.28
Experimental Analytical

102
Table 3.30 Sequence of Events at the Negative Loading Direction for Specimen A1
Experimental Analytical Event
Story Shear (kN)
Story Drift (%)
Story Shear (kN)
Story Drift (%)
Beam Reinforcement- 1stLayer Yielding 113.90 1.58 117.30 1.18
Beam Reinforcement- 2ndLayer Yielding 121.10 1.86 124.00 1.28
Column Reinforcement- Yielding 119.70 1.79 129.30 1.39
Max Story Shear 122.80 1.96 130.00 1.48
Fig. 3.46 Comparison of Failure Mechanisms at the1% Drift Ratio
Fig. 3.47 Comparison of Failure Mechanisms at the 2% Drift Ratio
Experimental Analytical
Experimental Analytical
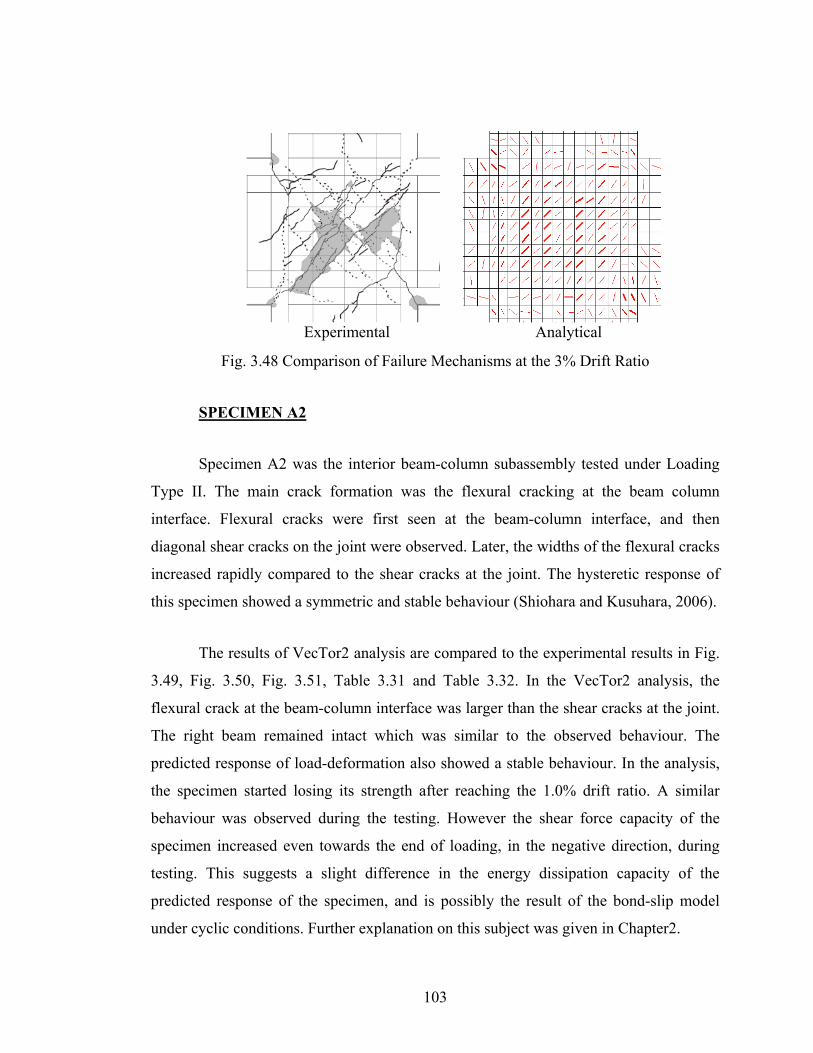
103
Fig. 3.48 Comparison of Failure Mechanisms at the 3% Drift Ratio
SPECIMEN A2
Specimen A2 was the interior beam-column subassembly tested under Loading
Type II. The main crack formation was the flexural cracking at the beam column
interface. Flexural cracks were first seen at the beam-column interface, and then
diagonal shear cracks on the joint were observed. Later, the widths of the flexural cracks
increased rapidly compared to the shear cracks at the joint. The hysteretic response of
this specimen showed a symmetric and stable behaviour (Shiohara and Kusuhara, 2006).
The results of VecTor2 analysis are compared to the experimental results in Fig.
3.49, Fig. 3.50, Fig. 3.51, Table 3.31 and Table 3.32. In the VecTor2 analysis, the
flexural crack at the beam-column interface was larger than the shear cracks at the joint.
The right beam remained intact which was similar to the observed behaviour. The
predicted response of load-deformation also showed a stable behaviour. In the analysis,
the specimen started losing its strength after reaching the 1.0% drift ratio. A similar
behaviour was observed during the testing. However the shear force capacity of the
specimen increased even towards the end of loading, in the negative direction, during
testing. This suggests a slight difference in the energy dissipation capacity of the
predicted response of the specimen, and is possibly the result of the bond-slip model
under cyclic conditions. Further explanation on this subject was given in Chapter2.
Experimental Analytical

104
Fig. 3.49 Comparison of Story Shear vs. Story Drift Ratio for Specimen A2
Fig. 3.50 Comparison of Energy Dissipation of Specimen A2
The ratio of the predicted and observed ductility ratios for this specimen was
1.08 in the positive loading direction, and 1.28 in the negative loading direction. The
05
1015
2025
30
0 2 4 6 8 10 12 14 16 18 20Cycle Number
Ener
gy D
issi
patio
n (k
Nm
)
ΣEANA/ΣEEXP = 1.06
Experimental Analytical
Experimental Analytical
Story Drift Ratio (%)
Stor
y Sh
ear F
orce
(kN
) µANA(+ve) /µEXP(+ve) = 1.08 µANA(-ve) /µEXP(-ve) = 1.28
µ 1 2 3 4
µ 4 3 2 1

105
predicted energy dissipation capacity for this specimen was also compared to the
observed value, and a ratio of 1.06 was obtained.
Fig. 3.51 Comparison of Final Failure for Specimen A2
Table 3.31 Sequence of Events at the Positive Loading Direction for Specimen A2
Experimental Analytical Event
Story Shear (kN)
Story Drift (%)
Story Shear (kN)
Story Drift (%)
Beam Reinforcement- 1stLayer Yielding 63.30 0.86 70.20 0.89
Beam Reinforcement- 2ndLayer Yielding 74.10 1.18 74.40 1.24
Column Reinforcement- Yielding No yielding No yielding
Max Story Shear 77.90 1.99 79.60 1.98
Analytical Experimental
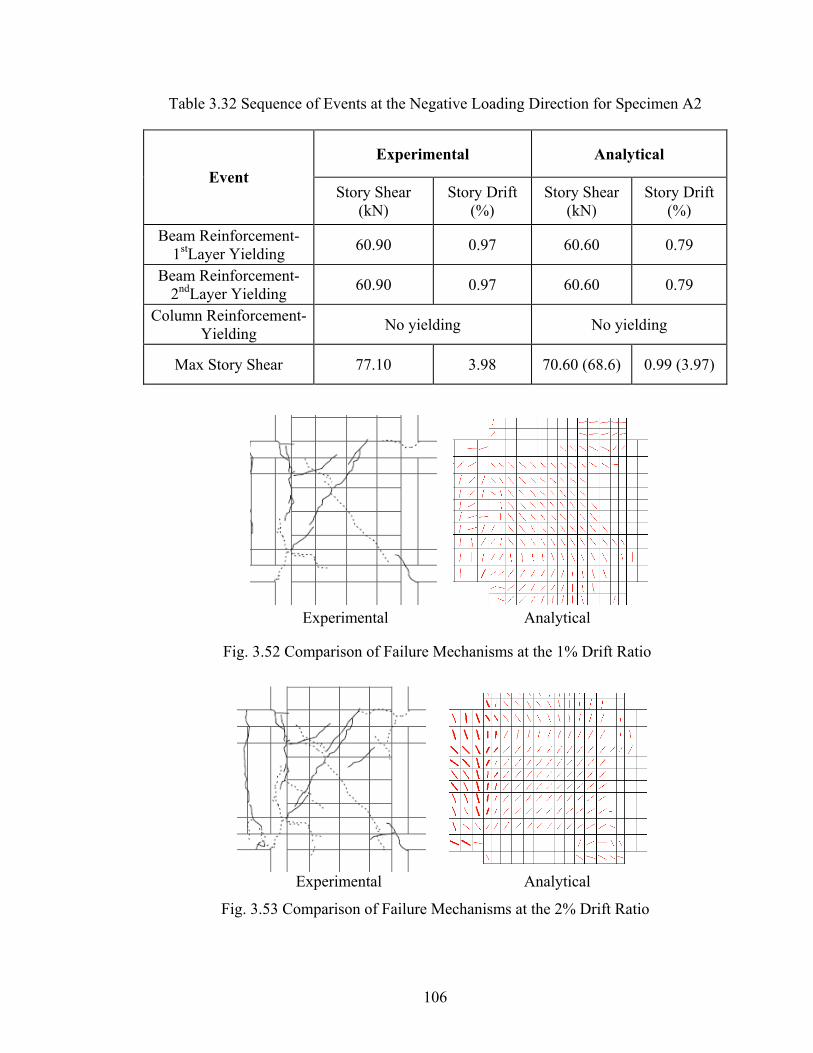
106
Table 3.32 Sequence of Events at the Negative Loading Direction for Specimen A2
Experimental Analytical Event
Story Shear (kN)
Story Drift (%)
Story Shear (kN)
Story Drift (%)
Beam Reinforcement- 1stLayer Yielding 60.90 0.97 60.60 0.79
Beam Reinforcement- 2ndLayer Yielding 60.90 0.97 60.60 0.79
Column Reinforcement- Yielding No yielding No yielding
Max Story Shear 77.10 3.98 70.60 (68.6) 0.99 (3.97)
Fig. 3.52 Comparison of Failure Mechanisms at the 1% Drift Ratio
Fig. 3.53 Comparison of Failure Mechanisms at the 2% Drift Ratio
Analytical Experimental
Analytical Experimental

107
Fig. 3.54 Comparison of Failure Mechanisms at the 3% Drift Ratio
SPECIMEN A3
Specimen A3 was tested under Loading Type III. The observed hysteretic
response was stable. Both flexural and shear cracking was observed, and these cracks
gradually increased during testing. As a result of this flexural cracking, concrete spalling
at the corner of the specimen was observed (Shiohara and Kusuhara, 2006).
The predicted seismic response is similar to the one observed in the test. The
predicted and observed story shear force versus story drift behaviour is shown in Fig.
3.48. The sequence of events in the positive and negative loading directions, observed in
the experimental and obtained from analytical results, are reported in Table 3.33 and
Table 3.34. The flexural cracking at the beam-column face, and shear cracks at the joint
were examined for different drift levels in Fig. 3.50, Fig. 3.51 and Fig. 3.52. Similar
flexural cracking that caused the concrete spalling at the bottom corner of the left beam
was also observed at the end of the 3.0% drift cycle. Under this applied loading
condition, the right beam remained intact both in the test and in the predicted response.
Experimental Analytical

108
Fig. 3.55 Comparison of Story Shear vs. Story Drift Ratio for Specimen A3
Fig. 3.56 Comparison of Energy Dissipation of Specimen A3
The ratio of the predicted and observed ductility ratios for this specimen was
0.82 in the positive loading direction, and 0.89 in the negative loading direction. The
05
1015
2025
30
0 2 4 6 8 10 12 14 16 18 20Cycle Number
Ener
gy D
issi
patio
n (k
Nm
)
ΣEANA/ΣEEXP = 0.93
Experimental Analytical
Experimental Analytical
Story Drift Ratio (%)
Stor
y Sh
ear F
orce
(kN
)
µANA(+ve) /µEXP(+ve) = 0.82 µANA(-ve) /µEXP(-ve) = 0.89
µ 1 2 3 4
µ 4 3 2 1

109
predicted energy dissipation capacity for this specimen was also compared to the
observed value, and a ratio of 0.93 was obtained.
Fig. 3.57 Comparison of Final Failure for Specimen A3
Table 3.33 Sequence of Events at the Positive Loading Direction for Specimen A3
Experimental Analytical Event
Story Shear (kN)
Story Drift (%)
Story Shear (kN)
Story Drift (%)
Beam Reinforcement- 1stLayer Yielding 158.30 1.34 165.80 1.21
Beam Reinforcement- 2ndLayer Yielding 176.40 1.62 176.10 1.60
Column Reinforcement- Yielding 156.10 1.83 158.10 1.80
Max Story Shear 176.40 1.62 176.10 1.60
Analytical Experimental

110
Table 3.34 Sequence of Events at the Negative Loading Direction for Specimen A3
Experimental Analytical Event
Story Shear (kN)
Story Drift (%)
Story Shear (kN)
Story Drift (%)
Beam Reinforcement- 1stLayer Yielding 93.40 0.85 99.60 0.80
Beam Reinforcement- 2ndLayer Yielding 100.90 0.97 106.40 1.00
Column Reinforcement- Yielding 123.60 3.03 110.30 3.00
Max Story Shear 124.50 3.84 113.30 4.00
Fig. 3.58 Comparison of Failure Mechanisms at the % Drift Ratio
Fig. 3.59 Comparison of Failure Mechanisms at the 2% Drift Ratio
Analytical Experimental
Analytical Experimental
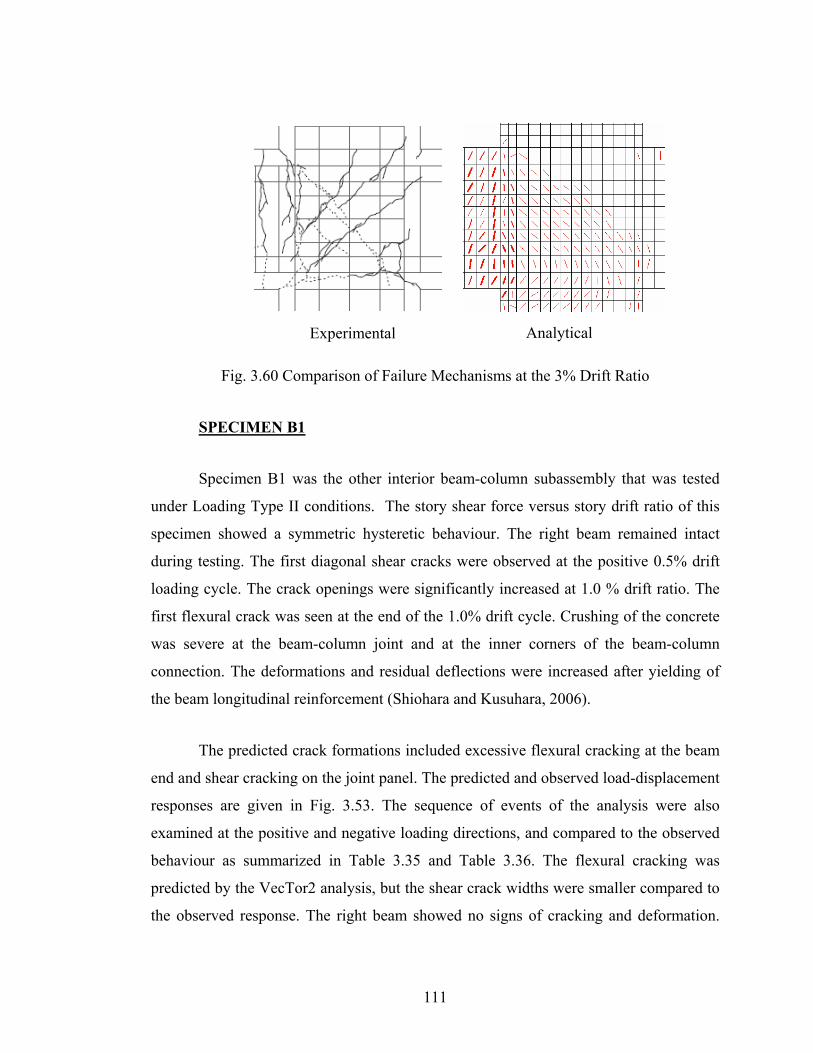
111
Fig. 3.60 Comparison of Failure Mechanisms at the 3% Drift Ratio
SPECIMEN B1
Specimen B1 was the other interior beam-column subassembly that was tested
under Loading Type II conditions. The story shear force versus story drift ratio of this
specimen showed a symmetric hysteretic behaviour. The right beam remained intact
during testing. The first diagonal shear cracks were observed at the positive 0.5% drift
loading cycle. The crack openings were significantly increased at 1.0 % drift ratio. The
first flexural crack was seen at the end of the 1.0% drift cycle. Crushing of the concrete
was severe at the beam-column joint and at the inner corners of the beam-column
connection. The deformations and residual deflections were increased after yielding of
the beam longitudinal reinforcement (Shiohara and Kusuhara, 2006).
The predicted crack formations included excessive flexural cracking at the beam
end and shear cracking on the joint panel. The predicted and observed load-displacement
responses are given in Fig. 3.53. The sequence of events of the analysis were also
examined at the positive and negative loading directions, and compared to the observed
behaviour as summarized in Table 3.35 and Table 3.36. The flexural cracking was
predicted by the VecTor2 analysis, but the shear crack widths were smaller compared to
the observed response. The right beam showed no signs of cracking and deformation.
Experimental Analytical

112
Contrary to the other (right) beam, the loaded beam was gradually disturbed at the
column face with extensive flexural cracking.
Fig. 3.61 Comparison of Story Shear vs. Story Drift Ratio for Specimen B1
Fig. 3.62 Comparison of Energy Dissipation of Specimen B1
The ratio of the predicted and observed ductility ratios for this specimen was
0.85 in the positive and negative loading directions. The predicted energy dissipation
Cycle Number
Ener
gy D
issi
patio
n (k
Nm
)
0
510
15
2025
30
0 2 4 6 8 10 12 14 16 18 20
ΣEANA/ΣEEXP = 0.98
Experimental Analytical
Experimental Analytical
Story Drift Ratio (%)
Stor
y Sh
ear F
orce
(kN
)
µANA(+ve) /µEXP(+ve) = 0.85 µANA(-ve) /µEXP(-ve) = 0.85
µ 1 2 3 4
µ 4 3 2 1
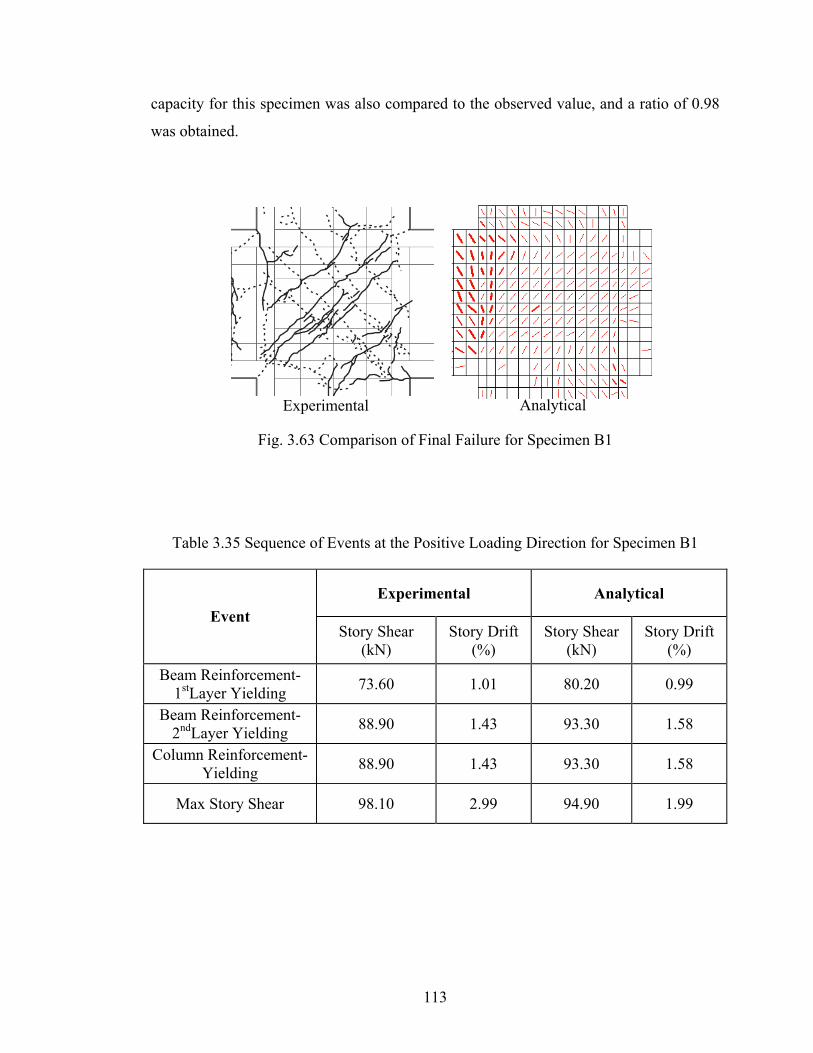
113
capacity for this specimen was also compared to the observed value, and a ratio of 0.98
was obtained.
Fig. 3.63 Comparison of Final Failure for Specimen B1
Table 3.35 Sequence of Events at the Positive Loading Direction for Specimen B1
Experimental Analytical Event
Story Shear (kN)
Story Drift (%)
Story Shear (kN)
Story Drift (%)
Beam Reinforcement- 1stLayer Yielding 73.60 1.01 80.20 0.99
Beam Reinforcement- 2ndLayer Yielding 88.90 1.43 93.30 1.58
Column Reinforcement- Yielding 88.90 1.43 93.30 1.58
Max Story Shear 98.10 2.99 94.90 1.99
Experimental Analytical
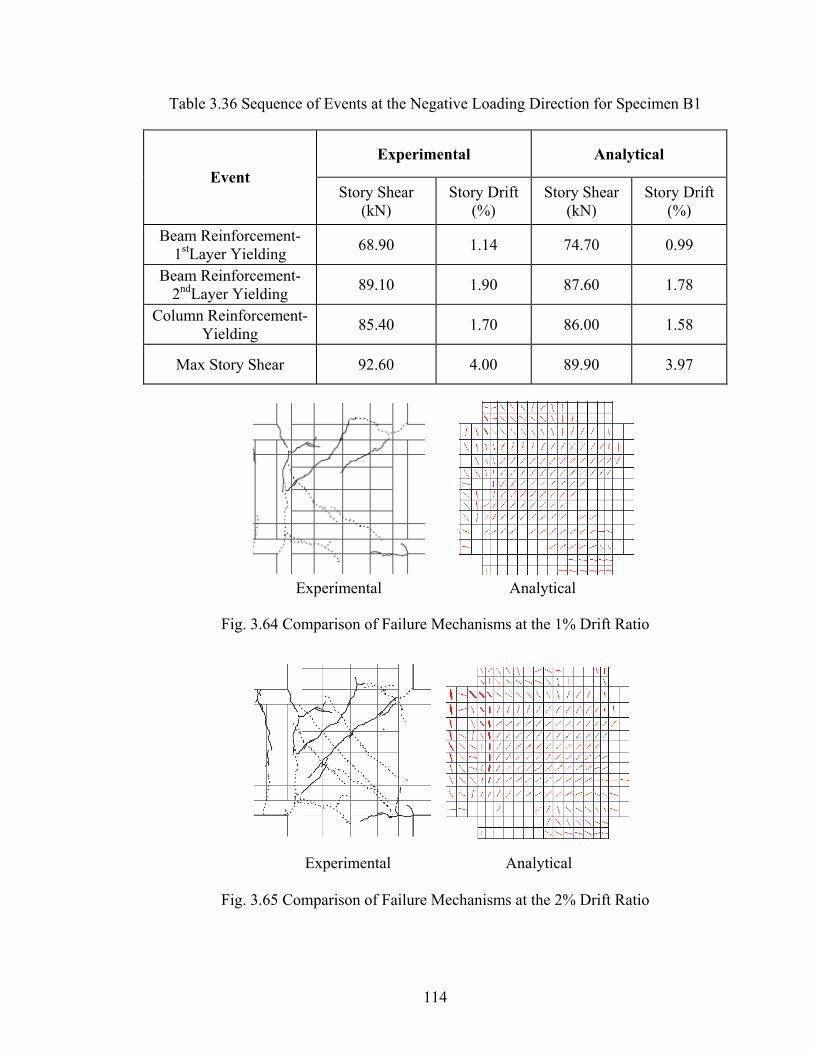
114
Table 3.36 Sequence of Events at the Negative Loading Direction for Specimen B1
Experimental Analytical Event
Story Shear (kN)
Story Drift (%)
Story Shear (kN)
Story Drift (%)
Beam Reinforcement- 1stLayer Yielding 68.90 1.14 74.70 0.99
Beam Reinforcement- 2ndLayer Yielding 89.10 1.90 87.60 1.78
Column Reinforcement- Yielding 85.40 1.70 86.00 1.58
Max Story Shear 92.60 4.00 89.90 3.97
Fig. 3.64 Comparison of Failure Mechanisms at the 1% Drift Ratio
Fig. 3.65 Comparison of Failure Mechanisms at the 2% Drift Ratio
Analytical Experimental
Analytical Experimental

115
Fig. 3.66 Comparison of Failure Mechanisms at the 3% Drift Ratio
3.2.2. DISCUSSION OF INTERIOR BEAM-COLUMN SUBASSEMBLIES
A comparison of the interior beam-column subassemblies with deformed
reinforcement is presented here. A total of four interior specimens tested under
simulated seismic loadings were modelled in this portion of the study. The ratio of the
predicted to the observed peak shear force results had a mean of 1.00 and a coefficient of
variation of 2.11% in the positive loading direction. The mean value of the same ratio
was 0.97, with a coefficient of variation of 6.27%, in the negative loading direction. The
ratio of the predicted to the observed ultimate displacement results were better, and had
a mean of 0.99 and a coefficient of variation of 1.09% in the positive loading direction.
The mean value of the same ratio was 0.99, and had a coefficient of variation of 0.75%
in the negative loading direction. A better correlation was observed in the positive
loading direction for interior specimens due to reasons explained above related to cyclic
bond-slip behaviour. The predicted peak shear force and ultimate displacement values
for all interior specimens designed with deformed reinforcement are compared to the
observed shear force values in the positive and negative loading directions, as reported
in Table 3.37, 3.38, 3.39 and 3.40.
Experimental Analytical

116
Table 3.37 Comparison of Peak Shear Force at the Positive Loading Direction
Specimen Vmax (EXP) (kN)
Vmax (VT2) (kN)
Vmax (VT2)/ Vmax (EXP)
A1 126.6 128.6 1.02
A2 77.9 79.6 1.02
A3 176.4 176.1 1.00
B1 98.1 94.9 0.97
Mean 1.00
St. Dev 0.02
COV (%) 2.11
Table 3.38 Comparison of Peak Shear Force at the Negative Loading Direction
Specimen Vmax (EXP) (kN)
Vmax (VT2) (kN)
Vmax (VT2)/ Vmax (EXP)
A1 122.8 130.0 1.06
A2 77.1 70.6 0.92
A3 124.5 113.1 0.91
B1 92.6 91.0 0.98
Mean 0.97
St. Dev 0.06
COV (%) 6.27

117
Table 3.39 Comparison of Ultimate Displacement at the Positive Loading Direction
Specimen Δmax (EXP) (mm)
Δmax (VT2) (mm)
Δmax (VT2)/ Δmax (EXP)
A1 58.8 58.2 0.99
A2 73.5 72.2 0.98
A3 40.4 39.8 0.98
B1 80.8 81.6 1.01
Mean 0.99
St. Dev 0.01
COV (%) 1.09
Table 3.40 Comparison of Ultimate Displacement at the Negative Loading Direction
Specimen Δmax (EXP) (mm)
Δmax (VT2) (mm)
Δmax (VT2)/ Δmax (EXP)
A1 58.8 58.2 0.99
A2 58.8 57.6 0.98
A3 29.4 29.4 1.00
B1 58.8 58.5 1.00
Mean 0.99
St. Dev 0.01
COV (%) 0.75

118
Overall, the VecTor2 analysis of beam-column subassemblies with deformed
reinforcement for both exterior and interior and seismically and non-seismically
designed members were successful in predicting the response with accurate estimates of
the crack formations, ultimate strength, load-deformation response, energy dissipation
capacity, and ductility ratios.

119
CHAPTER 4
Analysis of Smooth Reinforcement Beam-Column Subassemblies
Four specimens were examined for the analytical study on beam-column
subassemblies designed with smooth (plain round) reinforcement. The experimental data
was obtained from an extensive experimental and analytical research program performed
on non-seismically designed beam-column subassemblies at the University of Pavia and
University of Canterbury by Pampanin et al. (2003-2006). These specimens were
exterior and interior beam-column subassemblies designed with no consideration of
capacity design principles; they were mostly designed to resist gravity loads. This design
approach was prevalent in pre-1970s reinforced concrete framed buildings, which were
designed before current seismic regulations were introduced.
The first group of specimens consisted of two exterior beam-column
subassemblies that were tested at the University of Canterbury by Chen (2006). The
second specimen involved another non-seismically designed interior beam-column
subassembly tested by Pampanin et al. (2002). The results of the study by Chen (2006)
provided a base for a new retrofitting technique applicable to non-seismically designed
beam-column subassemblies, which was examined as the last specimen in this study.
This is a newly developed low-invasive retrofitting technique which successfully
mitigates the shear failure mechanism from joint panel to the beam as a flexural failure
mechanism (Pampanin et al., 2006). The sectional and material properties, test set-up
and loading protocol are described for each beam-column subassembly. The results of
the analytical study are also given in comparison to the experimental results in this
chapter.
The finite element modelling of the specimens were similar to the ones described
in Chapter 3. However the bond-slip modelling of smooth reinforcement was changed
through the course of the research. The embedded smooth rebar option developed by
Gan (2000) wasn’t successful in capturing the seismic behaviour of non-seismically

120
designed members. Based on experimental research by Abrams (1913), Feldman and
Bartlett (2005) and Fabbrocino et al. (2002), another approach for smooth-bar bond
modelling was suggested and investigated in this study.
4.1. EXTERIOR BEAM-COLUMN SUBASSEMBLIES
4.1.1. SPECIMEN ES1
4.1.1.1. TEST SPECIMENS
Two non-seismically designed beam-column subassemblies tested by Chen
(2006) were examined in this section. The specimens in this group were similar to the
exterior beam-column subassemblies described in the previous chapter (i.e. Specimen
ED3). While the design principles remained the same, the reinforcement used in these
specimens was smooth (plain round) reinforcement to represent a typical design
deficiency of these structures. There were also problems in reinforcement detailing such
as inadequate anchorage detailing and poor confinement in the joints. The beam
longitudinal bars were anchored into the joint with hooked ends, and an inadequate
amount of shear reinforcement was included in the joint. These two exterior beam-
column subassemblies were designed with identical sectional details, and tested under
the same loading and support conditions.
Sectional and Material Properties:
The sectional and material details were similar to the Specimen ED3 examined in
the previous chapter. The concrete compressive strength and Young’s Modulus were 23
MPa and 28700 MPa, respectively. Detailed information on these specimens is shown in
Fig. 4.1
The smooth reinforcing bars were used for both longitudinal reinforcement and
transverse reinforcement. The transverse reinforcement had a 100 mm spacing in the
columns, and a 133 mm spacing in the beams. The longitudinal reinforcement was
anchored into the joint with hooked ends, and the joint was confined with only one tie

121
bar to represent the confinement problem that is present in these beam-column
subassemblies. The reinforcement detailing and material properties of the reinforcement
used in these specimens are given in Table 4.1 and Table 4.2.
Fig. 4.1 Reinforcement Detailing for Specimen ES1 (Chen, 2006)
Table 4.1 Reinforcement Detailing for Specimen ES1 (Chen, 2006)
Beam Column Specimen
Longitudinal Transverse Longitudinal Transverse
Joint
TDP1 4 R10 2 R10
TDP2 4 R10 4 R10
R6 @ 133 mm
3 R10
3 R10 R6 @
100 mm 1- R6

122
Table 4.2 Material Properties of Reinforcement Specimen ES1 (Chen, 2006)
Type Grade Diameter (mm)
Area (mm2)
fy (MPa)
Es (MPa)
fu (MPa)
R10 300 10 127 456 176000 582
R6 300 6 32 326 151300 488
Test Set-Up and Loading:
The specimens were tested under the same loading protocol that was applied to
Specimen ED3, described in Chapter 3. Therefore, no additional information is given in
this section for this purpose.
4.1.1.2. FINITE ELEMENT MODELLING
Material and Regional Properties:
Similar modelling techniques were applied to these specimens as the ones that
were applied to the exterior beam-column subassemblies with deformed reinforcement.
Seven concrete regions were defined and employed to model these specimens. A total of
1796 rectangular concrete elements with a 25 by 25 mm mesh configuration were used
for the concrete regions. Detailed information about the concrete regions is given in Fig.
4.2 and Table 4.3.

123
Fig. 4.2 Material Regions for Specimen ES1
Table 4.3 Concrete Regions for Specimen ES1
Concrete Regions # 1 (#7) #2 # 3 #4 #5 #6Thickness
(mm) 230 (200) 230 200
Mesh Size (mm) 25 x 25
Purpose Bearing Column Joint Column Beam1 Beam2
ρz (%) None 0.267 0.074 0.464 0.129 0.305
# 3
REGION3
REGION1
REGION1
REG
ION
2
REG
ION
2
REG
ION
4
REGION6
REGION7
REGION7
REGION5

124
The reinforcement and bond regions were modelled with 678 truss elements and
28 bond-link elements respectively. The reinforcement and bond element configuration
is shown in Fig. 4.3, and detailed information for the reinforcement regions is given in
Table 4.4.
Table 4.4 Reinforcement Elements for Specimen ES1
Reinforcement Type Location
# 1 3 R10 Column Longitudinal
# 2 4 R10 Beam Top Layer Longitudinal
# 3 4 R10 (2 R10) Beam Bottom Layer Longitudinal
# 4 2 R6 Transverse Reinforcement
# 5 D20 Strengthening Rebar for Test Set-Up
Fig. 4.3 Reinforcement and Bond Regions for Specimen ES1
Reinforcement # 1
Reinforcement # 2
Bond #1 Bond #2
Reinforcement # 3

125
The smooth-bar bond-slip effects were modelled based on the experimental
results reported by Fabbrocino et al. (2002). The hooked ends of the beam longitudinal
bars were modelled with the “Perfect Bond” model. The bond-slip properties for this
model were constant and can’t be modified during the analysis. Information on these
bond slip model was given in Chapter 2. This model was only assigned to the hooked
section of the bar, and was defined by Bond #1. The rest of the beam longitudinal bars
were modelled with the smooth-bar bond-slip model suggested by Fabbrocino et al.
(2002), and implemented in VecTor2. The observed bond stress-slip relationships for 12
mm and 16 mm straight smooth bars were used to represent the straight section of these
bars. The monotonic bond-slip behaviour that were obtained from tests by Fabbrocino et
al. (2002) on concrete blocks embedded with straight shaped smooth bars were used to
represent the bond-slip behaviour for the rest of the longitudinal bars. The straight
section of the beam longitudinal bars was defined by Bond #2, and the bond-slip relation
for a 12 mm smooth bar was used from the test results by Fabbrocino et al. (2002). The
‘Custom Input’ option for embedded bars was used to assign the second bond model.
The bond stress-slip parameters used for modelling are given in Table 4.5.
Table 4.5 Bond Stress-Slip Parameters for Smooth Bars
Bond # 1 Bond # 2 Parameter
Hooked End Straight Section
τ1 (MPa) 250 1.05
τ2 (MPa) 250 0.3
τf (MPa) 250 0.3
Δ1 (mm) 0.1 0.03
Δ2 (mm) 3.0 1
Δ3 (mm) 10.0 3
Loading and Restraint Conditions:

126
A pinned support was assigned to the lower column end, and pinned roller
supports were assigned to the beam end. A displacement-based loading scheme was
employed for Load Case 1, and the axial loads applied to the top of the column were
described as the Load Case 2 and Load Case 3 (see Fig 4.4).
Fig. 4.4 Loading and Restraint Conditions for Specimen ES1
4.1.1.3. RESULTS OF EXPERIMENTAL AND ANALYTICAL STUDY
Load Case 2 Constant Axial Load - 75 kN
Load Case 1- Displacement – 1 mm
Load Case 3 Changing - ±1.8*Vc

127
A comparison of the predicted and the observed response is given individually
for Specimen TDP1 and TDP2 in the following sections.
Specimen TDP1
In the experiment by Chen (2006), a joint shear failure was observed in the
positive loading direction, while a flexural failure at the beam-column interface was
observed in the negative loading direction. In the positive loading direction, the first
joint shear cracking was observed at a 1.33% story drift ratio, and the shear resistance of
the member decreased after this cracking occurred. Later, the shear strength of the
specimen recovered to its previous values, and started decreasing gradually with the
opening of the diagonal cracks in the joint. The beam hinging was observed only in the
negative loading direction. The hysteretic response showed a pinched behaviour which
indicated slippage of the reinforcement (Chen, 2006).
The predicted response of this specimen was somewhat similar to the observed
response. Similar crack formations were observed in the analytical results. Once the
bond strength of the smooth bars was surpassed, these bars started to push the concrete
cover at the end of the beam, and caused the spalling of the concrete cover at the back of
the column. These cracks were gradually increased under the push-pull effects of the
reversed cyclic loading conditions. Later these cracks joined to the diagonal joint cracks,
and formed a concrete wedge in the joint. The flexural cracking at the beam-column face
was observed both in the positive and the negative loading directions.
The predicted story shear force versus story drift behaviour for this specimen is
compared to the observed behaviour of the test specimen in Fig. 4.5. The ductility ratios
of the specimen was estimated in the positive and negative loading directions, and given
in Fig. 4.24 for further comparison between the analytical and experimental results. The
ratio of the predicted and observed ductility ratios for this specimen was 1.26 in the
positive loading direction, and 1.15 in the negative loading direction.

128
Fig. 4.5 Comparison of Story Shear vs. Story Drift Ratio for Specimen TDP1
The energy dissipation capacity obtained from the predicted and observed
response of the specimen was also given in comparison in Fig. 4.6, and a ratio of 0.60
was obtained.
Fig. 4.6 Comparison of Energy Dissipation of Specimen TDP1
01
23
45
6
0 2 4 6 8 10 12 14 16 18 20 22 24 26Cycle Number
Ener
gy D
issi
patio
n (k
Nm
)
ΣEANA/ΣEEXP = 0.60
Experimental Analytical
-16
-12
-8
-4
0
4
8
12
16
20
24
-4 -3 -2 -1 0 1 2 3 4
Experimental Analytical
Story Drift Ratio (%)
Stor
y Sh
ear F
orce
(kN
) µANA(+ve) /µEXP(+ve) = 1.26 µANA(-ve) /µEXP(-ve) = 1.15
µ 1 2 3 4 5
µ4 3 2 15

129
The crack formations and failure mechanism of the observed behaviour are also
compared to the response predicted by the VecTor2 analysis in Fig. 4.7. The sequence of
events occurred leading to the failure of the specimen is given in comparison to the
analytical results in Table 4.6.
Fig. 4.7 Comparison of Failure Mechanisms for Specimen TDP1
Table 4.6 Sequence of Events for Specimen TDP1
Experimental Analytical Event
Story Shear (kN)
Story Drift (%)
Story Shear (kN)
Story Drift (%)
Positive Loading Direction
First Shear Cracking 16.3 1.33 18.4 0.75
Beam Hinging Not Observed 17.2 0.5
Max Story Shear 16.3 1.33 18.4 0.76
Negative Loading Direction
First Shear Cracking 8.2 2.6 8.8 1.0
Beam Hinging 8.7 0.4 9.2 0.26
Max Story Shear 8.9 0.5 9.4 0.5
Analytical Experimental

130
Specimen TDP2
A brittle joint shear failure was observed by Chen (2006) for this specimen. The
first joint shear cracks occurred at the 1.0% drift cycles, and gradually increased in the
positive and the negative loading directions. Similar to Specimen TDP1, the hysteretic
response showed a pinched behaviour which indicated slippage of the reinforcement.
The concrete wedge mechanism was observed in this specimen (Chen, 2006).
The ratio of the predicted and observed ductility ratios for this specimen was
1.09 in the positive loading direction, and 0.93 in the negative loading direction.
Fig. 4.8 Comparison of Story Shear vs. Story Drift Ratio for Specimen TDP2
The energy dissipation capacity obtained from the predicted and observed
response of the specimen was also given in comparison in Fig. 4.9, and a ratio of 0.60
was obtained.
-20
-15
-10
-5
0
5
10
15
20
-5 -4 -3 -2 -1 0 1 2 3 4 5
Experimental Analytical
Story Drift Ratio (%)
Stor
y Sh
ear F
orce
(kN
)
µANA(+ve) /µEXP(+ve) = 1.09 µANA(-ve) /µEXP(-ve) = 0.93
µ 1 2 3 4 5
µ4 3 2 15

131
Fig. 4.9 Comparison of Energy Dissipation of Specimen TDP2
Fig. 4.10 Comparison of Failure Mechanisms of Specimen TDP2
The predicted response of this specimen was similar to the observed response.
Similar crack formations, which resulted in a concrete wedge mechanism, were also
observed in the analytical results. The predicted story shear force versus story drift
behaviour, crack formations and the sequences of events are compared to the observed
behaviour in Fig. 4.8, Fig. 4.10 and Table 4.7.
Analytical Experimental
0
1
2
3
4
5
6
0 2 4 6 8 10 12 14 16 18 20 22 24 26
Cycle Number
Ener
gy D
issi
patio
n (k
Nm
) ΣEANA/ΣEEXP = 0.60
Experimental Analytical
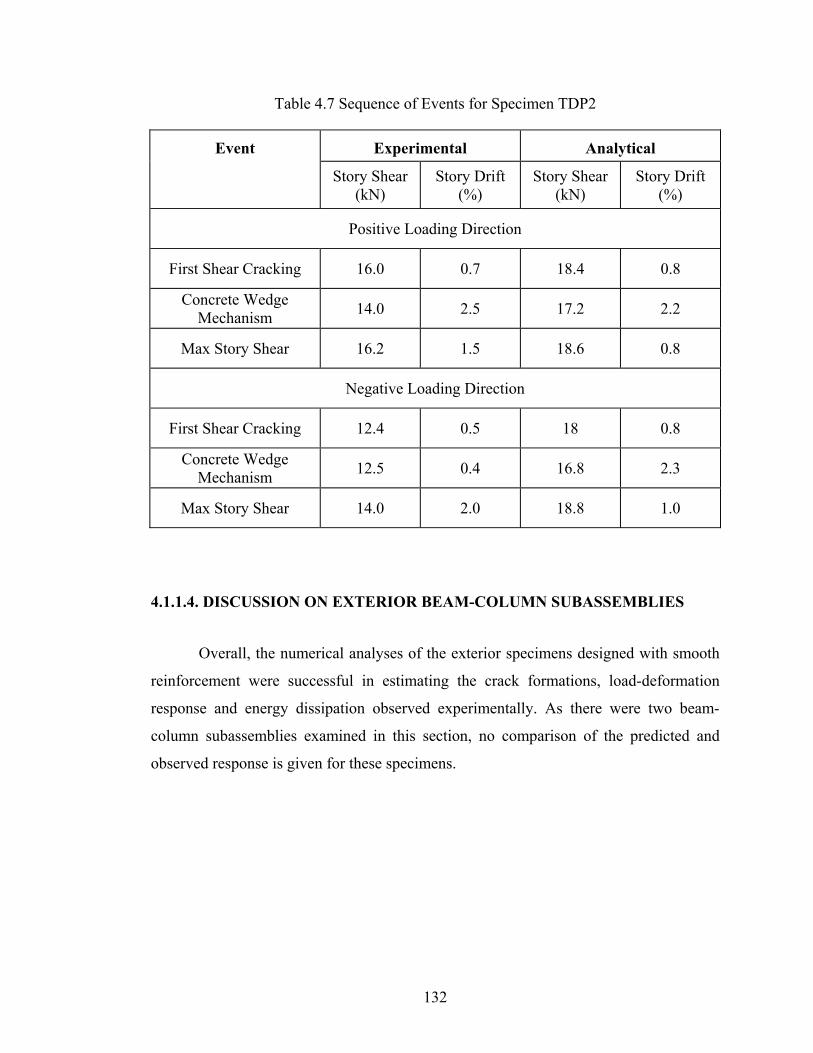
132
Table 4.7 Sequence of Events for Specimen TDP2
Experimental Analytical Event
Story Shear (kN)
Story Drift (%)
Story Shear (kN)
Story Drift (%)
Positive Loading Direction
First Shear Cracking 16.0 0.7 18.4 0.8
Concrete Wedge Mechanism 14.0 2.5 17.2 2.2
Max Story Shear 16.2 1.5 18.6 0.8
Negative Loading Direction
First Shear Cracking 12.4 0.5 18 0.8
Concrete Wedge Mechanism 12.5 0.4 16.8 2.3
Max Story Shear 14.0 2.0 18.8 1.0
4.1.1.4. DISCUSSION ON EXTERIOR BEAM-COLUMN SUBASSEMBLIES
Overall, the numerical analyses of the exterior specimens designed with smooth
reinforcement were successful in estimating the crack formations, load-deformation
response and energy dissipation observed experimentally. As there were two beam-
column subassemblies examined in this section, no comparison of the predicted and
observed response is given for these specimens.

133
4.2. INTERIOR BEAM-COLUMN SUBASSEMBLIES
4.2.1. SPECIMEN IS1
4.2.1.1. TEST SPECIMENS
An interior beam-column subassembly tested by Pampanin et al. (2002) was
examined in this section. This specimen was designed with similar design deficiencies as
the Specimen ES1. The sectional details, material properties, and loading system of this
specimen were different than the other specimens examined previously in this chapter,
and are explained in more detail in the following paragraph.
Sectional and Material Properties:
The columns were 200 by 200 mm, and beams were 200 by 330 mm. The
compressive strength and Young’s Modulus of the concrete used in this specimen were
23.9 and 22000 MPa, respectively. The longitudinal reinforcement used in this specimen
was R8 and R12 smooth reinforcing bars, and R4 smooth reinforcing bar was used for
the shear reinforcement. The transverse reinforcement was placed with a 115 mm
spacing along the beam, and a 135 mm spacing along the column. Detailed information
on the reinforcement layout is given in Fig. 4.11, Table 4.8, and Table 4.9.
Table 4.8 Reinforcement Detailing for Specimen IS1 (Pampanin et al, 2002)
Beam Column Joint Specimen
Longitudinal Transverse Longitudinal Transverse
C2 2 R8 + 1 R12
2 R8 + 1 R12
R4 @
115 mm
3 R8
3 R8
R4 @
135 mm None

134
Table 4.9 Material Properties of Reinforcement for Specimen IS1
(Pampanin et al, 2002)
Type Grade Diameter (mm)
Area (mm2)
fy
(MPa) Es
(MPa) fu
(MPa)
R12 300 10 127 456 176000 582
R8 300 10 127 357 176300 493
R4 300 6 32 326 151300 488
Fig. 4.11 Reinforcement Detailing for Specimen IS1 (Pampanin et al., 2005)
Test Set-Up and Loading:
The test set-up used for this specimen is shown in Fig. 4.12. A displacement-
controlled loading system was used to apply the horizontal force at the top of the
column. A constant axial load of 120 kN was applied to the top of the column with the
Column – R4 @ 135 mm
Beam – R4 @ 115 mm
Beam – R4 @ 115 mm

135
varying axial load equal to 1.4 times the shear force. The direction of this second axial
load applied was changed according to the loading direction. The loading protocol
followed for this specimen is given in Fig. 4.13. The specimen was subjected to three
consecutive cycles of drift ratios from 0.2% to 3.5%.
Fig. 4.12 Test Set-up for Specimen IS1 (Pampanin et al, 2005)
Fig. 4.13 Loading Protocol for Specimen IS1
Reaction Wall
Pinned Arm
Load Cell
BaseHinge
Hydraulic Jack
Load Cell
Support Frame
Load Cell
Pinned Arm
-4
-3
-2
-1
0
1
2
3
4
Stor
y D
rift R
atio
(%)
Stor
y D
rift R
atio
(%
)
Positive Loading Direction
Negative Loading Direction
0.2
%
0.6
%
0.8
%
1.5
%
2.0
%
3.0
%
3.5
%
1.0
%

136
4.1.2.2. FINITE ELEMENT MODELLING
Material and Regional Properties:
Four concrete regions were utilized in modelling this specimen. A total of 4670
rectangular concrete elements, with a 20 by 20 mm mesh configuration, were used to
represent the interior beam-column subassembly. Detailed information about the
concrete regions is given in Fig. 4.14 and in Table 4.10.
Fig. 4.14 Material Regions for Specimen IS1
REGION 2
REGION1
REGION1
REG
ION
4
REGION3 REGION 2
REG
ION
4

137
Table 4.10 Concrete Regions for Specimen IS1
Concrete Region # 1 #2 # 3 #4 Thickness
(mm) 200 200 200 200
Mesh Size (mm) 20 x 40 20 x 20 20 x 20 20 x 20
Purpose Bearing Beam Joint Column
ρz (%) None 0.28 None 0.24
The reinforcement and bond regions were modelled with 1196 truss elements and
78 bond-link elements. A representation of the reinforcement and the bond element
configuration is shown in Fig. 4.15, and detailed information on the reinforcement
regions is given in Table 4.11.
Table 4.11 Reinforcement Elements for Specimen IS1
Reinforcement Type Location
# 1 3 R8 Column Reinforcement
# 2 2 R8 + 1 R12 Beam Reinforcement
# 3 2 R4 Transverse Reinforcement
# 4 D20 Strengthening Rebar for Test Set-Up
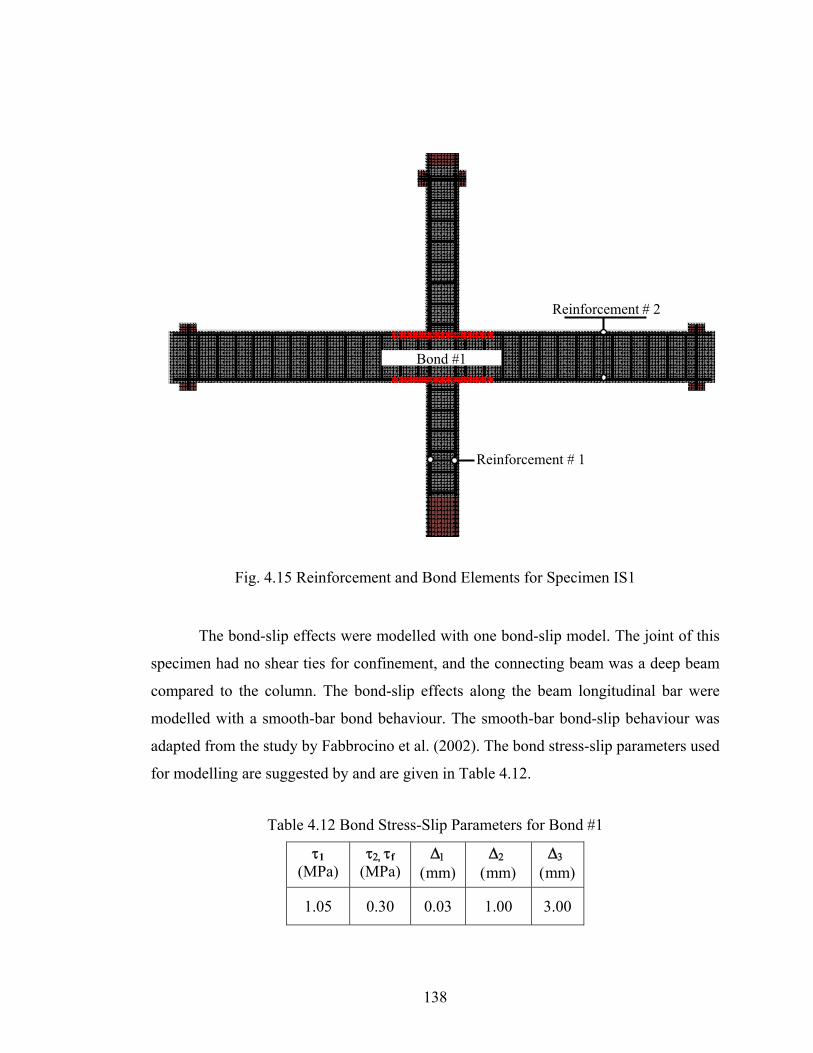
138
Fig. 4.15 Reinforcement and Bond Elements for Specimen IS1
The bond-slip effects were modelled with one bond-slip model. The joint of this
specimen had no shear ties for confinement, and the connecting beam was a deep beam
compared to the column. The bond-slip effects along the beam longitudinal bar were
modelled with a smooth-bar bond behaviour. The smooth-bar bond-slip behaviour was
adapted from the study by Fabbrocino et al. (2002). The bond stress-slip parameters used
for modelling are suggested by and are given in Table 4.12.
Table 4.12 Bond Stress-Slip Parameters for Bond #1
τ1 (MPa)
τ2, τf (MPa)
Δ1 (mm)
Δ2 (mm)
Δ3 (mm)
1.05 0.30 0.03 1.00 3.00
Reinforcement # 1
Bond #1
Reinforcement # 2

139
Loading and Restraint Conditions:
The loading protocol was modelled as described previously. Load Case 1 was the
horizontally applied displacement-based reversed cyclic loading, Load Case 2 was the
constant axial load applied to the top of the column, and Load Case 3 was the varying
axial loading vertically applied to the top of the column. The restraints included a pinned
support at the end of lower column, and two pinned rollers at the end of the beams.
Fig. 4.16 Loading and Restraint Conditions for Specimen IS1
Load Case 1- Displacement – 1 mm
Load Case 2 Constant Axial Load - 120 kN Load Case 3 Changing Axial Load - ±1.4*Vc
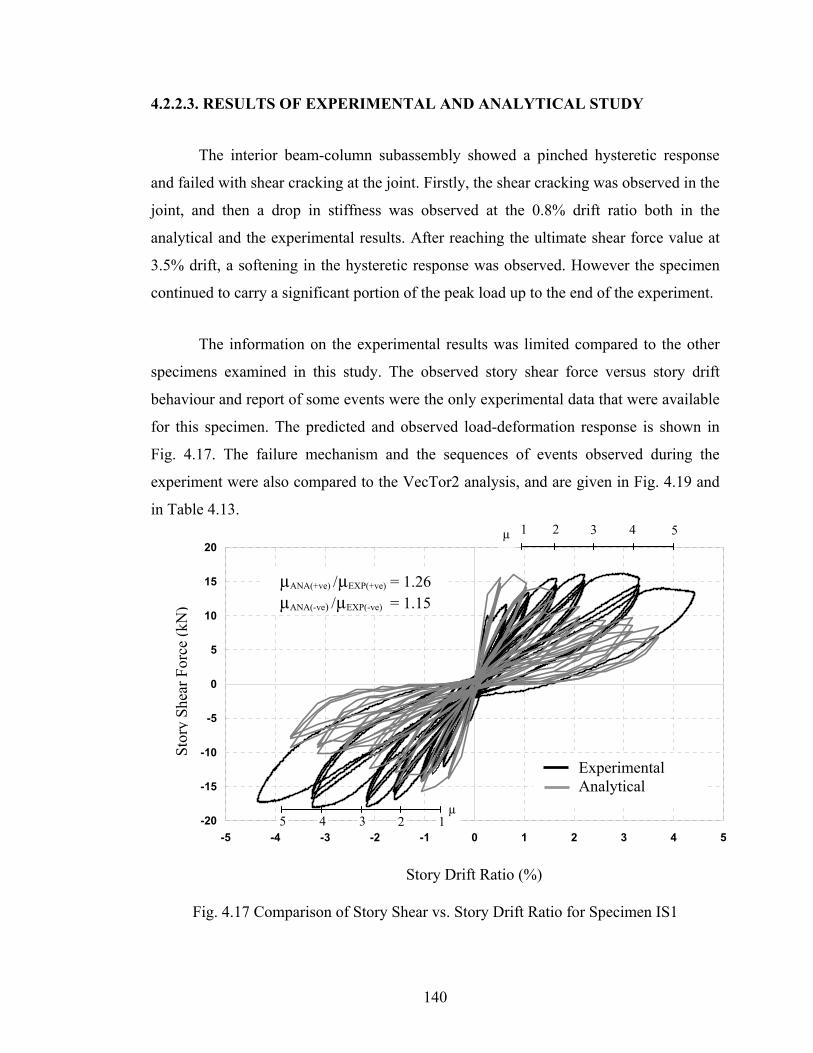
140
4.2.2.3. RESULTS OF EXPERIMENTAL AND ANALYTICAL STUDY
The interior beam-column subassembly showed a pinched hysteretic response
and failed with shear cracking at the joint. Firstly, the shear cracking was observed in the
joint, and then a drop in stiffness was observed at the 0.8% drift ratio both in the
analytical and the experimental results. After reaching the ultimate shear force value at
3.5% drift, a softening in the hysteretic response was observed. However the specimen
continued to carry a significant portion of the peak load up to the end of the experiment.
The information on the experimental results was limited compared to the other
specimens examined in this study. The observed story shear force versus story drift
behaviour and report of some events were the only experimental data that were available
for this specimen. The predicted and observed load-deformation response is shown in
Fig. 4.17. The failure mechanism and the sequences of events observed during the
experiment were also compared to the VecTor2 analysis, and are given in Fig. 4.19 and
in Table 4.13.
Fig. 4.17 Comparison of Story Shear vs. Story Drift Ratio for Specimen IS1
-20
-15
-10
-5
0
5
10
15
20
-5 -4 -3 -2 -1 0 1 2 3 4 5
Experimental Analytical
Story Drift Ratio (%)
Stor
y Sh
ear F
orce
(kN
)
µANA(+ve) /µEXP(+ve) = 1.26 µANA(-ve) /µEXP(-ve) = 1.15
µ 1 2 3 4 5
µ4 3 2 15

141
Fig. 4.18 Comparison of Energy Dissipation Capacity for Specimen IS1
Fig. 4.19 Failure Mechanisms for Specimen IS1
The ratio of the predicted and observed ductility ratios for this specimen was
1.26 in the positive loading direction, and 1.15 in the negative loading direction. The
energy dissipation capacity obtained from the predicted and observed response of the
specimen was also given in comparison, and a ratio of 0.70 was obtained.
Analytical
0
12
3
45
6
0 2 4 6 8 10 12 14 16 18 20 22 24Cycle Number
Ener
gy D
issi
patio
n (k
Nm
) ΣEANA/ΣEEXP = 0.70
Experimental Analytical

142
Table 4.13 Sequence of Events for Specimen IS1
Experimental Analytical Event
Story Shear (kN)
Story Drift (%)
Story Shear (kN)
Story Drift (%)
Positive Loading Direction
First Shear Cracking 10.00 0.25 13.00 0.25
Max Story Shear 16.00 3.00 16.00 0.75
Negative Loading Direction
First Shear Cracking Not reported 10.00 0.25
Max Story Shear 17.00 3.25 15.00 1.62

143
4.3. RETROFITTED EXTERIOR BEAM-COLUMN SUBASSEMBLY
The last beam-column subassembly in this section was also a specimen tested by
Pampanin et al., (2006). The specimen was retrofitted using a new technique which is
effective in transforming the unwanted brittle failure mechanism to a seismically
desirable ductile mechanism for non-seismically designed beam-column subassemblies.
A specimen that is very similar to the previously examined specimen in this chapter (i.e.
Specimen TDP2) was retrofitted and tested by Chen (2006).
4.3.1. RETROFITTING TECHNIQUE
Due to the poor quality of the concrete, reinforcement detailing and the absence
of a seismic design philosophy, brittle failure mechanisms are usually observed in non-
seismically designed beam-column subassemblies. As observed by earthquake
reconnaissance teams over the years, this local failure leads to severe global failure
mechanisms which endangers the lives of building occupants. Therefore, there is an
urgent need to find efficient and economic solutions to this problem. Retrofitting of
these existing buildings is the most expedient and practical solution since reconstruction
in most cases is not possible.
The proposed scheme is a low-invasive and practical retrofitting technique when
compared to other more evolved alternatives such as FRP wrapping (Pampanin et al.,
2006). The focus in retrofitting the beam-column subassemblies is set on protecting the
global integrity of the structure. The hierarchy of strength between the different
components comprising the beam-column-joint assembly need to be altered. In this
retrofitting technique, haunch bars are applied to the joint panel region of the structure.
The stress flow around the joint is redirected to the beam, and a designated plastic hinge
region in the beam is developed (Christopoulos et al., 2000; Pampanin et al., 2003). The
brittle failure mechanisms around the joint panel regions can be prevented with the
proper selection of the geometry and stiffness of the haunch elements, but capacity
design considerations must be followed properly in order not to have shear failures in

144
the structural elements. The proposed haunch configuration and the modifications
experienced in the internal force path are given in Fig. 4.20 and Fig. 4.21.
Fig. 4.20 Proposed Haunch Configuration (Pampanin et al., 2006)
Fig. 4.21 Moment Diagrams of Exterior Beam-Column Subassemblies
(Pampanin et al., 2006)
Joint Shear Hinge Beam Flexural Hinge
No Haunch With Haunch
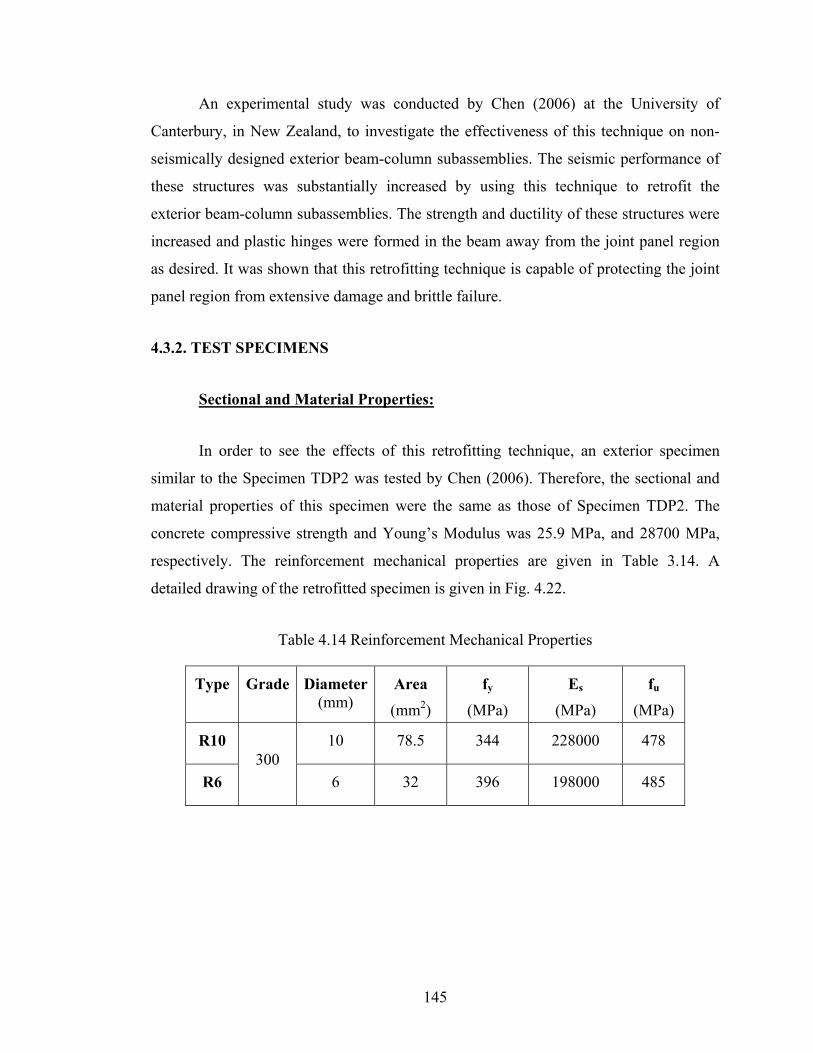
145
An experimental study was conducted by Chen (2006) at the University of
Canterbury, in New Zealand, to investigate the effectiveness of this technique on non-
seismically designed exterior beam-column subassemblies. The seismic performance of
these structures was substantially increased by using this technique to retrofit the
exterior beam-column subassemblies. The strength and ductility of these structures were
increased and plastic hinges were formed in the beam away from the joint panel region
as desired. It was shown that this retrofitting technique is capable of protecting the joint
panel region from extensive damage and brittle failure.
4.3.2. TEST SPECIMENS
Sectional and Material Properties:
In order to see the effects of this retrofitting technique, an exterior specimen
similar to the Specimen TDP2 was tested by Chen (2006). Therefore, the sectional and
material properties of this specimen were the same as those of Specimen TDP2. The
concrete compressive strength and Young’s Modulus was 25.9 MPa, and 28700 MPa,
respectively. The reinforcement mechanical properties are given in Table 3.14. A
detailed drawing of the retrofitted specimen is given in Fig. 4.22.
Table 4.14 Reinforcement Mechanical Properties
Type Grade Diameter (mm)
Area (mm2)
fy (MPa)
Es (MPa)
fu (MPa)
R10 10 78.5 344 228000 478
R6 300
6 32 396 198000 485

146
Fig. 4.22 Sectional Details for Specimen THR (Chen, 2006)
Test Set-Up and Loading:
A similar test set-up and loading protocol was followed during testing of this
retrofitted beam-column subassembly to the Specimen ED3 and ES1 which was
previously discussed.
Fig. 4.23 Test Set-up for Specimen THR (Pampanin et al., 2006)

147
4.3.3. FINITE ELEMENT MODELLING
Sectional and Material Properties:
The retrofitted beam-column subassembly was modelled with seven concrete
regions similar to the Specimen TDP2. A total of 1808 rectangular concrete elements,
with a 25 by 25 mm mesh configuration, were used to represent the exterior beam-
column subassembly. Detailed information about the concrete regions is given in Fig.
4.24 and Table 4.15.
Fig. 4.24 Material Regions for Specimen THR
REGION3 REGION 4
REGION1
REGION1
REG
ION
2
REG
ION
2
REG
ION
4
REGION5
REGION5
REGION5

148
Table 4.15 Concrete Regions for Specimen THR
Concrete Regions # 1 (#7) #2 # 3 #4 #5 #6Thickness
(mm) 230 (200) 230 200
Mesh Size (mm) 25 x 25
Purpose Bearing Column Joint Column Beam1 Beam2
ρz (%) None 0.267 0.074 0.464 0.129 0.305
A total of 720 truss elements and 28 bond-link elements were used to represent
the reinforcement and the bond regions. The reinforcement and the haunch bars were
modelled with discrete truss elements. The strengthening for those regions was obtained
by increasing the material properties of the concrete, and strengthening with
reinforcement in these regions. Similar bond-slip behaviour was assigned to the bond-
link elements as it was for the Specimen TDP1 and TDP2.
A representation of the reinforcement and the bond element configuration is
shown in Fig. 4.25, and detailed information about the reinforcement regions is given in
Table 4.16.
Table 4.16 Reinforcement Elements for Specimen THR
Reinforcement Type Location
# 1 3 R10 Column Longitudinal Reinforcement
# 2 4 R10 Beam Longitudinal Reinforcement
# 3 D14 Haunch Bars
# 4 2 R6 Transverse Reinforcement
# 5 D20 Strengthening Rebar for Test Set-Up

149
Fig. 4.25 Reinforcement and Bond Elements for Specimen THR
Loading and Restraint Conditions:
The restraint conditions consisted of a pinned support at the bottom of the lower
column, and pinned roller supports at the end of the beam. The same loading protocol
and loading system was followed for the analysis of this specimen as it was for the
Specimen TDP1 and TDP2 (see Fig. 4.23).
Reinforcement # 1
Bond #1 Bond #2
Reinforcement # 2
Reinforcement # 3
Reinforcement # 3

150
Fig. 4.26 Loading and Restraint Conditions for Specimen THR
4.3.4. RESULTS OF ANALYTICAL AND EXPERIMENTAL STUDY
In the experiment, the plastic hinge was successfully diverted to the beam. Minor
cracks were reported around the joint by Chen (2006), but the flexural crack on the beam
outside the haunched area dominated the failure mechanism. As previously explained in
this chapter, Specimen TDP2 (the as-built configuration) had sustained a brittle failure
mechanism with severe shear cracking in the joint panel zone. The hysteretic response of
the member was changed from a pinched behaviour to a ductile and stable response. The
excessive flexural cracking resulted in concrete spalling at this section of the beam. This
retrofitting technique changed the brittle failure mechanism of a non-seismically
Load Case 2 Constant Axial Load - 75 kN
Load Case 1- Displacement – 1 mm
Load Case 3 Changing Axial Load - ±1.8*Vc

151
designed beam-column subassembly to a ductile one. The test was stopped due to the
extensive cracking on the beam (Chen, 2006). The hysteretic response behaviour is
compared to the VecTor2 analysis in Fig. 4.27.
Fig. 4.27 Comparison of Story Shear vs. Story Drift Ratio for Specimen THR
The ductility ratios of the specimen was estimated in the positive and negative
loading directions, and given in Fig. 4.27 for further comparison between the analytical
and experimental results. The ratio of the predicted and observed ductility ratios for this
specimen was 1.09 in the positive loading direction, and 0.93 in the negative loading
direction.
The VecTor2 analysis captured the failure mechanism with a reasonably accurate
load-deformation response. The flexural crack in the beam caused some stability
problems during the analysis with the default concrete crack width options. The analysis
was stopped at 1.0% drift cycle. After careful investigation of the problem, a successful
analysis with the ‘Stability Check Omitted’ option for the ‘Crack Width Check’ was
accomplished. The predicted response of the retrofitted specimen was in good
-40
-30
-20
-10
0
10
20
30
40
-3 -2 -1 0 1 2 3
Experimental Analytical
Story Drift Ratio (%)
Stor
y Sh
ear F
orce
(kN
)
µANA(+ve) /µEXP(+ve) = 1.09 µANA(-ve) /µEXP(-ve) = 0.93
µ 1 2 3 4 5
µ4 3 2 15

152
correlation with the observed response. The final failure mechanism and the sequences
of events are also given in Fig. 4.29 and Table 4.17 for further comparison of the
predicted and the observed response.
The energy dissipation capacity obtained from the predicted and observed
response of the specimen was also given in comparison in Fig. 4.28, and a ratio of 1.42
was obtained.
Fig. 4.28 Comparison of Energy Dissipation of Specimen THR
Fig. 4.29 Comparison of Failure Mechanisms for Specimen THR
02468
101214
0 2 4 6 8 10 12 14 16 18
Cycle Number
Ener
gy D
issi
patio
n (k
Nm
)
ΣEANA/ΣEEXP = 1.42
Experimental Analytical
Experimental Analytical

153
Table 4.17 Sequence of Events for Specimen THR
Experimental Analytical Event
Story Shear (kN)
Story Drift (%)
Story Shear (kN)
Story Drift (%)
Positive Loading Direction
Beam Hinging 25.0 0.5 28.0 0.5
Max Story Shear 25.5 1.0 28.6 1.0
Negative Loading Direction
Beam Hinging 22.0 0.5 27.1 0.5
Max Story Shear 26.2 2.0 28.7 2.5
4.4. DISCUSSION ON RESULTS
This analytical study indicates that the VecTor2 analysis of beam-column
subassemblies with the suggested modifications were reasonably accurate in modelling
both seismically and non-seismically designed specimens. A retrofitted beam-column
subassembly was also examined during this study, and the analytical results were in
good agreement with the experimental results and captured the improved response and
failure mechanism of this retrofitted specimen. Considering an analytical study by Wong
and Vecchio (2003) on FRP retrofitted beams, it is very likely that VecTor2 can be used
as an assessment tool for future retrofitting applications.
The differences in energy dissipation capacity or strength degradations in
analytical results can only be explained through the behaviour of the bond-slip model.
The bond-slip models applied to smooth reinforced specimens were adapted from an
experimental study on concrete blocks embedded with straight and hooked end smooth
bars (Fabbrocino et al., 2002; Fabbrocino et al., 2004). Due to limited experimental data

154
on smooth bar bond behaviour, a bond model wasn’t developed. The material bond-slip
behaviour results were directly taken and used on the smooth bars without any
modification. The current smooth bond model was able to capture the peak story shear
force and ultimate ductility, but further studies are needed with the availability of new
data on smooth bars.

155
CHAPTER 5
Guidelines for Modelling Beam-Column Subassemblies
An important goal of every research endeavour should be to assimilate and
convey the knowledge gained through the process of the research. Not only should the
results of the research be provided, but also the solutions developed to problems
encountered during this research. These conclusions can be valuable for future studies in
the research area. Therefore, detailed information on the modelling of beam-column
subassemblies is provided in this chapter.
There were four different types of beam-column subassemblies that were
encountered, and modelled, in this study. Three of these were exterior beam-column
subassemblies. The first two were non-seismically designed beam-column
subassemblies designed with either 180o hooked end deformed bars or smooth bars. The
third specimen was also an exterior specimen. The beam longitudinal bars were
connected to steel plates at the end of the beam. The last specimen was a typical interior
beam-column subassembly with either smooth or deformed bars where the beam
longitudinal reinforcement passes along the beam and joint continuously.
5.1. CONCRETE
VecTor2 has three element options for concrete regions. Rectangular plane stress
elements were used for modelling the concrete regions in this study. The beam-column
subassemblies were also modelled using the quadrilateral elements for the concrete
regions. A comparison of these models showed no significant difference in the analysis
results. Therefore, the concrete regions of the specimens examined in this study were all
modelled with the rectangular elements.
Accurate meshing of concrete regions is an important parameter in any finite
element modelling study. It is always advised to start modelling with a relatively coarse
mesh. This approach will lower the computation time, and will also ease the

156
interpretation of the results. After careful examination of the results, the number of
elements can gradually be increased by using a finer mesh. The concrete meshing was
carefully studied with different options on beam-column subassemblies, and it was
found that assigning 10-15 elements in horizontal direction in the joint panel region is an
adequate rule in defining mesh parameter. The joint panel region is where all the
deformation and bond-slip action occurred; therefore it’s very important to assign an
accurate mesh to this region. In order to avoid a large number of elements and long
computation time, a finer meshing can be assigned to this region while maintaining the
aspect ratios of the types of elements that are selected.
The analysis of the beam-column subassemblies were performed using the
default behavioural models for the material properties. The reason for this approach was
to be able to examine these specimens in the simplest way that is available in VecTor2.
The material models are assigned by the user, unless the default values are found to be
adequate. All the model options should carefully be examined by the user before
assigning an option different than the default model. The detailed information on the
behavioural models are given in the “VecTor2 and FormWorks Manual” by Wong and
Vecchio (2002). The behavioural and constitutive models in VecTor2 consisted of well
known and accepted models, some of which developed through extensive experimental
research at the University of Toronto. The results of this study also provided an
understanding of these behavioural models. The capabilities of some of the model
options were also examined in this thesis. Currently, the default behavioural and
constitutive models that are suggested for starting a preliminary study, are given in
Table 5.1, and the models that best suited the specimens examined in this study are
shown on the “Definition of Models” window (see Fig. 5.1).

157
The “Hysteretic Response” feature for the concrete material models were
investigated on different specimens tested under reversed cyclic loading conditions. The
default hysteretic model option for the concrete is “Nonlinear w/ Plastic Offsets”. The
applications of this model to the beam-column subassemblies under reversed cyclic
loading conditions proved that “Palermo 2002 (w/Decay)” is a better option. The
analysis results of load-deformation behaviour with the default option resulted in higher
stiffness values compared to the experimental results. The effects of previous loading
conditions which might result in plastic deformations were successfully captured with
the “Palermo 2002 (w/Decay)” option.
Table 5.1 Default Material Models in VecTor2
Material Property Model Concrete Compression Pre-Peak Response Hognestad Parabola
Concrete Compression Post-Peak Response Modified Park-Kent
Concrete Compression Softening Vecchio 1992-A (e1/e2-Form)
Concrete Tension Stiffening Modified Bentz 2003
Concrete Tension Softening Linear
Concrete Tension Splitting Not Considered
Concrete Confined Strength Kupfer/Richard Model
Concrete Dilation Variable Kupfer
Concrete Cracking Criterion Mohr-Coulomb (Stress)
Concrete Crack Slip Check Vecchio-Collins 1986
Concrete Crack Width Check Agg/5 Max Crack Width
Concrete Hysteretic Response Nonlinear w/ Plastic Offsets

158
Fig. 5.1 Definition of Material Behaviour Models
The “Crack Width Check” was another feature that was investigated in this
study. The default option for this feature usually did not interfere with the analysis
results. However, the beam-column subassemblies designed with no or very little shear
reinforcement and/or members that were experiencing excessive flexural cracks, needed
further attention with this model. In some cases, the analysis suddenly stopped due to
numerical stability problems. If any type of stability problem occurred during the
analysis, the iteration stopped and the message “Stiffness matrix is not positive definite”
error was displayed. Neither the predicted load-deformation behaviour of the specimens,
nor the experimental results of the same specimen, showed any signs of failure at that
stage. This was experienced in modelling the non-seismically designed members. It is
advised to increase the crack width limits, if any of these kinds of stability problems are
encountered during the VecTor2 analysis.
Changes in the behavioural or constitutive models of VecTor2 should be done to
reflect the differences in the applied loading or the material properties that are specific to
159
the structure that is analyzed. The modifications without a firm understanding of each
models’ applicability area might lead to unrealistic and erroneous results. The
modifications made to match the experimental research results are never encouraged,
since there is no scientific study or physical reason to make such changes.
5.2. REINFORCEMENT
Reinforcement elements can be modelled with either smeared or discrete
reinforcement options. The initial models of the beam-column subassemblies were
constructed using smeared reinforcement elements to represent the reinforcement
regions. After a detailed investigation on the bond-slip effects of reinforcement to the
seismic performance of these structures, the selection of the discrete truss elements for
representing the reinforcement was unavoidable. Both the longitudinal and transverse
reinforcement in the specimens were modelled as discrete truss bar elements. The
application of the bond elements was only made possible by using the discrete
reinforcement elements. The use of these elements allows the local stress-strain values
on the reinforcement to be examined.
When assigning the reinforcement elements, the confinement effect of the shear
reinforcement in the beams and columns was also considered. The smeared
reinforcement was used to represent this out-of-plane confinement effect. This
modelling approach was very important for the well-confined sections of the specimens,
where the loading system or restraint conditions were introduced to the system.
Another warning that might be useful in modelling beam-column subassemblies
was a stability problem related to the reinforcement models. A stability error occurred
during the analysis of some specimens due to excessive cracking and reinforcement
shearing. This incident was related to the specimens experiencing excessive flexural
cracking at the beam-column face. The focus was given on one of the reinforcement
model options to avoid this problem. The “Dowel Action” feature has the default
“Tassios (Slip)” option available in VecTor2. If a certain stability problem during the

160
analysis was encountered the “Tassios (Strength)” option would be a solution to this
problem.
Table 5.2 Material Behaviour Models
Material Property Model Reinforcement Hysteretic Response Seckin Model (Bauschinger)
Reinforcement Dowel Action Tassios Model (Crack Slip)
Reinforcement Buckling Asatsu Model
5.3. BOND
Beam-column subassemblies are subjected to severe reversed cyclic loading
conditions under seismic effects. The integrity of these structures is crucial for the
survival of the whole structure in a moment resisting framed building. The concrete and
the reinforcement interaction play an important role in the load transfer mechanisms.
Previous research on bond-slip effects and on the seismic performance of the beam-
column subassemblies proved that ‘perfect bond’ conditions weren’t present, especially
for non-seismically designed structures. Therefore, an additional element at the interface
between the concrete and the reinforcement elements was needed for the accurate
estimation of this imperfect bonding condition. The distinction between confined and
unconfined regions, and confinement pressure values selected were done according to
the recommendations by Eligehausen et al. (1983) and the CEB-FIB MC90 (1993).
5.3.1. DEFORMED REINFORCEMENT BOND MODELLING
The bond modelling of two different types of beam-column subassemblies were
described in this section. The first one was an exterior beam-column subassembly with
an unconfined joint panel. The beam longitudinal reinforcement was not extended into
the joint, and had 90o hooked ends in Specimen ED3. Bond-slip elements were
introduced to the model similar to the suggestions made by Soroushian et al. (1988) on
modelling beam-column subassemblies. The specimen was modelled in two regions with

161
two bond material models, but the analysis results showed a problem at the connection
of the imperfectly bonded nodes to the reinforcement nodes. The specimens failed due to
flexural cracks at the nodes where imperfectly bonded elements introduced to an
element with a different bond material property. It was understood that the connection of
the perfectly bonded and imperfectly bonded elements was the main problem. Therefore,
the bond material properties were changed accordingly, and one bond material with a
perfectly bonded node was assigned to the bond-link elements. As can be seen below in
Fig. 5.2, the “Imperfect Bond” box when selected, assigns the bond and reinforcement
material property to the member that has been selected for the element. The first and last
connection nodes of the imperfectly bonded reinforcement were assigned as a perfect
node. This approach helped to avoid the unrealistic local failures between different bond
materials. The “Hooked Bar” option, which was developed based on the findings of
Eligehausen et al. (1983) and Soroushian et al. (1988), was selected with the proper
confinement pressure values as shown in Table 5.3.
Fig. 5.2 Reinforcement and Bond Region Window for Automatic Mesh Option
Bond Material

162
The configuration of bond-link elements and confinement pressure index values
that were selected for these specimens are given in Fig. 5.3 and Table 5.3.
Table 5.3 Bond Elements
Type Bond # 1
Confinement Pressure (MPa) ρv * fyv * 7.5
Hooked Bar Selected
Fig. 5.3 Bond Element Configuration for Specimen ED3
The second beam-column subassembly that required a different bond modelling
approach can either be a seismically designed exterior or an interior specimen. In the
first case, the beam longitudinal reinforcement was extended beyond the joint region
horizontally and connected to a steel plate at the back of the column. As shown in Fig
5.4, the beam longitudinal bars were welded to the steel plates, which were connected to
the column.
Bond #1Perfectly Bonded Nodes

163
Fig. 5.4 Exterior Beam-Column Subassembly
The bond elements were modelled with two different bond material models. The
transverse reinforcement along the beam provided a well-confined concrete region in the
joint. This region within the joint was defined as a confined region, and a 7.5 MPa
confinement pressure value was assigned to these elements (Eligehausen et al., 1983;
CEB-FIB MC90, 1993). The rest of the longitudinal bars were modelled by assigning
the unconfined region properties to the elements. The shear reinforcement provided in
the beam was used to estimate the confinement pressure value for this region. The
configuration of bond-link elements and confinement pressure index values selected for
each bond-link element is given in Fig. 5.5 and Table 5.4.
Steel Plates

164
Table 5.4 Bond Elements
Type Bond # 1 Bond # 2
Reinforcement Beam Top and Bottom Layer Longitudinal
Confinement Pressure (MPa) ρv * fyv * 7.5 7.5
Fig. 5.5 FE Model of Exterior Beam-Column Subassembly
The bond elements should start, and end with a perfectly bonded node. This can
only be accomplished at the member sectional configuration step by activating or de-
activating ‘Imperfect Bond’ option as illustrated in Fig. 5.6.
Bond #1 Bond #2

165
Fig. 5.6 Bond Material Connection Details
The interior beam-column subassemblies can be modelled with the same
approach. The confined bond regions within the joint panel and unconfined bond regions
at each side of the joint are shown in Fig. 5.7.
Fig. 5.7 Interior Beam-Column Subassembly
Bond #1Bond #1 Bond #2
Bond #1
Perfectly Bonded Node
Bond #2

166
5.3.2. SMOOTH REINFORCEMENT BOND MODELLING
The specimen was an exterior beam-column subassembly designed with hooked
end smooth reinforcement at the joint. The reinforcement detailing of this specimen was
modelled in two regions. As shown in Fig. 5.8, the perfect bond model was used to
represent the hooked end section, and the straight smooth bar section was modelled by
using the user defined bond-slip behaviour option. This option was recently added to the
program to be able to assign a bond-slip curve for the embedded bars (see Fig. 5.9).
Fig. 5.8 Bond Element Configuration for Hooked End Bars
As described in Chapter 4 for the smooth-bar bond behaviour models, these
beam longitudinal bars were modelled based on the experimental study results by
Fabbrocino et al. (2002). These values are given in Table 5.5.
Bond #2Bond #1

167
Fig. 5.9 Custom Input Option for Embedded Bars
Table 5.5 Bond Stress-Slip Parameters for Smooth-Bar
Bond # 1 Bond # 2 Parameter
Hooked End Straight Section
τ1 (MPa) 250 1.05
τ2 (MPa) 250 0.3
τf (MPa) 250 0.3
Δ1 (mm) 0.1 0.03
Δ2 (mm) 3.0 1
Δ3 (mm) 10.0 3
5.4. SIMULATION OF LOADING SYSTEM
The simulation of the loading system for the beam-column subassemblies was
achieved with a firm understanding of the possible failure mechanisms and of the
capabilities of VecTor2.

168
The seismic loading conditions were simulated with a displacement-based
loading, and constant axial load applied to the top of the column. The restraint
conditions allowed the movement of the columns in the horizontal direction, but limited
the vertical movement of the beams. The specimens were fixed to the reaction floor by
steel threaded bars to limit the movement in certain directions. Steel bearing plates were
also used for accurate load transfer and prevention of local failures at the support
regions.
The displacement-based loading was applied by a similar system in order to
ensure that the load transfer from the actuator to the structure was accomplished. The
simulation of this loading and support system was accomplished by strengthening these
sections. The beam ends were restrained with pinned rollers, and steel plates connected
with 20 mm steel bars were placed to the top and bottom of the beam as illustrated in
Fig. 5.10a. A similar support system used during testing was applied to displacement-
based load applied to the node as shown in Fig.5.10b. In the regions where a support or
loading system was introduced, strong and stiff concrete regions were assigned at the
section between the structure and the loading or support system. These sections were
prevented from sustaining any possible local failure with this approach.
Fig. 5.10 Support Conditions Parameter
a b

169
5.5. ANALYSIS OPTIONS
The definition of the ‘Job data’ is one of the important steps in defining the
analysis options and the loading protocol to be followed during the analysis. The ‘Job
data’ window is shown in Fig. 5.11. VecTor2 uses an iterative process during the
analysis, and the maximum number of iterations that will be computed before
proceeding to the next load stage is determined by the “Max. No. of Iterations’ option.
The default parameter is 100 for the maximum number of iterations, and this value can
be changed to lower the computation time after careful investigation of the analysis
results. The default value for ‘Dynamic averaging factor’, which is used to update the
material stiffness coefficients between the iterations, is assigned to 1.0. However, for an
accurate analysis of the non-seismically designed structures a value not higher than 0.5
for the averaging factor was required. The bond-slip behaviour under reversed cyclic
loading was accurately computed by using this value.
The loading protocols followed for the beam-column subassemblies were not
consistent for all tests. The loading might be stopped for stability reasons or the loads
were applied in different amplitudes to better simulate the seismic loading effects. This
type of loading can be accomplished with the SEED file option of VecTor2. It is
important to select the “ASCII and Binary Files” option for the result files. The default
option for this feature is “ASCII Files Only”, and this creates the results of each iteration
step in a text file format with a *.A2E extension. The “ASCII and Binary Files” option
so that an additional file with a *.A2R extension, which is essential for the combination
of separate analysis results, is created for each load increment. The “Seed File Name” is
the box where the last step of the previous analysis is stored, and the “Starting Load
Stage No.” is the first load step for the current analysis.

170
Fig. 5.11 Definition of Job Data
When cyclic and reversed cyclic loading type is selected, “Repetition” and
“Cyclic Inc. Factor” option are activated for data entry. Five different loading systems
can be applied to the program, separate from each other at the same time. However, the
increments of each load type have to be consistent with the iteration number created.
Otherwise, when one loading type is applied properly, the other one isn’t.
The displacement-based loading was applied using the “Support Displacement”
option, and the “Nodal Load” option was used to represent the axial loading applied to
the top of the columns.
5.6. INTERPRETATION OF RESULTS
After series of iterations, the analysis results can be extracted by examining the
result text files or by using the post-processor, Augustus.
Augustus (©Bentz, 1996-2007) provides a user friendly output program for
VecTor2. The general load-displacement results, average and crack stress-strains for

171
both concrete and reinforcement elements, visual crack formation and deformation of
the structure, and various other result options are available for the user. The figures, and
result data can easily be transferred to the computation software for more extensive
graphical representations.
The analysis results can also be examined using the*.A2E text files. These files
are created at the end of each load step. All the analysis results that aren’t available in
Augustus can be seen in further detail in these files. One parameter that was very
important in this study, the bond-slip behaviour, can not be observed in the Augustus
program. The stress-slip behaviour of each bond element is provided to the user for
further investigation of the interaction between the reinforcement and the concrete.
Whether the program Augustus or the result text files are selected for the
interpretation of the results, a wide range of data that might be crucial for the structure
modelled is available to the user.

172
CHAPTER 6
Discussion and Conclusions
6.1. SUMMARY
An analytical investigation was carried out to investigate the effectiveness of the
finite element modelling capabilities of VecTor2 in capturing the nonlinear cyclic
response of beam-column subassemblies. The specimens considered covered a wide
range of conditions, and included interior and exterior and seismically and non-
seismically designed beam-column subassemblies.
The specimens were examined with particular attention to the effects of shear
deformations in the joint regions and bond-slip effects of the beam longitudinal
reinforcement. The hysteretic response under seismic loading conditions, failure
mechanisms at selected story drift levels, and crack formations for each specimen were
carefully examined, and compared to the experimental results. The sequence of events
for each specimen also provided for further comparison of the predicted and the
observed behaviour of the specimens, as did the energy dissipation characteristics.
6.2. CONCLUSIONS
The analysis results for each specimen were carefully examined, and compared
to the experimentally observed behaviour, and the following conclusions can be drawn
regarding the modelling capabilities of VecTor2:
• The finite element analysis program, VecTor2 was successful in estimating the
hysteretic load-deformation response of beam-column subassemblies including load
capacity, energy dissipation, ultimate ductility and failure mode
• For the 6 exterior specimens examined, the ratio of predicted and observed shear
force capacity had a mean of 1.08, and coefficient of variation of 5 %

173
• For the 5 interior specimens, the shear force capacity had a mean of 1.00, and a
coefficient of variation of 2 %
• The ratio of predicted and observed displacement capacity for exterior specimens
had a mean of 1.01, and coefficient of variation of 4.62 %
• The ratio of predicted and observed displacement capacity for interior specimens had
a mean of 0.96, and a coefficient of variation of 6.5 %
• The predicted failure mechanisms and crack patterns for the specimens examined
also showed good correlation with the experimental results
• The current model for bond-slip in smooth reinforcement wasn’t sufficiently
accurate in simulating the behaviour of non-seismically designed beam-column
subassemblies
• The “Custom Input” option for embedded bars, introduced into the program,
provided improved simulations for specimens with smooth reinforcement,
• The bond-slip effects in non-seismically designed specimens were accurately
captured in the analyses using this “Custom Input” option for smooth reinforcement
• The ductility ratios of predicted and observed ultimate displacement for interior
specimens had a mean of 1.03, and a coefficient of variation of 13.4%,
• Similar comparison in the energy dissipation capacity calculations had a mean of
0.89, and a coefficient of variation of 22.5%,
• The correlation in the analysis and experimental behaviour of a retrofitted exterior
beam-column subassembly suggests another potential finite element modelling area
for VecTor2.

174
Overall, the finite element analysis program VecTor2 was able to model both
seismically and non-seismically designed beam-column subassemblies. It was observed
that VecTor2 analysis results showed better accuracy in estimating the seismic
performance of seismically designed beam-column subassemblies opposed to non-
seismically designed ones. Overall, however, the program exhibited good accuracy in
predicting the strength, deformation response, energy dissipation, and failure mode of
beam-column subassemblies.
6.3. RECOMMENDATIONS - VecTor2 MODELLING
The primary objective of this research was to investigate the modelling
capabilities of VecTor2 on beam-column subassemblies. Some parametric studies were
done on the specimens that were modelled, and certain conclusions were made in the
process. Ensuing recommendations for VecTor2 modelling are briefly described as
follows:
• The concrete hysteretic response under reversed cyclic conditions are best captured
by the “Palermo – Nonlinear with Cyclic Decay” option, which accounts for damage
to the concrete due to load cycling. It is recommended to perform VecTor2 analysis
on specimens that were tested under reversed cyclic loading conditions
• Some of the lightly reinforced concrete members that were modelled under the
default material model conditions showed stability problems. A decision to change
the material model options is suggested if the cause of instability is determined
• A well known approach in finite element analysis on defining the mesh is also
applicable when modelling beam-column subassemblies using VecTor2. It is always
recommended to begin with a relatively coarse mesh. After careful examination of
the results, the number of elements can gradually be increased by using a finer mesh.
This approach will decrease the amount of time spent on modelling, since too fine a
mesh will result in longer computation time. Limiting the joint area to 10 to 15

175
elements was found appropriate as a result of the finite element analysis that has
been carried out on beam-column subassemblies tested under different loading
conditions
• Bond-slip elements must be included in the modelling using the approach suggested
in Chapter 5, but it is recommended that the bond-slip behaviour in one or two
cycles in the final analysis be examined to confirm the accuracy of the analysis using
the out-put text files.
6.4. RECOMMENDATIONS FOR FUTURE RESEARCH
The study presented here included an analytical investigation of the behaviour of
beam-column subassemblies that were tested by various research groups. Some of the
specimens analyzed had limited information regarding their experimental behaviour. A
comparison of experimental and analytical response regarding bond-slip behaviour
under reversed cyclic loading conditions would be useful for seismic assessment of
beam-column subassemblies.
Additional experimental research on non-seismically designed interior beam-
column subassemblies is needed to better test the capabilities of VecTor2 in modelling
these structures. The experimental data available on smooth reinforcement behaviour
was also found to be inadequate to develop a bond model. Most of the tests involving
smooth reinforcement were limited to monotonic loading conditions, and therefore a
detailed experimental research program on straight and end-hooked smooth bars
subjected to cyclic loading is needed. While some such studies were described in this
thesis, they were limited to certain sizes of smooth bars. Thus, there is insufficient
experimental data to make revisions on the current smooth embedded bar bond model
inVecTor2.
The cyclic behaviour of the bond-slip model that is currently used in VecTor2
needs to be further studied due to reasons described in Chapter 2. The energy dissipation
capacity captured will likely be much improved if the necessary revisions are made.

176
A retrofitted beam-column subassembly was also modelled using VecTor2, and
showed reasonably accurate results in the predicted hysteretic response, failure mode,
and crack formations. The results of this research confirmed that VecTor2 is also
capable of modelling members with retrofitting applications.

177
REFERENCES
Abrams, D.A., 1913. “Tests of Bond between Concrete and Steel’, University of Illinois,
Bulletin No. 71, 240 pp.
Bentz, E., 1996-2007. “Augustus-Finite Element Analysis of Reinforced Concrete Post-
Processor for VecTor2 and TRIX”, http://www.civ.utoronto.ca/vector, Last Accessed
Sep. 17, 2007.
Bentz, E.C., 2000 "Sectional Analysis of Reinforced Concrete Members," PhD Thesis,
Department of Civil Engineering, University of Toronto, 310 pp.
Bertero, V.V., and Popov, E.P., 1977. “Seismic Behaviour of Ductile Moment-Resisting
Reinforced Concrete Frames”, Reinforced Concrete Structures in Seismic Zones, ACI
Special Publication, SP-53, American Concrete Institute, Detroit, Michigan.
CEB-FIB Model Code 90, 1993. Bulletin d’ Information No. 213-214
Chen, Te-Hsui, 2006. “Retrofit Strategy of Non-Seismically Designed Frame Systems”,
Masters Thesis. Civil Engineering Department, University of Canterbury, New Zealand.
Dhakal, R.D., Pan, T., Irawan, P., Tsai, K., Lin, K, and Chen, C., 2005. “Experimental
Study on the Dynamic Response of Gravity-Load Designed Reinforced Concrete
Connections”, Engineering Structures, Vol. 27, pp.75-87.
Eligehausen, R., Popov, E.P., and Bertero, V.V., 1983. “Local Bond Stress-Slip
Relationship of Deformed Bars under Generalized Excitations”, EERC Report 83-23,
Earthquake Engineering Research Center, University of California, Berkeley, California.
Elmorsi, M., Kianoush, R. M., and Tso, W.K., 2000. “Modelling Bond-Slip
Deformations in Reinforced Concrete Beam-Column Joints”, Canadian Journal of Civil
Engineering, Vol. 27, pp. 490-505.

178
Fabbrocino, G., Verderame, G.M., and Manfredi, G., 2002. “Experimental Behaviour of
Straight and Hooked Smooth Bars in Existing R.C. Buildings”, 12th European
Conference on Earthquake Engineering, PN.393, London.
Fabbrocino, G., Verderame, G.M., and Manfredi, G., and Edoardo, C., 2004. “Structural
Models of Critical Regions in Old-Type RC Frames with Smooth Rebars”, Engineering
Structures, Vol. 26, Iss.4, pp. 2137-2148.
Feldman, L.R., and Barlett, F.M., 2005. “Bond Strength Variability in Pullout
Specimens with Plain Reinforcement”, ACI Structural Journal, Vol. 102, Iss.6, pp. 860-
867.
Filippou, F.C., Popov, E.P., and Bertero V.V., 1983. “Effect of Bond Deterioration on
Hysteretic Behaviour of Reinforced Concrete Joints”, EERC Report 83-19, Earthquake
Engineering Research Center, University of California, Berkeley, California.
Fleury, F., Reynouard, J.-M., and Merabet, O., 2000. “Multicomponent Model of
Reinforced Concrete Joints for Cyclic Loading”, ASCE Journal of Engineering
Mechanics, Vol. 126, No.8, pp. 804-811.
Gan, Y., 2000. “Bond Stress and Slip Modeling in Nonlinear Finite Element Analysis of
Reinforced Concrete Structures”, Masters Thesis, Department of Civil Engineering,
University of Toronto, 251 pp.
Hakuto, S., Park, R., and Tanaka, H.,1999. “Effect of Deterioration of Bond of Beam
Bars Passing through Interior Beam-Column Joints on Flexural Strength and Ductility”,
ACI Structural Journal, Vol. 96, Iss.5, pp. 858-864.
Kankam, C.K., 1997. “Relationship of Bond Stress, Steel Stress, and Slip in Reinforced
Concrete”, ASCE Journal of Structural Engineering, Vol. 123, No.1, pp. 79-85.

179
Kupfer, H., Hilsdorf, H.K., and Rusch, H., 1969. “Behavior of Concrete under Biaxial
Stress”, ACI Journal, Vol. 87, Iss. 2, pp. 656-666.
Limkatanyu and Spacone, 2003. “Effect of Reinforcement Slippage on Non-linear
Response under Cyclic Loadings of RC Frame Structures”, Earthquake Engineering and
Structural Dynamics, Vol. 32, pp. 2407-2424.
Lowes, N.L., and Altoontash, A., 2003. “Modelling Reinforced-Concrete Beam-Column
Joints Subjected to Cyclic Loading”, ASCE Journal of Structural Engineering, Vol. 129,
No.12, pp. 1686-1697.
Menegotto, M., and Pinto, P., 1973. “Method of Analysis for Cyclically Loaded
Reinforced Concrete Plane Frames Including Changes in Geometry and Non-Elastic
Behavior of Elements under Combined Normal Force and Bending.” Proc., IABSE
Symp. on Resistance and Ultimate Deformability of Structures Acted on by Well Defined
Repeated Loads, Lisbon, 15-22.
Mitra, N., and Lowes, N.L., 2004. “Evaluation and Advancement of a Reinforced
Concrete Beam-Column Joint Model”, 13th World Conference on Earthquake
Engineering, PN 1001, Vancouver, Canada.
Ngo, D., and Scordelis, A.C., 1967. “Finite Element Analysis of Reinforced Concrete
Beams”, ACI Journal, Vol. 64, Iss. 3, pp. 152-163.
Shiohara, H., 2001. “New Model for Shear Failure of RC Interior Beam-Column
Connections”, ASCE Journal of Structural Engineering, Vol. 127, No. 2, pp. 152-160.
Shiohara, H., 2004. “Quadruple Flexural Resistance in R/C Beam-Column Joints”, 13th
World Conference on Earthquake Engineering, PN 491, Vancouver, Canada.

180
Palermo, D., and Vecchio, F.J., 2002. “Behaviour and Analysis of Reinforced Concrete
Walls Subjected to Reversed Cyclic Loading”, Publication No. 2002-01, Department of
Civil Engineering, University of Toronto, 351 pp.
Park, R., 2002. “A Summary of Results of Simulated Seismic Load Tests on Reinforced
Concrete Beam-Column Joints, Beams and Columns with Substandard Reinforcing
Details”, Journal of Earthquake Engineering, Vol. 6, No. 2, pp. 147-174.
Park, Y.J., and Ang, A.H.S., 1985. “Mechanistic seismic Damage Model for Reinforced
Concrete”, ASCE Journal of Structural Engineering, Vol. 111, No. 4, pp. 722-739.
Park, R., and Paulay, T., 1975. “Reinforced Concrete Structures”, Wiley Publishing,
NewYork, 769 p.
Paulay, T., 1994. “The Fourth Mallet-Milne Lecture: Simplicity and Confidence in
Seismic Design”, Wiley, Chichester.
Pampanin, S., Calvi, G.M., and Moratti, M., 2002. “Seismic Behaviour of RC Beam-
Column Joints Designed for Gravity Loads”, 12th European Conference on Earthquake
Engineering, PN.727, London.
Pampanin, S., Magenes, G., and Carr, A., 2003. “Modelling of Shear Hinge Mechanism
in Poorly Detailed RC Beam-Column Joints”, fib2003 Symp. Concrete Struct. in Seismic
Regions, Athens.
Pampanin, S., and Christopoulos, C, 2003. “Non-Invasive Retrofit of Existing RC
Frames Designed for Gravity Loads Only”. fib2003 Symp. Concrete Struct. in Seismic
Regions, Athens.
Pampanin, S., 2005. “Vulnerabiltiy Assesment and Retrofitting Strategies for Existing
Under-Designed R.C. Frame Buildings”, 2005 Annual Conference of the New Zealand
Society of Earthquake Engineering, Wairakei.

181
Pampanin, S., and Christopoulos, C, and Chen, T.-H, 2006. “Development and
Validation of a Metallic Haunch Seismic Retrofit Solution for Existing Under-Designed
RC Frame Buildings”, Earthquake Engineering and Structural Dynamics, Vol. 35, pp.
1739-1766.
Pochanart, S., and Harmon, T., 1989. “Bond-Slip Model for Generalized Excitations
Including Fatigue”, ACI Materials Journal, Vol. 86, Iss. 5, pp. 465-474.
Richart, F.E., Brandtzaeg, A., and Brown, R.L., 1928. “A Study of the Failure of
Concrete under Combined Compressive Stresses”, Bulletin No.185, University of
Illinois Engineering Experimental Station, Urbana, Illinois, 104 pp.
Seckin, M., 1981. "Hysteretic Behaviour of Cast-in-Place Exterior Beam-Column-Slab
Subassemblies", Ph.D. Thesis, Department of Civil Engineering, University of Toronto,
266 pp.
Soroushian, P., Obasaki, K., Nagi, M., and Rojas, M.C., 1988. “Pullout Behavior of
Hooked Bars in Exterior Beam-Column Connections”, ACI Structural Journal, Vol. 85,
Iss.3, pp.269-276.
Soroushian, P., and Choi, K.B., 1989. “Local Bond of Deformed Bars with Different
Diameters in Confined Concrete”, ACI Structural Journal, Vol. 86, Iss.2, pp.217-222.
Soroushian, P., Obasaki, K, and Marikunte, S., 1991. “Analytical Modeling of Bonded
Bars under Cyclic Loads”, ASCE Journal of Structural Engineering, Vol. 117, No.1,
pp.48-60.
Vecchio, F.J. and Collins, M.P., 1982. "Response of Reinforced Concrete to In-Plane
Shear and Normal Stresses", Publication No. 82-03, Department of Civil Engineering,
University of Toronto, 332 pp.
182
Vecchio, F.J., and Collins, M.P., 1986. “The Modified Compression Field Theory for
Reinforced Concrete Elements Subject to Shear”, ACI Structural Journal, Vol. 83, Iss.2,
pp. 219-231.
Vecchio, F.J., 2000. “The Disturbed Stress Field Model for Reinforced Concrete:
Formulation”, ASCE Journal of Structural Engineering, Vol. 126, No.9, pp. 1070-1077.
Vecchio, F.J., Bentz, E.C. and Collins, M.P., 2004. “Tools for Forensic Analysis of
Reinforced Concrete Structures”, Computers and Concrete, Vol. 1, No.1, pp. 1-14.
Viwathanatepa, S., Popov, E.P., and Bertero, V.V., 1979. “Effects of Generalized
Loadings on Bond of Reinforcing Bars Embedded in Confined Concrete Blocks”,
UBC/EERC Report 79/22, Earthquake Engineering Research Center, University of
California, Berkeley, California.
Walraven, J.C., and Reinhardt, H.W., 1981. “Theory and Experiments on the
Mechanical Behaviour of Cracks in Plain and Reinforced Concrete Subjected to Shear
Loading”, Concrete Mechanics – Part A, Heron, Vol. 26, No. 4, 65 pp.
Wong, P.S., and Vecchio, F.J., 2002. “VecTor2 and FormWorks User’s Manual”,
Technical Report, Department of Civil Engineering, University of Toronto, 217 p.