Embed Size (px)
Citation preview
Noninvasive, optical detection of diabetes: model studies with porcine skin E.L. Hull, M.N. Ediger and A.H.T. Unione
InLight Solutions, 800 Bradbury SE, Albuquerque, NM 87106 [email protected], [email protected]
E.K. Deemer, M.L. Stroman and J.W Baynes Department of Chemistry and Biochemistry, University of South Carolina, 631 Sumter Street, Columbia, SC 29208
Abstract: An in vitro study was performed to evaluate noninvasive spectroscopic measurement of advanced glycation endproducts (AGEs) in skin collagen. A porcine dermis preparation was incubated in solutions simulating normal and hyperglycemic conditions. The AGEs kinetics of increase were determined by HPLC and GC/MS assays, and compared to near-infrared (NIR) and ultraviolet/visible fluorescence skin spectra. Multivariate analysis indicated that, although NIR did not discriminate between collagen samples exposed to different glucose concentrations, fluorescence changes were readily detected and correlated strongly with skin concentration of AGEs. These results suggest that measurement of skin AGEs by fluorescence spectroscopy may be useful for detection and diagnosis of type II diabetes.
©2004 Optical Society of America
OCIS codes: (170.1470) Blood/tissue constituent monitoring, (170.1580) Chemometrics, (170.6510) Spectroscopy, tissue diagnostics
References and Links
1. S. Wild, G. Roglic, R. Sicree, A. Green, H. King, “Global burden of diabetes mellitus in the year 2000,” in
Global Burden of Disease 2000 (World Health Organization, Geneva, 2003). 2. P. Hogan, T. Dall, P. Nikolov, American Diabetes Association, “Economic Costs of Diabetes in the U.S. in
2002,” Diabetes Care 26, 917-932 (2003). 3. “National diabetes fact sheet: general information and national estimates on diabetes in the United States
2000,” (Centers for Disease Control and Prevention, U.S. Department of Health and Human Services, Atlanta, GA 2002).
4. M.I. Harris, K.M. Flegal, C.C. Cowie, M.S. Eberhardt, D.E. Goldstein, R.R. Little, H.M. Wiedmeyer and D.D. Byrd-Holt, “Prevalence of diabetes, impaired fasting glucose, and impaired glucose tolerance in U.S. adults, The Third National Health and Nutrition Examination Survey, 1988-1994,” Diabetes Care 21, 518-24 (1998).
5. The Diabetes Control and Complications Trial Research Group, “The effect of intensive treatment of diabetes on the development and progression of long-term complications in insulin-dependent diabetes mellitus,” N. Eng. J. Med. 329, 977-986 (1993).
6. UK Prospective Diabetes Study (UKPDS) Group, “Intensive blood-glucose control with sulphonylurias or insulin compared with conventional treatment and risk of complications in patients with type 2 diabetes (UKPDS 33),” Lancet 352, 837-853 (1998).
7. M.I. Harris and R.C. Eastman, “Early detection of undiagnosed diabetes mellitus: a US perspective,” Diabetes Metab. Res. Rev. 16, 230-236 (2001).
8. S.M. Manley, L.C. Meyer, H.A.W. Neil, I.S. Ross, R.C. Turner and R.R. Holman, “UKPDS 6 Complications in newly diagnosed type 2 diabetic patients and their association with different clinical and biologic risk factors,” Diabetes Research 13, 1-11 (1990)
9. M.I. Harris, R. Klein, T.A. Welborn, and M.W. Knuiman, “Onset of NIDDM Occurs at least 4-7 yr before clinical diagnosis,” Diabetes Care 15, 814-819 (1992).
10. American Diabetes Association Position Statement, “Screening for Type 2 Diabetes,” Diabetes Care 26, S21-S24 (2003).
11. Diabetes Detection Initiative, US Department of Health and Human Services, http://www.ndep.nih.gov/ddi/.
(C) 2004 OSA 20 September 2004 / Vol. 12, No. 19 / OPTICS EXPRESS 4496#5017 - $15.00 US Received 10 August 2004; revised 9 September 2004; accepted 10 September 2004
12. M.M. Engelgau, K.M.V. Narayan, and W.H. Herman, “Screening for Type 2 diabetes,” Diabetes Care 23, 1563-1580 (2000).
13. The Third National Health and Nutrition Examination Survey (NHANES III, 1988-94), National Center for Health Statistics, Centers for Disease Control and Prevention (1996), http://www.cdc.gov/nchs/about/major/nhanes/NHANESIII_Reference_Manuals.htm
14. J.M. Mooy, P.A. Grootenhuis, H. de Vries, P.J. Kostense, C. Popp-Snijders, L.M. Bouter, R.J. Heine, “Intra-individual variation of glucose, specific insulin and proinsulin concentrations measured by two oral glucose tolerance tests in a general Caucasian population: the Hoorn Study,” Diabetologia 39, 298-305 (1996).
15. N. Verzijl, J. DeGroot, S.R. Thorpe, R.A. Bank, J.N. Shaw, T.J. Lyons, J.W.J. Bijlsam, F.P.J.G. Lafeber, J.W. Baynes, and J.M. TeKoppele, “Effect of collagen turnover on the accumulation of advanced glycation end products,” J. Biol. Chem. 275, 39027-39031 (2000).
16. D.G. Dyer, J.A. Dunn, S.R. Thorpe, K.E. Bailie, T.J. Lyons, D.R. McCance, and J.W. Baynes, “Accumulation of Maillard reaction products in skin collagen in diabetes and aging,” J. Clin. Invest. 91, 2463-2469 (1993).
17. R. McCance, D.G. Dyer, J.A. Dunn, K.E. Bailie, S.R. Thorpe, J.W. Baynes, and T.J.Lyons, “Maillard reaction products and theor relation to complications in insulin-dependent diabetes mellitus,” J. Clin. Invest. 91, 2470-2478 (1993).
18. B. Buckingham and K.M. Reiser, “Relationship between the Content of Lysyl Oxidase-dependent Cross-links in Skin Collagen, Nonenzymatic Glycosylation, and Long-Term Complications in type 1 Diabetes Mellitus,” J. Clin. Invest. 86, 1046-1054 (1990).
19. V.M. Monnier, O. Bautista, D. Kenny, D.R. Sell, J. Fogarty, W. Daahms, P.A. Cleary, J. Lachin, S. Genuth, and the DCCT Skin Collagen Ancillary Study Group, “Skin collagen glycation, glycoxidation, and crosslinking are lower in subjects with long-term intensive versus conventional therapy of type 1 diabetes,” Diabetes 48, 870-880 (1999).
20. P. Geladi, J. Nyström, J.W. Eriksson, A. Nilsson, F. Lithner, and B. Lindholm-Sethson, “A multivariate NIR study of skin alterations in diabetic patients as compared to control subjects,” J. Near Infrared Spectroscopy 8, 217-27 (2000).
21. J. Nystrom, B. Lindholm-Sethson, L. Stenberg, S. Ollmar, J.W. Eriksson, and P. Geladi, “Combined near-infrared spectroscopy and multifrequency bioimpedance investigation of skin alterations in diabetes patients based on multivariate analyses,” Med. Biol. Eng. Comput. 4, 324-9 (2003).
22. H.M. Heise, S. Haiber, D. Ihrig, M. Licht, M. Stücker and C. Moll, “Non-Invasive Diabetes Screening By Near Infrared Spectroscopy,” poster presentation at the 3rd Annual Meeting of the Diabetes Technology Society, San Francisco, CA, November 6-8, 2003.
23. P. Koefoed Theil, T. Hansen, M. Larsen, O. Pedersen, and H. Lund-Andersen, “Lens autofluorescence is increased in newly diagnosed patients with NIDDM,” Diabetologia 39, 1524-1527 (1996).
24. T. Abiko, A. Abiko, S. Ishiko, M. Takeda, S. Horiuchi, and A. Yoshida A, “Relationship between autofluorescence and advanced glycation end products in diabetic lenses,” Exp. Eye Res. 68, 361-366 (1999).
25. N. Yu, B.S. Krantz, J.A. Eppstein, K.D. Ignotz, M.A. Samuels, J.R. Long, and J. Price, “Development of a noninvasive diabetes screening device using the ratio of fluorescence to Rayleigh scattered light,” J. Biomed. Optics. 1, 280-288 (1996).
26. C.M. Fleming, H.T. Davis, R. Ratner, C.D. Brown, M.N. Ediger, E.L. Hull, R. Udell, and J.D. Maynard, “Use of Near-Infrared Spectroscopy to Detect Diabetes Based on Noninvasive Skin Measurements,” poster presentation at the 3rd Annual Meeting of the Diabetes Technology Society, San Francisco, CA, November 6-8, 2003.
27. D.L. Price, P.M. Rhett, S.R. Thorpe, and J.W. Baynes, “Chelating activity of Advanced Glycation End-product inhibitors,” J. Biol. Chem. 276, 48967-48972 (2001).
28. L. Brancaleon, G. Lin, and N. Kollias, “The in vivo fluorescence of tryptophan moieties in human skin increases with UV exposure and is a marker for epidermal proliferation,” J. Invest. Dermatol. 113, 977-982 (1999).
29. R. Gilles, G. Zonios, R.R. Anderson, and N. Kollilas, “Fluorescence excitation spectroscopy provides information about human skin in vivo,” J. Invest. Dermatol. 115, 704-707 (2000).
30. J. Wu, M.S. Feld, and R.P. Rava, “Analytical model for extracting intrinsic fluorescence in turbid media,” Appl. Opt. 32, 3585-3595 (1993).
31. Q. Zhang, M.G. Müller, J. Wu, and M.S. Feld, “Turbidity-free fluorescence spectroscopy of biological tissue,” Opt. Lett. 25: 1451-1453 (2000).
32. M.G. Muller, I. Georgakoudi, Q. Zhang, and M.S. Feld, “Intrinsic fluorescence spectroscopy in turbid media: disentagling the effects of scattering and absorption,” Appl. Opt. 25, 4633-4646 (2001).
33. C.M. Gardner, S.L. Jacques, and A.J. Welch, “Fluorescence spectroscopy of tissue: recovery of intrinsic fluorescence from measured fluorescence,” Appl. Opt. 35:1780-1792 (1996).
34. J.C. Finlay, D.L. Conover, E.L. Hull, and T.H. Foster, “Prophyrin bleaching and PDT-induced spectral changes are irradiance-dependent in ALA-sensitized normal rat skin in vivo,” Photochem. Photobiol. 73, 54-63 (2001).
35. H. Martens and T. Naes, Multivariate Calibration, (John Wiley and Sons, Chichester, 1989). 36. D.M. Haaland and E.V. Thomas, “Partial least-squares methods for spectral analyses. 1. Relation to other
quantitative calibration methods and the extraction of qualitative information,” Anal. Chem. 60, 1193-1202 (1988).
(C) 2004 OSA 20 September 2004 / Vol. 12, No. 19 / OPTICS EXPRESS 4497#5017 - $15.00 US Received 10 August 2004; revised 9 September 2004; accepted 10 September 2004
37. H. Akaike, “Information theory and an extension of the maximum likelihood principle,” Proc 2nd Int’l Symp Information Theory, 267-281, (1973).
38. M.H. Dominiczak, J. Bell, N.H. Cox, D.C. McCruden, S.K. Jones, A.Y. Finlay, I.W. Percy-Robb, and B.M. Frier, “Increased collagen-linked fluorescence in skin of young patients with type 1 diabetes mellitus,” Diabetes Care 13, 468-72 (1990).
39. W. Hanna, D. Friesen, C. Bombardier, D. Gladman, and A. Hanna, “Pathologic features of diabetic thick skin,” J. Am. Acad. Dermatol. 16, 546-553 (1987).
40. B.A. Buckingham, J. Uitto, C. Sandborg, T. Keens, T. Roe, G. Costin, F. Kaufman, B. Bernstein, B. Landing, and A. Castellano, “Scleroderma-like changes in insulin-dependent diabetes mellitus: Clinical and biochemical studies,” Diabetes Care 7, 163-169 (1984).
41. K.E.Juhani Airaksinen, P.I. Salmela, M.K. Linnaluoto, M.J. Ikaheimo, K. Ahola, and L.J. Ryhanen, “Diminished arterial elasticity in diabetes: association with fluorescent advanced glycosylation end products in collagen,” Cardiovasc. Res. 27, 942-945 (1993).
42. R. Reihsner, M. Melling, W. Pfeiler, and E.J. Menzel, “Alterations of biochemical and two-dimensional biomechanical properties of human skin in diabetes mellitus as compared to effects of in vitro non-enzymatic glycation,” Clin. Biomech. 15, 379-386 (2000).
43. S Yeh, O.S. Khalil, C.F. Hanna, and S. Kantor, “Near-infrared thermo-optical response of the localized reflectance of intact diabetic and nondiabetic human skin,” J. Biomed. Optics 8, 534-544 (2003).
44. C. Huberty, Applied Discriminant Analysis, (J Wiley and Sons, NY, 1994).
1. Introduction
1.1 The diabetes problem and the need for screening
Diabetes mellitus is a large and growing problem throughout the world’s developed and developing nations. The World Health Organization (WHO) assessed the global diabetes caseload at 173 million for the year 2000 [1]. In the United States, the American Diabetes Association (ADA) estimated that in 2002 approximately 18 million individuals were living with diabetes and projected that by 2020 this figure will exceed 25 million [2]. Worse yet, roughly one-third of those with diabetes in the US are undiagnosed and unaware of their disease [3,4]. Persons with diabetes are at increased risk for debilitating complications such as renal failure, blindness, nerve damage and vascular disease. Although risk for or progression of complications can be reduced through tight glucose control combined with drug therapy and lifestyle changes [5,6], effective mitigation of complications begins with detection. Unfortunately, current diagnosis of Type 2 diabetes often occurs years after disease onset and after complications are already present [78-9]. Both the ADA and the Department of Health and Human Services (DHHS) advocate more aggressive screening of individuals at risk for diabetes [10,11].
1.2 Limitations of current screening methods
The primary screening and diagnostic tests currently in use - the Fasting Plasma Glucose (FPG) and the Oral Glucose Tolerance Test (OGTT) - leave room for improvement. The tests are inconvenient and unpleasant. Both require venous draws and are fasting tests so they can only be practically administered during morning appointments. For the OGTT, the measurement occurs 2 hours after the patient ingests a 75g oral glucose load. Numerous studies have evaluated the performance of each of these tests in diverse populations. Specificity (correctly identifying absence of disease) of the FPG test exceeds 96% but the sensitivity (correctly identifying disease) is only on the order of 50% [12,13]. Thus, approximately one-half of those with diabetes are misclassified by a single FPG test. The sensitivity and specificity for the OGTT are 73% and 80%, respectively, but the test suffers from relatively poor reproducibility (coefficient of variation ~17%)[14].
Consequently, an accurate, convenient and noninvasive screening test would be an attractive alternative to current tests. Ideally, the improved screening test would measure an analyte that is directly related to progression of the disease and the risk of complications, and the chemical marker would be invariant to within- or between-day changes in the patient. In addition, the measurement should offer sufficient accuracy to detect diabetes in its early stages and possess adequate precision to eliminate the requirement for repeat, confirmatory
(C) 2004 OSA 20 September 2004 / Vol. 12, No. 19 / OPTICS EXPRESS 4498#5017 - $15.00 US Received 10 August 2004; revised 9 September 2004; accepted 10 September 2004
testing. The process of protein glycation provides several endproducts that are attractive candidates for such a measurement.
1.3 Glycation endproducts in skin as a basis for diabetes screening
Protein glycation is a multi-stage reaction that begins with formation of a sugar adduct to protein, known as a fructosamine or Amadori compound, which gradually matures to form numerous stable adducts and crosslinks, collectively denoted ‘Advanced Glycation Endproducts’ (AGEs). Some AGEs require oxidation chemistry for their formation and are known as glycoxidation products. Collagen is a protein that readily undergoes glycation and glycoxidation. Because of its long half-life, the level of AGEs in collagen acts as a long-term integrator of overall glycemia that is insensitive to short- or intermediate-term fluctuations in glycemic control [15]. Consequently, AGEs accumulate naturally during healthy aging, but at significantly accelerated rates in persons with diabetes. Two of the most frequently studied skin AGEs are pentosidine, a fluorescent crosslink between lysine and arginine residues, and the lysine derivative, carboxymethyl-lysine (CML) [16]. Levels of pentosidine and CML in the skin are positively correlated with the severity of retinopathy, nephropathy and neuropathy [17-19]. Thus, skin AGEs are an indicator of systemic damage to protein in diabetes and a metric of a patient’s risk for complications. In addition, due to the mild to severe hyperglycemia associated with pre-diabetes and type 2 diabetes, individuals who are in the early stages of this continuum will accumulate AGEs at higher than normal rates in their tissues. Thus, given sufficient assay sensitivity, an AGE measurement offers the promise to detect early departure from normal glycemia.
AGEs are currently assayed by invasive procedures requiring a biopsy specimen, and consequently are not used in diabetes screening or diagnosis. Optical spectroscopy offers one potential avenue of early, noninvasive detection of diabetes by quantifying AGEs in the skin or other tissues. Several laboratories have recently reported changes in the near-infrared (NIR) reflectance spectra of the skin of diabetics relative to age-matched controls, and have hypothesized that they originate with diabetes-induced changes in skin [20] or accumulation of skin-collagen AGEs [21,22]. These investigators have proposed further studies of the origins of these spectral changes and the use of noninvasive NIR spectroscopy for detection of diabetes. In addition, noninvasive ocular fluorescence measurements have been investigated on numerous occasions for diabetes screening and AGE quantitation [e.g., 23,24]. These reports and others have spurred at least one commercial research and development program for noninvasive diabetes screening via measurements of crystalline lens fluorescence (Roche, Accu-Chek D-Tector) [25]. To date, however, these studies have not yet led to a clinically useful instrument.
We have conducted a series of studies of human subjects to evaluate the ability of both NIR and fluorescence spectroscopy to classify patients by their diabetes status [26]. Results from these preliminary investigations demonstrate classification performance that is comparable to FPG in the tested population and encourages further research into noninvasive diabetes screening. The subject of this report is an in vitro study that was designed to test the hypothesis that the in vivo spectroscopic classifications originate from optical detection of skin-collagen AGEs.
2. Materials and methods
2.1 Specimen preparation and incubation protocol
Sections of freshly harvested porcine skin were scraped with a blade to remove the epidermis and subcutaneous tissue, yielding collagen-rich dermal layers. Each of four large sections of porcine dermis (~75 x 50 mm, thickness ~3 mm) was rinsed and then subdivided into three smaller specimens (~25 x 50 mm). Each specimen was uniquely identified on one end with notches and small punched holes. The specimens were grouped into three sets of four specimens - one specimen from each dermal section per set. Four additional, thinner sections
(C) 2004 OSA 20 September 2004 / Vol. 12, No. 19 / OPTICS EXPRESS 4499#5017 - $15.00 US Received 10 August 2004; revised 9 September 2004; accepted 10 September 2004
were similarly prepared and subdivided to create smaller, thinner specimens (~10 x 40 mm, thickness ~1 mm) and likewise grouped into sets.
Each of the three sets of eight specimens (4 thick + 4 thin) was placed in a flask containing one of three chemical solutions that allowed systematic control of AGE formation. The solutions were 0.2 M phosphate buffer containing 1) 5 mM glucose, 2) 500 mM glucose, or 3) 500 mM glucose with 5 mM diethylenetriaminepentaacetic acid (DTPA) and 5 mM phytic acid. The solutions were gently agitated for 5 weeks in a shaker bath maintained 37 °C.
Medium 1, with 5 mM glucose, was chosen to mimic physiological glucose concentration. Collagen AGE accumulation in Medium 2 (500 mM glucose) was expected to be much greater than that in Medium 1. The inclusion of DTPA and phytic acid in Medium 3 was designed to chelate metal ion catalysts of glycoxidation reactions, thereby suppressing AGE accumulation, relative to Medium 2 [27]. To further inhibit AGE formation in Medium 3, the incubations were conducted under nitrogen (anaerobic conditions) when measurements were not being performed. Thus, Medium 3 served as an additional control to distinguish spectral differences arising merely from elevated glucose concentrations. Throughout this report, the specimens incubated in Media 1, 2 and 3 will be denoted as normoglycemic, hyperglycemic and anaerobic, respectively.
2.2 Spectroscopic apparatus: NIR measurements
Fourier-transform NIR (FTIR) spectroscopy was performed in both reflectance and transmission modes using two NIR spectrometers designed and manufactured at InLight Solutions. For reflectance measurements, a proprietary optical system coupled the light source and spectrometer to the fiber-based skin reflectance sampler. The sampler surface was maintained at 37 °C. The transmission spectroscopy system used discrete optics to couple its light source through a temperature-controlled (37 °C) cuvette holder and into a second spectrometer. A specimen frame was fabricated to hold transmission specimens within the cuvette holder. In addition to positioning the specimen in the beam path, the quartz-windowed, brass frame gently compressed specimens to achieve uniform tissue thickness (1.5 mm). Both spectrometers operated at 32 cm-1 resolution, and the analysis focused on the 4200-7200 cm-1 (~1.4-2.4 µm) spectral region.
2.3 Spectroscopic apparatus: fluorescence measurements
The fluorescence spectra were obtained using a research-grade instrument specifically designed for skin fluorescence measurements (SkinSkan, Jobin-Yvon, Edison, NJ). A fiber-based probe comprised of 31 illumination and 31 collection fibers optically coupled the instrument to the specimens. The fibers in the distal end of the probe were randomly arranged in a close-pack array (diameter ~ 0.6 cm). The excitation source of the SkinSkan is a 100W Xe arc lamp filtered by a double 1/8-meter monochromator yielding an illumination bandpass of approximately 5 nm. The detection portion of the instrument contains another double monochromator and a photomultiplier tube. The excitation and detection monochromators are independently controllable to enable a variety of spectral collection schemes including synchronous scanning for diffuse reflectance measurements.
2.4 Spectra acquisition protocol
During the 5-week incubation period, NIR and fluorescence spectra were acquired twice weekly from each specimen, yielding 10 spectroscopic measurements per specimen. NIR spectra were collected in 60 sec scans at an FTIR scan-rate of 7 Hz. During each measurement session, 3 replicate scans were obtained for each specimen. Between scans, specimens were removed from the optical sampling stage and returned to their respective incubation media for rehydration. Solution sterility was ensured by qualitatively maintaining a small amount of toluene (enough to form a visible droplet) in each solution.
Fluorescence spectra were acquired in a set of three spectral scans that were selected to interrogate the dominant fluorophores of the skin reported in the literature [28,29]. Two
(C) 2004 OSA 20 September 2004 / Vol. 12, No. 19 / OPTICS EXPRESS 4500#5017 - $15.00 US Received 10 August 2004; revised 9 September 2004; accepted 10 September 2004
excitation scans (X1: λx = 315-385 nm, λm = 400 nm; and X2: λx = 325-445nm, λm = 460 nm) and one emission scan (M1: λx = 325 nm, λm = 340-500 nm) were replicated 4 times for each specimen during each acquisition session. Scans were composed of discrete 2.5 nm steps with 0.2 sec dwell at each step. In addition, diffuse reflectance spectra (λr = 315-550 nm) were also collected for each specimen at each set of replicate spectral measurements. Finally, at the beginning and end of acquisition sessions, measurements of a reflectance standard and lamp reference channel were collected in order to correct for source drift and instrument response changes. Integrated UVA exposure was well below ACGIH (American Conference of Governmental Industrial Hygienists) Threshold Limit Values in all cases.
2.5 AGE assay technique
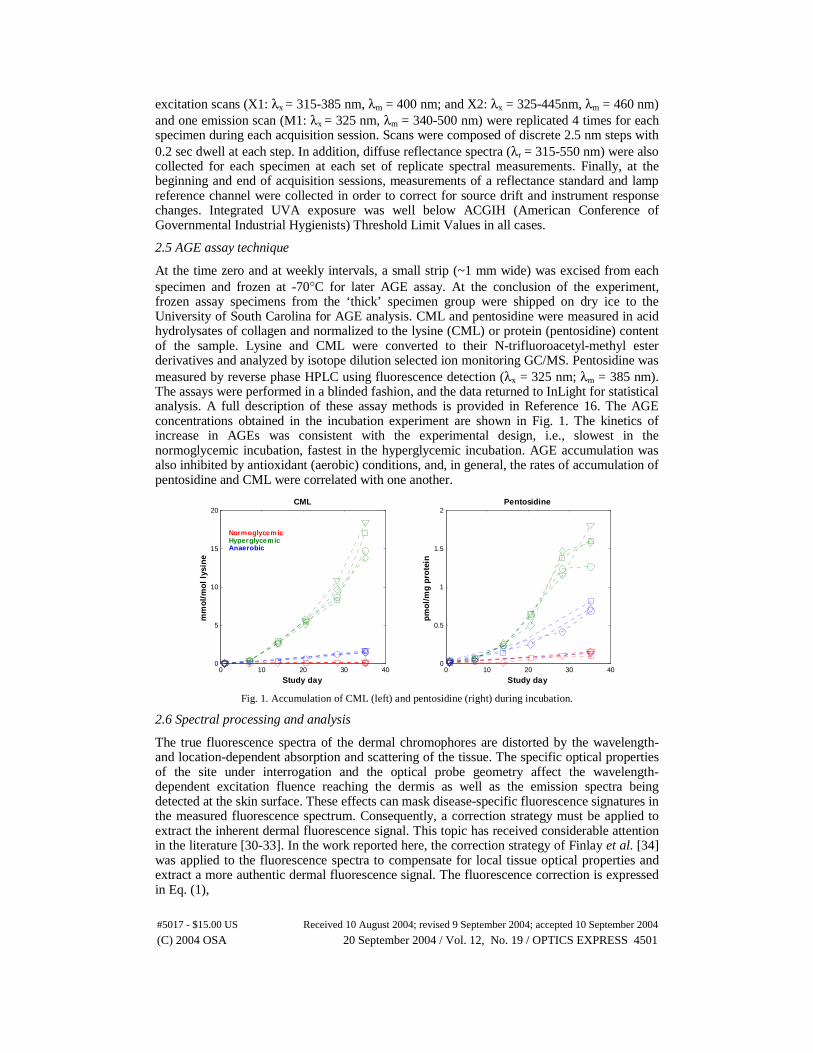
At the time zero and at weekly intervals, a small strip (~1 mm wide) was excised from each specimen and frozen at -70°C for later AGE assay. At the conclusion of the experiment, frozen assay specimens from the ‘thick’ specimen group were shipped on dry ice to the University of South Carolina for AGE analysis. CML and pentosidine were measured in acid hydrolysates of collagen and normalized to the lysine (CML) or protein (pentosidine) content of the sample. Lysine and CML were converted to their N-trifluoroacetyl-methyl ester derivatives and analyzed by isotope dilution selected ion monitoring GC/MS. Pentosidine was measured by reverse phase HPLC using fluorescence detection (λx = 325 nm; λm = 385 nm). The assays were performed in a blinded fashion, and the data returned to InLight for statistical analysis. A full description of these assay methods is provided in Reference 16. The AGE concentrations obtained in the incubation experiment are shown in Fig. 1. The kinetics of increase in AGEs was consistent with the experimental design, i.e., slowest in the normoglycemic incubation, fastest in the hyperglycemic incubation. AGE accumulation was also inhibited by antioxidant (aerobic) conditions, and, in general, the rates of accumulation of pentosidine and CML were correlated with one another.
0 10 20 30 400
5
10
15
20
mm
ol/
mo
l ly
sin
e
Study day
CML
NormoglycemicHyperglycemicAnaerobic
0 10 20 30 400
0.5
1
1.5
2
pm
ol/
mg
pro
tein
Study day
Pentosidine
Fig. 1. Accumulation of CML (left) and pentosidine (right) during incubation.
2.6 Spectral processing and analysis
The true fluorescence spectra of the dermal chromophores are distorted by the wavelength- and location-dependent absorption and scattering of the tissue. The specific optical properties of the site under interrogation and the optical probe geometry affect the wavelength-dependent excitation fluence reaching the dermis as well as the emission spectra being detected at the skin surface. These effects can mask disease-specific fluorescence signatures in the measured fluorescence spectrum. Consequently, a correction strategy must be applied to extract the inherent dermal fluorescence signal. This topic has received considerable attention in the literature [30-33]. In the work reported here, the correction strategy of Finlay et al. [34] was applied to the fluorescence spectra to compensate for local tissue optical properties and extract a more authentic dermal fluorescence signal. The fluorescence correction is expressed in Eq. (1),
(C) 2004 OSA 20 September 2004 / Vol. 12, No. 19 / OPTICS EXPRESS 4501#5017 - $15.00 US Received 10 August 2004; revised 9 September 2004; accepted 10 September 2004
mx k
mkx
xmxm RR
Ff =
(1)
where the measured fluorescence, Fxm, is divided by reflectance values at the excitation and emission wavelengths, Rx and Rm, respectively. The reflectance values are adjusted by the dimensionless exponents, kx and km.
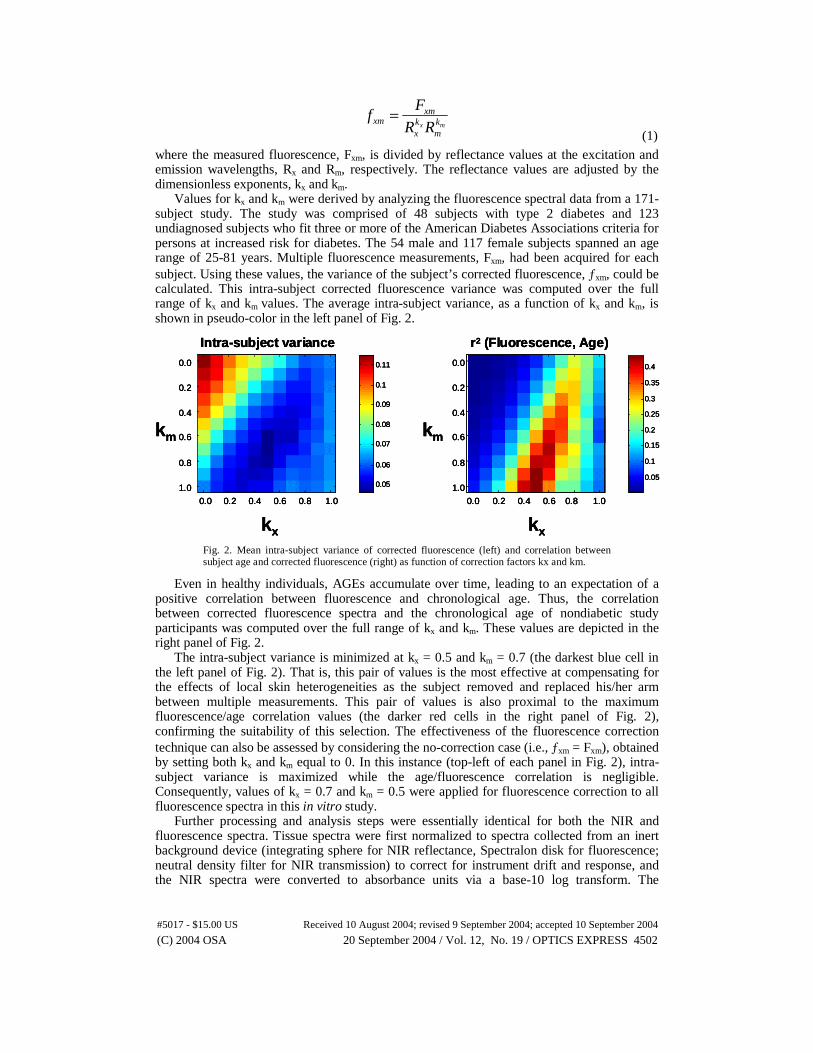
Values for kx and km were derived by analyzing the fluorescence spectral data from a 171-subject study. The study was comprised of 48 subjects with type 2 diabetes and 123 undiagnosed subjects who fit three or more of the American Diabetes Associations criteria for persons at increased risk for diabetes. The 54 male and 117 female subjects spanned an age range of 25-81 years. Multiple fluorescence measurements, Fxm, had been acquired for each subject. Using these values, the variance of the subject’s corrected fluorescence, ƒxm, could be calculated. This intra-subject corrected fluorescence variance was computed over the full range of kx and km values. The average intra-subject variance, as a function of kx and km, is shown in pseudo-color in the left panel of Fig. 2.
0.05
0.1
0.15
0.2
0.25
0.3
0.35
0.4
kx
r2 (Fluorescence, Age)
0.0 0.2 0.4 0.6 0.8 1.0
0.0
0.2
0.4
0.6
0.8
1.0
km
0.05
0.06
0.07
0.08
0.09
0.1
0.11
Intra-subject variance
0.0 0.2 0.4 0.6 0.8 1.0
0.0
0.2
0.4
0.6
0.8
1.0
kx
km
0.05
0.1
0.15
0.2
0.25
0.3
0.35
0.4
kx
r2 (Fluorescence, Age)
0.0 0.2 0.4 0.6 0.8 1.0
0.0
0.2
0.4
0.6
0.8
1.0
km
0.05
0.1
0.15
0.2
0.25
0.3
0.35
0.4
kx
r2 (Fluorescence, Age)
0.0 0.2 0.4 0.6 0.8 1.0
0.0
0.2
0.4
0.6
0.8
1.0
km
0.05
0.06
0.07
0.08
0.09
0.1
0.11
Intra-subject variance
0.0 0.2 0.4 0.6 0.8 1.0
0.0
0.2
0.4
0.6
0.8
1.0
kx
km
0.05
0.06
0.07
0.08
0.09
0.1
0.11
Intra-subject variance
0.0 0.2 0.4 0.6 0.8 1.0
0.0
0.2
0.4
0.6
0.8
1.0
kx
km
Fig. 2. Mean intra-subject variance of corrected fluorescence (left) and correlation between subject age and corrected fluorescence (right) as function of correction factors kx and km.
Even in healthy individuals, AGEs accumulate over time, leading to an expectation of a positive correlation between fluorescence and chronological age. Thus, the correlation between corrected fluorescence spectra and the chronological age of nondiabetic study participants was computed over the full range of kx and km. These values are depicted in the right panel of Fig. 2.
The intra-subject variance is minimized at kx = 0.5 and km = 0.7 (the darkest blue cell in the left panel of Fig. 2). That is, this pair of values is the most effective at compensating for the effects of local skin heterogeneities as the subject removed and replaced his/her arm between multiple measurements. This pair of values is also proximal to the maximum fluorescence/age correlation values (the darker red cells in the right panel of Fig. 2), confirming the suitability of this selection. The effectiveness of the fluorescence correction technique can also be assessed by considering the no-correction case (i.e., ƒxm = Fxm), obtained by setting both kx and km equal to 0. In this instance (top-left of each panel in Fig. 2), intra-subject variance is maximized while the age/fluorescence correlation is negligible. Consequently, values of kx = 0.7 and km = 0.5 were applied for fluorescence correction to all fluorescence spectra in this in vitro study.
Further processing and analysis steps were essentially identical for both the NIR and fluorescence spectra. Tissue spectra were first normalized to spectra collected from an inert background device (integrating sphere for NIR reflectance, Spectralon disk for fluorescence; neutral density filter for NIR transmission) to correct for instrument drift and response, and the NIR spectra were converted to absorbance units via a base-10 log transform. The
(C) 2004 OSA 20 September 2004 / Vol. 12, No. 19 / OPTICS EXPRESS 4502#5017 - $15.00 US Received 10 August 2004; revised 9 September 2004; accepted 10 September 2004
relationship between assay-determined AGE values and optical spectroscopy was then assessed by Partial Least Squares (PLS) regression using the AGE concentrations as reference values [35].
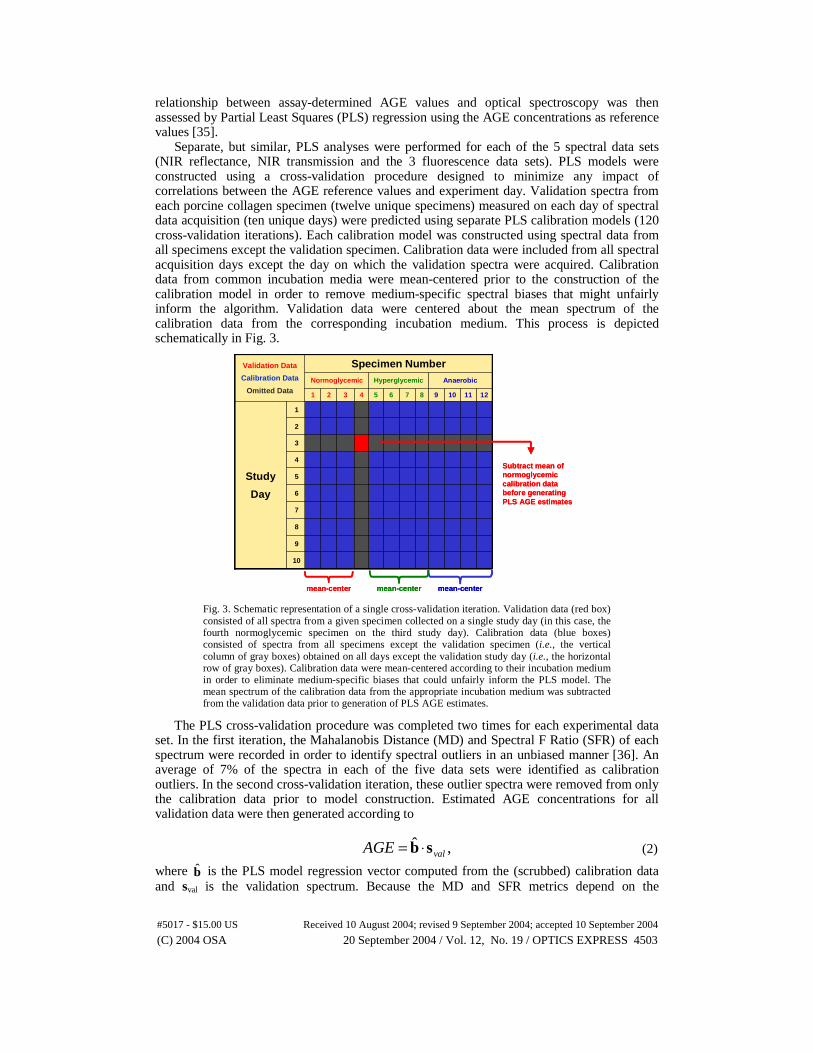
Separate, but similar, PLS analyses were performed for each of the 5 spectral data sets (NIR reflectance, NIR transmission and the 3 fluorescence data sets). PLS models were constructed using a cross-validation procedure designed to minimize any impact of correlations between the AGE reference values and experiment day. Validation spectra from each porcine collagen specimen (twelve unique specimens) measured on each day of spectral data acquisition (ten unique days) were predicted using separate PLS calibration models (120 cross-validation iterations). Each calibration model was constructed using spectral data from all specimens except the validation specimen. Calibration data were included from all spectral acquisition days except the day on which the validation spectra were acquired. Calibration data from common incubation media were mean-centered prior to the construction of the calibration model in order to remove medium-specific spectral biases that might unfairly inform the algorithm. Validation data were centered about the mean spectrum of the calibration data from the corresponding incubation medium. This process is depicted schematically in Fig. 3.
AnaerobicHyperglycemicNormoglycemic
10
9
8
7
6
5
4
3
2
1
Study
Day
121110987654321
Specimen NumberValidation Data
Calibration Data
Omitted DataAnaerobicHyperglycemicNormoglycemic
10
9
8
7
6
5
4
3
2
1
Study
Day
121110987654321
Specimen NumberValidation Data
Calibration Data
Omitted Data
mean-center mean-centermean-center mean-center mean-centermean-center
Subtract mean of normoglycemiccalibration data before generating PLS AGE estimates
Subtract mean of normoglycemiccalibration data before generating PLS AGE estimates
Fig. 3. Schematic representation of a single cross-validation iteration. Validation data (red box) consisted of all spectra from a given specimen collected on a single study day (in this case, the fourth normoglycemic specimen on the third study day). Calibration data (blue boxes) consisted of spectra from all specimens except the validation specimen (i.e., the vertical column of gray boxes) obtained on all days except the validation study day (i.e., the horizontal row of gray boxes). Calibration data were mean-centered according to their incubation medium in order to eliminate medium-specific biases that could unfairly inform the PLS model. The mean spectrum of the calibration data from the appropriate incubation medium was subtracted from the validation data prior to generation of PLS AGE estimates.
The PLS cross-validation procedure was completed two times for each experimental data set. In the first iteration, the Mahalanobis Distance (MD) and Spectral F Ratio (SFR) of each spectrum were recorded in order to identify spectral outliers in an unbiased manner [36]. An average of 7% of the spectra in each of the five data sets were identified as calibration outliers. In the second cross-validation iteration, these outlier spectra were removed from only the calibration data prior to model construction. Estimated AGE concentrations for all validation data were then generated according to
,ˆvalAGE sb ⋅= (2)
where b̂ is the PLS model regression vector computed from the (scrubbed) calibration data and sval is the validation spectrum. Because the MD and SFR metrics depend on the
(C) 2004 OSA 20 September 2004 / Vol. 12, No. 19 / OPTICS EXPRESS 4503#5017 - $15.00 US Received 10 August 2004; revised 9 September 2004; accepted 10 September 2004
calibration data used, these metrics were re-computed for all spectra based on the scrubbed calibration sets. These updated MD and SFR metrics identified an average of 14% of the spectra in each of the five data sets as validation outliers.
After removal of validation outliers, predictions corresponding to replicate spectral measurements of a given specimen on each day of spectral acquisition were averaged. Averaged PLS model predictions were then used to compute the cross-validated standard error of prediction (CVSEP) for the analyte of interest (pentosidine or CML), given by
,)3/(1
2 −= ∑=
pred
N
ii NeCVSEP
pred
(3)
where ei is the error in the PLS estimate of the analyte concentration for the ith specimen-day and Npred is the total number of predictions in the averaged data set (120 total specimen-days, denoted by the boxes in Fig. 3). After outlier removal, Npred ranged from 112 to 120. The factor of three in the denominator derives from the fact that three degrees of freedom have been removed from the calibration data, corresponding to the mean spectra of the three incubation media. Finally, the CVSEP as a function of the number of PLS model factors was used to determine the optimum number of factors for PLS predictions using Akaike’s Information Criterion (AIC) [37].
3. Results
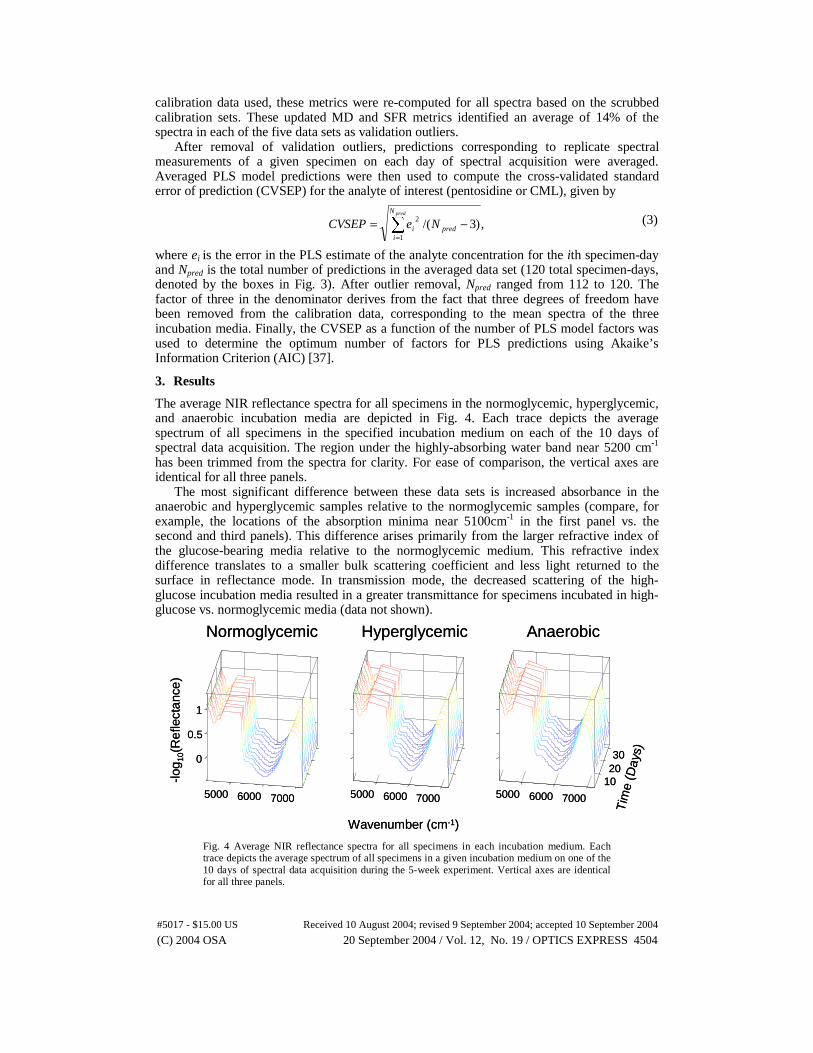
The average NIR reflectance spectra for all specimens in the normoglycemic, hyperglycemic, and anaerobic incubation media are depicted in Fig. 4. Each trace depicts the average spectrum of all specimens in the specified incubation medium on each of the 10 days of spectral data acquisition. The region under the highly-absorbing water band near 5200 cm-1 has been trimmed from the spectra for clarity. For ease of comparison, the vertical axes are identical for all three panels.
The most significant difference between these data sets is increased absorbance in the anaerobic and hyperglycemic samples relative to the normoglycemic samples (compare, for example, the locations of the absorption minima near 5100cm-1 in the first panel vs. the second and third panels). This difference arises primarily from the larger refractive index of the glucose-bearing media relative to the normoglycemic medium. This refractive index difference translates to a smaller bulk scattering coefficient and less light returned to the surface in reflectance mode. In transmission mode, the decreased scattering of the high-glucose incubation media resulted in a greater transmittance for specimens incubated in high-glucose vs. normoglycemic media (data not shown).
5000 6000 7000
0
0.5
1
Normoglycemic
-log 1
0(R
efle
ctan
ce)
5000 6000 7000
Tim
e (D
ays)
Hyperglycemic
5000 6000 7000
102030
Wavenumber (cm-1)
Anaerobic
5000 6000 7000
0
0.5
1
Normoglycemic
-log 1
0(R
efle
ctan
ce)
5000 6000 7000
Tim
e (D
ays)
Hyperglycemic
5000 6000 7000
102030
Wavenumber (cm-1)
Anaerobic
Fig. 4 Average NIR reflectance spectra for all specimens in each incubation medium. Each trace depicts the average spectrum of all specimens in a given incubation medium on one of the 10 days of spectral data acquisition during the 5-week experiment. Vertical axes are identical for all three panels.
(C) 2004 OSA 20 September 2004 / Vol. 12, No. 19 / OPTICS EXPRESS 4504#5017 - $15.00 US Received 10 August 2004; revised 9 September 2004; accepted 10 September 2004
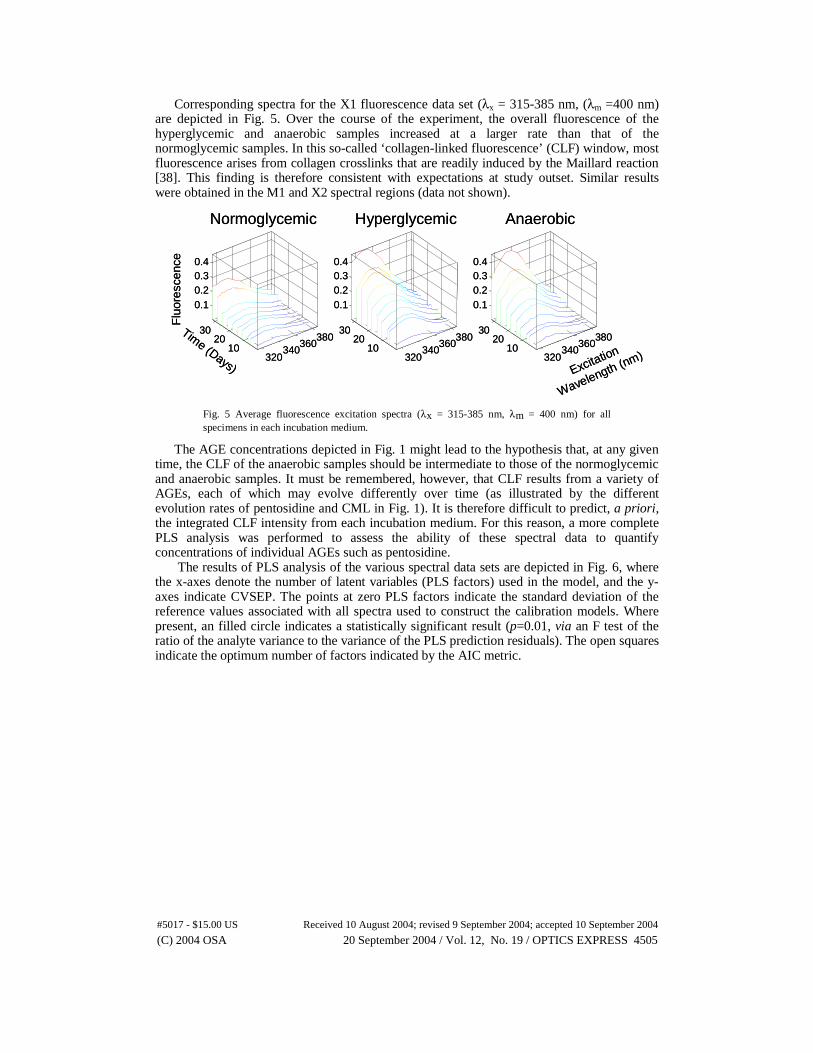
Corresponding spectra for the X1 fluorescence data set (λx = 315-385 nm, (λm =400 nm) are depicted in Fig. 5. Over the course of the experiment, the overall fluorescence of the hyperglycemic and anaerobic samples increased at a larger rate than that of the normoglycemic samples. In this so-called ‘collagen-linked fluorescence’ (CLF) window, most fluorescence arises from collagen crosslinks that are readily induced by the Maillard reaction [38]. This finding is therefore consistent with expectations at study outset. Similar results were obtained in the M1 and X2 spectral regions (data not shown).
320340
360380
1020
30
0.10.20.30.4
Normoglycemic
Time (Days)
Flu
ores
cenc
e
320340
360380
1020
30
0.10.20.30.4
Excitation
Wavelength (nm)
Hyperglycemic
320340
360380
1020
30
0.10.20.30.4
Anaerobic
320340
360380
1020
30
0.10.20.30.4
Normoglycemic
Time (Days)
Flu
ores
cenc
e
320340
360380
1020
30
0.10.20.30.4
Excitation
Wavelength (nm)
Hyperglycemic
320340
360380
1020
30
0.10.20.30.4
Anaerobic
Fig. 5 Average fluorescence excitation spectra (λx = 315-385 nm, λm = 400 nm) for all specimens in each incubation medium.
The AGE concentrations depicted in Fig. 1 might lead to the hypothesis that, at any given time, the CLF of the anaerobic samples should be intermediate to those of the normoglycemic and anaerobic samples. It must be remembered, however, that CLF results from a variety of AGEs, each of which may evolve differently over time (as illustrated by the different evolution rates of pentosidine and CML in Fig. 1). It is therefore difficult to predict, a priori, the integrated CLF intensity from each incubation medium. For this reason, a more complete PLS analysis was performed to assess the ability of these spectral data to quantify concentrations of individual AGEs such as pentosidine.
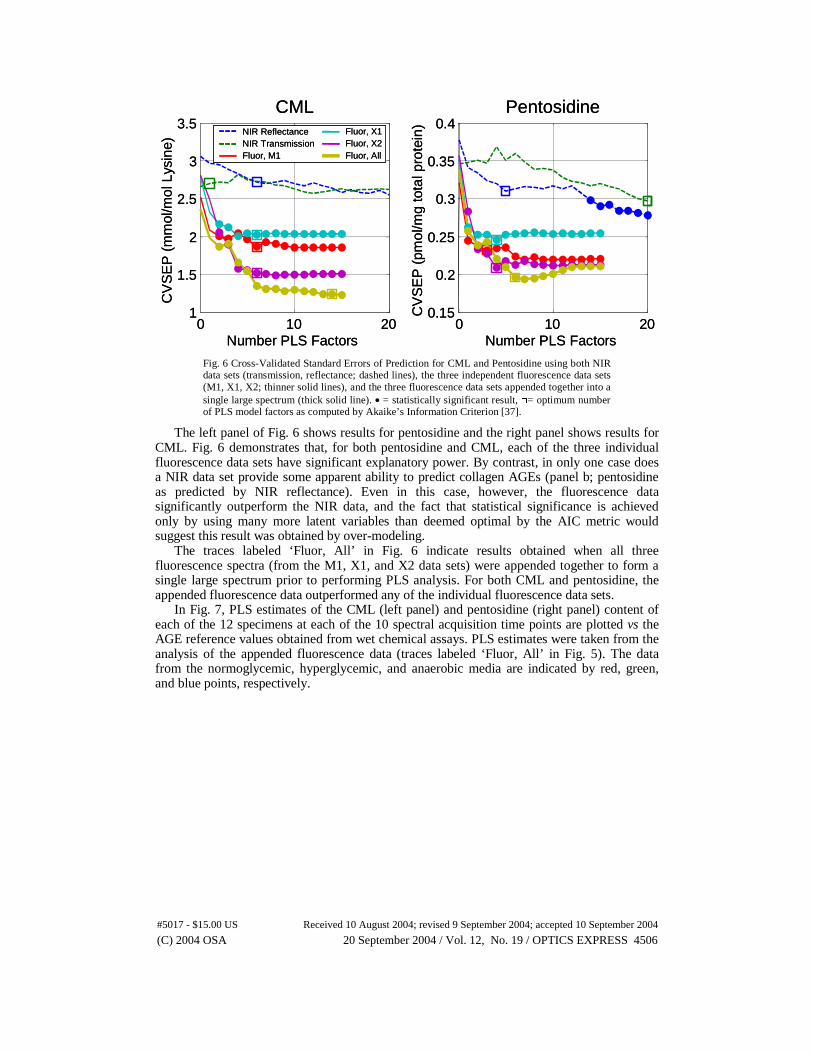
The results of PLS analysis of the various spectral data sets are depicted in Fig. 6, where the x-axes denote the number of latent variables (PLS factors) used in the model, and the y-axes indicate CVSEP. The points at zero PLS factors indicate the standard deviation of the reference values associated with all spectra used to construct the calibration models. Where present, an filled circle indicates a statistically significant result (p=0.01, via an F test of the ratio of the analyte variance to the variance of the PLS prediction residuals). The open squares indicate the optimum number of factors indicated by the AIC metric.
(C) 2004 OSA 20 September 2004 / Vol. 12, No. 19 / OPTICS EXPRESS 4505#5017 - $15.00 US Received 10 August 2004; revised 9 September 2004; accepted 10 September 2004
0 10 201
1.5
2
2.5
3
3.5
Number PLS Factors
CV
SE
P (
mm
ol/m
ol L
ysin
e)
CML
0 10 200.15
0.2
0.25
0.3
0.35
0.4
Number PLS Factors
CV
SE
P (
pmol
/mg
tota
l pro
tein
)
PentosidineNIR ReflectanceNIR TransmissionFluor, M1
Fluor, X1Fluor, X2Fluor, All
0 10 201
1.5
2
2.5
3
3.5
Number PLS Factors
CV
SE
P (
mm
ol/m
ol L
ysin
e)
CML
0 10 200.15
0.2
0.25
0.3
0.35
0.4
Number PLS Factors
CV
SE
P (
pmol
/mg
tota
l pro
tein
)
PentosidineNIR ReflectanceNIR TransmissionFluor, M1
Fluor, X1Fluor, X2Fluor, All
NIR ReflectanceNIR TransmissionFluor, M1
Fluor, X1Fluor, X2Fluor, All
NIR ReflectanceNIR TransmissionFluor, M1
Fluor, X1Fluor, X2Fluor, All
Fig. 6 Cross-Validated Standard Errors of Prediction for CML and Pentosidine using both NIR data sets (transmission, reflectance; dashed lines), the three independent fluorescence data sets (M1, X1, X2; thinner solid lines), and the three fluorescence data sets appended together into a single large spectrum (thick solid line). • = statistically significant result, □= optimum number of PLS model factors as computed by Akaike’s Information Criterion [37].
The left panel of Fig. 6 shows results for pentosidine and the right panel shows results for CML. Fig. 6 demonstrates that, for both pentosidine and CML, each of the three individual fluorescence data sets have significant explanatory power. By contrast, in only one case does a NIR data set provide some apparent ability to predict collagen AGEs (panel b; pentosidine as predicted by NIR reflectance). Even in this case, however, the fluorescence data significantly outperform the NIR data, and the fact that statistical significance is achieved only by using many more latent variables than deemed optimal by the AIC metric would suggest this result was obtained by over-modeling.
The traces labeled ‘Fluor, All’ in Fig. 6 indicate results obtained when all three fluorescence spectra (from the M1, X1, and X2 data sets) were appended together to form a single large spectrum prior to performing PLS analysis. For both CML and pentosidine, the appended fluorescence data outperformed any of the individual fluorescence data sets.
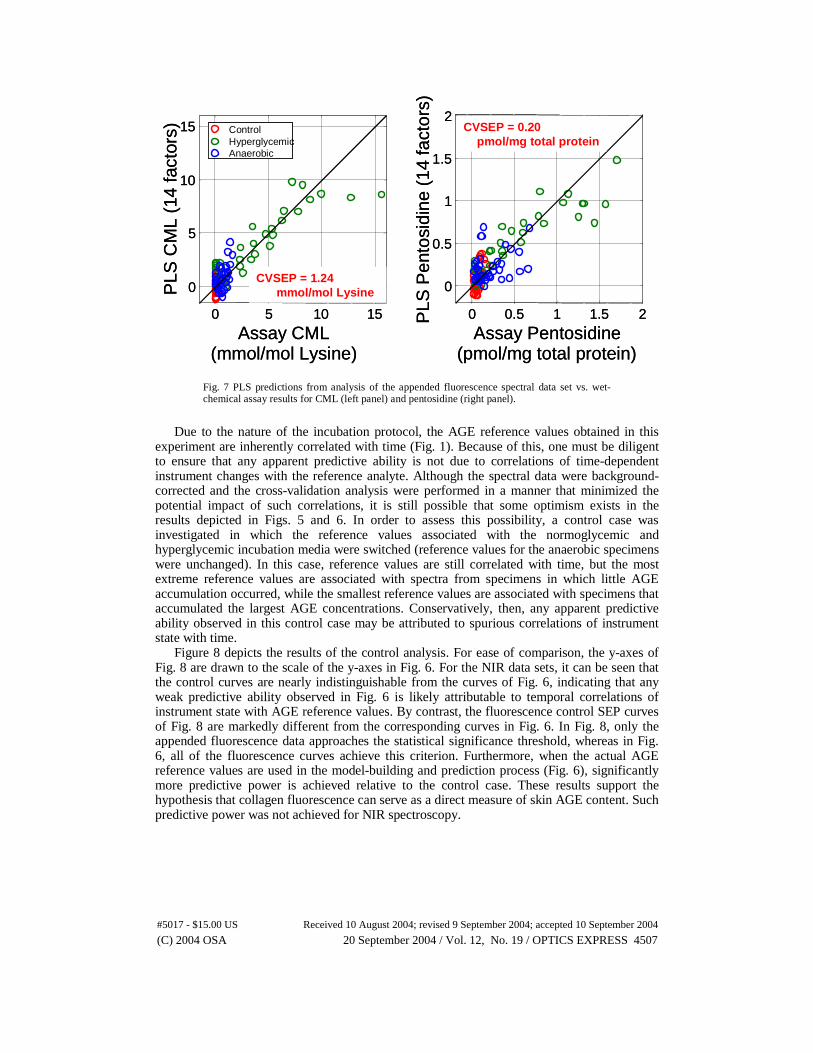
In Fig. 7, PLS estimates of the CML (left panel) and pentosidine (right panel) content of each of the 12 specimens at each of the 10 spectral acquisition time points are plotted vs the AGE reference values obtained from wet chemical assays. PLS estimates were taken from the analysis of the appended fluorescence data (traces labeled ‘Fluor, All’ in Fig. 5). The data from the normoglycemic, hyperglycemic, and anaerobic media are indicated by red, green, and blue points, respectively.
(C) 2004 OSA 20 September 2004 / Vol. 12, No. 19 / OPTICS EXPRESS 4506#5017 - $15.00 US Received 10 August 2004; revised 9 September 2004; accepted 10 September 2004
0 5 10 15
0
5
10
15
Assay CML (mmol/mol Lysine)
PLS
CM
L (1
4 fa
ctor
s) ControlHyperglycemicAnaerobic
0 0.5 1 1.5 2
0
0.5
1
1.5
2
Assay Pentosidine (pmol/mg total protein)
PLS
Pen
tosi
dine
(14
fact
ors)
CVSEP = 1.24mmol/mol Lysine
CVSEP = 0.20pmol/mg total protein
0 5 10 15
0
5
10
15
Assay CML (mmol/mol Lysine)
PLS
CM
L (1
4 fa
ctor
s) ControlHyperglycemicAnaerobic
ControlHyperglycemicAnaerobic
0 0.5 1 1.5 2
0
0.5
1
1.5
2
Assay Pentosidine (pmol/mg total protein)
PLS
Pen
tosi
dine
(14
fact
ors)
CVSEP = 1.24mmol/mol Lysine
CVSEP = 0.20pmol/mg total protein
Fig. 7 PLS predictions from analysis of the appended fluorescence spectral data set vs. wet-chemical assay results for CML (left panel) and pentosidine (right panel).
Due to the nature of the incubation protocol, the AGE reference values obtained in this
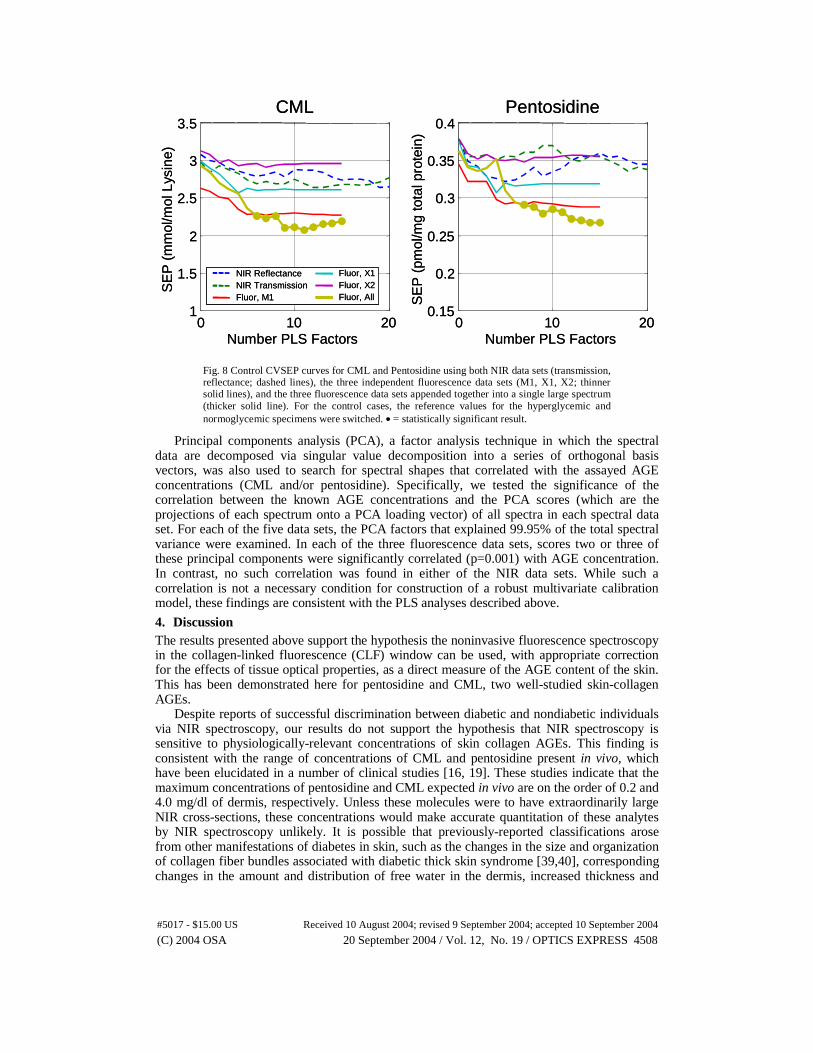
experiment are inherently correlated with time (Fig. 1). Because of this, one must be diligent to ensure that any apparent predictive ability is not due to correlations of time-dependent instrument changes with the reference analyte. Although the spectral data were background-corrected and the cross-validation analysis were performed in a manner that minimized the potential impact of such correlations, it is still possible that some optimism exists in the results depicted in Figs. 5 and 6. In order to assess this possibility, a control case was investigated in which the reference values associated with the normoglycemic and hyperglycemic incubation media were switched (reference values for the anaerobic specimens were unchanged). In this case, reference values are still correlated with time, but the most extreme reference values are associated with spectra from specimens in which little AGE accumulation occurred, while the smallest reference values are associated with specimens that accumulated the largest AGE concentrations. Conservatively, then, any apparent predictive ability observed in this control case may be attributed to spurious correlations of instrument state with time.
Figure 8 depicts the results of the control analysis. For ease of comparison, the y-axes of Fig. 8 are drawn to the scale of the y-axes in Fig. 6. For the NIR data sets, it can be seen that the control curves are nearly indistinguishable from the curves of Fig. 6, indicating that any weak predictive ability observed in Fig. 6 is likely attributable to temporal correlations of instrument state with AGE reference values. By contrast, the fluorescence control SEP curves of Fig. 8 are markedly different from the corresponding curves in Fig. 6. In Fig. 8, only the appended fluorescence data approaches the statistical significance threshold, whereas in Fig. 6, all of the fluorescence curves achieve this criterion. Furthermore, when the actual AGE reference values are used in the model-building and prediction process (Fig. 6), significantly more predictive power is achieved relative to the control case. These results support the hypothesis that collagen fluorescence can serve as a direct measure of skin AGE content. Such predictive power was not achieved for NIR spectroscopy.
(C) 2004 OSA 20 September 2004 / Vol. 12, No. 19 / OPTICS EXPRESS 4507#5017 - $15.00 US Received 10 August 2004; revised 9 September 2004; accepted 10 September 2004
0 10 201
1.5
2
2.5
3
3.5
Number PLS Factors
SE
P (
mm
ol/m
ol L
ysin
e)
CML
0 10 200.15
0.2
0.25
0.3
0.35
0.4
Number PLS Factors
SE
P (
pmol
/mg
tota
l pro
tein
)
Pentosidine
NIR ReflectanceNIR TransmissionFluor, M1
Fluor, X1Fluor, X2Fluor, All
0 10 201
1.5
2
2.5
3
3.5
Number PLS Factors
SE
P (
mm
ol/m
ol L
ysin
e)
CML
0 10 200.15
0.2
0.25
0.3
0.35
0.4
Number PLS Factors
SE
P (
pmol
/mg
tota
l pro
tein
)
Pentosidine
NIR ReflectanceNIR TransmissionFluor, M1
Fluor, X1Fluor, X2Fluor, All
NIR ReflectanceNIR TransmissionFluor, M1
Fluor, X1Fluor, X2Fluor, All
NIR ReflectanceNIR TransmissionFluor, M1
Fluor, X1Fluor, X2Fluor, All
Fig. 8 Control CVSEP curves for CML and Pentosidine using both NIR data sets (transmission, reflectance; dashed lines), the three independent fluorescence data sets (M1, X1, X2; thinner solid lines), and the three fluorescence data sets appended together into a single large spectrum (thicker solid line). For the control cases, the reference values for the hyperglycemic and normoglycemic specimens were switched. • = statistically significant result.
Principal components analysis (PCA), a factor analysis technique in which the spectral data are decomposed via singular value decomposition into a series of orthogonal basis vectors, was also used to search for spectral shapes that correlated with the assayed AGE concentrations (CML and/or pentosidine). Specifically, we tested the significance of the correlation between the known AGE concentrations and the PCA scores (which are the projections of each spectrum onto a PCA loading vector) of all spectra in each spectral data set. For each of the five data sets, the PCA factors that explained 99.95% of the total spectral variance were examined. In each of the three fluorescence data sets, scores two or three of these principal components were significantly correlated (p=0.001) with AGE concentration. In contrast, no such correlation was found in either of the NIR data sets. While such a correlation is not a necessary condition for construction of a robust multivariate calibration model, these findings are consistent with the PLS analyses described above.
4. Discussion The results presented above support the hypothesis the noninvasive fluorescence spectroscopy in the collagen-linked fluorescence (CLF) window can be used, with appropriate correction for the effects of tissue optical properties, as a direct measure of the AGE content of the skin. This has been demonstrated here for pentosidine and CML, two well-studied skin-collagen AGEs.
Despite reports of successful discrimination between diabetic and nondiabetic individuals via NIR spectroscopy, our results do not support the hypothesis that NIR spectroscopy is sensitive to physiologically-relevant concentrations of skin collagen AGEs. This finding is consistent with the range of concentrations of CML and pentosidine present in vivo, which have been elucidated in a number of clinical studies [16, 19]. These studies indicate that the maximum concentrations of pentosidine and CML expected in vivo are on the order of 0.2 and 4.0 mg/dl of dermis, respectively. Unless these molecules were to have extraordinarily large NIR cross-sections, these concentrations would make accurate quantitation of these analytes by NIR spectroscopy unlikely. It is possible that previously-reported classifications arose from other manifestations of diabetes in skin, such as the changes in the size and organization of collagen fiber bundles associated with diabetic thick skin syndrome [39,40], corresponding changes in the amount and distribution of free water in the dermis, increased thickness and
(C) 2004 OSA 20 September 2004 / Vol. 12, No. 19 / OPTICS EXPRESS 4508#5017 - $15.00 US Received 10 August 2004; revised 9 September 2004; accepted 10 September 2004
rigidity of capillary basement membranes [39,41], or decreased collagen-bound water because of increased cross-linking and loss of elasticity. It is also possible that interactions between the optical sampling device and changes in the mechanical rigidity [42] or thermal-optical response of diabetic skin [43] played a role in these studies.
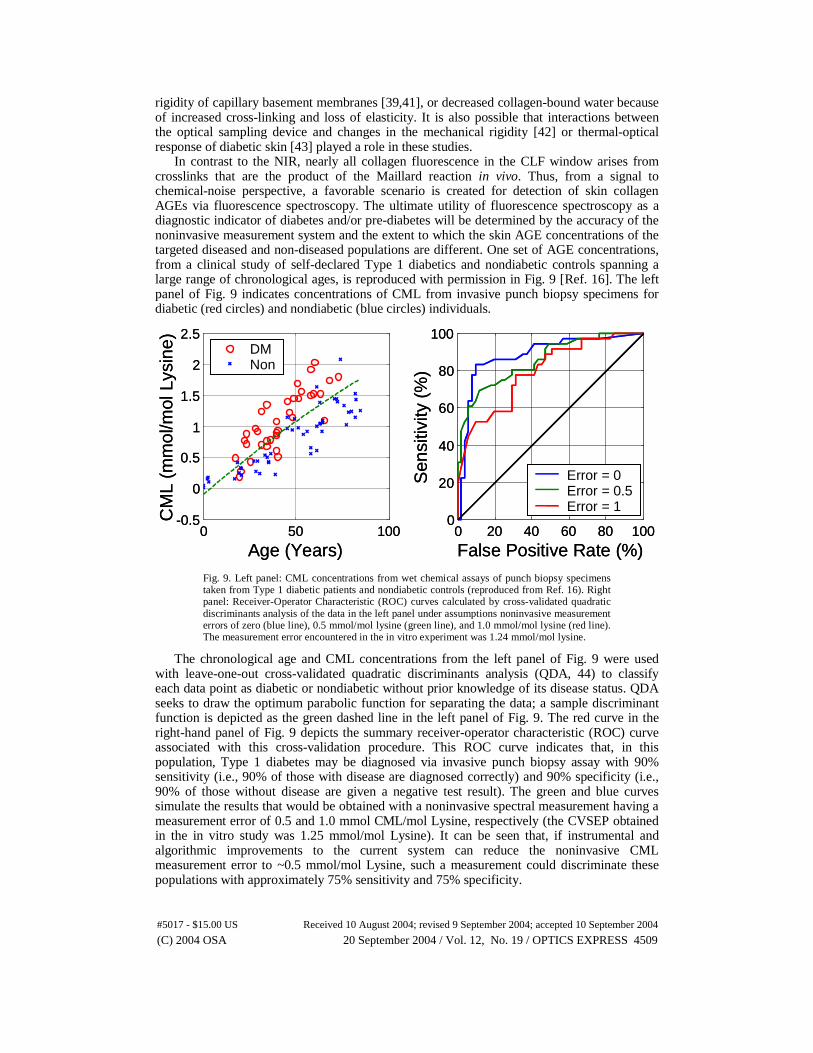
In contrast to the NIR, nearly all collagen fluorescence in the CLF window arises from crosslinks that are the product of the Maillard reaction in vivo. Thus, from a signal to chemical-noise perspective, a favorable scenario is created for detection of skin collagen AGEs via fluorescence spectroscopy. The ultimate utility of fluorescence spectroscopy as a diagnostic indicator of diabetes and/or pre-diabetes will be determined by the accuracy of the noninvasive measurement system and the extent to which the skin AGE concentrations of the targeted diseased and non-diseased populations are different. One set of AGE concentrations, from a clinical study of self-declared Type 1 diabetics and nondiabetic controls spanning a large range of chronological ages, is reproduced with permission in Fig. 9 [Ref. 16]. The left panel of Fig. 9 indicates concentrations of CML from invasive punch biopsy specimens for diabetic (red circles) and nondiabetic (blue circles) individuals.
0 50 100-0.5
0
0.5
1
1.5
2
2.5
Age (Years)
CM
L (m
mol
/mol
Lys
ine) DM
Non
0 20 40 60 80 1000
20
40
60
80
100
False Positive Rate (%)
Sen
sitiv
ity (
%)
Error = 0Error = 0.5Error = 1
0 50 100-0.5
0
0.5
1
1.5
2
2.5
Age (Years)
CM
L (m
mol
/mol
Lys
ine) DM
NonDMNon
0 20 40 60 80 1000
20
40
60
80
100
False Positive Rate (%)
Sen
sitiv
ity (
%)
Error = 0Error = 0.5Error = 1
Fig. 9. Left panel: CML concentrations from wet chemical assays of punch biopsy specimens taken from Type 1 diabetic patients and nondiabetic controls (reproduced from Ref. 16). Right panel: Receiver-Operator Characteristic (ROC) curves calculated by cross-validated quadratic discriminants analysis of the data in the left panel under assumptions noninvasive measurement errors of zero (blue line), 0.5 mmol/mol lysine (green line), and 1.0 mmol/mol lysine (red line). The measurement error encountered in the in vitro experiment was 1.24 mmol/mol lysine.
The chronological age and CML concentrations from the left panel of Fig. 9 were used with leave-one-out cross-validated quadratic discriminants analysis (QDA, 44) to classify each data point as diabetic or nondiabetic without prior knowledge of its disease status. QDA seeks to draw the optimum parabolic function for separating the data; a sample discriminant function is depicted as the green dashed line in the left panel of Fig. 9. The red curve in the right-hand panel of Fig. 9 depicts the summary receiver-operator characteristic (ROC) curve associated with this cross-validation procedure. This ROC curve indicates that, in this population, Type 1 diabetes may be diagnosed via invasive punch biopsy assay with 90% sensitivity (i.e., 90% of those with disease are diagnosed correctly) and 90% specificity (i.e., 90% of those without disease are given a negative test result). The green and blue curves simulate the results that would be obtained with a noninvasive spectral measurement having a measurement error of 0.5 and 1.0 mmol CML/mol Lysine, respectively (the CVSEP obtained in the in vitro study was 1.25 mmol/mol Lysine). It can be seen that, if instrumental and algorithmic improvements to the current system can reduce the noninvasive CML measurement error to ~0.5 mmol/mol Lysine, such a measurement could discriminate these populations with approximately 75% sensitivity and 75% specificity.
(C) 2004 OSA 20 September 2004 / Vol. 12, No. 19 / OPTICS EXPRESS 4509#5017 - $15.00 US Received 10 August 2004; revised 9 September 2004; accepted 10 September 2004
5. Conclusions and future work
It has been demonstrated that noninvasive fluorescence spectroscopy is capable of quantitative measurement of skin collagen AGEs in vitro to accuracies that are encouraging with respect to noninvasive diabetes screening. Although NIR spectroscopy has previously been shown to offer hope for discriminating between diabetic and nondiabetic individuals, this work does not support the hypothesis that such discrimination is based on chemical identification of skin AGEs.
The results presented here are sufficiently encouraging to warrant future experimental work. The first steps should include the design, construction, and testing of an optical probe designed specifically for measurement of dermal fluorescence. Development of a dedicated probe with improved algorithms for estimating the intrinsic fluorescence spectrum should provide quantitative accuracy that is significantly improved relative to the accuracies obtained in these initial experiments. After the development of a dedicated probe, an in vivo study in which noninvasive spectra are used to calibrate a multivariate model using punch-biopsy-based AGE reference values would be valuable.
(C) 2004 OSA 20 September 2004 / Vol. 12, No. 19 / OPTICS EXPRESS 4510#5017 - $15.00 US Received 10 August 2004; revised 9 September 2004; accepted 10 September 2004