Embed Size (px)
Citation preview
Nondefault Bond Spread and Market Trading Liquidity∗
Song Han†and Hao Zhou‡
Division of Research & StatisticsFederal Reserve Board
Washington DC
First Draft: December 2006This Version: April 6, 2007
Abstract
We examine the relationship between the nondefault component of corporate bondspread and liquidity measures constructed from intraday transactions data, with thedefault component controlled by the term structure of credit default swap (CDS). Weexplicitly control for the unobservable firm heterogeneity and conventional bond char-acteristics, in order to identify the stochastic liquidity effects over time across bondsissued by the same firm. We find a clear positive significant relationship between theilliquidity of intraday trading and nondefault bond spread. These trading liquidityeffects identify a unique component of basis spreads that is uncorrelated with conven-tional liquidity proxy variables, particularly for highly-rated investment-grade bonds.Furthermore, nondefault bond spread is relatively high at the short end of the maturityand increasing with the bond age. The impacts of transaction based liquidity measuresare robust to whether swap yield or Treasury yield is used as risk-free rate.
JEL Classifications: G12, G13, G14Key words: Corporate bond yields, credit default swaps, liquidity
∗The views expressed herein are those of the author and do not necessarily reflect the views of the Boardnor the staff of the Federal Reserve System. We thank Haibin Zhou and the participants of the FinanceForum at the Board for their helpful comments.
†Capital Market Section, Federal Reserve Board, Mail Stop 89, Washington, DC 20551 USA. [email protected], phone 202-736-1971, fax 202-728-5887.
‡Risk Analysis Section, Federal Reserve Board, Mail Stop 91, Washington, DC 20551 USA. [email protected], phone 202-452-3360, fax 202-728-5887.
1 Introduction
There is a large component of bond spread that is unrelated to firm’s default risk (Jones,
Mason and Rosenfeld, 1984; Elton, Gruber, Agrawal and Mann, 2001; Eom, Helwege and
Huang, 2004), and only a small fraction of the total spread can be explained by the credit
risk, especially for high investment grade bond at the short maturity (Huang and Huang,
2003). Recent empirical studies have found strong connection between the appropriately
defined non-default spreads and various measures of bond liquidity (Longstaff, Mithal and
Neis, 2005; Ericsson, Reneby and Wang, 2006; Nashikkar and Subrahmanyam, 2006)1 and
that liquidity risk factors may be priced in bond expected returns under a linear APT
setting (see Chacko (2005), de Jong and Driessen (2004), and Downing, Underwood and
Xing (2005), among others). These results are consistent with the theoretical framework
that liquidity risk is driving the bond yield and is allowed to be correlated with the credit
risk factor (see Liu, Longstaff and Mandell (2004) for a reduced-form model and Ericsson
and Renault (2006) for a structural model).2 We contribute to this literature by using direct
liquidity measures constructed from intraday transaction data to explain the non-default
spreads of individual bonds with appropriate control for the firm-specific credit risk and
other unobserved heterogeneity. Our evidence across bond ratings and maturities relates
directly the so-called credit spread puzzle that high investment grade bonds with short
maturities have a relatively larger non-default spread component.
Due to the lack of direct liquidity measurements, most existing empirical studies typically
focus on bond characteristics such as coupon, size, maturity, and age. However, since these
characteristics are either constant or change deterministically with the passage of time, this
approach may not identify the stochastic variation of the liquidity effect on non-default
bond spreads. In contrast, we construct a set of direct measures of bond liquidity using
the intraday transactions data from NASD’s Trading Reporting and Compliance Engine,
or TRACE. We consider three types of such measures: variables measuring price impact
1See also Chen, Lesmond and Wei (2005), Houweling, Mentink and Vorst (2005), and Perraudin andTaylor (2003) for direct evidence that total bond spreads are partly explained by the cross-sectional proxiesfor individual bond liquidity.
2Alternative explanations of the large non-default spreads include tax differential, market risk premia,and jump risk premia, etc. (Elton et al., 2001; Delianedis and Geske, 2001; Collin-Dufresne, Goldsteinand Helwege, 2003; Cremers, Driessen, Maenhout and Weinbaum, 2005), although the magnitudes of thesecomponents are still subject to debate.
1
of trades, estimated transaction costs, and trading frequency variables.3 Although these
measures have been frequently used in the studies on stock market liquidity (see, e.g, Amihud
and Mendelson (1986), Brennan, Chordia and Subrahmanyam (1998), Hasbrouck and Seppi
(2001), Amihud (2002) and Hasbrouck (2005), among others), they only become available
more recently for corporate bond market with the introduction of TRACE in 2001 and
have already fostered the rapid growth in the research on corporate bond market liquidity
(Downing et al., 2005; Edwards, Harris and Piwowar, 2004; Bessembinder, Maxwell and
Venkataraman, 2006; Goldstein, Hotchkiss and Sirri, 2007). We complement the existing
literature by examining the effect of observed bond trading illiquidity on the nondefault
components of bond spreads and provide clear evidence that such an effect is positive and
statistically significant.4
To control for the default component of bond spread, we follow Longstaff et al. (2005),
Ericsson et al. (2006), and Nashikkar and Subrahmanyam (2006) by using the credit default
swap (CDS) spread.5 Under a CDS contract the protection seller promises to buy the
reference bond at its par value when a pre-defined default event occurs. In return, the
protection buyer makes periodic payments to the seller until the maturity date of the contract
or until a credit event occurs. This periodic payment, usually expressed as a percentage of
the notional value underlying a CDS contract, is called the CDS spread. Compared with
corporate bond spreads, CDS spreads are a relatively pure pricing of default risk of the
underlying entity, abstracting from numerous bond characteristics, such as seniority, coupon
rates, embedded options, and guarantees. Thus, using CDS spreads to control for the default
component of bond spread avoids the actual estimation of default probability and recovery
rate, which would typically suffer from potential model misspecification problem. Also, unlike
corporate bond spreads, CDS contracts are unfunded and do not face short-sale restrictions,
3Earlier papers have also studied bond liquidity effects based on other transaction data sets (Alexander,Edwards and Ferri, 2004; Hong and Warga, 2000; Schultz, 2001; Hotchkiss and Ronen, 2002; Hotchkiss,Warga and Jostova, 2002; Chakravarty and Sarkar, 2003).
4Recent studies by Chacko (2005), Chacko, Mahanti and Mallik (2005) and Nashikkar and Subrahmanyam(2006) have advocated an approach of “latent liquidity”—the weighted average turnover of investors whohold a particular bond by their fractional holdings of the amount outstanding—to measure the accessibilityof bond to market participants.
5Duffie (1999) and Duffie and Liu (2001) show that using CDS spread as a direct measure of the defaultcomponent may result in a small bias, and Longstaff et al. (2005).
2
reducing much the liquidity concerns in the CDS market.6
Unlike in previous studies where only 5-year CDS spreads were used, we utilize the entire
term structure of CDS spreads provided by Markit. Thus, we are able to match exactly the
maturities of all bonds and avoid using the conventional “bracket” method in approximating
bond yields. More importantly, this method allows us to exploit the variations in our liquidity
measures across different bonds issued by the same firm, which contrasts with many existing
approaches that select only one bond for each firm. Using a fixed-effect approach, we can
swipe away the common variations attributed to the unobserved firm characteristics and
economic conditions that may be related to firm credit risk, thus recover the bond specific
liquidity effect on nondefault spread and eliminate the potential estimation bias caused by
unobservable firm heterogeneity.7 In theory, bond liquidity can be intimately related to the
issuer’s credit risk, firm-wide funding risk, or systematic risks across the economy. Using the
fix-effect approach and time series dummies plus controlling for various bond characteristics,
we effectively orthogonalize the bond specific liquidity effects with respect to the firm specific
credit or other risk factors, therefore discover the pure liquidity effects due to the stochastic
transaction shocks.
We find a positive and significant relationship between the illiquidity of intraday trading
and the nondefault bond spread. Such a estimated relationship become much weaker if the
unobservable firm heterogeneity is not controlled for by the fixed effects, which suggests
that there exists correlation between firm-specific liquidity and credit risks but the sign
may be mixed, depending on firm’s (unobserved) characteristics. The explaining power of
these trading-based liquidity measures, in terms of regression R2, seems to be the strongest
for high investment grade (rated A- or higher) as 12-14 percent, less strong for the low
investment grade (rated BBBs) as 9-11 percent, and the weakest for the speculative grade
(rated BB or lower) as 3-4 percent. The positive liquidity effect coefficient is also uniformly
significant across the rating groups for the price impact and trading frequency measures, but
not significant across the low grades for the transaction cost measures. Additional diagnostics
indicates that the non-default component or basis spread is increasing in the bond age and
6Tang and Yan (2006) examines the liquidity effects on CDS premium. See also Nashikkar and Subrah-manyam (2006).
7The empirical evidence on the relation between credit risk on liquidity effect can be mixed (Chen et al.,2005)—some positive (Alexander et al., 2004) and others non-existent (Schultz, 2001).
3
decreasing in the bond maturity. Our result is consistent with the findings of some calibration
studies that while credit risk can explain most of the yield spread for speculative-grade bonds,
a larger fraction (percentage-wise) of investment-grade bond spreads cannot be accounted for
by the credit risk, especially at the short maturities—the so-called “credit premium puzzle”
(e.g., Huang and Huang (2003)).
Controlling for the conventional proxy variables of bond liquidity, such as coupon rate,
issues size, time-to-maturity, and age, does not diminish the sign and significance of the
liquidity measures based on transaction data. In fact, now all of the eight measures are
significant, as opposed to six when bond characteristics are not controlled for. There are
more dramatic differences across the rating groups—as seven out of eight measures remain
significant for high investment grade, three significant for low investment grade, and only
one significant for speculative grade. Further diagnostics indicate that the most significant
liquidity measures based on price impact of trades are almost orthogonal to the bond char-
acteristics, while the lest significant liquidity measure based on trading frequency are highly
collinear with the bond characteristics. These results suggest that conditional on predictable
changes in bond liquidity associated with bond characteristics, our transaction based mea-
sures identify a unique component of the nondefault bond spreads due to the stochastic
variations in bond liquidity with the passage of time. On the other hand, bond characteris-
tics may vary cross-sectionally but only evolve deterministically or remain constant through
time. Note also that bond characteristics like coupon rate, although indicating bond liquid-
ity, may also proxy for the tax effect or credit risk (Elton et al., 2001; Longstaff et al., 2005),
therefore their interpretation can be vague.
Finally, we find that the estimated liquidity effects of our transaction based liquidity
measures are robust to using either swap rate or Treasury rate as alternative risk-free rate
measures, but that the effects on the conventional liquidity proxy variables vary notably with
different risk-free rate measures, which is consistent with the finding in Longstaff et al. (2005).
One important implication is that our transaction based liquidity measures are uncorrelated
with the differences in computed nondefault bond spreads resulting from alternative risk-free
rates, which may be due to the differential tax effects (Longstaff et al., 2005). However, the
conventional approach of using bond characteristics as liquidity proxies is not robust to the
4

alternative risk-free rates, and is not separately identifiable from the differential tax effects.
The pronounced positive effects of illiquidity on the nondefault bond spread are con-
sistent with recent studies showing that liquidity is an important pricing factor for corpo-
rate bonds (Chen et al., 2005; Downing et al., 2005; Bessembinder et al., 2006; Goldstein
et al., 2007; Chacko et al., 2005). It is also consistent with the finding that CDS market
usually leads bond market in the short-run price discovery process (Blanco, Brennan and
Marsh, 2005; Zhu, 2005).8 The lead-lag studies clearly point to an explanation that the
CDS market is more liquid, due to its synthetic nature for pure credit risk pricing; while the
bond market is relative illiquid, possibly due to the short sale constraint, clientele effect, and
other transaction costs. Our evidence suggests that this statistical lead-lag relationship has
its economic interpretation in that bond market trading liquidity does explain the dynamics
of the difference between bond spread and CDS spread, or the so-called “basis spread”.
The rest of the paper is organized as follows: Section 2 describes the constructions of our
bond liquidity measures and discusses the summary statistics; Section 4 presents our main
empirical findings; and Section 5 concludes.
2 Market Trading Liquidity Measures and Data De-
scription
In this section, we first define three types of market trading liquidity measures, including
price impact of trades, estimated trading cost, and trading frequency, based on intraday
bond transactions data. We then describe our data sources and sampling scheme.
2.1 Constructing Market Trading Liquidity Measures
2.1.1 Liquidity Measures Based on Price Impact of Trades
We consider three measures of price impact of trades. The first one is the Amihud illiquidity
measure, defined as the ratio of the absolute percentage change in bond price to the dollar
8Although in the long-run, CDS and bond spreads are in line with each other, as predicted by theno-arbitrage relationship (Duffie, 1999).
5

size of a trade (in million dollars). That is, for each trade j of bond i at day t, we define
Amihudij,t =
|pij,t−pi
j−1,t|pi
j−1,t
Qij,t
where pij,t (in $ per $100 par) and Qi
j,t (in $ million) are the transaction price and the size
of the trade, respectively. Intuitively, this measure reflects how much prices move due to
a given value of trade. Such measure has been used extensively in the literature on stock
market liquidity (Amihud, 2002).
Following Hasbrouck (2005), we also consider the following modified Amihud measure to
minimize the influence of outliers:
Amihudi
j,t =√
Amihudij,t.
For each day t, we calculate these Amihud-type measures for each trade and then average
over all trades to form daily measures.
The third measure is defined as the ratio of daily price range, normalized by daily mean
price, to the total daily dollar trading volume,
Rangeit =
maxj pij,t−minj pi
j,t
pit
× 100
Qit
where Qit =
∑
j Qij,t and pi
t is the daily average price. Intuitively, this “Range” measure,
which is similar to the volatility impact measure used by Downing et al. (2005), reflects how
much volatility in price is caused by a given trade volume.
The above measures reflect price impact of trades or market depth. Larger values suggest
more illiquid bonds, as a trade of a given size would move prices more. By construction, daily
Amihud-type measures are nonmissing only for bonds traded at least twice on the day. For
the range measure to be reasonably informative while avoiding losing too many observations,
we require a bond traded at least three times a day. We use medians of daily measures in a
month as our monthly measures, since median is more robust to outliers than mean.
6

2.1.2 Liquidity Measures Based on Trading Cost
A commonly used measure for trading costs is bid-ask spreads. Unfortunately, our data do
not have information on bid-ask quotes or on the side of a transaction initiating the trade–
which potentially could be used to trace out effective bid-ask spreads. Instead, we construct
two estimates for bid-ask spreads.
First, we use Roll’s (1984) model to estimate the effective bid-ask spread, which is the
square root of the negative covariance of adjacent price changes (Roll, 1984). That is,
BidAskit = 2
√
−Cov(pij,t − pi
j−1,t, pij−1,t − pi
j−2,t),
where pij,t = log pi
j,t. The idea is that assuming informational efficiency and no news on
a bond’s fundamental values, bond prices should bounce back and forth within the band
formed by bid-ask spreads. The price changes for adjacent trades should be negatively
correlated because a current bid (ask) is more likely followed by an ask (bid). The extent of
this negative correlation depends on the the width of the band.
Second, we also construct an indirect proxy for bid-ask spreads using the inter-quartile
range (IQR) of trade prices, defined as the difference between the 75th percentile and 25th
percentile of prices for the day normalized by daily average price . That is,
IQRit =
pi,75tht − pi,25th
t
pit
× 100,
The idea is that assuming no news about fundamentals, price volatility is mostly due to the
bid-ask spread as trades occur at bid and ask prices. The IQR measure captures intraday
volatility but is less sensitive to outliers than the price range.
To compute the above two measures, we require a bond traded at least three times a day,
and monthly observations are the medians of daily values.
2.1.3 Liquidity Measures Based on Trading Frequencies
Trading frequencies have been widely used as indicators for asset liquidity (see, e.g., Vayanos
(1998), among others). Intuitively, all else equal, bonds that are more illiquid would trade
less frequently. We consider the following three variables: (a) monthly turnover rate, which
is the ratio of total trading volume in a month to bond outstanding; (b) the number of days
7
that a bond traded at least once during a month; and (c) the total number of trades that
occurred during a month.
2.2 Data Sources
Since the nondefault component of bond spread is measured by the difference between bond
spread and CDS spread, we need data on bond yields, risk-free rates, and CDS spreads.
We obtain daily secondary market yields as well as rating on corporate bonds in the Merrill
Lynch Global Bond Index universe.9 Our main risk-free rate measure is swap rate.10 For
robustness, we also compare results with using Treasury yields as the risk-free rate. The par
yields of these risk-free bonds, estimated using Nelson and Siegel method, are used in bond
spread calculations. The entire term structure of both rates are available from the Federal
Reserve Board’s public website. The CDS spreads are obtained from Markit, which provides
composite quotes on CDS contracts with maturities at 6 month, 1, 2, 3, 5, 7, 10, 20, and 30
years. We linearly interpolate CDS spreads at immediately adjacent two of above maturity
points to match the maturity of each bond issued by the corresponding firm.
To compute market trading liquidity measures, we use intraday transaction data of corpo-
rate bonds provided (through MarketAxess) by NASD’s Trading Reporting and Compliance
Engine, or TRACE, reporting system. The TRACE dissemination of corporate bond trans-
action data started on July 1, 2002 for a small number of selected bonds; but it gradually
expanded to cover almost entire over-the-counter secondary market transactions in corporate
bonds. More details on these data are presented in Appendix A.
2.3 Sampling
As most bonds are traded sparsely and the daily liquidity measures discussed above exhibit
high variability, we decide to carry out our analysis at monthly frequencies as discussed
above. The period of our analysis starts from July 2001 and ends December 2006. We keep
only senior unsecured bonds issued by U.S. firms with term-to-maturity ranging from 1 year
9According to Merrill Lynch, the yields are option-adjusted in that the implied values of options writtenin the debt contracts, such as call or put, are presumably removed in the yield calculations.
10As suggested by the existing studies, swap rate is the preferred risk-free rate measure for the studyingon liquidity effect because it reduces the impacts of factors such as tax on bond spreads (e.g., Longstaff et al.(2005); Blanco et al. (2005); Zhu (2005)).
8
to 20 years.11
In constructing our transaction based measures, we restrict our sample to trades occurring
between 10:30AM and 3:30PM to further remove the impacts of news-driven trades and price
movements, as company news usually arrives in the after-market hours and major economic
data are generally released no later than 10AM. Finally, we follow the practice of existing
studies using the TRACE data to remove trades with “price errors” (see, e.g., Downing et al.
(2005); Edwards et al. (2004)).12
As shown in Panel A of Table 1, our final sample consists of 439 firms–identified by unique
Merrill Lynch ticker–with total 1877 bonds–identified by bond CUSIPs, that is, about 4
bonds per firm. On average, each bond appears about 20 months during the total 54 months
of our sampling period. In addition, as shown in Panel B of Table 1, the number of available
bonds varies significantly by bond rating and, due to the phasing-in approach of TRACE
dissemination (discussed in Appendix A), by time periods. Specifically, investment-grade
bonds rated BBB and A are by far the most available, and AA and BB-rated bonds come
next, with the fewest bonds in the both tails of the rating distribution (i.e., AAA and
CCC/below). Still, the number of bonds, especially the speculative grade ones, is far greater
than any of the existing studies, such as Longstaff et al. (2005). Finally, the number of bonds
in each rating category increased substantially since Phase III of TRACE dissemination
(which started from October 1, 2004).
3 Summary Statistics
Table 2 presents summary statistics of key variables used in this paper. As shown on Line
1, the mean of basis spreads computed using swap rate as risk-free rate is −13 basis points
for the overall sample, with a median of −2 basis points and an interquartile range of 22
basis points and the 95th-5th percentile range of about 1 percent. The relatively wide range
11In addition, bonds that are putable, convertible, defaulted, with floating rate and sink fund features aredeleted. Bonds with call options are kept, because otherwise, it will reduce the sample significantly (about60 percent of bonds are callable. See Table 2). Note that Merrill’s yields are option-adjusted, and we usecallability as a control variable in our analysis. Moreover, excluding callable bonds does not change our mainconclusions, and the results are available upon request.
12Specifically, we delete a trade if the trade size is missing or zero, or if its price is less than $1 or greaterthan 500, or if price is more than 20 percent away from median price in a day, or if price is more than 20percent away from previous trading price.
9

with the small median value suggests that while on average basis spreads don’t deviate much
from zero, there exist large temporary variations away from zero. As shown in Line 2, such
variations are also evident when basis spreads are computed using Treasury rate as risk-free
rate, though both mean (25bps) and median (37bps) become positive as Treasury rates are
always lower than comparable maturity swap rates. Our main goal is to understand whether
and to what extent liquidity is a driving force of these variations.
These variations in basis spreads exist both across bonds and over time. Cross-sectionally,
we show a selected set of summer statistics by three broad bond rating groups. As indicated
by the statistics on the numbers of bonds, bonds rated A- or higher account for more than
half of our total sample and BBB-rated bonds for about one-third. Comparing to the rat-
ing distribution of the overall corporate bond outstanding, our sample has modestly more
investment-grade bonds.13 Surprisingly, BBB bonds have largest median basis spreads while
speculative grade bond the lowest. Over time, Figure 1 plots monthly median basis spreads
by rating groups with swap rate as the risk free rate over the sample period. All three series
show significant time variations, although interpretation of the behavior of the series before
Phase III (October 2004) is tricky due to small sample sizes, especially for speculative-grade
bonds (see Panel B of Table 1). Even so, since then, basis spreads for speculative grade
bonds lingered just below zero, but basis spreads for investment grade bonds trended up
over zero.
The summary statistics on liquidity measures are reported on Lines 3 through 10 of
Table 2. For the overall sample, the median Amihud measure is 0.11, suggesting that a
median trade, at about $50, 000 (Line 16), would move price by roughly $0.5 percent. As a
result of taking squared root, the median and mean values of the modified Amihud measure
come closer than those of its original formula. The median price range measure is 1.46,
suggesting that a median daily volume, at about $0.27 million (Line 17), would associate
a roughly $0.4 percent price range relative to daily average price. The median estimated
bid-ask spread is $0.77 on a par bond, and the median IQR measure is about 0.47 percent
of daily average price. Corporate bonds are traded sparsely in that the median monthly
13Two factors contribute this “unbalanced” sample. First, as discussed in Appendix A, TRACE tookthree phases to reach full dissemination with the earlier phases disseminating transaction data on mostlyhighly rated investment-grade bonds (see Panel B of Table 1). Second, there are fewer firms with relativelycomplete term structure of CDS quotes for speculative-grade bonds.
10
turnover rate is 0.02, meaning that on average it takes about 50 months for a bond to turn
over once. The median number of traded days is 10 days, and the median number of trades
in a month is 22.
By rating, it is clear that by all price impact measures, BBB bonds appear to be the most
liquid, though speculative-grade bonds are close to BBB bonds, except by the price range
measure. A or above rated investment-grade bonds appear to be the least liquid by these
measures. By transaction cost measures, A or above rated investment-grade bonds appear
to be the most liquid and are similar to BBB bonds. Surprisingly, the median turnover rates
are almost the same across rating categories. But for other two trading frequency measures,
BBB bonds appear to be the most illiquid rating group, opposite to the pattern observed in
price-related liquidity measures. Later on, we attribute this puzzle to the fact that trading
frequencies are more correlated with the bond characteristics.
Average bond characteristics are shown in Lines 11 to 15 of Table 2. For the overall
sample, the median bond in a typical month has a coupon rate of 6.4 percent, is just over
3 years since issuance, has just over 5.5 years left to maturity, and has $400 million dollars
outstanding. About 60 percent of bonds are callable. Not surprisingly, median coupon rate
increases in bond rating. In addition, speculative-grade bonds tend to be smaller, older, and
more likely callable, but comparisons of remaining maturity across rating groups are mixed.
Figure 2 shows the overall sample distributions of bond age, remaining maturity, and
maturity at issuance. The number of bonds decreases quickly for those older than 9 years
or those with more than 10 years of remaining maturity. These distributions suggest that in
interpreting results related to age and remaining term-to-maturity, we have to be cautious
about the reliability over the range greater than 10 years. In addition, while there are wide
variations in the maturity at issuance, over half of the bonds are issued at around 10 years,
with other mass points at 3, 5, 7, 15, 20, and 30 years.
It is interesting to examine unconditionally how basis spreads and our liquidity measures
are related to each other and to bond characteristics. Figure 3 plots basis spreads and liquid-
ity measures–only three of them to save space–by 7 finer bond rating groups. Interestingly,
median basis spreads appear to be constant for bonds rated A or higher and then move
higher for BBB- and BB-rated bonds, they drop sharply for B or lower rated bonds. While
11
basis spreads appear to be negatively correlated with bond turnover rate, as conjectured,
they also appear to be negatively correlated with illiquidity measures, as opposite to common
views. In addition, these correlations are mostly driven by observations at deep junk rating
groups, where as alerted above the number of bonds is small.
Figures 4 plots basis spreads and selected liquidity measures by bond age. It shows that
basis spreads increase very much linearly in age, so do the Amihud measure and the estimated
bid-ask spread. Turnover rates decrease in bond age, especially sharply at the short end of
the age range. Figure 5 plots basis and selected liquidity measures by remaining maturity.
Interesting, basis spreads decrease quickly at the short term-to-maturity and remain roughly
flat until reaching the tail of the maturity distribution. The pattern at the short maturity
confirms unconditionally the findings by previous studies such as Huang and Huang (2003)
that credit risk accounts smaller fraction of bond spreads when approaching the shorter end
of maturity. Both Amihud measure and the estimated bid-ask spread increase in remaining
maturity, while turnover rate does so only up to 10 years and then fell sharply. Again, as a
cautious note, we have to keep in mind that the number of bonds fall substantially for bond
age older than 9 years and remaining maturity greater than 10 years.
4 Regression Results
We now report regression results on the impact of liquidity on basis spreads. First, as a
benchmark, we present results from OLS regressions of basis spreads on our trading liquidity
measures using the overall sample, where basis spreads are computed using swap rate as
risk-free rate. Particularly, we show that the richness of our data allows us to use firm
and time fixed effect models to better identify liquidity effects. These results are followed by
regressions by rating groups. Then we add into our models bond characteristics that previous
studies used as proxies for bond liquidity, showing that trading liquidity measures remain
significant in explaining variations in basis spreads. Finally, we show results using Treasury
rate as the alternative risk-free rate measure and caution the usefulness of previous approach
gauging the effect of tax on bond spreads. Note that to avoid the impact of outliers, we
windsorize the sample at 5 percent of both basis spreads and liquidity measures used in each
regression. In addition, we convert all liquidity measures to log scale in all regressions.
12

4.1 Benchmark Results
Table 3 reports our results on the impact of trading liquidity on basis spreads. Panel A shows
simple univariate OLS regressions of basis spreads on our trading based liquidity measures
using the overall sample. Standard errors of the estimated coefficients are computed using
the Huber/White robust method assuming that regression residual terms may be correlated
across bonds issued by the same firm but uncorrelated across firms.
The results show that the estimated coefficients on all three trading frequency measures
have expected negative signs and are statistically significant at the 95 percent confidence
level. However, only one of the three price impact variables, the price range measure, is
statistically significant with an expected positive sign, and neither of the two transaction
cost measures is significant. Moreover, the largest R2 among all regressions is just 3 percent.
Intuitively, these simple OLS regressions use total variations–across bonds and firms and
over time–in the liquidity measures to identify the impact of liquidity. These estimates
may be flawed if there are unobservable firm characteristics or market conditions that are
correlated to both trading liquidity measures and basis spreads. For example, clientele effects
among institutional investors associated with differently rated firms may generate liquidity
impacts on bond spreads (see, e.g., Chacko et al. (2005)). These unobservable heterogeneities
may bias the simple OLS estimates in an unpredictable direction.
To reduce the impact of these unobservable factors, we use a fixed effect model to rees-
timate the above models, essentially by including firm dummy variables indicating bond
issuers and time dummy variables indicating the month of the observation. These fixed
effect models remove the impacts of both firm- and time-specific factors which may affect
bond basis spreads and be correlated with trading liquidity measures. Thus, the impact
of trading liquidity measures on basis spreads is identified by temporary variations across
bonds, both within and across firms, and over time that are unrelated to macroeconomic
conditions. The richness of our data, especially with the full term structure of CDS spreads
that allows multiple bonds for a single firm at any given time, gives us enough degree of
freedom to estimate these fixed effect models.
As shown in Panel B of Table 3, after controlling for unobservable heterogeneity, not only
do all coefficients have expected signs, they are also mostly statistically significant at the 95
13
percent confidence level. In addition, all R2 (based on the within effect result) increase to
about 7 percent.
Note that all liquidity measures are in log scales. Economically, the magnitude of the
impact of liquidity appears to be modest. For example, the coefficient on Amihud measure,
column (9), is 0.27. So suppose Amihud measure changes from its median 0.11 (Line 3 of
Table 2) by the size of its interquartile range 0.35–meaning the price impact of a median
trade, at about $50, 000 (Line 15 of Table 2), increases roughly from 0.5 percent (= 0.11∗0.05)
to about 2 percent (= (0.11+0.35)∗0.05). Then the nondefault components of bond spreads
would increase by about 0.4 basis points (= 0.27 ∗ log[(0.11 + 0.35)/0.11]) with a 95 percent
confidence interval of [0.3, 0.5] basis points. Similarly, if the speed of turnover increases from
its median level 0.02 by the size of its interquartile range 0.03, the nondefault components
of bond spreads would decrease roughly 1 basis point with a 95 percent confidence interval
of [0.9, 1.2] basis points. While all these numbers are rather small in absolute values, they
are nontrivial relative to the near zero unconditional median of basis spreads.
4.2 Liquidity Effects By Rating
How does the impact of liquidity on the nondefault component of bond spreads vary with
bond rating? To answer this question, we divide our sample by three broad rating groups,
including bonds rated A- or higher, bonds rated BBB+, BBB, or BBB-, and bond rated
speculative grade, and reestimate the fixed effect models. The results are reported in Table 4.
Overall, the liquidity effects are pronounced for all rating groups. Let us first look at
the signs and statistical significance of the estimates. As shown in Panel A, for bonds rated
A- or higher, all estimated coefficients have expected signs and are statistically significant
at the 95 percent confidence level, with R2 ranging from 12 to 14 percent. For both BBB-
rated and speculative-grade bonds, the estimated coefficients on the price impact and the
trading frequency measures all have have expected signs and are statistically significant, with
R2 equal to roughly 10 percent for BBB bonds and 4 percent for speculative-grade bonds.
Estimates on transaction cost variables, though, are not significant and may have “wrong”
signs.
In term of economic magnitude, basis spreads move the most for speculative-grade bonds
14

for a given size of change in any liquidity measure; but comparison among investment-grade
bonds depends on which measure is used. Roughly speaking, liquidity effects appear to be
more pronounced for A- or higher-rated bonds when using trading frequency measures, and
for BBB-rated bonds when using price impact measures. The results are qualitatively the
same if we calculate the magnitude by assuming that a liquidity measure increases from its
median by the size of its interquartile range. Our finding that the effects of trading liquidity
on speculative grade bonds are more pronounced than investment-grade bonds when not
controlling for other bond characteristics is consistent with some of the existing literature
and conventional view (e.g., Downing et al. (2005)).
It is worth noting again that to reach the above conclusions, our study is different from
previous work in two key areas. First, our rich data on the term structure of CDS spreads
allow us to better control the default component of bond spreads and, more importantly, to
better control for unobservable firm or economic risk factors. To the extent these factors
may be correlated with liquidity and bond spreads, previous estimates on the liquidity effects
such as by Longstaff et al (2005) may be biased. The richness of our data gives us enough
degree of freedom to use fixed effect models to remove such potential biases. Second, we use
transaction based measures for liquidity while previous work mostly used bond characteristics
as proxies. Since bond characteristics are predictable, previous work relies mainly on cross
bond variations to identify the liquidity effects and cannot identify the impact of stochastic
variations over time in liquidity on bond spreads. Our transaction based liquidity measures
solve this issue as they vary both over time and across bonds stochastically. Below we
study the additional explanatory power of our trading liquidity measures after controlling
the commonly-used liquidity proxies, showing that the impact of stochastic variations in
trading based liquidity measure is robust.
4.3 Impacts of Conventional Proxies for Liquidity
Bond characteristics that were commonly used as proxies for liquidity measures in existing
studies include coupon rate, bond age, remaining maturity, and the size of bonds. To allow
more flexible and potentially nonlinear functional forms, we use a 4-order polynomials for
15
bond age and remaining maturity.14 Briefly speaking, coupon is believed to be a reasonable
proxy because bonds with large coupons may be more likely subject to buy-and-hold investors
and thus may be less liquid. There is also evidence that trading frequency is highly correlated
with bond age, term-to-maturity, and issue size (Alexander et al., 2004; Hotchkiss and Ronen,
2002; Edwards et al., 2004; Downing et al., 2005). In addition to the above variables, we
also include a dummy variable indicating whether a bond is callable.
Note that with these additional proxies, controlling unobservable firm or economic factors
using fixed effect methods may become even more important because these proxies may be
correlated with credit risk, which in turn may be correlated the unobservable factors affecting
basis spreads. For example, coupon is obviously correlated with credit risk as lower credit
quality issuers have to price higher yields to compensate investors for taking extra risks.
Also, bond size may also be correlated with credit risk as only larger and better credit
quality firms can issue larger bonds. Thus, to the extent that the unobservable firm or
economic factors may be correlated with credit risk, the estimates on these proxies may be
biased if such unobservables are not appropriately controlled for.
In Table 5, we report estimation results from fixed effect models after adding liquidity
proxies to our benchmark models using the overall sample. Comparing with Panel B of
Table 3, we see that all of our transaction based liquidity measures, including transaction
cost measures, are now statistically significant and have expected signs. Also, coefficients on
trading frequency measures are now significantly lower (in absolute values), but coefficients in
price impact measures are largely similar. These observations suggest that first, the trading
liquidity measures are important to understand stochastic variations in basis spreads; second,
both transaction costs and trading frequency measures may be highly, while price impact
measures may be less, correlated with the liquidity proxies. Such conjecture is confirmed in
Table 6 where we regress our liquidity measures on the liquidity proxies. In particular, R2s
for trading frequency measures range from 13 to 33 percent. R2s for Amihud type measures
are only 4 percent while R2s for the rest regressions range from 12 to 16 percent.
The liquidity proxy variables are mostly statistically significant in these regressions. Note
14We also experimented using dummy variables to indicate each year (up to 20) of bond age and remain-ing maturity and using dummy variables to indicate brackets of bond age and remaining maturity usingconventional cutoff points at 1, 3, 5, 7, and 10 years. The results are roughly the same as reported here.
16

that the significance of liquidity proxy variables change little after adding our transaction
based liquidity measures (i.e., from column (1) where only proxies are used to columns 2 to 9),
suggesting that our trading liquidity measures identify a distinct component of basis spreads
associated with stochastic variations in bond trading liquidity. Overall, basis spreads are
positively associated with coupon rate and bond size but negatively with call option. Basis
spreads are also statistically significantly related to bond age and remaining maturity. As
plotted by the solid lines in Figure 6, basis spreads increase almost linearly in bond age, but
decrease sharply in remaining maturity but stay flat after 5 years.
It is worth to point out that some of our results are opposite to what is found in the
literature. For example, we find that basis spreads are positively, not negatively, related to
bond size. Given our fixed effect approach, this finding suggests that large bonds may be less
liquid than small bonds among bonds issued by the same firm conditional on same economic
conditions. It also suggests that previous findings may pick up the correlation between bond
size and nondefault component of bond spreads partly by comparing large bonds issued by
one firm to small bonds issued by another firm. If credit quality or unobservable firm or
economic factors are not well controlled for, those findings may just reflect the correlation
between bond size and credit risk.
As before, we also conduct the same analysis by rating group, and the results are reported
in Table 7. The striking result is that all trading liquidity measures, except the number of
trades, are statistically insignificant for speculative-grade bonds. For A- or higher-rated
bonds, our trading liquidity measures, except the number of days with trades, continue
to be statistically significant, while for BBB-rated bonds, only Amihud-type measures and
estimated bid-ask spreads are statistically significant. Compared with Table 4 where liquidity
impacts appear more pronounced for speculative-grade bonds, these results suggest that most
of the correlation between basis spreads and trading liquidity are closely associated with bond
characteristics. Such association becomes weaker as bond rating improves, as evident by the
continued significance of trading liquidity measures for A- or higher-rated bonds. These
results suggest that our trading liquidity measures identify a unique component of basis
spreads that is orthogonal to conventional liquidity proxies for A- or higher-rated bonds.
Among regressors that are not shown in the table, coupon continues to be positive and
17
statistically significant for all rating groups. The dummy variable indicating callability re-
main negative for all regressions but only statistically significant for A- or higher-rated bonds.
Coefficients on bond size are mixed in signs and none of them is statistically significant, sug-
gesting that conditionally other regressors, issue size is highly correlated with bond rating.
Coefficients on bond age and on remaining maturity are, respectively, jointly significant,
and their relations with basis spreads are plotted in Figure 6. We only plot the functions
for age and remaining maturity up to 10 years, because standard errors of the fitted values
beyond 10 years become too high due to the small number of observations. As shown in Plot
A, basis spreads increase almost linearly in bond age for both groups of investment-grade
bonds; but for speculative-grade bonds, basis spreads decrease in bond age until at about
4 years and then rose gradually. As shown in Plot B, for A- or higher-rated bonds, basis
spreads decrease sharply in remaining maturity until about 4 years and then rose slowly.
For BBB-rated bonds, basis spreads also decrease sharply initially but stay roughly flat after
5 years. For speculative-grade bonds, basis spreads decrease all the way over the plotted
range.
Our findings on remaining maturity are consistent with previous studies suggesting that
a large fraction of investment-grade bond spreads, especially at the short end of the maturity
range, cannot be accounted for by credit risk (e.g., Huang and Huang 2003). Our results also
suggest that this may also be true for speculative-grade bonds. In addition, our findings on
bond age suggest that credit risk may not account for the bond spreads for young speculative-
grade bonds either.
4.4 Robustness Analysis
4.4.1 Treasury Rate as Risk-Free Rate
Swap rate has been regarded as the appropriate risk-free rate measure for studying liquidity
impacts on basis spreads, as it offers better control for tax effects. Nonetheless, using swap
rate has its own drawbacks. For example, swap rate has a component compensating for
counterparty default risks and the benchmark Libor rate also has a credit risk component.
For robustness, we repeat our estimations with basis spreads computed using Treasury rate
as the risk-free rate measure. In Table 8, we report the results on the estimations that mirror
18

those in Table 5.
We find that the coefficients on our transaction based liquidity measures are the same
in both sign and statistical significance as those with swap rate as the risk-free rate. The
magnitudes of the coefficients are also close. These findings suggest strongly that the differ-
ence in computed basis spreads resulting from alternative risk-free rate measures, which are
possibly due to such effects as differential tax treatment, is uncorrelated with our transaction
based liquidity measures.
Interestingly, coefficients on many of the conventional liquidity proxy variables change
notably. In particular, coefficients on coupon are smaller now in all regressions. On a related
note, (Longstaff et al., 2005) argued that one can use the difference in estimated coefficients
on coupon rates between using Treasury rate and using swap rate as a measure of tax effect
on bond spread. Based on our estimates, though, coefficients on coupon are smaller when
using Treasury rate as risk free rate, which would result a negative tax effect! Our results thus
suggest that the said method of identifying tax effect may be not robust to the controlling
of trading based liquidity effect or unobservable firm-specific heterogeneity in credit risk.
Clearly, there remains more structural research to do to understand the tax effect.
4.4.2 Robustness Analysis
We also conduct a number of other robustness analysis, and our main conclusions are un-
changed. These analyses include using only the TRACE full dissemination periods, using
basis spreads relative to bond spreads or coupon rate as dependent variable, using only
bonds with original maturity of 10 years (including remaining maturity but not bond age
as regressors), using only bonds whose yields are close to par to reduce the coupon effect
in computing the bond yields, and using a sample excluding AAA and CCC or lower rated
bonds.
5 Conclusion
In this paper we examine the relationship between the nondefault component of corporate
bond spreads and bond liquidity. We control default component of bond spreads using a rich
term-structure of CDS spreads, and measure bond liquidity using newly available intraday
19

bond transaction data. We construct three types of transaction based liquidity measures:
price impact of trades, estimated transaction costs, and trading frequency variables. The
richness of our data set allow us to use fixed effect models to control for the unobservable
firm and economic factors that may be correlated with both the nondefault components of
bond spreads and bond liquidity. In addition, we also control for conventional liquidity proxy
variables such as coupon rate, issue size, time-to-maturity, and bond age.
We find clear positive and significant relationship between the nondefault bank spreads
and illiquidity of intraday trading. We show that such estimated relationship would appear
weaker if the unobservables firm and economic factors were not well controlled for. We
also find that the trading liquidity effect is not correlated with conventional liquidity proxy
variables for the highly rated investment-grade bonds, but weakly correlated with those
proxies for BBB-rated bonds and highly correlated with those proxies for the speculative-
grade bonds. These results are consistent with previous bond pricing studies that while
credit risk can explain most of the yield spread for speculative-grade bonds, a larger fraction
of investment-grade bond spreads cannot be accounted by credit risk.
Since changes in the conventional liquidity proxies are predictable, mostly existing stud-
ies rely on cross-sectional variations to identify the liquidity effects. Our transaction based
liquidity measures vary stochastically both over time and cross sectionally. Empirically, we
find that our measures identify a distinct component of basis spreads due to the stochastic
variations in bond liquidity. We also find that the estimated liquidity effects of our transac-
tion based liquidity measures are robust to using Treasury yield as alternative risk-free rate
measures.
For future research, the strong statistic evidence for the positive relationship between the
nondefault bond spreads and trading liquidity suggests that it is important to incorporate
factors such as price impact of trades and transaction costs into the bond pricing models, at
least in the studies on short-term behavior of bond spreads. In addition, our results call for
further reevaluations on the impact of tax on bond spreads.
20
References
Alexander, Gordon, Amy Edwards and Michael Ferri (2004), ‘The determinants of tradingvolume of high-yield corporate bonds’, Journal of Financial Markets 3, 177–204.
Amihud, Yakov (2002), ‘Illiquidity and stock returns: Cross-section and time-series effects’,Journal of Financial Markets 5(1), 31–56.
Amihud, Yakov and Haim Mendelson (1986), ‘Asset prices and bid-ask spread’, Journal of
Financial Economics 17(2), 223–249.
Bessembinder, Hendrik, William Maxwell and Kumar Venkataraman (2006), ‘Market trans-parency, liquidity externalities, and institutional trading costs in corporate bonds’, Jour-nal of Financial Economics 82, 251–88.
Blanco, Roberto, Simon Brennan and Ian W. Marsh (2005), ‘An empirical analysis of thedynamic relationship between investment grade bonds and credit default swaps’, Journal
of Finance 60(5), 2255–81.
Brennan, Michael J., Tarun Chordia and Avanidhar Subrahmanyam (1998), ‘Alternativefactor specifications, security characteristics and the cross-section of expected stockreturns’, Journal of Financial Economics pp. 345–373.
Chacko, George (2005), ‘Liquidity risk in the corporate bond markets’, Working Paper .Harvard Business School.
Chacko, George, Sriketan Mahanti and Gaurav Mallik (2005), ‘The determinants of liquidityin the corporate bond markets: An application of latent liquidity’, Harvard BusinessSchool Working Paper.
Chakravarty, Sugato and Asani Sarkar (2003), ‘Trading costs in three u.s. bond markets’,Journal of Fixed Income 13, 39–48.
Chen, Long, David Lesmond and Jason Wei (2005), ‘Corporate yield spreads and bondliquidity’, Michigan State University, Working paper.
Collin-Dufresne, Pierre, Robert Goldstein and Jean Helwege (2003), ‘Is credit event riskpriced? modeling contagion via the updating of beliefs’, Working Paper . CarnegieMellon University.
Cremers, Martijn, Joost Driessen, Pascal Maenhout and David Weinbaum (2005), ‘Explain-ing the level of credit spreads: Option-implied jump risk premia in a firm value model’,Working paper. Yale University.
de Jong, Frank and Joost Driessen (2004), ‘Liquidity risk premia in corporate bond andequity markets’, Working paper. University of Amsterdam.
Delianedis, Gordon and Robert Geske (2001), ‘The components of corporate credit spreads:Default, recovery, tax, jumps, liquidity, and market factors’, UCLA Working Paper.
21

Downing, Chris, Shane Underwood and Yuhang Xing (2005), ‘Is liquidity risk priced in thecorporate bond market?’, Working paper. Rice University.
Duffee, Greg (1996), ‘Idiosyncratic variations in treasury bill yields’, Journal of Finance
51, 527–551.
Duffie, Darrell (1999), ‘Credit swap valuation’, Financial Analysts Journal pp. 73–87.
Duffie, Darrell and Jun Liu (2001), ‘Floating-fixed credit spreads’, Financial Analysts Jour-
nal pp. 76–87.
Edwards, Amy, Lawrence Harris and Michael Piwowar (2004), ‘Corporate bond market trans-parency and transactions costs’, University of South California Working Paper.
Elton, Edwin J., Martin J. Gruber, Deepak Agrawal and Christopher Mann (2001), ‘Ex-plaining the rate spread on corporate bonds’, Journal of Finance 56, 247–277.
Eom, Young Ho, Jean Helwege and Jingzhi Huang (2004), ‘Structural models of corporatebond pricing: an empirical analysis’, Review of Financial Studies 17, 499–544.
Ericsson, Jan, Joel Reneby and Hao Wang (2006), ‘Can structural models price default risk?evidence from bond and credit derivative markets’, McGill University Working Paper.
Ericsson, Jan and Olivier Renault (2006), ‘Liquidity and credit risk’, Journal of Finance
61(5), 2219–2250. McGill University.
Goldstein, Michael A., Edith S. Hotchkiss and Erik R. Sirri (2007), ‘Transparency andLiquidity: A Controlled Experiment on Corporate Bonds’, Review of Financial Studies
20(2), 235–273.
Hasbrouck, Joel (2005), ‘Trading costs and returns for u.s. equities: the evidence from dailydata’, NYU, Stern School of Business Working Paper.
Hasbrouck, Joel and Duane Seppi (2001), ‘Common factors in prices, order flows, and liq-uidity’, Journal of Financial Economics 59, 381–411.
Hong, Gwangheon and Arthur Warga (2000), ‘An empirical study of corporate bond markettransactions’, Financial Analyst Journal 56, 32–46.
Hotchkiss, Edith, Arthur Warga and Gergana Jostova (2002), ‘Determinants of corporatebond trading: A comprehensive analysis’, Working Paper . Boston College.
Hotchkiss, Edith and Tavy Ronen (2002), ‘The informational efficiency of the corporate bondmarket: an intraday analysis’, Review of Financial Studies 15, 1325–1354.
Houweling, Patrick, Albert Mentink and Ton Vorst (2005), ‘Comparing possible proxies ofcorporate bond liquidity’, Journal of Banking and Finance 29(6), 1331–58.
Houweling, Patrick and Ton; Vorst (2005), ‘Pricing default swaps: Empirical evidence’,Journal of International Money and Finance 24(8), 1200–1225.
22
Huang, Jingzhi and Ming Huang (2003), ‘How much of the corporate-treasury yield spreadis due to credit risk?’, Working Paper . Penn State University.
Jones, E. Philip, Scott P. Mason and Eric Rosenfeld (1984), ‘Contingent claims analysis ofcorporate capital structures: An empirical investigation’, Journal of Finance 39, 611–625.
Liu, Jun, Francis A. Longstaff and Ravit E. Mandell (2004), ‘The market price of riskin interest rate swaps: The roles of default and liquidity risks’, Journal of Business.Forthcoming.
Longstaff, Francis A., Sanjay Mithal and Eric Neis (2005), ‘Corporate yield spreads: Defaultrisk or liquidity? new evidence from the credit default swap market’, Journal of Finance
60(5), 2213–53.
NASD (2004), ‘Notice to members: Sec approves amendments to trace rules to disseminatetransaction information on all trave-eligible securities, modify and supplyment definedterms, and enhance notfication requirements’, 04-65.
Nashikkar, Amrut and Marti Subrahmanyam (2006), ‘Latent liquidity and corporate bondyield spreads’, Working Paper . Stern School of Business, New York University.
Perraudin, William R.M. and Alex P. Taylor (2003), ‘Liquidity and bond market spreads’,Working paper. Brikbeck College.
Reinhart, Vincent and Brian Sack (2001), ‘The changing information content of marketinterest rates’, BIS Working Paper. Prepared for Autumn 2001, Central Bank EconomistMeeting at the Bank for International Settlements, Basel, Switzerland.
Roll, R. (1984), ‘A simple implicit measure of the effective bid-ask spread in an efficientmarket’, Journal of Finance 39, 1127–1139.
Schultz, Paul (2001), ‘Corporate bond trading costs: A peek behind the curtain’, Journal of
Finance 56, 677–698.
Tang, Dragon and Hong Yan (2006), ‘Liquidity and credit default swap spreads’, Working
Paper . University of South Carolina.
Vayanos, Dimitri (1998), ‘Transaction costs and asset prices: A dynamic equilibrium model’,Review of Financial Studies 11(1), 1–58. MIT.
Zhu, Haibin (2005), ‘An empirical comparison of credit spreads between the bond market andthe credit default swap market’, Journal of Financial Services Research . forthcoming.
23
Appendix
A Data Sources
Our paper uses four main sources of data to study the impact of bond liquidity on basisspreads, including data on corporate bond yields, CDS spreads, risk-free rates, and intradaybond transactions. We discuss these data sources below.
A.1 Bond Yields
We obtain daily secondary market prices and yields on corporate bonds in the Merrill LynchGlobal Bond Index universe. The prices are bids, either indicative or “live” quotes, collectedfrom dealers at the close of business days, and the yields are option-adjusted in that thevalues of options written in the debt contracts, such as call or put, are removed in the yieldcalculations. Our monthly bond yield measures are just average of daily effective yields in amonth. We also use Merrill’s composite ratings for bond ratings, which may only change atrebalancing at the end of each month.
The advantage of using these quotes as bond price measures is twofolds. First, becauseall quotes are on the bid sides, the daily changes in prices are not caused by the side oftransactions. Since the publicly disseminated TRACE data don’t include the side of trans-actions, changes in observed transaction prices may simply be because one price is on thebid side and the other on ask side, even if there is no change in the bond’s fundamentalvalue or in the bid-ask spreads. Second, because most bonds are traded sparsely, using dailytransaction prices for valuation purpose would result in many missing values. To the extentthat the quotes in Merrill’s data reflect market participants’ valuations of the bonds, theypreserve better continuity of market valuation.
A.2 CDS Data
Data on CDS spreads are from Markit, a comprehensive data source that assembles a networkof industry-leading partners who contribute information across several thousand credits ona daily basis. Using the contributed quotes, Markit creates the daily composite quote foreach CDS contract that has sufficient quotes.
We create the monthly CDS spread by calculating the average composite quote in eachmonth. To avoid measurement errors, we remove those observations for which huge discrep-ancies (above 20 percent) exist between CDS spreads with modified restructuring clauses andthose with full restructuring clauses. We also removed CDS spread higher than 20 percentbecause they are often associated with the absence of trading or a bilateral arrangementfrom an upfront payment.
We use CDS contracts on maturities at 1,2,3,5,7,10,30 years with modified restructuringclauses. These rich maturity structures allow us to interpolate CDS spreads at any maturitywithin the range.
24
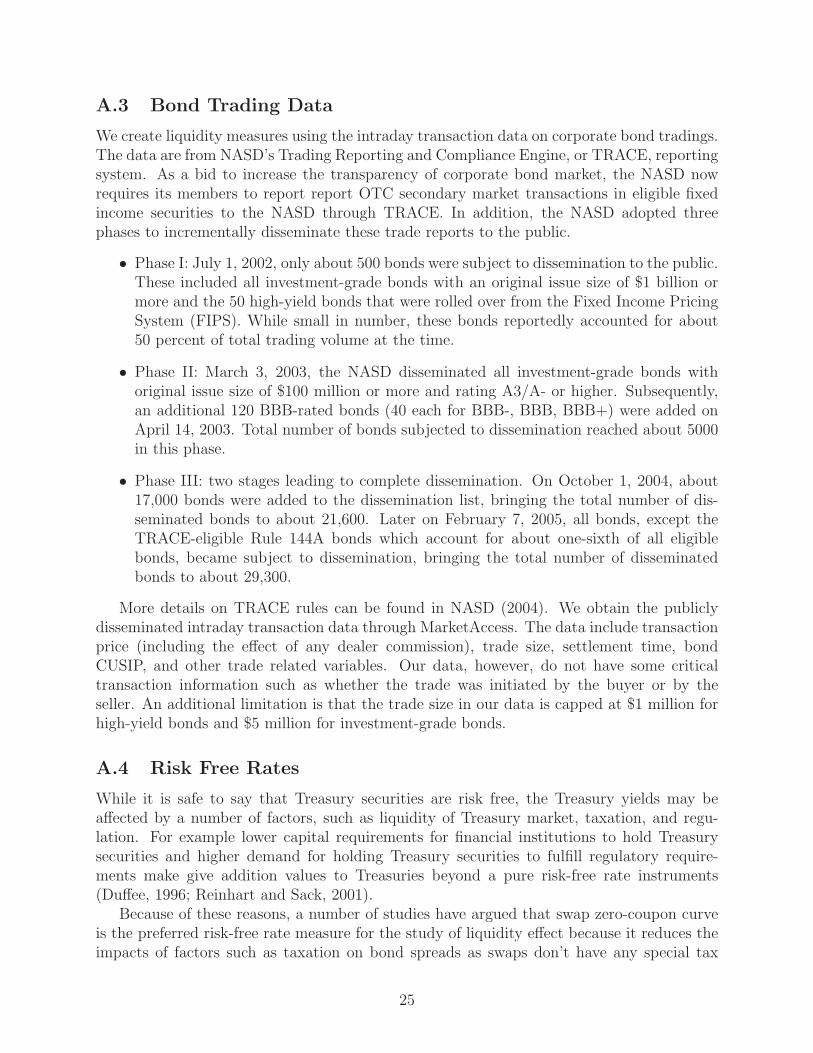
A.3 Bond Trading Data
We create liquidity measures using the intraday transaction data on corporate bond tradings.The data are from NASD’s Trading Reporting and Compliance Engine, or TRACE, reportingsystem. As a bid to increase the transparency of corporate bond market, the NASD nowrequires its members to report report OTC secondary market transactions in eligible fixedincome securities to the NASD through TRACE. In addition, the NASD adopted threephases to incrementally disseminate these trade reports to the public.
• Phase I: July 1, 2002, only about 500 bonds were subject to dissemination to the public.These included all investment-grade bonds with an original issue size of $1 billion ormore and the 50 high-yield bonds that were rolled over from the Fixed Income PricingSystem (FIPS). While small in number, these bonds reportedly accounted for about50 percent of total trading volume at the time.
• Phase II: March 3, 2003, the NASD disseminated all investment-grade bonds withoriginal issue size of $100 million or more and rating A3/A- or higher. Subsequently,an additional 120 BBB-rated bonds (40 each for BBB-, BBB, BBB+) were added onApril 14, 2003. Total number of bonds subjected to dissemination reached about 5000in this phase.
• Phase III: two stages leading to complete dissemination. On October 1, 2004, about17,000 bonds were added to the dissemination list, bringing the total number of dis-seminated bonds to about 21,600. Later on February 7, 2005, all bonds, except theTRACE-eligible Rule 144A bonds which account for about one-sixth of all eligiblebonds, became subject to dissemination, bringing the total number of disseminatedbonds to about 29,300.
More details on TRACE rules can be found in NASD (2004). We obtain the publiclydisseminated intraday transaction data through MarketAccess. The data include transactionprice (including the effect of any dealer commission), trade size, settlement time, bondCUSIP, and other trade related variables. Our data, however, do not have some criticaltransaction information such as whether the trade was initiated by the buyer or by theseller. An additional limitation is that the trade size in our data is capped at $1 million forhigh-yield bonds and $5 million for investment-grade bonds.
A.4 Risk Free Rates
While it is safe to say that Treasury securities are risk free, the Treasury yields may beaffected by a number of factors, such as liquidity of Treasury market, taxation, and regu-lation. For example lower capital requirements for financial institutions to hold Treasurysecurities and higher demand for holding Treasury securities to fulfill regulatory require-ments make give addition values to Treasuries beyond a pure risk-free rate instruments(Duffee, 1996; Reinhart and Sack, 2001).
Because of these reasons, a number of studies have argued that swap zero-coupon curveis the preferred risk-free rate measure for the study of liquidity effect because it reduces theimpacts of factors such as taxation on bond spreads as swaps don’t have any special tax
25

or regulatory treatments (e.g., Houweling and Vorst (2005); Longstaff et al. (2005); Blancoet al. (2005); Zhu (2005)).
Nonetheless, swap rate may be still a distorted risk-free rate measure because at leastcounterparty credit risk would affect its pricing. For robustness, we compare the resultswith Treasury rate as the risk-free rate to those with swap rate. We obtain the entire termstructure of both rates from the Fed Reserve Board’s public website. In particular, the swaprate is the International Swaps and Derivatives Association (ISDA) mid-market par swaprates. Rates are for a fixed rate payer in return for receiving three month LIBOR, and arebased on rates collected at 11:00AM. Again monthly data are just average of daily values ofthese rates in a month.
26
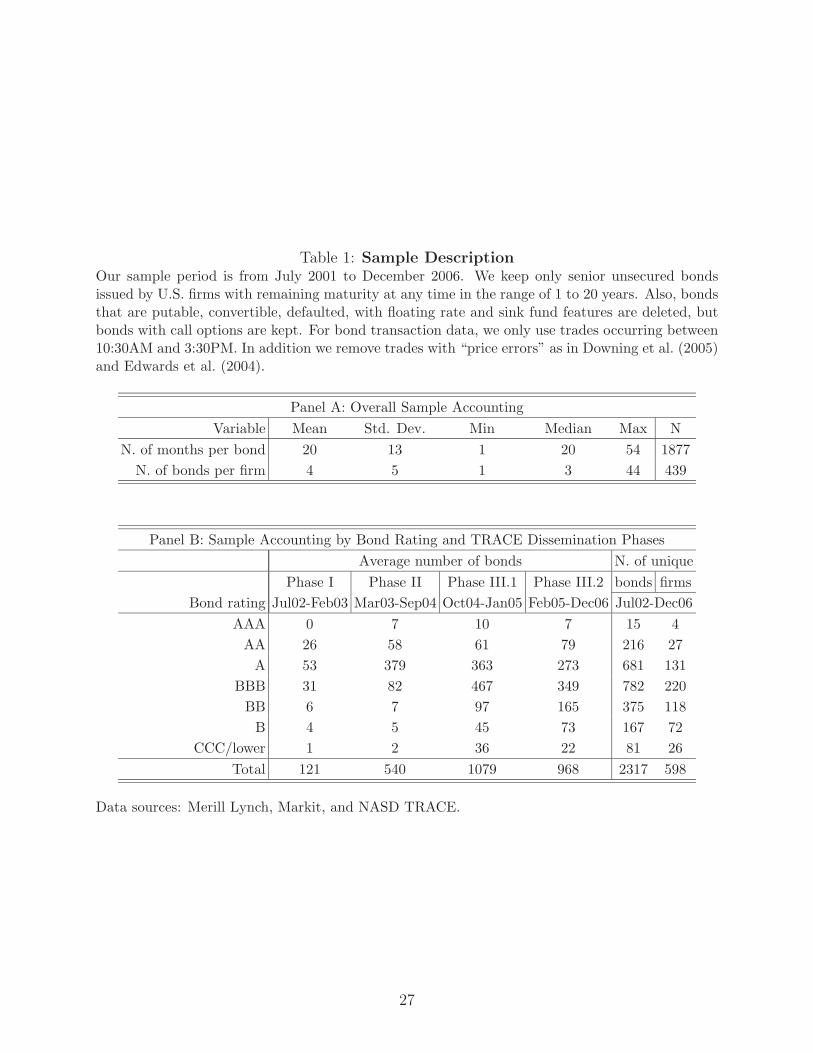
Table 1: Sample Description
Our sample period is from July 2001 to December 2006. We keep only senior unsecured bondsissued by U.S. firms with remaining maturity at any time in the range of 1 to 20 years. Also, bondsthat are putable, convertible, defaulted, with floating rate and sink fund features are deleted, butbonds with call options are kept. For bond transaction data, we only use trades occurring between10:30AM and 3:30PM. In addition we remove trades with “price errors” as in Downing et al. (2005)and Edwards et al. (2004).
Panel A: Overall Sample Accounting
Variable Mean Std. Dev. Min Median Max N
N. of months per bond 20 13 1 20 54 1877
N. of bonds per firm 4 5 1 3 44 439
Panel B: Sample Accounting by Bond Rating and TRACE Dissemination Phases
Average number of bonds N. of unique
Phase I Phase II Phase III.1 Phase III.2 bonds firms
Bond rating Jul02-Feb03 Mar03-Sep04 Oct04-Jan05 Feb05-Dec06 Jul02-Dec06
AAA 0 7 10 7 15 4
AA 26 58 61 79 216 27
A 53 379 363 273 681 131
BBB 31 82 467 349 782 220
BB 6 7 97 165 375 118
B 4 5 45 73 167 72
CCC/lower 1 2 36 22 81 26
Total 121 540 1079 968 2317 598
Data sources: Merill Lynch, Markit, and NASD TRACE.
27
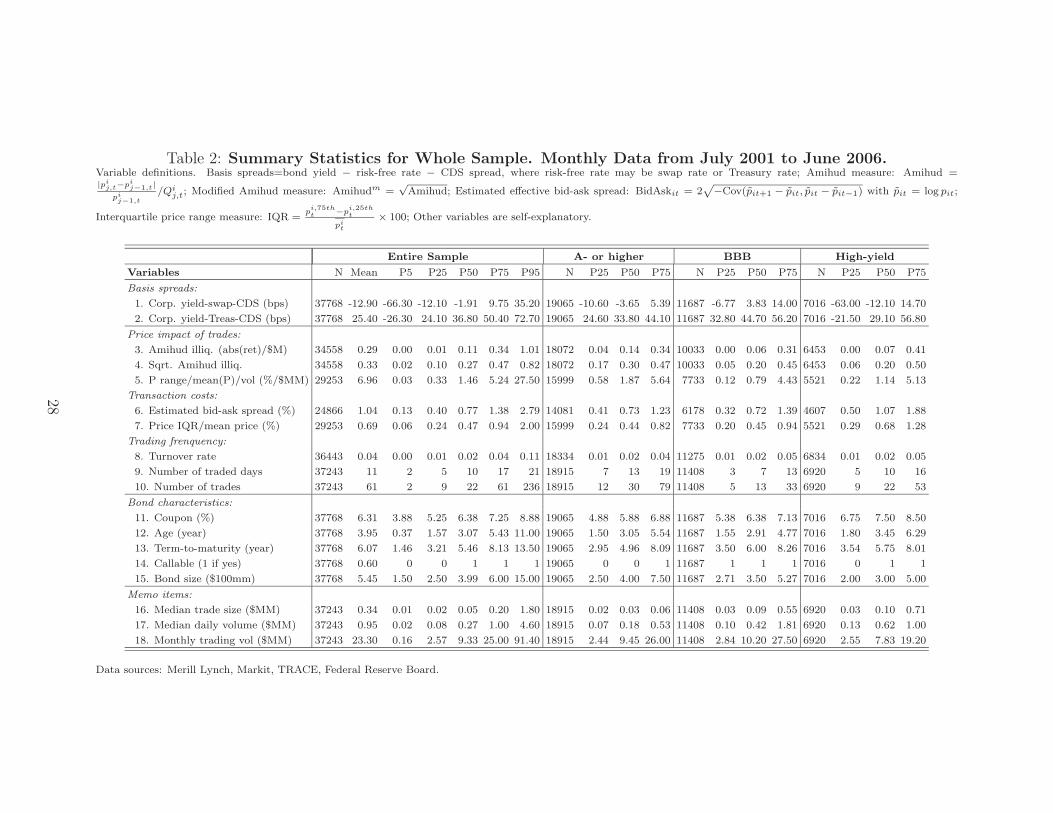
Table 2: Summary Statistics for Whole Sample. Monthly Data from July 2001 to June 2006.Variable definitions. Basis spreads=bond yield − risk-free rate − CDS spread, where risk-free rate may be swap rate or Treasury rate; Amihud measure: Amihud =|pi
j,t−pij−1,t|
pij−1,t
/Qij,t; Modified Amihud measure: Amihudm =
√Amihud; Estimated effective bid-ask spread: BidAskit = 2
p
−Cov(pit+1 − pit, pit − pit−1) with pit = log pit;
Interquartile price range measure: IQR =p
i,75tht −p
i,25tht
pit
× 100; Other variables are self-explanatory.
Entire Sample A- or higher BBB High-yield
Variables N Mean P5 P25 P50 P75 P95 N P25 P50 P75 N P25 P50 P75 N P25 P50 P75
Basis spreads:
1. Corp. yield-swap-CDS (bps) 37768 -12.90 -66.30 -12.10 -1.91 9.75 35.20 19065 -10.60 -3.65 5.39 11687 -6.77 3.83 14.00 7016 -63.00 -12.10 14.70
2. Corp. yield-Treas-CDS (bps) 37768 25.40 -26.30 24.10 36.80 50.40 72.70 19065 24.60 33.80 44.10 11687 32.80 44.70 56.20 7016 -21.50 29.10 56.80
Price impact of trades:
3. Amihud illiq. (abs(ret)/$M) 34558 0.29 0.00 0.01 0.11 0.34 1.01 18072 0.04 0.14 0.34 10033 0.00 0.06 0.31 6453 0.00 0.07 0.41
4. Sqrt. Amihud illiq. 34558 0.33 0.02 0.10 0.27 0.47 0.82 18072 0.17 0.30 0.47 10033 0.05 0.20 0.45 6453 0.06 0.20 0.50
5. P range/mean(P)/vol (%/$MM) 29253 6.96 0.03 0.33 1.46 5.24 27.50 15999 0.58 1.87 5.64 7733 0.12 0.79 4.43 5521 0.22 1.14 5.13
Transaction costs:
6. Estimated bid-ask spread (%) 24866 1.04 0.13 0.40 0.77 1.38 2.79 14081 0.41 0.73 1.23 6178 0.32 0.72 1.39 4607 0.50 1.07 1.88
7. Price IQR/mean price (%) 29253 0.69 0.06 0.24 0.47 0.94 2.00 15999 0.24 0.44 0.82 7733 0.20 0.45 0.94 5521 0.29 0.68 1.28
Trading frenquency:
8. Turnover rate 36443 0.04 0.00 0.01 0.02 0.04 0.11 18334 0.01 0.02 0.04 11275 0.01 0.02 0.05 6834 0.01 0.02 0.05
9. Number of traded days 37243 11 2 5 10 17 21 18915 7 13 19 11408 3 7 13 6920 5 10 16
10. Number of trades 37243 61 2 9 22 61 236 18915 12 30 79 11408 5 13 33 6920 9 22 53
Bond characteristics:
11. Coupon (%) 37768 6.31 3.88 5.25 6.38 7.25 8.88 19065 4.88 5.88 6.88 11687 5.38 6.38 7.13 7016 6.75 7.50 8.50
12. Age (year) 37768 3.95 0.37 1.57 3.07 5.43 11.00 19065 1.50 3.05 5.54 11687 1.55 2.91 4.77 7016 1.80 3.45 6.29
13. Term-to-maturity (year) 37768 6.07 1.46 3.21 5.46 8.13 13.50 19065 2.95 4.96 8.09 11687 3.50 6.00 8.26 7016 3.54 5.75 8.01
14. Callable (1 if yes) 37768 0.60 0 0 1 1 1 19065 0 0 1 11687 1 1 1 7016 0 1 1
15. Bond size ($100mm) 37768 5.45 1.50 2.50 3.99 6.00 15.00 19065 2.50 4.00 7.50 11687 2.71 3.50 5.27 7016 2.00 3.00 5.00
Memo items:
16. Median trade size ($MM) 37243 0.34 0.01 0.02 0.05 0.20 1.80 18915 0.02 0.03 0.06 11408 0.03 0.09 0.55 6920 0.03 0.10 0.71
17. Median daily volume ($MM) 37243 0.95 0.02 0.08 0.27 1.00 4.60 18915 0.07 0.18 0.53 11408 0.10 0.42 1.81 6920 0.13 0.62 1.00
18. Monthly trading vol ($MM) 37243 23.30 0.16 2.57 9.33 25.00 91.40 18915 2.44 9.45 26.00 11408 2.84 10.20 27.50 6920 2.55 7.83 19.20
Data sources: Merill Lynch, Markit, TRACE, Federal Reserve Board.
28
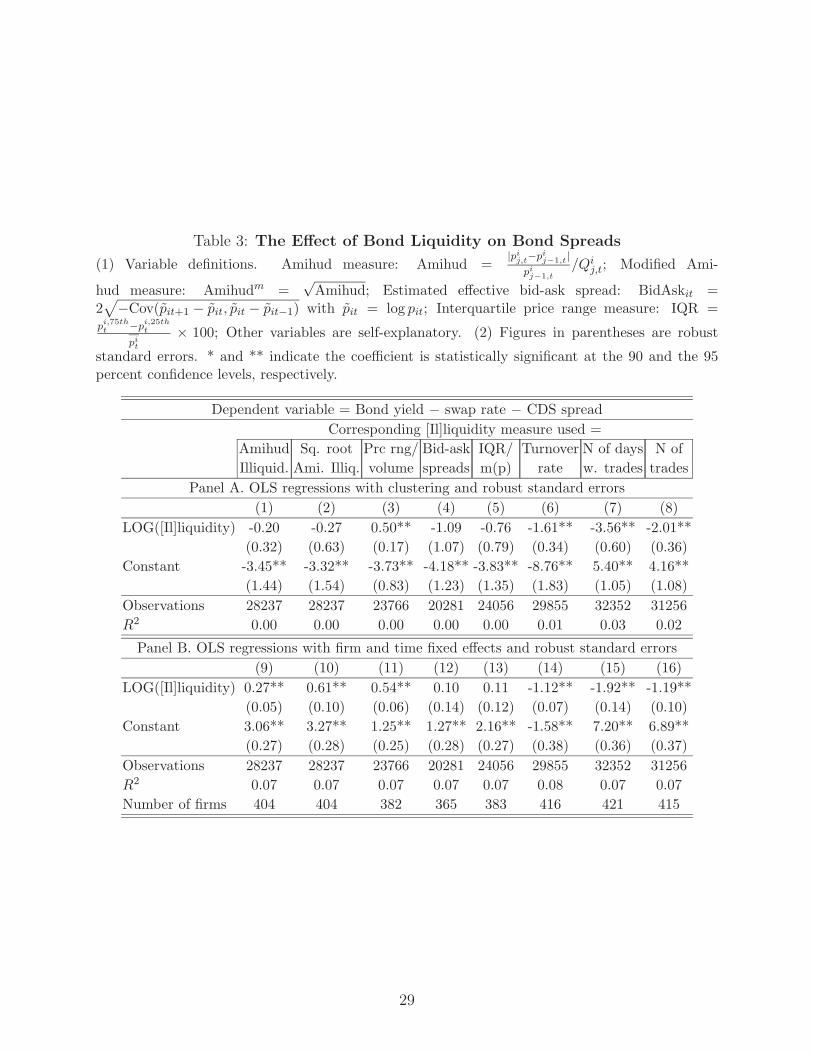
Table 3: The Effect of Bond Liquidity on Bond Spreads
(1) Variable definitions. Amihud measure: Amihud =|pi
j,t−pij−1,t|
pij−1,t
/Qij,t; Modified Ami-
hud measure: Amihudm =√
Amihud; Estimated effective bid-ask spread: BidAskit =2√
−Cov(pit+1 − pit, pit − pit−1) with pit = log pit; Interquartile price range measure: IQR =pi,75th
t −pi,25tht
pit
× 100; Other variables are self-explanatory. (2) Figures in parentheses are robust
standard errors. * and ** indicate the coefficient is statistically significant at the 90 and the 95percent confidence levels, respectively.
Dependent variable = Bond yield − swap rate − CDS spread
Corresponding [Il]liquidity measure used =
Amihud Sq. root Prc rng/ Bid-ask IQR/ Turnover N of days N of
Illiquid. Ami. Illiq. volume spreads m(p) rate w. trades trades
Panel A. OLS regressions with clustering and robust standard errors
(1) (2) (3) (4) (5) (6) (7) (8)
LOG([Il]liquidity) -0.20 -0.27 0.50** -1.09 -0.76 -1.61** -3.56** -2.01**
(0.32) (0.63) (0.17) (1.07) (0.79) (0.34) (0.60) (0.36)
Constant -3.45** -3.32** -3.73** -4.18** -3.83** -8.76** 5.40** 4.16**
(1.44) (1.54) (0.83) (1.23) (1.35) (1.83) (1.05) (1.08)
Observations 28237 28237 23766 20281 24056 29855 32352 31256
R2 0.00 0.00 0.00 0.00 0.00 0.01 0.03 0.02
Panel B. OLS regressions with firm and time fixed effects and robust standard errors
(9) (10) (11) (12) (13) (14) (15) (16)
LOG([Il]liquidity) 0.27** 0.61** 0.54** 0.10 0.11 -1.12** -1.92** -1.19**
(0.05) (0.10) (0.06) (0.14) (0.12) (0.07) (0.14) (0.10)
Constant 3.06** 3.27** 1.25** 1.27** 2.16** -1.58** 7.20** 6.89**
(0.27) (0.28) (0.25) (0.28) (0.27) (0.38) (0.36) (0.37)
Observations 28237 28237 23766 20281 24056 29855 32352 31256
R2 0.07 0.07 0.07 0.07 0.07 0.08 0.07 0.07
Number of firms 404 404 382 365 383 416 421 415
29
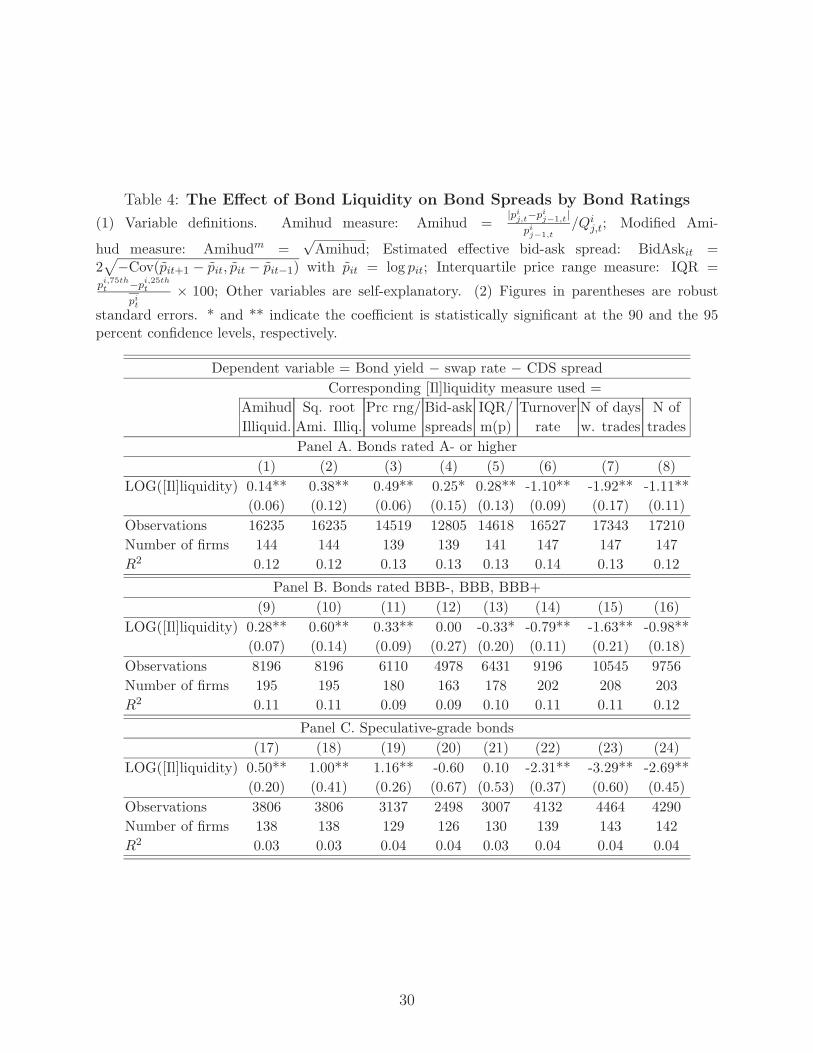
Table 4: The Effect of Bond Liquidity on Bond Spreads by Bond Ratings
(1) Variable definitions. Amihud measure: Amihud =|pi
j,t−pij−1,t|
pij−1,t
/Qij,t; Modified Ami-
hud measure: Amihudm =√
Amihud; Estimated effective bid-ask spread: BidAskit =2√
−Cov(pit+1 − pit, pit − pit−1) with pit = log pit; Interquartile price range measure: IQR =pi,75th
t −pi,25tht
pit
× 100; Other variables are self-explanatory. (2) Figures in parentheses are robust
standard errors. * and ** indicate the coefficient is statistically significant at the 90 and the 95percent confidence levels, respectively.
Dependent variable = Bond yield − swap rate − CDS spread
Corresponding [Il]liquidity measure used =
Amihud Sq. root Prc rng/ Bid-ask IQR/ Turnover N of days N of
Illiquid. Ami. Illiq. volume spreads m(p) rate w. trades trades
Panel A. Bonds rated A- or higher
(1) (2) (3) (4) (5) (6) (7) (8)
LOG([Il]liquidity) 0.14** 0.38** 0.49** 0.25* 0.28** -1.10** -1.92** -1.11**
(0.06) (0.12) (0.06) (0.15) (0.13) (0.09) (0.17) (0.11)
Observations 16235 16235 14519 12805 14618 16527 17343 17210
Number of firms 144 144 139 139 141 147 147 147
R2 0.12 0.12 0.13 0.13 0.13 0.14 0.13 0.12
Panel B. Bonds rated BBB-, BBB, BBB+
(9) (10) (11) (12) (13) (14) (15) (16)
LOG([Il]liquidity) 0.28** 0.60** 0.33** 0.00 -0.33* -0.79** -1.63** -0.98**
(0.07) (0.14) (0.09) (0.27) (0.20) (0.11) (0.21) (0.18)
Observations 8196 8196 6110 4978 6431 9196 10545 9756
Number of firms 195 195 180 163 178 202 208 203
R2 0.11 0.11 0.09 0.09 0.10 0.11 0.11 0.12
Panel C. Speculative-grade bonds
(17) (18) (19) (20) (21) (22) (23) (24)
LOG([Il]liquidity) 0.50** 1.00** 1.16** -0.60 0.10 -2.31** -3.29** -2.69**
(0.20) (0.41) (0.26) (0.67) (0.53) (0.37) (0.60) (0.45)
Observations 3806 3806 3137 2498 3007 4132 4464 4290
Number of firms 138 138 129 126 130 139 143 142
R2 0.03 0.03 0.04 0.04 0.03 0.04 0.04 0.04
30
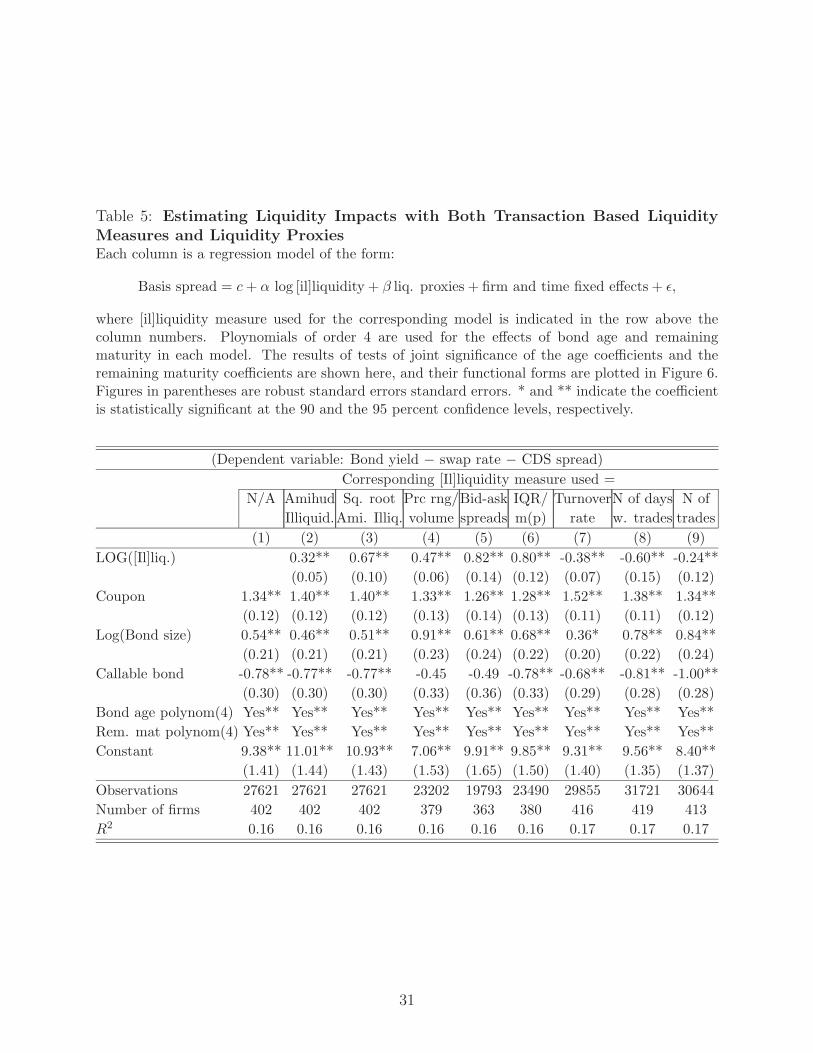
Table 5: Estimating Liquidity Impacts with Both Transaction Based Liquidity
Measures and Liquidity Proxies
Each column is a regression model of the form:
Basis spread = c + α log [il]liquidity + β liq. proxies + firm and time fixed effects + ǫ,
where [il]liquidity measure used for the corresponding model is indicated in the row above thecolumn numbers. Ploynomials of order 4 are used for the effects of bond age and remainingmaturity in each model. The results of tests of joint significance of the age coefficients and theremaining maturity coefficients are shown here, and their functional forms are plotted in Figure 6.Figures in parentheses are robust standard errors standard errors. * and ** indicate the coefficientis statistically significant at the 90 and the 95 percent confidence levels, respectively.
(Dependent variable: Bond yield − swap rate − CDS spread)
Corresponding [Il]liquidity measure used =
N/A Amihud Sq. root Prc rng/Bid-ask IQR/ TurnoverN of days N of
Illiquid.Ami. Illiq. volume spreads m(p) rate w. trades trades
(1) (2) (3) (4) (5) (6) (7) (8) (9)
LOG([Il]liq.) 0.32** 0.67** 0.47** 0.82** 0.80** -0.38** -0.60** -0.24**
(0.05) (0.10) (0.06) (0.14) (0.12) (0.07) (0.15) (0.12)
Coupon 1.34** 1.40** 1.40** 1.33** 1.26** 1.28** 1.52** 1.38** 1.34**
(0.12) (0.12) (0.12) (0.13) (0.14) (0.13) (0.11) (0.11) (0.12)
Log(Bond size) 0.54** 0.46** 0.51** 0.91** 0.61** 0.68** 0.36* 0.78** 0.84**
(0.21) (0.21) (0.21) (0.23) (0.24) (0.22) (0.20) (0.22) (0.24)
Callable bond -0.78** -0.77** -0.77** -0.45 -0.49 -0.78** -0.68** -0.81** -1.00**
(0.30) (0.30) (0.30) (0.33) (0.36) (0.33) (0.29) (0.28) (0.28)
Bond age polynom(4) Yes** Yes** Yes** Yes** Yes** Yes** Yes** Yes** Yes**
Rem. mat polynom(4) Yes** Yes** Yes** Yes** Yes** Yes** Yes** Yes** Yes**
Constant 9.38** 11.01** 10.93** 7.06** 9.91** 9.85** 9.31** 9.56** 8.40**
(1.41) (1.44) (1.43) (1.53) (1.65) (1.50) (1.40) (1.35) (1.37)
Observations 27621 27621 27621 23202 19793 23490 29855 31721 30644
Number of firms 402 402 402 379 363 380 416 419 413
R2 0.16 0.16 0.16 0.16 0.16 0.16 0.17 0.17 0.17
31
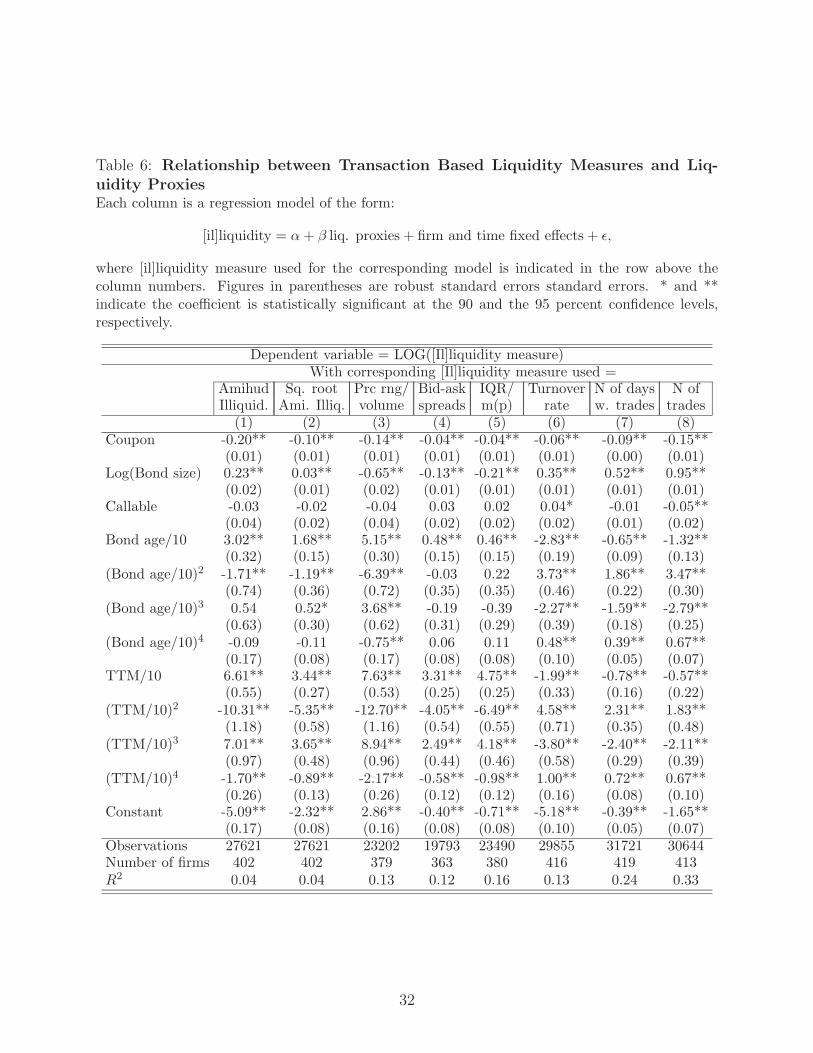
Table 6: Relationship between Transaction Based Liquidity Measures and Liq-
uidity Proxies
Each column is a regression model of the form:
[il]liquidity = α + β liq. proxies + firm and time fixed effects + ǫ,
where [il]liquidity measure used for the corresponding model is indicated in the row above thecolumn numbers. Figures in parentheses are robust standard errors standard errors. * and **indicate the coefficient is statistically significant at the 90 and the 95 percent confidence levels,respectively.
Dependent variable = LOG([Il]liquidity measure)With corresponding [Il]liquidity measure used =
Amihud Sq. root Prc rng/ Bid-ask IQR/ Turnover N of days N ofIlliquid. Ami. Illiq. volume spreads m(p) rate w. trades trades
(1) (2) (3) (4) (5) (6) (7) (8)Coupon -0.20** -0.10** -0.14** -0.04** -0.04** -0.06** -0.09** -0.15**
(0.01) (0.01) (0.01) (0.01) (0.01) (0.01) (0.00) (0.01)Log(Bond size) 0.23** 0.03** -0.65** -0.13** -0.21** 0.35** 0.52** 0.95**
(0.02) (0.01) (0.02) (0.01) (0.01) (0.01) (0.01) (0.01)Callable -0.03 -0.02 -0.04 0.03 0.02 0.04* -0.01 -0.05**
(0.04) (0.02) (0.04) (0.02) (0.02) (0.02) (0.01) (0.02)Bond age/10 3.02** 1.68** 5.15** 0.48** 0.46** -2.83** -0.65** -1.32**
(0.32) (0.15) (0.30) (0.15) (0.15) (0.19) (0.09) (0.13)(Bond age/10)2 -1.71** -1.19** -6.39** -0.03 0.22 3.73** 1.86** 3.47**
(0.74) (0.36) (0.72) (0.35) (0.35) (0.46) (0.22) (0.30)(Bond age/10)3 0.54 0.52* 3.68** -0.19 -0.39 -2.27** -1.59** -2.79**
(0.63) (0.30) (0.62) (0.31) (0.29) (0.39) (0.18) (0.25)(Bond age/10)4 -0.09 -0.11 -0.75** 0.06 0.11 0.48** 0.39** 0.67**
(0.17) (0.08) (0.17) (0.08) (0.08) (0.10) (0.05) (0.07)TTM/10 6.61** 3.44** 7.63** 3.31** 4.75** -1.99** -0.78** -0.57**
(0.55) (0.27) (0.53) (0.25) (0.25) (0.33) (0.16) (0.22)(TTM/10)2 -10.31** -5.35** -12.70** -4.05** -6.49** 4.58** 2.31** 1.83**
(1.18) (0.58) (1.16) (0.54) (0.55) (0.71) (0.35) (0.48)(TTM/10)3 7.01** 3.65** 8.94** 2.49** 4.18** -3.80** -2.40** -2.11**
(0.97) (0.48) (0.96) (0.44) (0.46) (0.58) (0.29) (0.39)(TTM/10)4 -1.70** -0.89** -2.17** -0.58** -0.98** 1.00** 0.72** 0.67**
(0.26) (0.13) (0.26) (0.12) (0.12) (0.16) (0.08) (0.10)Constant -5.09** -2.32** 2.86** -0.40** -0.71** -5.18** -0.39** -1.65**
(0.17) (0.08) (0.16) (0.08) (0.08) (0.10) (0.05) (0.07)Observations 27621 27621 23202 19793 23490 29855 31721 30644Number of firms 402 402 379 363 380 416 419 413R2 0.04 0.04 0.13 0.12 0.16 0.13 0.24 0.33
32
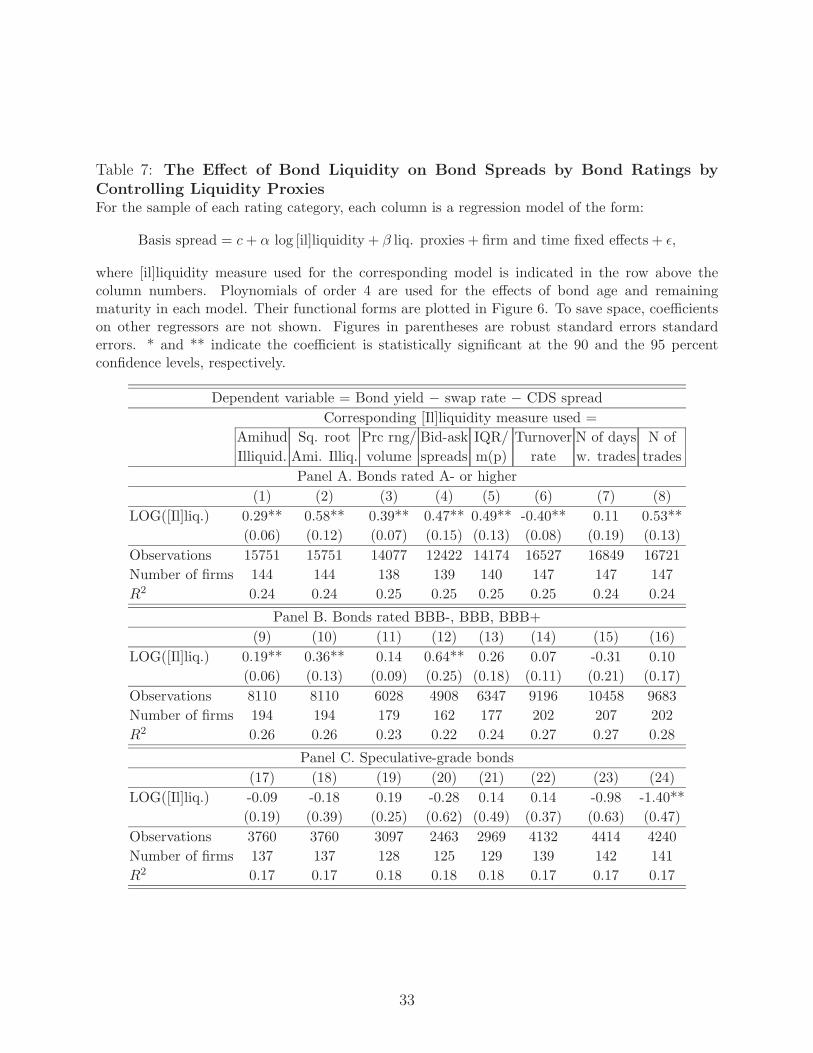
Table 7: The Effect of Bond Liquidity on Bond Spreads by Bond Ratings by
Controlling Liquidity Proxies
For the sample of each rating category, each column is a regression model of the form:
Basis spread = c + α log [il]liquidity + β liq. proxies + firm and time fixed effects + ǫ,
where [il]liquidity measure used for the corresponding model is indicated in the row above thecolumn numbers. Ploynomials of order 4 are used for the effects of bond age and remainingmaturity in each model. Their functional forms are plotted in Figure 6. To save space, coefficientson other regressors are not shown. Figures in parentheses are robust standard errors standarderrors. * and ** indicate the coefficient is statistically significant at the 90 and the 95 percentconfidence levels, respectively.
Dependent variable = Bond yield − swap rate − CDS spread
Corresponding [Il]liquidity measure used =
Amihud Sq. root Prc rng/ Bid-ask IQR/ Turnover N of days N of
Illiquid. Ami. Illiq. volume spreads m(p) rate w. trades trades
Panel A. Bonds rated A- or higher
(1) (2) (3) (4) (5) (6) (7) (8)
LOG([Il]liq.) 0.29** 0.58** 0.39** 0.47** 0.49** -0.40** 0.11 0.53**
(0.06) (0.12) (0.07) (0.15) (0.13) (0.08) (0.19) (0.13)
Observations 15751 15751 14077 12422 14174 16527 16849 16721
Number of firms 144 144 138 139 140 147 147 147
R2 0.24 0.24 0.25 0.25 0.25 0.25 0.24 0.24
Panel B. Bonds rated BBB-, BBB, BBB+
(9) (10) (11) (12) (13) (14) (15) (16)
LOG([Il]liq.) 0.19** 0.36** 0.14 0.64** 0.26 0.07 -0.31 0.10
(0.06) (0.13) (0.09) (0.25) (0.18) (0.11) (0.21) (0.17)
Observations 8110 8110 6028 4908 6347 9196 10458 9683
Number of firms 194 194 179 162 177 202 207 202
R2 0.26 0.26 0.23 0.22 0.24 0.27 0.27 0.28
Panel C. Speculative-grade bonds
(17) (18) (19) (20) (21) (22) (23) (24)
LOG([Il]liq.) -0.09 -0.18 0.19 -0.28 0.14 0.14 -0.98 -1.40**
(0.19) (0.39) (0.25) (0.62) (0.49) (0.37) (0.63) (0.47)
Observations 3760 3760 3097 2463 2969 4132 4414 4240
Number of firms 137 137 128 125 129 139 142 141
R2 0.17 0.17 0.18 0.18 0.18 0.17 0.17 0.17
33
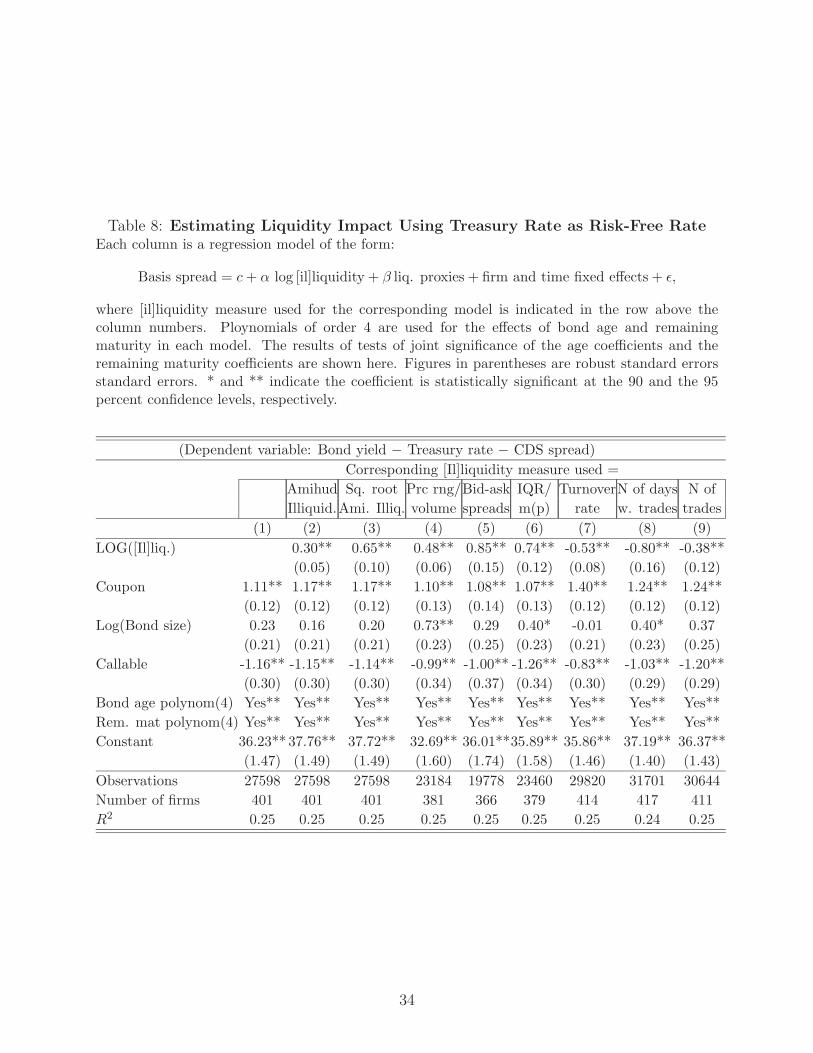
Table 8: Estimating Liquidity Impact Using Treasury Rate as Risk-Free Rate
Each column is a regression model of the form:
Basis spread = c + α log [il]liquidity + β liq. proxies + firm and time fixed effects + ǫ,
where [il]liquidity measure used for the corresponding model is indicated in the row above thecolumn numbers. Ploynomials of order 4 are used for the effects of bond age and remainingmaturity in each model. The results of tests of joint significance of the age coefficients and theremaining maturity coefficients are shown here. Figures in parentheses are robust standard errorsstandard errors. * and ** indicate the coefficient is statistically significant at the 90 and the 95percent confidence levels, respectively.
(Dependent variable: Bond yield − Treasury rate − CDS spread)
Corresponding [Il]liquidity measure used =
Amihud Sq. root Prc rng/Bid-ask IQR/ TurnoverN of days N of
Illiquid.Ami. Illiq. volume spreads m(p) rate w. trades trades
(1) (2) (3) (4) (5) (6) (7) (8) (9)
LOG([Il]liq.) 0.30** 0.65** 0.48** 0.85** 0.74** -0.53** -0.80** -0.38**
(0.05) (0.10) (0.06) (0.15) (0.12) (0.08) (0.16) (0.12)
Coupon 1.11** 1.17** 1.17** 1.10** 1.08** 1.07** 1.40** 1.24** 1.24**
(0.12) (0.12) (0.12) (0.13) (0.14) (0.13) (0.12) (0.12) (0.12)
Log(Bond size) 0.23 0.16 0.20 0.73** 0.29 0.40* -0.01 0.40* 0.37
(0.21) (0.21) (0.21) (0.23) (0.25) (0.23) (0.21) (0.23) (0.25)
Callable -1.16** -1.15** -1.14** -0.99** -1.00** -1.26** -0.83** -1.03** -1.20**
(0.30) (0.30) (0.30) (0.34) (0.37) (0.34) (0.30) (0.29) (0.29)
Bond age polynom(4) Yes** Yes** Yes** Yes** Yes** Yes** Yes** Yes** Yes**
Rem. mat polynom(4) Yes** Yes** Yes** Yes** Yes** Yes** Yes** Yes** Yes**
Constant 36.23**37.76** 37.72** 32.69** 36.01**35.89** 35.86** 37.19** 36.37**
(1.47) (1.49) (1.49) (1.60) (1.74) (1.58) (1.46) (1.40) (1.43)
Observations 27598 27598 27598 23184 19778 23460 29820 31701 30644
Number of firms 401 401 401 381 366 379 414 417 411
R2 0.25 0.25 0.25 0.25 0.25 0.25 0.25 0.24 0.25
34
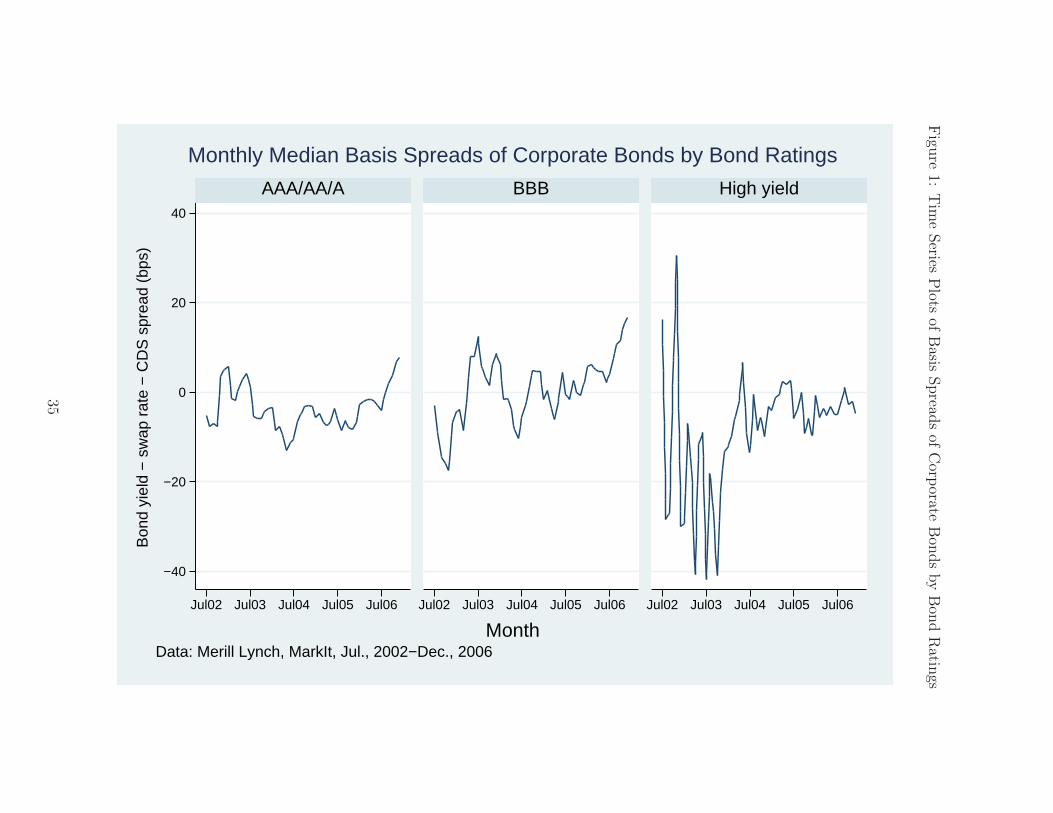
Figu
re1:
Tim
eSeries
Plots
ofB
asisSpread
sof
Corp
orateB
onds
by
Bon
dR
atings
−40
−20
0
20
40
Jul02 Jul03 Jul04 Jul05 Jul06 Jul02 Jul03 Jul04 Jul05 Jul06 Jul02 Jul03 Jul04 Jul05 Jul06
AAA/AA/A BBB High yield
Bon
d yi
eld
− s
wap
rat
e −
CD
S s
prea
d (b
ps)
MonthData: Merill Lynch, MarkIt, Jul., 2002−Dec., 2006
Monthly Median Basis Spreads of Corporate Bonds by Bond Ratings
35
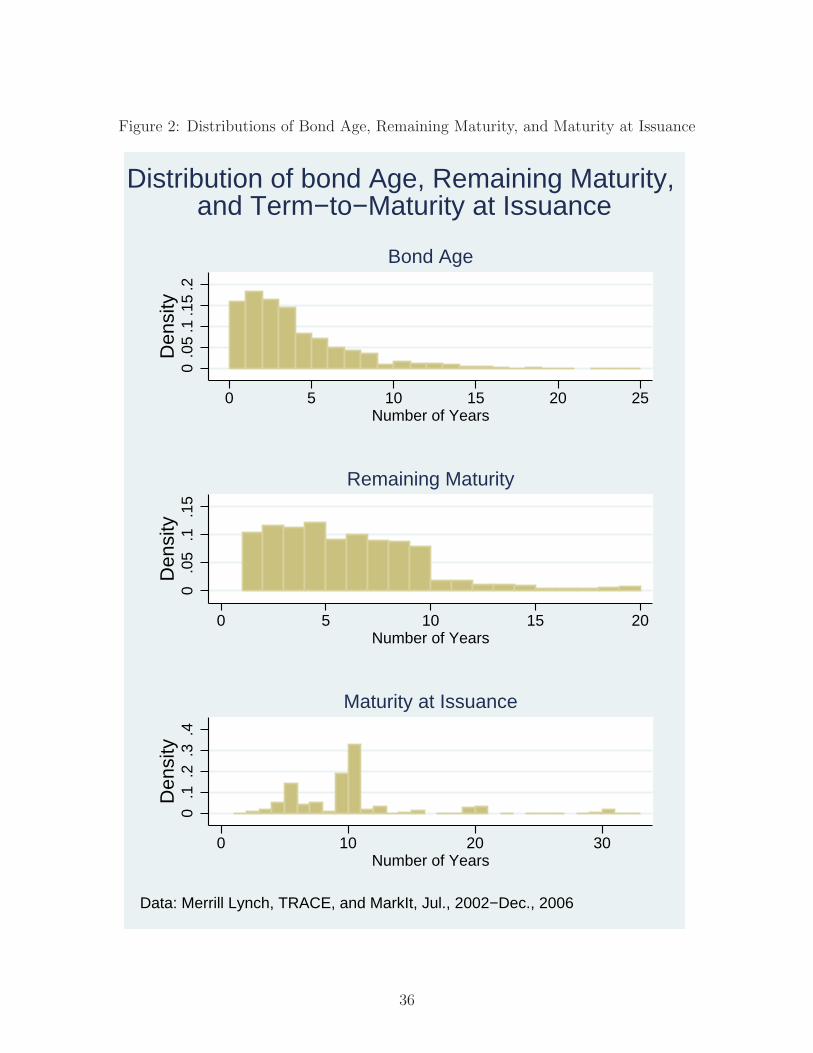
Figure 2: Distributions of Bond Age, Remaining Maturity, and Maturity at Issuance
0.0
5.1
.15
.2D
ensi
ty
0 5 10 15 20 25Number of Years
Bond Age
0.0
5.1
.15
Den
sity
0 5 10 15 20Number of Years
Remaining Maturity
0.1
.2.3
.4D
ensi
ty
0 10 20 30Number of Years
Maturity at Issuance
Data: Merrill Lynch, TRACE, and MarkIt, Jul., 2002−Dec., 2006
Distribution of bond Age, Remaining Maturity, and Term−to−Maturity at Issuance
36
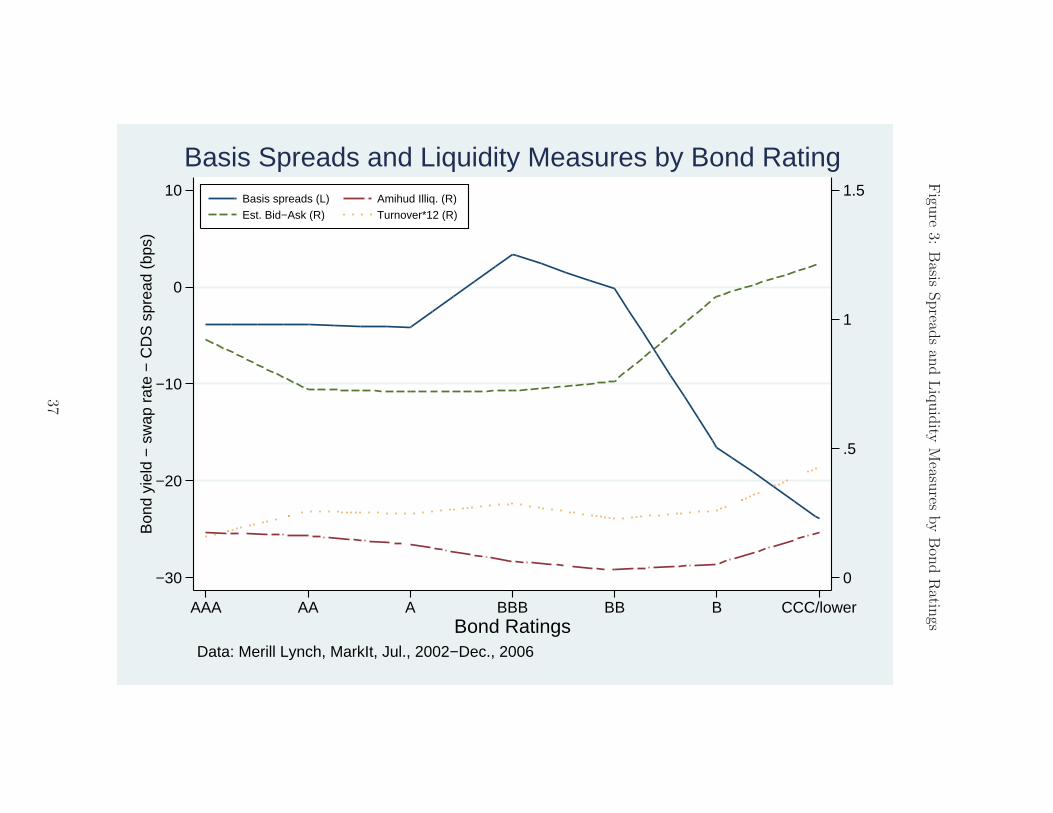
Figu
re3:
Basis
Spread
san
dLiq
uid
ityM
easures
by
Bon
dR
atings
0
.5
1
1.5
−30
−20
−10
0
10
Bon
d yi
eld
− s
wap
rat
e −
CD
S s
prea
d (b
ps)
AAA AA A BBB BB B CCC/lowerBond Ratings
Basis spreads (L) Amihud Illiq. (R)
Est. Bid−Ask (R) Turnover*12 (R)
Data: Merill Lynch, MarkIt, Jul., 2002−Dec., 2006
Basis Spreads and Liquidity Measures by Bond Rating
37
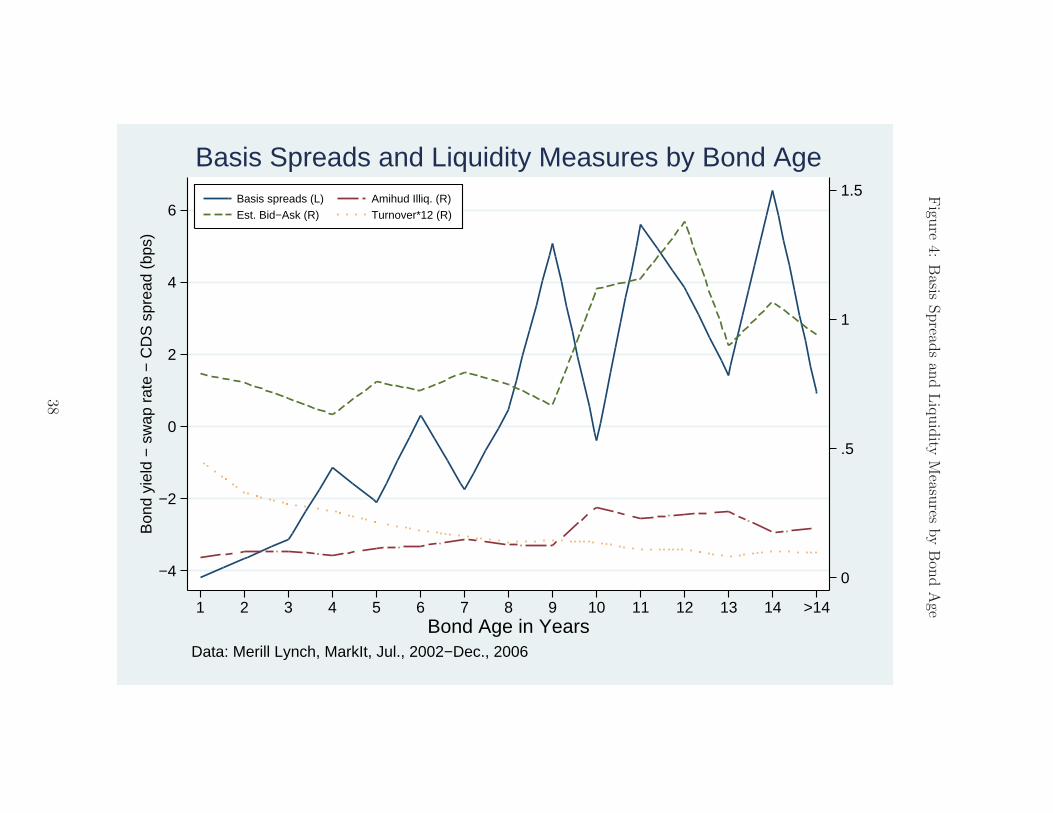
Figu
re4:
Basis
Spread
san
dLiq
uid
ityM
easures
by
Bon
dA
ge
0
.5
1
1.5
−4
−2
0
2
4
6
Bon
d yi
eld
− s
wap
rat
e −
CD
S s
prea
d (b
ps)
1 2 3 4 5 6 7 8 9 10 11 12 13 14 >14Bond Age in Years
Basis spreads (L) Amihud Illiq. (R)
Est. Bid−Ask (R) Turnover*12 (R)
Data: Merill Lynch, MarkIt, Jul., 2002−Dec., 2006
Basis Spreads and Liquidity Measures by Bond Age
38
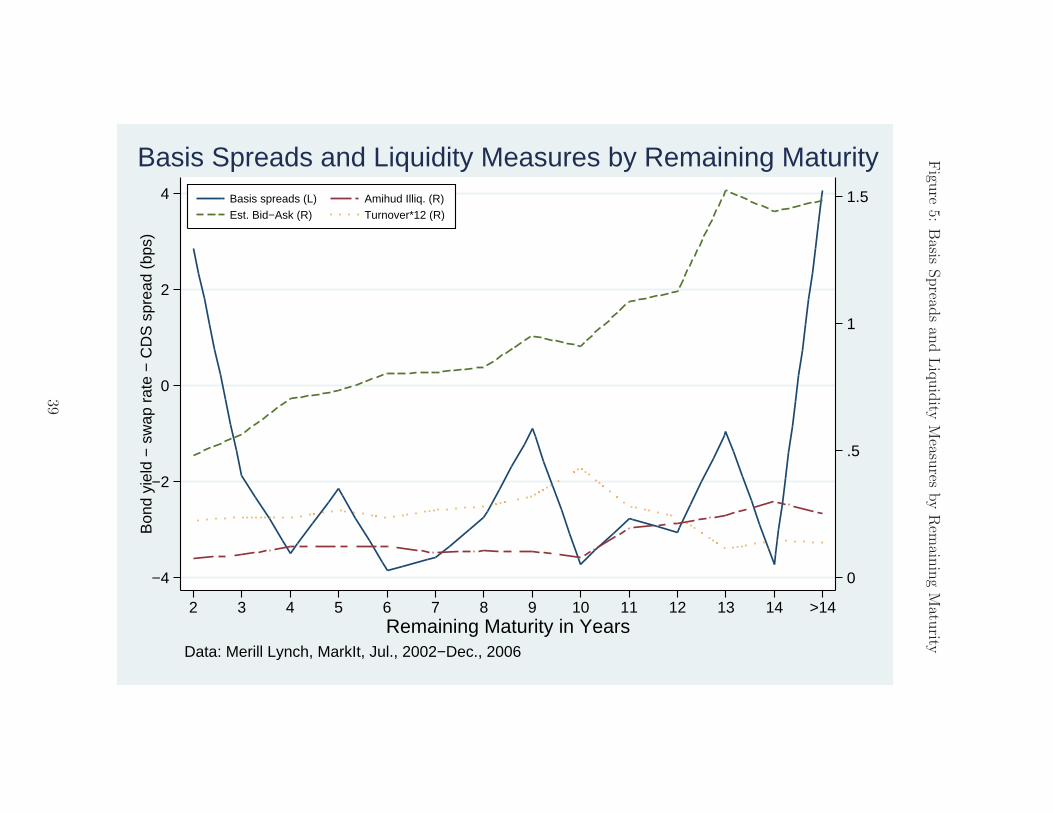
Figu
re5:
Basis
Spread
san
dLiq
uid
ityM
easures
by
Rem
ainin
gM
aturity
0
.5
1
1.5
−4
−2
0
2
4
Bon
d yi
eld
− s
wap
rat
e −
CD
S s
prea
d (b
ps)
2 3 4 5 6 7 8 9 10 11 12 13 14 >14Remaining Maturity in Years
Basis spreads (L) Amihud Illiq. (R)
Est. Bid−Ask (R) Turnover*12 (R)
Data: Merill Lynch, MarkIt, Jul., 2002−Dec., 2006
Basis Spreads and Liquidity Measures by Remaining Maturity
39
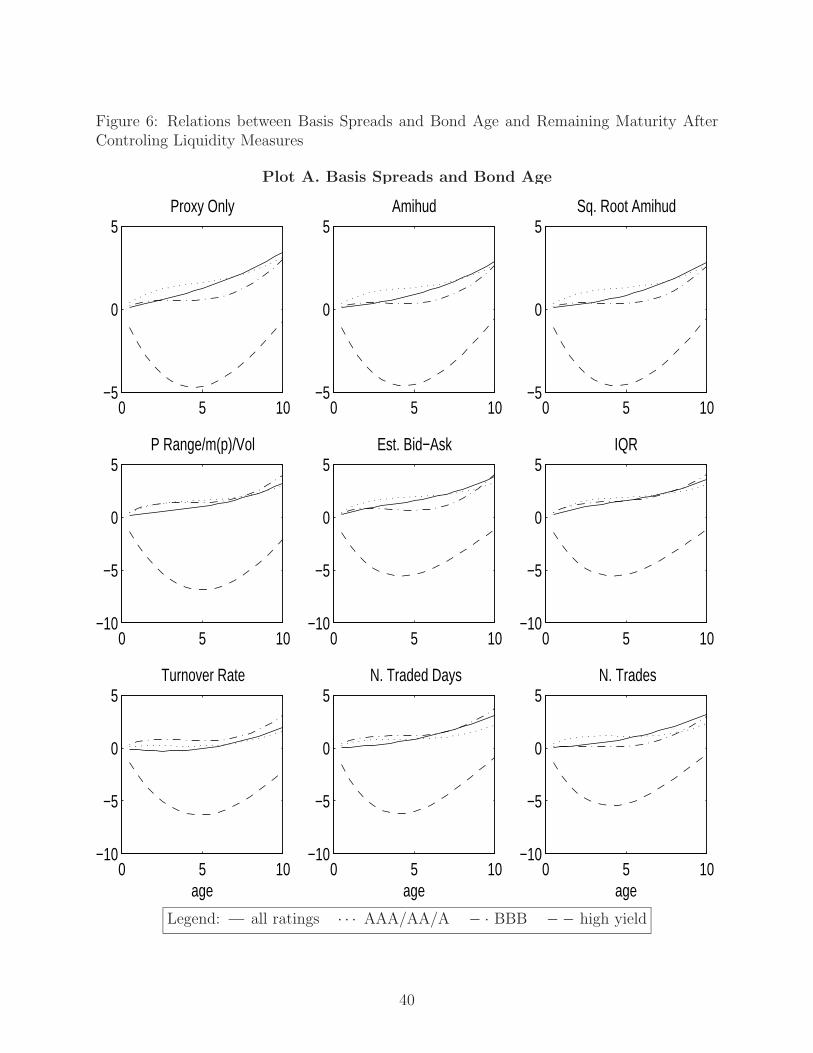
Figure 6: Relations between Basis Spreads and Bond Age and Remaining Maturity AfterControling Liquidity Measures
Plot A. Basis Spreads and Bond Age
0 5 10−5
0
5Proxy Only
0 5 10−5
0
5Amihud
0 5 10−5
0
5Sq. Root Amihud
0 5 10−10
−5
0
5P Range/m(p)/Vol
0 5 10−10
−5
0
5Est. Bid−Ask
0 5 10−10
−5
0
5IQR
0 5 10−10
−5
0
5Turnover Rate
age0 5 10
−10
−5
0
5N. Traded Days
age0 5 10
−10
−5
0
5N. Trades
age
Legend: all ratings · · · AAA/AA/A − · BBB −− high yield
40
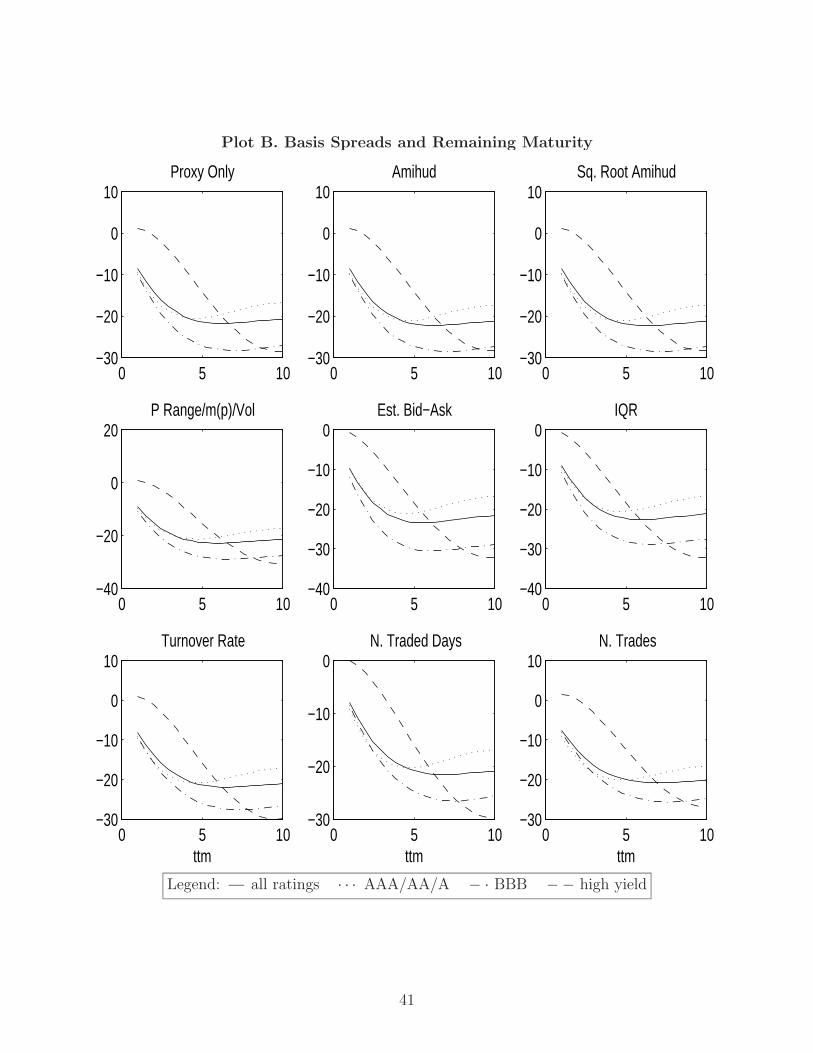
Plot B. Basis Spreads and Remaining Maturity
0 5 10−30
−20
−10
0
10Proxy Only
0 5 10−30
−20
−10
0
10Amihud
0 5 10−30
−20
−10
0
10Sq. Root Amihud
0 5 10−40
−20
0
20P Range/m(p)/Vol
0 5 10−40
−30
−20
−10
0Est. Bid−Ask
0 5 10−40
−30
−20
−10
0IQR
0 5 10−30
−20
−10
0
10Turnover Rate
ttm0 5 10
−30
−20
−10
0N. Traded Days
ttm0 5 10
−30
−20
−10
0
10N. Trades
ttm
Legend: all ratings · · · AAA/AA/A − · BBB −− high yield
41