Embed Size (px)
Citation preview
Waste Management 29 (2009) 404–417
Contents lists available at ScienceDirect
Waste Management
journal homepage: www.elsevier .com/locate /wasman
Non-reactive solute diffusion in unconfined and confined specimensof a compacted soil
Catherine S. Hong a, Melanie M. Davis b,1, Charles D. Shackelford a,*
a Department of Civil and Environmental Engineering, 1372 Campus Delivery, Colorado State University, Fort Collins, CO 80523-1372, USAb Tetra Tech Inc., 3801 Automation Way, Suite 100, Fort Collins, CO 80524, USA
a r t i c l e i n f o
Article history:Accepted 21 April 2008Available online 16 June 2008
0956-053X/$ - see front matter � 2008 Elsevier Ltd.doi:10.1016/j.wasman.2008.04.003
* Corresponding author. Tel.: +1 970 491 50511; faE-mail addresses: [email protected]
colostate.edu (C.D. Shackelford).1 Tel.: +1 970 223 9600; fax: +1 970 223 7171.
a b s t r a c t
The effect of specimen confinement on the determination of the effective diffusion coefficients, D*, forchloride, a non-reactive (non-adsorbing) solute, diffusing in a compacted soil was evaluated. The diffu-sion tests were performed by placing an acetic acid/sodium acetate buffer solution containing ZnCl2
(pH � 4.8) in a reservoir in contact with unconfined and confined specimens of a compacted sand–claymixture for test durations of 7 or 14 d. The concentrations of chloride in the reservoir were measuredas a function of time during the test, as well as a function of depth within the specimen at the end ofthe test. The resulting concentration distributions were analyzed using two models to Fick’s secondlaw for non-reactive solute diffusion in porous media, viz., (1) an analytical model assuming the porositydistribution could be represented by a single, weighted mean porosity and (2) a commercially availablemodel, POLLUTE, that directly accounted for the measured porosity distribution. The D* for unconfinedspecimens based on the analytical model tended to be overestimated by a factor ranging from 1.13 to1.59 relative to the D* using POLLUTE, whereas the D* values based on both methods for confined spec-imens typically were more consistent. In addition, the D* for unconfined specimens was greater than theD* for confined specimens when soil concentrations were used for the analysis, presumably due to thehigher porosity for the unconfined specimens relative to the confined specimens. Analyses based on res-ervoir concentrations were inconsistent and contradictory in some cases, suggesting that the D* valuesbased on soil concentrations were more reliable.
� 2008 Elsevier Ltd. All rights reserved.
1. Introduction
Diffusion has been shown to be a significant, if not dominant,contaminant transport process in engineered waste containmentbarriers, including compacted clay liners (Goodall and Quigley,1977; Crooks and Quigley, 1984; Shackelford, 1988, 1989, 1990;Toupiol et al., 2002; Willingham et al., 2004), subaqueous cappinglayers (Wang et al., 1991; Thoma et al., 1993), geosynthetic clayliners (Lake and Rowe, 2000a; Malusis and Shackelford, 2002,2004), composite liners (Foose, 2002; Edil, 2003), and soil–benton-ite vertical cutoff walls (Mott and Weber, 1991a,b; Devlin and Par-ker, 1996; Rabideau and Khandelwahl, 1998). As a result,considerable effort has been devoted to the evaluation of a varietyof different methods to measure the effective diffusion coefficient,D*, of solutes diffusing in soils (e.g., Rowe et al., 1985, 1988; Che-ung, 1989; Shackelford, 1991; Van Rees et al., 1991; Grathwohl,1998; Rowe et al., 2000). In particular, the single reservoir, decreas-
All rights reserved.
x: +1 970 491 7727.(M.M. Davis), shackel@engr.
ing source concentration (SRDSC) method, which consists of plac-ing a reservoir of a chemical solution over a column of soil sothat solutes will diffuse from the reservoir into the soil, has beenused extensively, especially with respect to compacted clay soilsconsidered for use as liners in waste containment applications,such as landfills (e.g., Barone et al., 1989; Shackelford, 1989,1991; Shackelford and Daniel, 1991a,b; Manassero and Pasqualini,1993; Verga and Manassero, 1994; Airey and Carter, 1995; Manas-sero et al., 1995, 1996, 1997; Shackelford et al., 1997b; Cottenet al., 1998).
For compacted clay soils, the test specimens in the SRDSC meth-od typically are pre-saturated after compaction and before diffu-sion to destroy the suction in the test specimen and minimizethe potential for advective mass transport of the solute from thereservoir into the soil. In such cases, unconfined test specimenstypically swell at the reservoir–soil interface resulting in a non-uniform porosity distribution, with significantly higher porositiesat the soil–reservoir interface (e.g., Shackelford et al., 1989; Shac-kelford and Daniel, 1991b; Manassero et al., 1996, 1997; Cottenet al., 1998). Because D* has been shown to correlate with theporosity (n) of the soil (or the volumetric moisture content, h, forunsaturated soils) through the tortuosity of the soil (e.g., Manheim,1970; Lerman, 1978, 1979; Myrand et al., 1992; Parker et al., 1994;
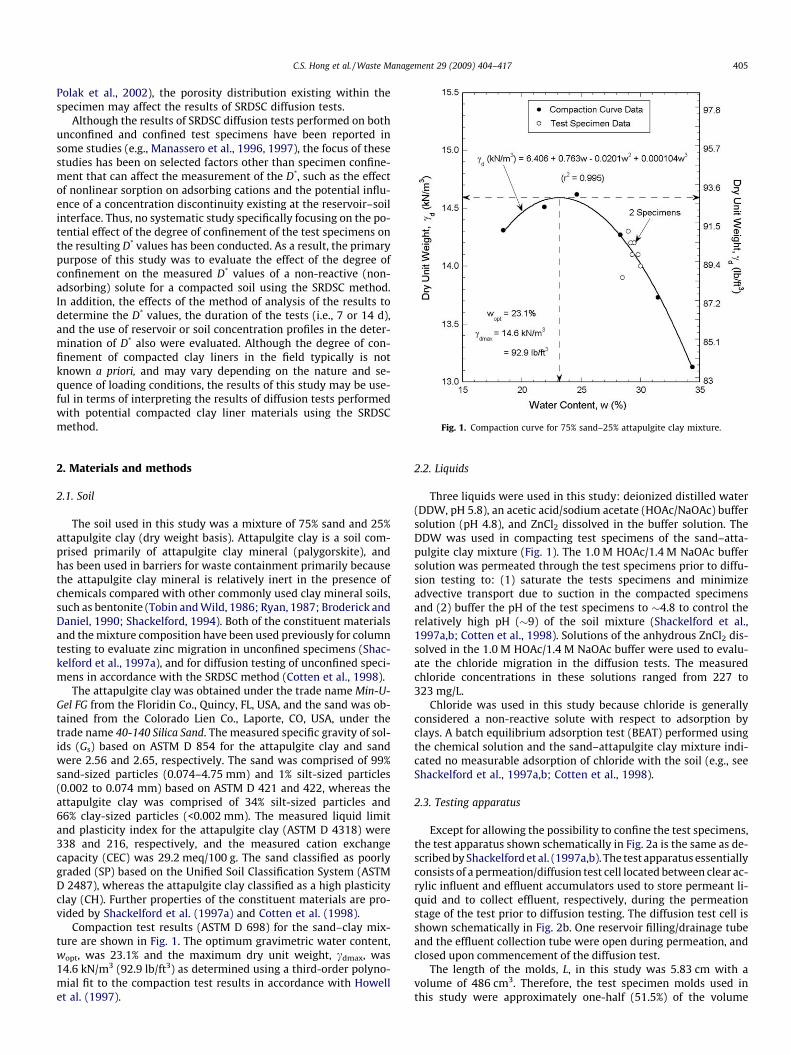
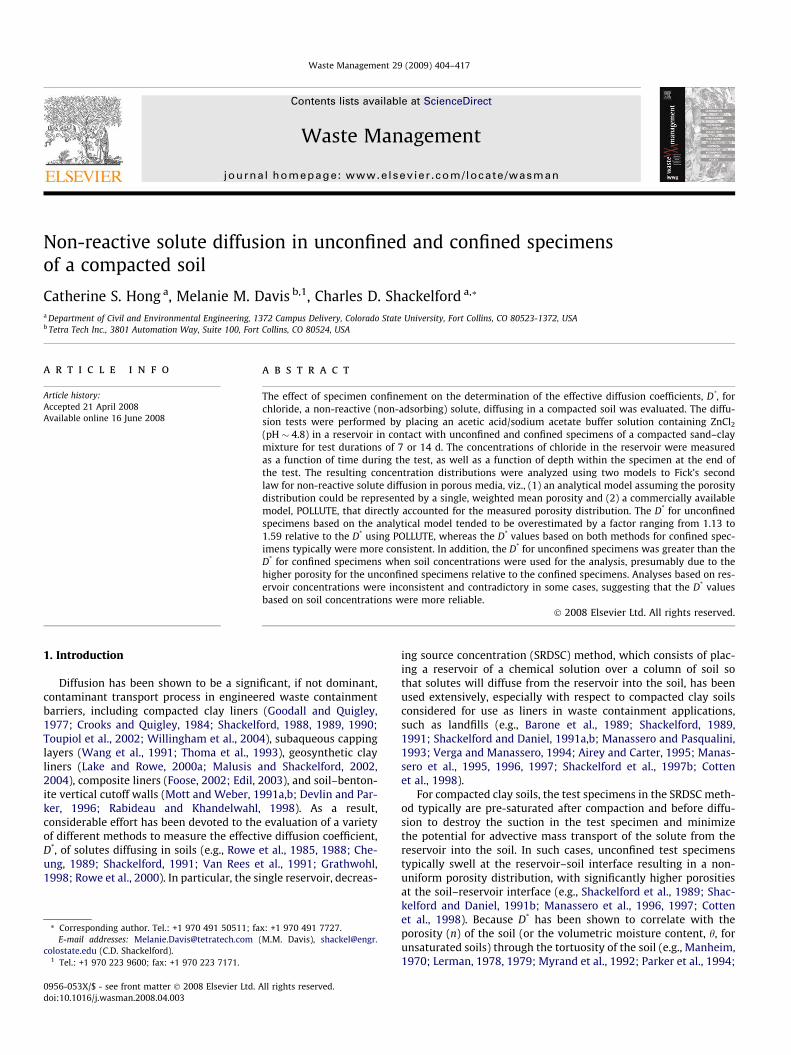
Fig. 1. Compaction curve for 75% sand–25% attapulgite clay mixture.
C.S. Hong et al. / Waste Management 29 (2009) 404–417 405
Polak et al., 2002), the porosity distribution existing within thespecimen may affect the results of SRDSC diffusion tests.
Although the results of SRDSC diffusion tests performed on bothunconfined and confined test specimens have been reported insome studies (e.g., Manassero et al., 1996, 1997), the focus of thesestudies has been on selected factors other than specimen confine-ment that can affect the measurement of the D*, such as the effectof nonlinear sorption on adsorbing cations and the potential influ-ence of a concentration discontinuity existing at the reservoir–soilinterface. Thus, no systematic study specifically focusing on the po-tential effect of the degree of confinement of the test specimens onthe resulting D* values has been conducted. As a result, the primarypurpose of this study was to evaluate the effect of the degree ofconfinement on the measured D* values of a non-reactive (non-adsorbing) solute for a compacted soil using the SRDSC method.In addition, the effects of the method of analysis of the results todetermine the D* values, the duration of the tests (i.e., 7 or 14 d),and the use of reservoir or soil concentration profiles in the deter-mination of D* also were evaluated. Although the degree of con-finement of compacted clay liners in the field typically is notknown a priori, and may vary depending on the nature and se-quence of loading conditions, the results of this study may be use-ful in terms of interpreting the results of diffusion tests performedwith potential compacted clay liner materials using the SRDSCmethod.
2. Materials and methods
2.1. Soil
The soil used in this study was a mixture of 75% sand and 25%attapulgite clay (dry weight basis). Attapulgite clay is a soil com-prised primarily of attapulgite clay mineral (palygorskite), andhas been used in barriers for waste containment primarily becausethe attapulgite clay mineral is relatively inert in the presence ofchemicals compared with other commonly used clay mineral soils,such as bentonite (Tobin and Wild, 1986; Ryan, 1987; Broderick andDaniel, 1990; Shackelford, 1994). Both of the constituent materialsand the mixture composition have been used previously for columntesting to evaluate zinc migration in unconfined specimens (Shac-kelford et al., 1997a), and for diffusion testing of unconfined speci-mens in accordance with the SRDSC method (Cotten et al., 1998).
The attapulgite clay was obtained under the trade name Min-U-Gel FG from the Floridin Co., Quincy, FL, USA, and the sand was ob-tained from the Colorado Lien Co., Laporte, CO, USA, under thetrade name 40-140 Silica Sand. The measured specific gravity of sol-ids (Gs) based on ASTM D 854 for the attapulgite clay and sandwere 2.56 and 2.65, respectively. The sand was comprised of 99%sand-sized particles (0.074–4.75 mm) and 1% silt-sized particles(0.002 to 0.074 mm) based on ASTM D 421 and 422, whereas theattapulgite clay was comprised of 34% silt-sized particles and66% clay-sized particles (<0.002 mm). The measured liquid limitand plasticity index for the attapulgite clay (ASTM D 4318) were338 and 216, respectively, and the measured cation exchangecapacity (CEC) was 29.2 meq/100 g. The sand classified as poorlygraded (SP) based on the Unified Soil Classification System (ASTMD 2487), whereas the attapulgite clay classified as a high plasticityclay (CH). Further properties of the constituent materials are pro-vided by Shackelford et al. (1997a) and Cotten et al. (1998).
Compaction test results (ASTM D 698) for the sand–clay mix-ture are shown in Fig. 1. The optimum gravimetric water content,wopt, was 23.1% and the maximum dry unit weight, cdmax, was14.6 kN/m3 (92.9 lb/ft3) as determined using a third-order polyno-mial fit to the compaction test results in accordance with Howellet al. (1997).
2.2. Liquids
Three liquids were used in this study: deionized distilled water(DDW, pH 5.8), an acetic acid/sodium acetate (HOAc/NaOAc) buffersolution (pH 4.8), and ZnCl2 dissolved in the buffer solution. TheDDW was used in compacting test specimens of the sand–atta-pulgite clay mixture (Fig. 1). The 1.0 M HOAc/1.4 M NaOAc buffersolution was permeated through the test specimens prior to diffu-sion testing to: (1) saturate the tests specimens and minimizeadvective transport due to suction in the compacted specimensand (2) buffer the pH of the test specimens to �4.8 to control therelatively high pH (�9) of the soil mixture (Shackelford et al.,1997a,b; Cotten et al., 1998). Solutions of the anhydrous ZnCl2 dis-solved in the 1.0 M HOAc/1.4 M NaOAc buffer were used to evalu-ate the chloride migration in the diffusion tests. The measuredchloride concentrations in these solutions ranged from 227 to323 mg/L.
Chloride was used in this study because chloride is generallyconsidered a non-reactive solute with respect to adsorption byclays. A batch equilibrium adsorption test (BEAT) performed usingthe chemical solution and the sand–attapulgite clay mixture indi-cated no measurable adsorption of chloride with the soil (e.g., seeShackelford et al., 1997a,b; Cotten et al., 1998).
2.3. Testing apparatus
Except for allowing the possibility to confine the test specimens,the test apparatus shown schematically in Fig. 2a is the same as de-scribed by Shackelford et al. (1997a,b). The test apparatus essentiallyconsists of a permeation/diffusion test cell located between clear ac-rylic influent and effluent accumulators used to store permeant li-quid and to collect effluent, respectively, during the permeationstage of the test prior to diffusion testing. The diffusion test cell isshown schematically in Fig. 2b. One reservoir filling/drainage tubeand the effluent collection tube were open during permeation, andclosed upon commencement of the diffusion test.
The length of the molds, L, in this study was 5.83 cm with avolume of 486 cm3. Therefore, the test specimen molds used inthis study were approximately one-half (51.5%) of the volume
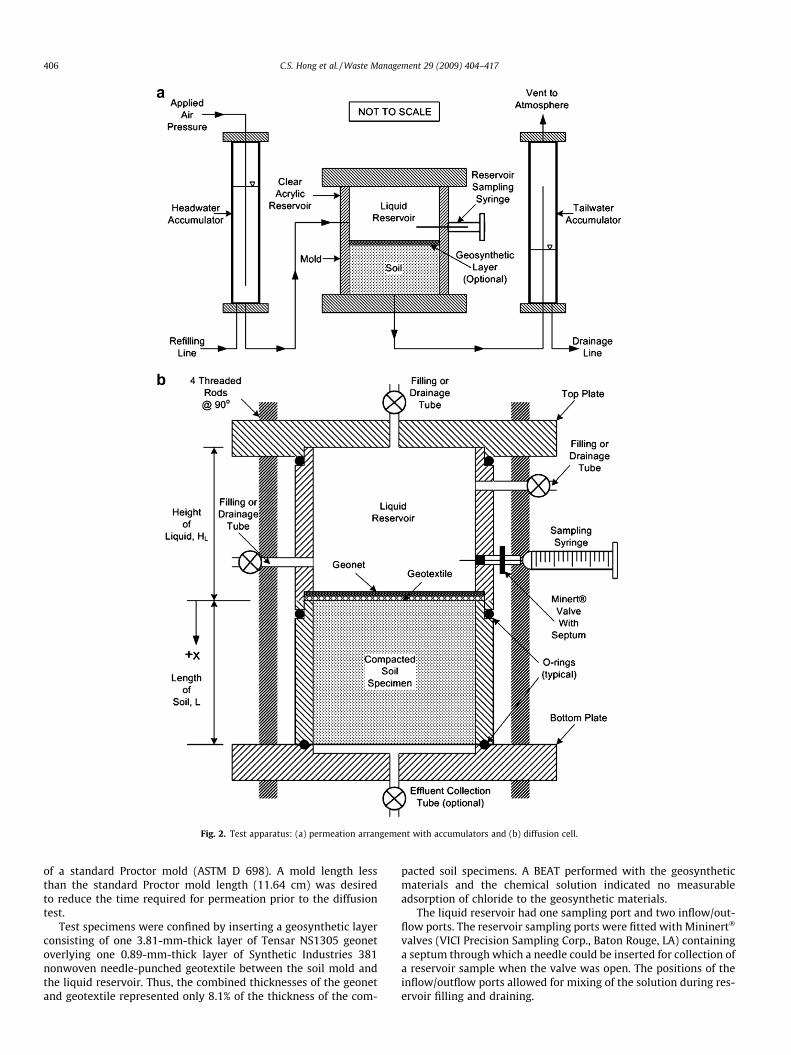
Fig. 2. Test apparatus: (a) permeation arrangement with accumulators and (b) diffusion cell.
406 C.S. Hong et al. / Waste Management 29 (2009) 404–417
of a standard Proctor mold (ASTM D 698). A mold length lessthan the standard Proctor mold length (11.64 cm) was desiredto reduce the time required for permeation prior to the diffusiontest.
Test specimens were confined by inserting a geosynthetic layerconsisting of one 3.81-mm-thick layer of Tensar NS1305 geonetoverlying one 0.89-mm-thick layer of Synthetic Industries 381nonwoven needle-punched geotextile between the soil mold andthe liquid reservoir. Thus, the combined thicknesses of the geonetand geotextile represented only 8.1% of the thickness of the com-
pacted soil specimens. A BEAT performed with the geosyntheticmaterials and the chemical solution indicated no measurableadsorption of chloride to the geosynthetic materials.
The liquid reservoir had one sampling port and two inflow/out-flow ports. The reservoir sampling ports were fitted with Mininert�
valves (VICI Precision Sampling Corp., Baton Rouge, LA) containinga septum through which a needle could be inserted for collection ofa reservoir sample when the valve was open. The positions of theinflow/outflow ports allowed for mixing of the solution during res-ervoir filling and draining.
C.S. Hong et al. / Waste Management 29 (2009) 404–417 407
2.4. Specimen preparation
The sand–clay mixture specimens were mixed with DDW incre-mentally, as described by Shackelford et al. (1997a,b), until thewater content was at least six percentage points above the opti-mum water content (23.1%). This relatively high initial water con-tent was desired to ensure a high initial degree of saturation of thespecimens, thereby minimizing the time required for permeationbefore diffusion testing. The wetted soil mixtures were placed indouble Ziplock� freezer bags, sealed, and allowed to cure for 24 hbefore compaction.
The wetted soil mixtures were compacted into the same stain-less-steel molds as used to develop the compaction curve to pre-pare the test specimens. The test specimens were compacted byfollowing ASTM D 698, except that the compaction energy wasabout 98% of the standard energy due to the smaller mold volume.The resulting compaction water contents and dry unit weights ofthe test specimens are shown in Fig. 1.
2.5. Diffusion testing procedures
The compacted sand–attapulgite clay specimens were perme-ated prior to diffusion testing with the HOAc/NaOAc buffer solu-tion to promote saturation of the soil specimen and to buffer thesoil specimen pH to a value of �4.8 primarily to prevent precipita-tion of zinc (e.g., see Shackelford et al., 1997a,b; Cotten et al.,1998). Test specimens that were not confined by a geosyntheticlayer swelled into the liquid reservoir during permeation. For theseunconfined specimens, the swollen soil was trimmed periodicallyto maintain a constant soil specimen thickness equal to the lengthof the mold. At the end of permeation, excess pore-water pressuresresulting from the applied hydraulic gradient were allowed to dis-sipate, the effluent collection tube at the bottom of the cell wasclosed, and the permeant liquid was drained from the reservoir.The weight of each test specimen was measured for determinationof the initial water content in the specimen prior to diffusiontesting.
The diffusion tests were performed for both unconfined andconfined test specimens for durations of 7 and 14 d. Each testwas performed in duplicate. Thus, eight diffusion tests were per-formed, two tests for unconfined specimens with durations ofeither 7 d (UC7-1, UC7-2) or 14 d (UC14-1, UC14-2), and two testsfor confined specimens with durations of either 7 d (C7-1, C7-2) or14 d (C14-1, C14-2). Except for the confinement aspects of the con-fined tests as previously described, the diffusion tests followed thesame procedures as detailed by Shackelford et al. (1997b) and Cot-ten et al. (1998) for SRDSC tests. Diffusion was initiated by intro-ducing the ZnCl2 solution into the reservoir. The reservoir wassampled either daily (7-d tests) or every 2 days (14-d tests). Theheight of the reservoir liquid was measured periodically with acathetometer (ASTM D 5084), to provide an indication of anyadvective transport into the specimen due to the possibility ofresidual suction in the soil after permeation. For all tests, thechange in height of the liquid reservoir over the duration of the testaccounting for reservoir sampling was negligible (<0.1%). All diffu-sion tests were performed at ambient laboratory temperatures(20.5 ± 2.5oC).
At the end of diffusion testing, the solution was drained fromthe reservoir, the diffusion cell was broken down, and the soil spec-imen was extruded carefully from the mold using an extrusion de-vice similar to that described by Shackelford et al. (1989). The soilspecimen was sliced into �5-mm thick slices at selected intervalsduring the extrusion, and the weight of the each slice was mea-sured. Spatial distributions of water content and chloride concen-tration within the soil specimens were based on alternate slices.The measured water contents were used to calculate the porosity
distributions assuming saturated soil. For determination of watercontent, the entire slice was weighed before being placed in anoven. For determination of the chloride concentrations, the porefluid was squeezed from each slice using a large capacity (90 kN)load frame, and the chloride concentrations were measured usingan ion selective electrode (ISE) containing an Orion chloride solidstate electrode (Orion model No. 941700).
2.6. Analysis of data
The diffusion test data were analyzed to determine D* valuesbased on two approaches, viz. an analytical approach using an ana-lytical (closed-form) model and a numerical approach using POL-LUTE (Version 6, GAEA Environmental Engineering Ltd., Canada),a commercially available finite-layer contaminant migration mod-el. Both models represented solutions to Fick’s second law for non-reactive solute diffusion in porous media for the case of decreasingsource concentration and finite cell length. However, the analyticalmodel is based on the assumption of a constant porosity distribu-tion, whereas non-uniform porosity distributions within the soilcan be taken into account with POLLUTE by separating the soil do-main into a number of consecutive sub-layers each of finite thick-ness with different representative porosity values. The analyticalapproach has previously been used to analyze diffusion test datafor the D* of both unconfined and confined soil specimens (e.g.,Manassero et al., 1996, 1997; Shackelford et al., 1997b; Cottenet al., 1998), and POLLUTE has been used extensively to evaluateD* values from laboratory diffusion tests (e.g., Rowe et al., 1988;Barone et al., 1989; Shackelford and Daniel, 1991b; Manasseroet al., 1996, 1997; Lake and Rowe, 2000a,b; Hrapovic and Rowe,2002; Lorenzetti et al., 2005).
The analytical model can be represented as follows (Crank,1975; Shackelford, 1991; Shackelford et al., 1997b; Cotten et al.,1998):
cðx P 0; tÞc0
¼ a1þ a
þX1m¼1
2a1þ aþ a2q2
m
� exp �D�q2mt
L2
� �cos½qmð1� x
LÞ�cos qmð Þ ð1Þ
where c(x, t) is the chloride concentration at any distance x and timet, co is the initial chloride concentration in the source reservoir, L isthe length of the soil in the mold (Fig. 2b), and D* is the effective dif-fusion coefficient defined as the product of the aqueous (free-solu-tion) diffusion coefficient (Do) and the apparent tortuosity factor(sa < 1), or D* = Dosa (Shackelford and Daniel, 1991a). The valuesof qm are the non-zero positive roots of the following function:
tanðqmÞ ¼ �aqm ð2Þ
where a is a constant defined as follows:
a ¼ HL
nLð3Þ
HL is the height of the liquid in the source reservoir (Fig. 2b), and n isthe total porosity of the soil specimen. The value for n used in Eq. (3)was based on the weighted mean porosity, nmean (=n), which wasequal to the sum of the products of the individual values of porosityfor each soil slice, ni, multiplied by their respective representativethickness, DLi, and divided by the total thickness of the soil speci-men, L (=RDLi), or nmean = R(niDLi)/RDLi. Eqs. (1)–(3) were pro-grammed using the computer software, Microsoft� Office Excel(Version 2003, Microsoft Corporation). The value of a (Eq. (3))was determined using the solver in the Excel program, and theaccuracy was checked by comparing the calculated a values withthose tabulated by Crank (1975). The accuracy of the analyticalmodel was checked by comparing simulation results based on a
408 C.S. Hong et al. / Waste Management 29 (2009) 404–417
constant, uniform porosity distribution within the soil specimenwith those generated using POLLUTE for a variety of D* values.
Each model was used to determine an effective diffusion coeffi-cient based on the reservoir concentration data, D�Reservoir (=D* in Eq.(1) for x = 0, t > 0), as well as an effective diffusion coefficient basedon the soil concentration data, D�Soil (=D* in Eq. (1) for x > 0, t = 7 or14 d) for each test. For each set of test results, the procedure in-volved determining by trial and error the value for D�Reservoir orD�Soil that matched each measured reservoir or soil concentration,respectively, and then determining the means of the D* values sodetermined to arrive at an overall D�Reservoir or D�Soil value for eachtest. The mean D�Reservoir or D�Soil so determined was then used withthe respective model to generate a simulated concentration profilefor the data set. The goodness of fit for the data set was provided bydetermining the coefficient of determination, r2, resulting fromcomparing the simulated profile with the measured data. This pro-cedure has been used previously for the analysis for effective diffu-sion coefficients from the results of diffusion tests (Shackelfordet al., 1989; Shackelford and Daniel, 1991b; Cotten et al., 1998).
For the confined specimens, the potential effect of the geosyn-thetic confining layer on interpretation of the measured concentra-tion profiles was considered (e.g., Olsen et al., 1965). However, anyeffect resulting from existence of the geosynthetic confining layerwas expected to be minimal for two reasons. First, as previouslymentioned, the chemical solution was found to be inert with re-spect to the geonet and geotextile used as the confining layer suchthat no sources or sinks for chloride within the confining layer
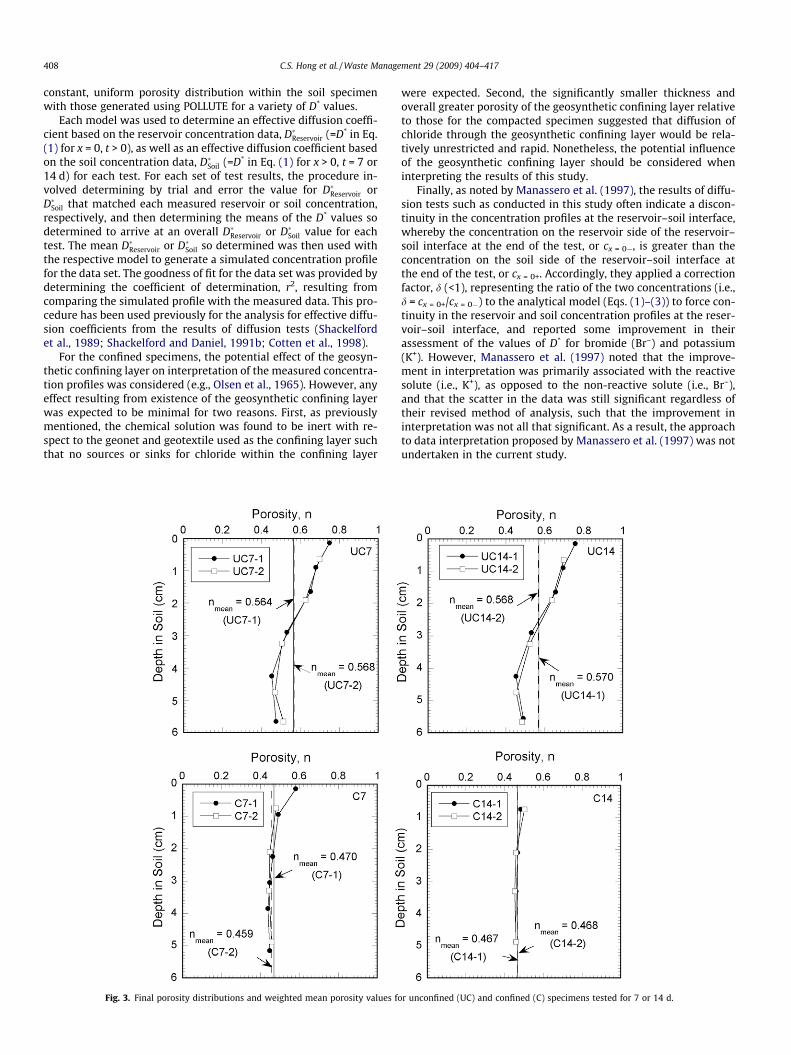
Fig. 3. Final porosity distributions and weighted mean porosity values fo
were expected. Second, the significantly smaller thickness andoverall greater porosity of the geosynthetic confining layer relativeto those for the compacted specimen suggested that diffusion ofchloride through the geosynthetic confining layer would be rela-tively unrestricted and rapid. Nonetheless, the potential influenceof the geosynthetic confining layer should be considered wheninterpreting the results of this study.
Finally, as noted by Manassero et al. (1997), the results of diffu-sion tests such as conducted in this study often indicate a discon-tinuity in the concentration profiles at the reservoir–soil interface,whereby the concentration on the reservoir side of the reservoir–soil interface at the end of the test, or cx = 0�, is greater than theconcentration on the soil side of the reservoir–soil interface atthe end of the test, or cx = 0+. Accordingly, they applied a correctionfactor, d (<1), representing the ratio of the two concentrations (i.e.,d = cx = 0+/cx = 0�) to the analytical model (Eqs. (1)–(3)) to force con-tinuity in the reservoir and soil concentration profiles at the reser-voir–soil interface, and reported some improvement in theirassessment of the values of D* for bromide (Br–) and potassium(K+). However, Manassero et al. (1997) noted that the improve-ment in interpretation was primarily associated with the reactivesolute (i.e., K+), as opposed to the non-reactive solute (i.e., Br–),and that the scatter in the data was still significant regardless oftheir revised method of analysis, such that the improvement ininterpretation was not all that significant. As a result, the approachto data interpretation proposed by Manassero et al. (1997) was notundertaken in the current study.
r unconfined (UC) and confined (C) specimens tested for 7 or 14 d.
C.S. Hong et al. / Waste Management 29 (2009) 404–417 409
3. Results
3.1. Porosity distributions
The final porosity distributions based on the measured porosi-ties of the soil slices at the end of diffusion testing for all test spec-imens are shown in Fig. 3. As expected, there is a contrast in themeasured porosity distributions for unconfined versus confinedspecimens. The final porosity distributions for all unconfined testspecimens were non-uniform with the porosity generally decreas-ing with increasing depth. The final porosity distributions for allconfined test specimens were more uniform with depth comparedto the unconfined test specimens.
The difference between the porosity distributions for theunconfined and confined specimens shown in Fig. 3 representsthe swelling that occurred in the unconfined test specimens duringpermeation relative to the confined test specimens. The porositydistributions in Fig. 3 also indicate that similar final porosity distri-butions existed among the four unconfined specimens as well asamong the four confined specimens, suggesting that the reproduc-ibility of the test specimens was good, and that the geosyntheticconfining layer generally was effective in preventing significantswelling of the confined test specimens, although some swellingwas apparent within the top 10 mm of the test specimen for testC7-1.
The initial and final average properties of the test specimens aresummarized in Table 1. The initial properties are based on themolding (compaction) water content and the as-compacted weightof the soil in the diffusion molds, whereas the final properties arebased on values obtained from individual slices recovered at theend of the diffusion test and weighted with respect to the repre-sentatives of the slice as described by Shackelford et al.(1997a,b). The final, weighted mean porosity values given in Table1 were used in the analyses for D* based on the analytical model(Eq. (3)).
As indicated in Table 1, both unconfined and confined test spec-imens had similar initial (compacted) properties indicating thatthe specimen preparation procedure resulted in reproducible testspecimens. In contrast, a comparison of the final (after testing)properties with the initial properties of the test specimens indi-cates a considerably greater amount of swelling associated withthe unconfined test specimens relative to the confined test speci-mens. For example, the final mean porosity values for the uncon-fined test specimens ranged from 125% to 128% of the initialporosity values, whereas the final mean porosity values for theconfined specimens were all within 104% of the initial porosity val-ues. This slight increase in final porosity values for the confinedspecimens can be attributed to the small amount of swelling thatoccurred near the reservoir–soil interface (e.g., test C7-1 in Fig. 3).
Table 1Initial and final properties of test specimens
Test type Testdesignation
Initial propertiesa
Water content,wi (%)
Porosity,ni
Dry unit weight,cdi (kN/m3)
Unconfined UC7-1 29.2 0.449 14.2UC7-2 29.3 0.453 14.1UC14-1 29.0 0.445 14.3UC14-2 29.5 0.449 14.2
Confined C7-1 29.8 0.453 14.1C7-2 29.5 0.449 14.2C14-1 30.0 0.457 14.0C14-2 28.5 0.460 13.9
a Values based on as-compacted specimen.b Values based on weighted-averages of incremental slices of specimen after testing.
3.2. Concentration profiles and effective diffusion coefficients
The measured concentration data and simulated concentrationprofiles for all eight diffusion tests are shown in Figs. 4–7. Theresulting D* values as well as the corresponding coefficients ofdetermination, r2, and the number of concentrations, N, uponwhich the r2 values were based are summarized in Table 2. Sincea D* value was not determined for the initial source reservoir con-centration [i.e., c(0,0)], the number of D* values upon whichD�Reservoir was based equals N � 1, whereas the number of D* valuesupon which D�Soil was based equals N. Some consideration of theoverall quality of the data is in order prior to a discussion of theresults.
Measured concentrations that were excluded from consider-ation in the analyses based on both the analytical model and POL-LUTE are denoted in Figs. 4–7 with a question mark (?), whereasmeasured concentrations excluded from analysis based on onlythe analytical model or POLLUTE are marked with a question marksubscripted with either an ‘‘A” or a ‘‘P” (i.e., ‘‘?A” or ‘‘?P”), respec-tively. Exclusion of these data was based on one or more of the fol-lowing criteria.
First, some measured concentrations apparently were outsidethe realm of possibility such that a D* value could not be obtainedusing the POLLUTE program. Second, since the apparent tortuosityfactor as defined by Shackelford and Daniel (1991a), sa, must beless than unity for diffusion in porous media (i.e., sa < 1), the effec-tive diffusion coefficient, D*, must be lower than the free-solution(aqueous) diffusion coefficient, Do, in accordance with the defini-tion for D* (=Dosa). Thus, D* values that were obtainable but higherthan the Do value for chloride of 2.03 � 10�5 cm2/s (Shackelfordand Daniel, 1991a) were excluded from consideration on the basisthat such D* values are physically impossible. Third, obtainable D*
values that were one or more orders of magnitude lower than themean D* value based on all the other concentrations for the data setwere excluded as being unrepresentative of the data set.
Except for the reservoir concentrations for specimen C7-1, thenumber of measured concentration data excluded from consider-ation based on the above criteria generally was not excessive, suchthat all analyses included a minimum of three concentrations. Forexample, N ranged from 5 to 8 based on reservoir concentrations,and from 3 to 7 based on soil concentrations. In the case of speci-men C7-1, all of the D�Reservoir values except one based only on anal-ysis using POLLUTE (see Fig. 6 and Table 2) were greater than thefree-solution diffusion coefficient, Do, for chloride of2.03 � 10�5 cm2/s, presumably due to error in the measured reser-voir concentrations for this specimen.
Based on the concentration data included in the analysis, meanD* values (i.e., either D�Reservoir or D�Soil) were calculated for each test.The mean D* value then was used to calculate the theoretical con-
Final propertiesb Ratios of properties
Water content,wf (%)
Porosity,nf
Dry unit weight,cdf (kN/m3)
wf/wi nf/ni cdf/cdi
66.8 0.564 11.5 2.29 1.26 0.81063.6 0.568 11.4 2.17 1.25 0.80967.4 0.570 11.3 2.32 1.28 0.79065.2 0.568 11.2 2.21 1.27 0.789
32.5 0.470 13.9 1.09 1.04 0.98632.1 0.459 14.0 1.09 1.02 0.98631.9 0.467 13.8 1.06 1.02 0.98632.1 0.468 13.7 1.13 1.02 0.986
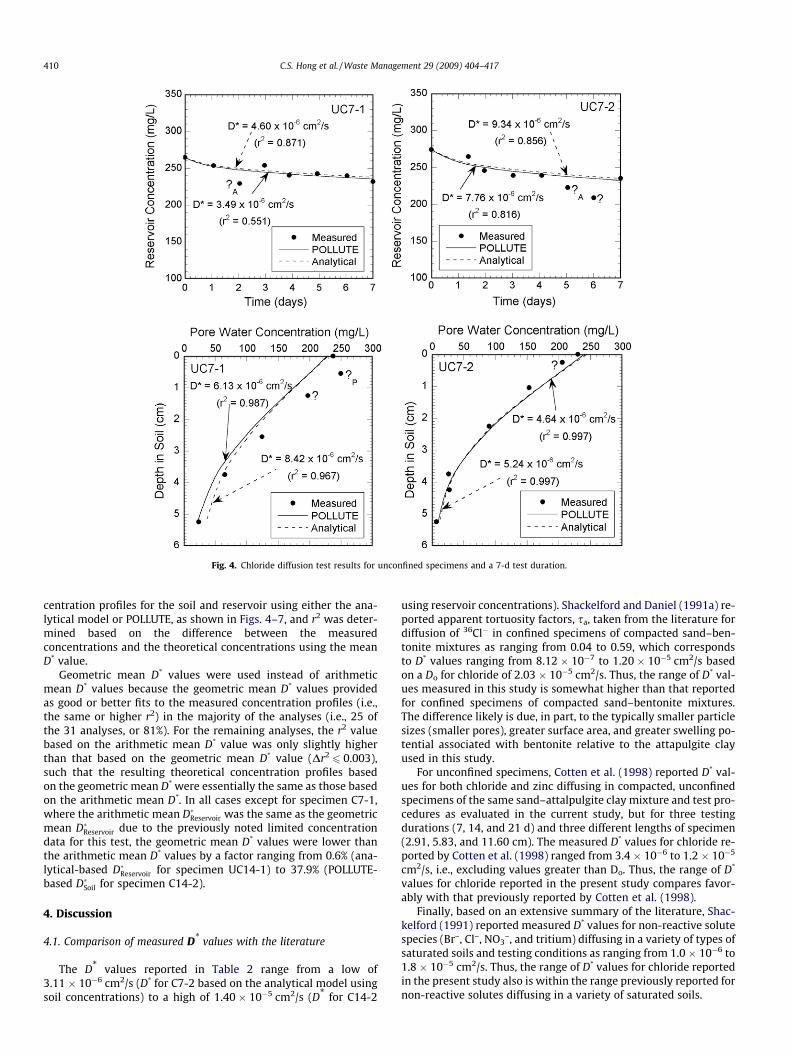
Fig. 4. Chloride diffusion test results for unconfined specimens and a 7-d test duration.
410 C.S. Hong et al. / Waste Management 29 (2009) 404–417
centration profiles for the soil and reservoir using either the ana-lytical model or POLLUTE, as shown in Figs. 4–7, and r2 was deter-mined based on the difference between the measuredconcentrations and the theoretical concentrations using the meanD* value.
Geometric mean D* values were used instead of arithmeticmean D* values because the geometric mean D* values providedas good or better fits to the measured concentration profiles (i.e.,the same or higher r2) in the majority of the analyses (i.e., 25 ofthe 31 analyses, or 81%). For the remaining analyses, the r2 valuebased on the arithmetic mean D* value was only slightly higherthan that based on the geometric mean D* value (Dr2
6 0.003),such that the resulting theoretical concentration profiles basedon the geometric mean D* were essentially the same as those basedon the arithmetic mean D*. In all cases except for specimen C7-1,where the arithmetic mean D�Reservoir was the same as the geometricmean D�Reservoir due to the previously noted limited concentrationdata for this test, the geometric mean D* values were lower thanthe arithmetic mean D* values by a factor ranging from 0.6% (ana-lytical-based D�Reservoir for specimen UC14-1) to 37.9% (POLLUTE-based D�Soil for specimen C14-2).
4. Discussion
4.1. Comparison of measured D* values with the literature
The D* values reported in Table 2 range from a low of3.11 � 10�6 cm2/s (D* for C7-2 based on the analytical model usingsoil concentrations) to a high of 1.40 � 10�5 cm2/s (D* for C14-2
using reservoir concentrations). Shackelford and Daniel (1991a) re-ported apparent tortuosity factors, sa, taken from the literature fordiffusion of 36Cl� in confined specimens of compacted sand–ben-tonite mixtures as ranging from 0.04 to 0.59, which correspondsto D* values ranging from 8.12 � 10�7 to 1.20 � 10�5 cm2/s basedon a Do for chloride of 2.03 � 10�5 cm2/s. Thus, the range of D* val-ues measured in this study is somewhat higher than that reportedfor confined specimens of compacted sand–bentonite mixtures.The difference likely is due, in part, to the typically smaller particlesizes (smaller pores), greater surface area, and greater swelling po-tential associated with bentonite relative to the attapulgite clayused in this study.
For unconfined specimens, Cotten et al. (1998) reported D* val-ues for both chloride and zinc diffusing in compacted, unconfinedspecimens of the same sand–attalpulgite clay mixture and test pro-cedures as evaluated in the current study, but for three testingdurations (7, 14, and 21 d) and three different lengths of specimen(2.91, 5.83, and 11.60 cm). The measured D* values for chloride re-ported by Cotten et al. (1998) ranged from 3.4 � 10�6 to 1.2 � 10�5
cm2/s, i.e., excluding values greater than Do. Thus, the range of D*
values for chloride reported in the present study compares favor-ably with that previously reported by Cotten et al. (1998).
Finally, based on an extensive summary of the literature, Shac-kelford (1991) reported measured D* values for non-reactive solutespecies (Br–, Cl–, NO3
–, and tritium) diffusing in a variety of types ofsaturated soils and testing conditions as ranging from 1.0 � 10�6 to1.8 � 10�5 cm2/s. Thus, the range of D* values for chloride reportedin the present study also is within the range previously reported fornon-reactive solutes diffusing in a variety of saturated soils.
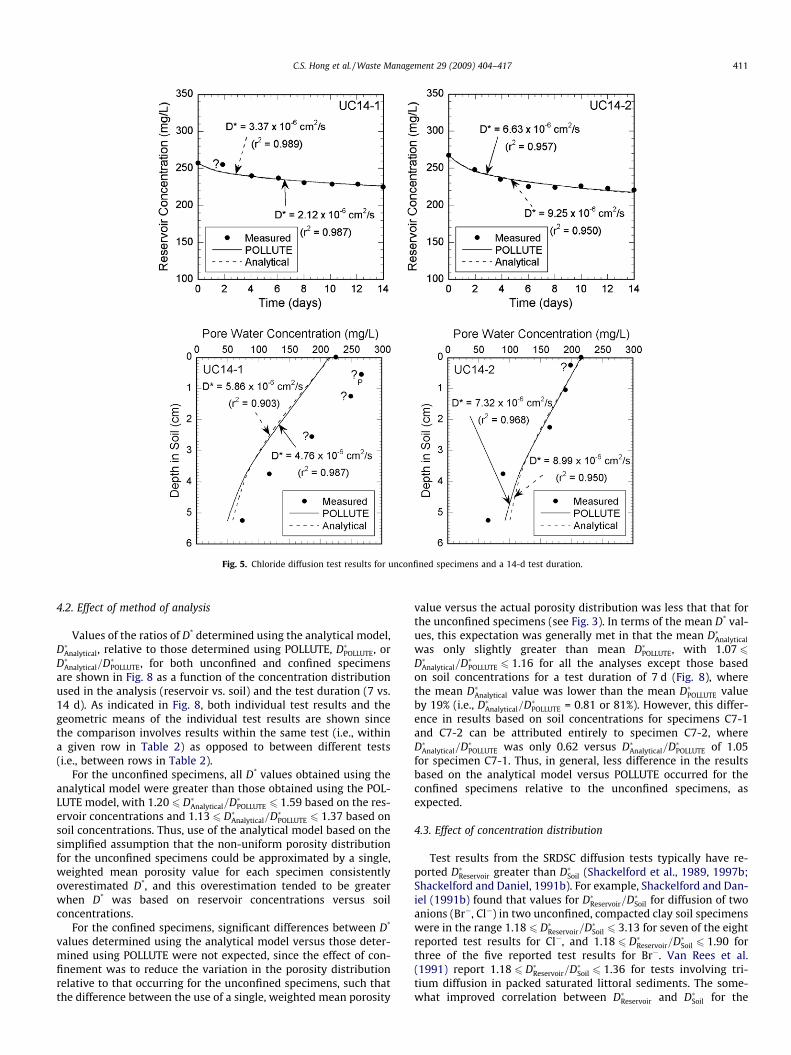
Fig. 5. Chloride diffusion test results for unconfined specimens and a 14-d test duration.
C.S. Hong et al. / Waste Management 29 (2009) 404–417 411
4.2. Effect of method of analysis
Values of the ratios of D* determined using the analytical model,D�Analytical, relative to those determined using POLLUTE, D�POLLUTE, orD�Analytical=D�POLLUTE, for both unconfined and confined specimensare shown in Fig. 8 as a function of the concentration distributionused in the analysis (reservoir vs. soil) and the test duration (7 vs.14 d). As indicated in Fig. 8, both individual test results and thegeometric means of the individual test results are shown sincethe comparison involves results within the same test (i.e., withina given row in Table 2) as opposed to between different tests(i.e., between rows in Table 2).
For the unconfined specimens, all D* values obtained using theanalytical model were greater than those obtained using the POL-LUTE model, with 1.20 6 D�Analytical=D�POLLUTE 6 1.59 based on the res-ervoir concentrations and 1.13 6 D�Analytical=D�POLLUTE 6 1.37 based onsoil concentrations. Thus, use of the analytical model based on thesimplified assumption that the non-uniform porosity distributionfor the unconfined specimens could be approximated by a single,weighted mean porosity value for each specimen consistentlyoverestimated D*, and this overestimation tended to be greaterwhen D* was based on reservoir concentrations versus soilconcentrations.
For the confined specimens, significant differences between D*
values determined using the analytical model versus those deter-mined using POLLUTE were not expected, since the effect of con-finement was to reduce the variation in the porosity distributionrelative to that occurring for the unconfined specimens, such thatthe difference between the use of a single, weighted mean porosity
value versus the actual porosity distribution was less that that forthe unconfined specimens (see Fig. 3). In terms of the mean D* val-ues, this expectation was generally met in that the mean D�Analytical
was only slightly greater than mean D�POLLUTE, with 1.07 6D�Analytical=D�POLLUTE 6 1.16 for all the analyses except those basedon soil concentrations for a test duration of 7 d (Fig. 8), wherethe mean D�Analytical value was lower than the mean D�POLLUTE valueby 19% (i.e., D�Analytical=D�POLLUTE = 0.81 or 81%). However, this differ-ence in results based on soil concentrations for specimens C7-1and C7-2 can be attributed entirely to specimen C7-2, whereD�Analytical=D�POLLUTE was only 0.62 versus D�Analytical=D�POLLUTE of 1.05for specimen C7-1. Thus, in general, less difference in the resultsbased on the analytical model versus POLLUTE occurred for theconfined specimens relative to the unconfined specimens, asexpected.
4.3. Effect of concentration distribution
Test results from the SRDSC diffusion tests typically have re-ported D�Reservoir greater than D�Soil (Shackelford et al., 1989, 1997b;Shackelford and Daniel, 1991b). For example, Shackelford and Dan-iel (1991b) found that values for D�Reservoir=D�Soil for diffusion of twoanions (Br�, Cl�) in two unconfined, compacted clay soil specimenswere in the range 1.18 6 D�Reservoir=D�Soil 6 3.13 for seven of the eightreported test results for Cl�, and 1.18 6 D�Reservoir=D�Soil 6 1.90 forthree of the five reported test results for Br�. Van Rees et al.(1991) report 1.18 6 D�Reservoir=D�Soil 6 1.36 for tests involving tri-tium diffusion in packed saturated littoral sediments. The some-what improved correlation between D�Reservoir and D�Soil for the
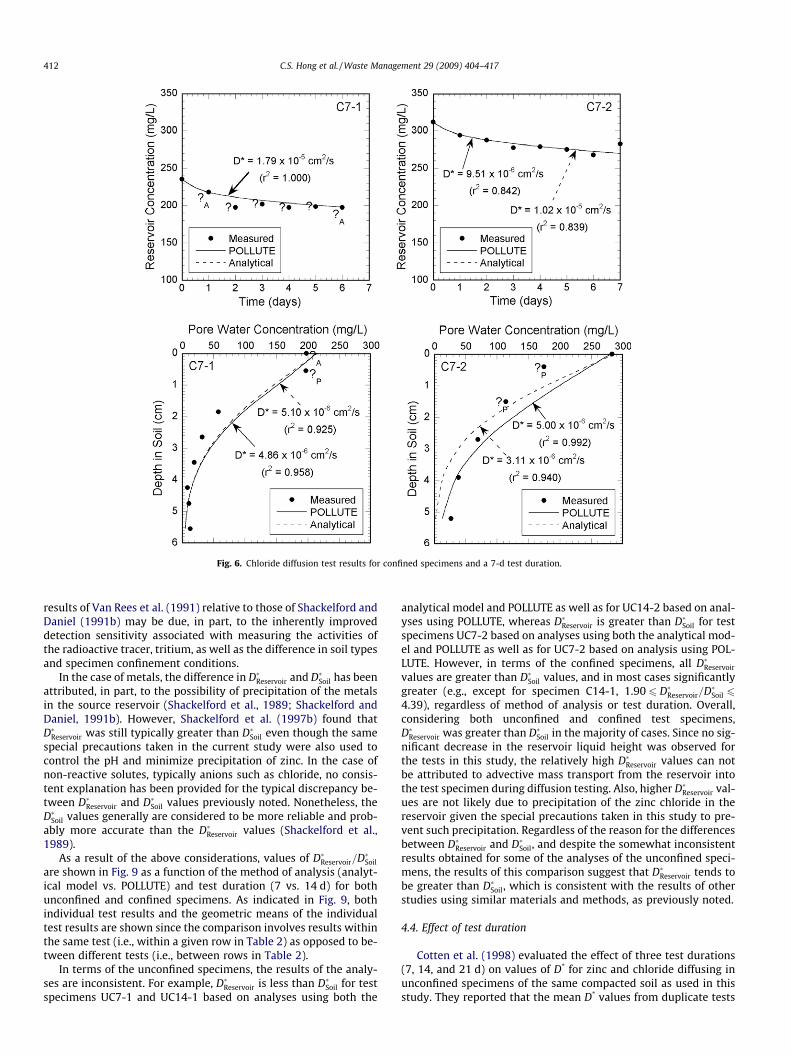
Fig. 6. Chloride diffusion test results for confined specimens and a 7-d test duration.
412 C.S. Hong et al. / Waste Management 29 (2009) 404–417
results of Van Rees et al. (1991) relative to those of Shackelford andDaniel (1991b) may be due, in part, to the inherently improveddetection sensitivity associated with measuring the activities ofthe radioactive tracer, tritium, as well as the difference in soil typesand specimen confinement conditions.
In the case of metals, the difference in D�Reservoir and D�Soil has beenattributed, in part, to the possibility of precipitation of the metalsin the source reservoir (Shackelford et al., 1989; Shackelford andDaniel, 1991b). However, Shackelford et al. (1997b) found thatD�Reservoir was still typically greater than D�Soil even though the samespecial precautions taken in the current study were also used tocontrol the pH and minimize precipitation of zinc. In the case ofnon-reactive solutes, typically anions such as chloride, no consis-tent explanation has been provided for the typical discrepancy be-tween D�Reservoir and D�Soil values previously noted. Nonetheless, theD�Soil values generally are considered to be more reliable and prob-ably more accurate than the D�Reservoir values (Shackelford et al.,1989).
As a result of the above considerations, values of D�Reservoir=D�Soil
are shown in Fig. 9 as a function of the method of analysis (analyt-ical model vs. POLLUTE) and test duration (7 vs. 14 d) for bothunconfined and confined specimens. As indicated in Fig. 9, bothindividual test results and the geometric means of the individualtest results are shown since the comparison involves results withinthe same test (i.e., within a given row in Table 2) as opposed to be-tween different tests (i.e., between rows in Table 2).
In terms of the unconfined specimens, the results of the analy-ses are inconsistent. For example, D�Reservoir is less than D�Soil for testspecimens UC7-1 and UC14-1 based on analyses using both the
analytical model and POLLUTE as well as for UC14-2 based on anal-yses using POLLUTE, whereas D�Reservoir is greater than D�Soil for testspecimens UC7-2 based on analyses using both the analytical mod-el and POLLUTE as well as for UC7-2 based on analysis using POL-LUTE. However, in terms of the confined specimens, all D�Reservoir
values are greater than D�Soil values, and in most cases significantlygreater (e.g., except for specimen C14-1, 1.90 6 D�Reservoir=D�Soil 6
4.39), regardless of method of analysis or test duration. Overall,considering both unconfined and confined test specimens,D�Reservoir was greater than D�Soil in the majority of cases. Since no sig-nificant decrease in the reservoir liquid height was observed forthe tests in this study, the relatively high D�Reservoir values can notbe attributed to advective mass transport from the reservoir intothe test specimen during diffusion testing. Also, higher D�Reservoir val-ues are not likely due to precipitation of the zinc chloride in thereservoir given the special precautions taken in this study to pre-vent such precipitation. Regardless of the reason for the differencesbetween D�Reservoir and D�Soil, and despite the somewhat inconsistentresults obtained for some of the analyses of the unconfined speci-mens, the results of this comparison suggest that D�Reservoir tends tobe greater than D�Soil, which is consistent with the results of otherstudies using similar materials and methods, as previously noted.
4.4. Effect of test duration
Cotten et al. (1998) evaluated the effect of three test durations(7, 14, and 21 d) on values of D* for zinc and chloride diffusing inunconfined specimens of the same compacted soil as used in thisstudy. They reported that the mean D* values from duplicate tests
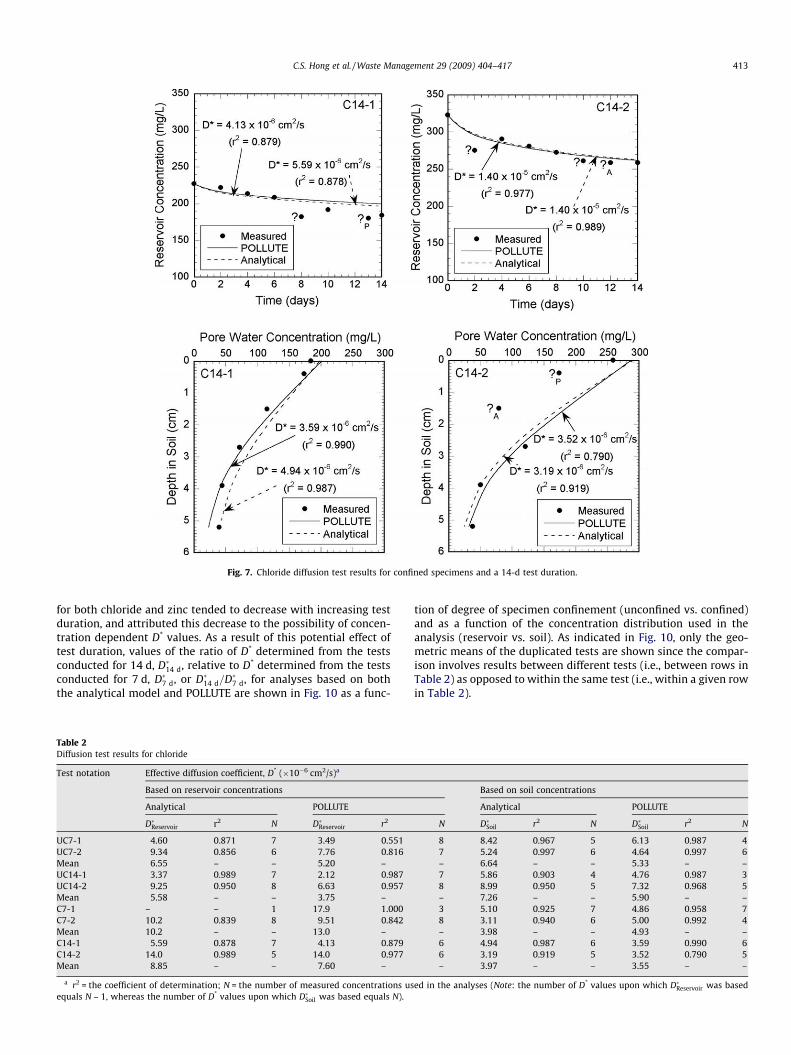
Fig. 7. Chloride diffusion test results for confined specimens and a 14-d test duration.
C.S. Hong et al. / Waste Management 29 (2009) 404–417 413
for both chloride and zinc tended to decrease with increasing testduration, and attributed this decrease to the possibility of concen-tration dependent D* values. As a result of this potential effect oftest duration, values of the ratio of D* determined from the testsconducted for 14 d, D�14 d, relative to D* determined from the testsconducted for 7 d, D�7 d, or D�14 d=D�7 d, for analyses based on boththe analytical model and POLLUTE are shown in Fig. 10 as a func-
Table 2Diffusion test results for chloride
Test notation Effective diffusion coefficient, D* (�10�6 cm2/s)a
Based on reservoir concentrations
Analytical POLLUTE
D�Reservoir r2 N D�Reservoir r2
UC7-1 4.60 0.871 7 3.49 0.551UC7-2 9.34 0.856 6 7.76 0.816Mean 6.55 – – 5.20 –UC14-1 3.37 0.989 7 2.12 0.987UC14-2 9.25 0.950 8 6.63 0.957Mean 5.58 – – 3.75 –C7-1 – – 1 17.9 1.000C7-2 10.2 0.839 8 9.51 0.842Mean 10.2 – – 13.0 –C14-1 5.59 0.878 7 4.13 0.879C14-2 14.0 0.989 5 14.0 0.977Mean 8.85 – – 7.60 –
a r2 = the coefficient of determination; N = the number of measured concentrations usequals N – 1, whereas the number of D* values upon which D�Soil was based equals N).
tion of degree of specimen confinement (unconfined vs. confined)and as a function of the concentration distribution used in theanalysis (reservoir vs. soil). As indicated in Fig. 10, only the geo-metric means of the duplicated tests are shown since the compar-ison involves results between different tests (i.e., between rows inTable 2) as opposed to within the same test (i.e., within a given rowin Table 2).
Based on soil concentrations
Analytical POLLUTE
N D�Soil r2 N D�Soil r2 N
8 8.42 0.967 5 6.13 0.987 47 5.24 0.997 6 4.64 0.997 6– 6.64 – – 5.33 – –7 5.86 0.903 4 4.76 0.987 38 8.99 0.950 5 7.32 0.968 5– 7.26 – – 5.90 – –3 5.10 0.925 7 4.86 0.958 78 3.11 0.940 6 5.00 0.992 4– 3.98 – – 4.93 – –6 4.94 0.987 6 3.59 0.990 66 3.19 0.919 5 3.52 0.790 5– 3.97 – – 3.55 – –
ed in the analyses (Note: the number of D* values upon which D�Reservoir was based
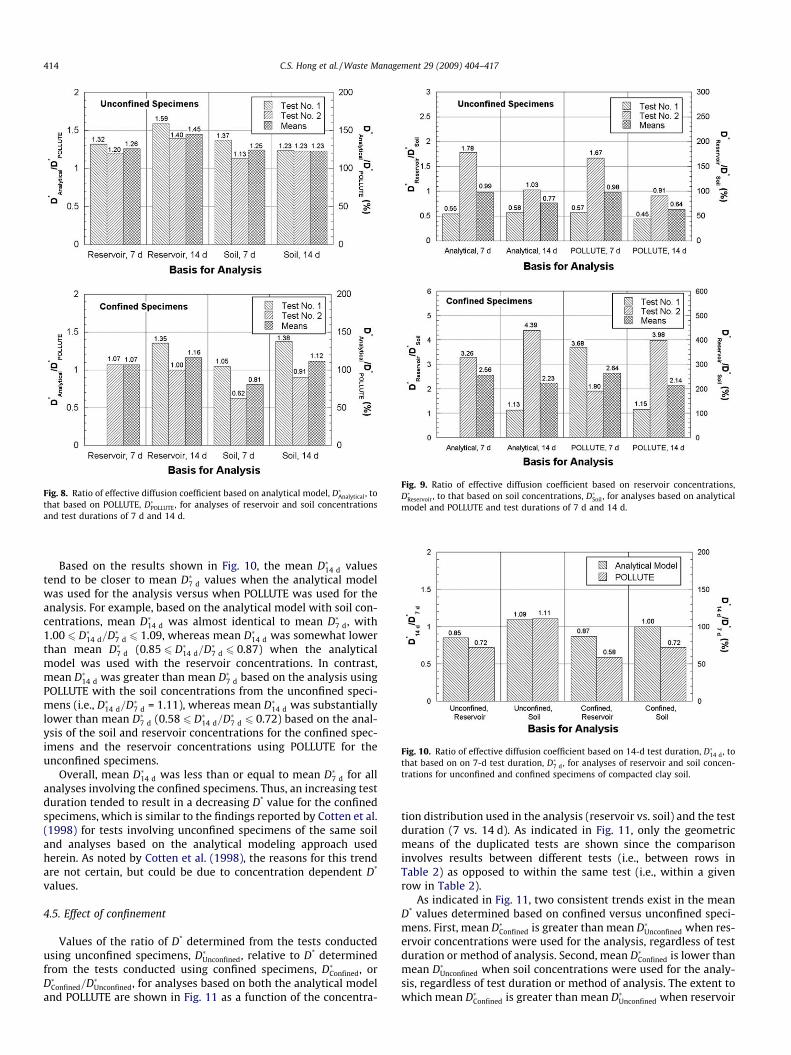
Fig. 8. Ratio of effective diffusion coefficient based on analytical model, D�Analytical , tothat based on POLLUTE, D�POLLUTE, for analyses of reservoir and soil concentrationsand test durations of 7 d and 14 d.
Fig. 9. Ratio of effective diffusion coefficient based on reservoir concentrations,D�Reservoir , to that based on soil concentrations, D�Soil , for analyses based on analyticalmodel and POLLUTE and test durations of 7 d and 14 d.
Fig. 10. Ratio of effective diffusion coefficient based on 14-d test duration, D�14 d, tothat based on on 7-d test duration, D�7 d, for analyses of reservoir and soil concen-trations for unconfined and confined specimens of compacted clay soil.
414 C.S. Hong et al. / Waste Management 29 (2009) 404–417
Based on the results shown in Fig. 10, the mean D�14 d valuestend to be closer to mean D�7 d values when the analytical modelwas used for the analysis versus when POLLUTE was used for theanalysis. For example, based on the analytical model with soil con-centrations, mean D�14 d was almost identical to mean D�7 d, with1.00 6 D�14 d=D�7 d 6 1.09, whereas mean D�14 d was somewhat lowerthan mean D�7 d (0.85 6 D�14 d=D�7 d 6 0.87) when the analyticalmodel was used with the reservoir concentrations. In contrast,mean D�14 d was greater than mean D�7 d based on the analysis usingPOLLUTE with the soil concentrations from the unconfined speci-mens (i.e., D�14 d=D�7 d = 1.11), whereas mean D�14 d was substantiallylower than mean D�7 d (0.58 6 D�14 d=D�7 d 6 0.72) based on the anal-ysis of the soil and reservoir concentrations for the confined spec-imens and the reservoir concentrations using POLLUTE for theunconfined specimens.
Overall, mean D�14 d was less than or equal to mean D�7 d for allanalyses involving the confined specimens. Thus, an increasing testduration tended to result in a decreasing D* value for the confinedspecimens, which is similar to the findings reported by Cotten et al.(1998) for tests involving unconfined specimens of the same soiland analyses based on the analytical modeling approach usedherein. As noted by Cotten et al. (1998), the reasons for this trendare not certain, but could be due to concentration dependent D*
values.
4.5. Effect of confinement
Values of the ratio of D* determined from the tests conductedusing unconfined specimens, D�Unconfined, relative to D* determinedfrom the tests conducted using confined specimens, D�Confined, orD�Confined=D�Unconfined, for analyses based on both the analytical modeland POLLUTE are shown in Fig. 11 as a function of the concentra-
tion distribution used in the analysis (reservoir vs. soil) and the testduration (7 vs. 14 d). As indicated in Fig. 11, only the geometricmeans of the duplicated tests are shown since the comparisoninvolves results between different tests (i.e., between rows inTable 2) as opposed to within the same test (i.e., within a givenrow in Table 2).
As indicated in Fig. 11, two consistent trends exist in the meanD* values determined based on confined versus unconfined speci-mens. First, mean D�Confined is greater than mean D�Unconfined when res-ervoir concentrations were used for the analysis, regardless of testduration or method of analysis. Second, mean D�Confined is lower thanmean D�Unconfined when soil concentrations were used for the analy-sis, regardless of test duration or method of analysis. The extent towhich mean D�Confined is greater than mean D�Unconfined when reservoir
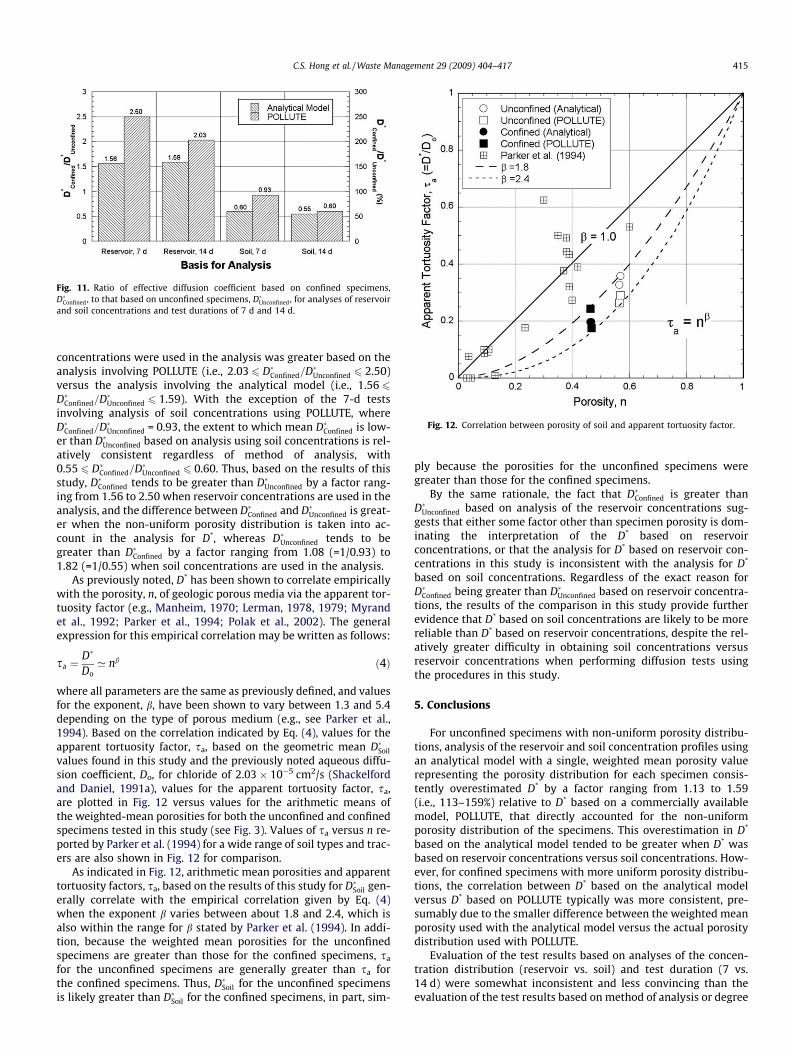
Fig. 11. Ratio of effective diffusion coefficient based on confined specimens,D�Confined, to that based on unconfined specimens, D�Unconfined, for analyses of reservoirand soil concentrations and test durations of 7 d and 14 d.
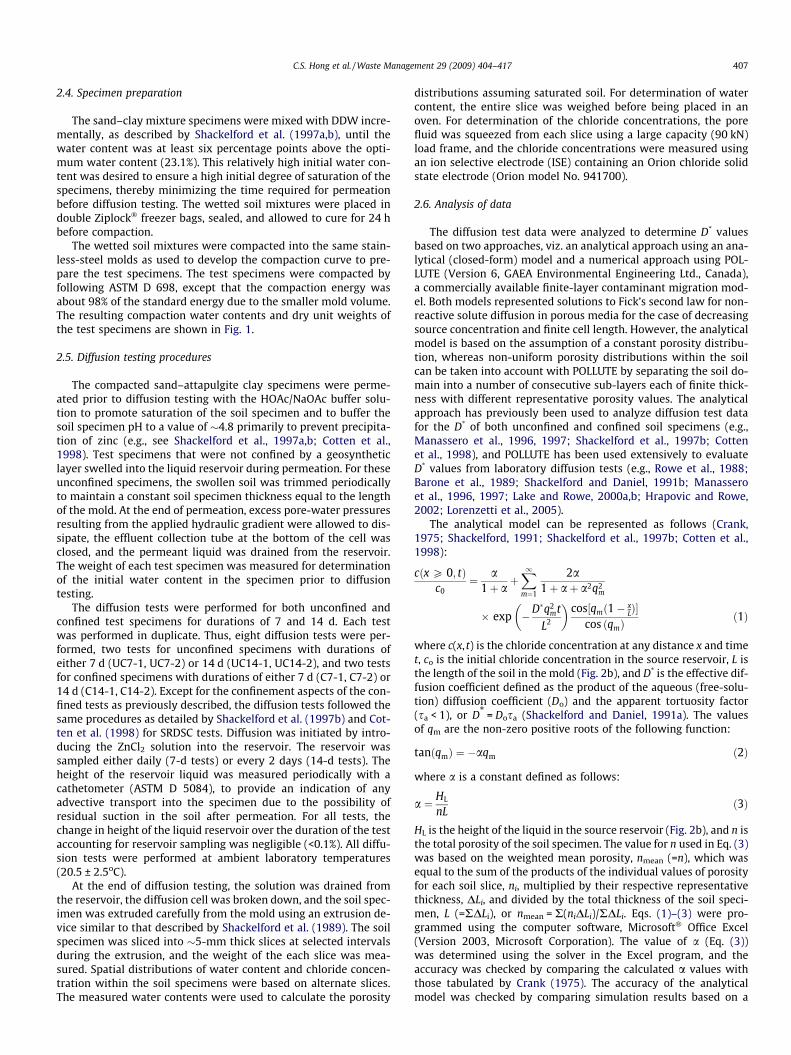
Fig. 12. Correlation between porosity of soil and apparent tortuosity factor.
C.S. Hong et al. / Waste Management 29 (2009) 404–417 415
concentrations were used in the analysis was greater based on theanalysis involving POLLUTE (i.e., 2.03 6 D�Confined=D�Unconfined 6 2.50)versus the analysis involving the analytical model (i.e., 1.56 6D�Confined=D�Unconfined 6 1.59). With the exception of the 7-d testsinvolving analysis of soil concentrations using POLLUTE, whereD�Confined=D�Unconfined = 0.93, the extent to which mean D�Confined is low-er than D�Unconfined based on analysis using soil concentrations is rel-atively consistent regardless of method of analysis, with0.55 6 D�Confined=D�Unconfined 6 0.60. Thus, based on the results of thisstudy, D�Confined tends to be greater than D�Unconfined by a factor rang-ing from 1.56 to 2.50 when reservoir concentrations are used in theanalysis, and the difference between D�Confined and D�Unconfined is great-er when the non-uniform porosity distribution is taken into ac-count in the analysis for D*, whereas D�Unconfined tends to begreater than D�Confined by a factor ranging from 1.08 (=1/0.93) to1.82 (=1/0.55) when soil concentrations are used in the analysis.
As previously noted, D* has been shown to correlate empiricallywith the porosity, n, of geologic porous media via the apparent tor-tuosity factor (e.g., Manheim, 1970; Lerman, 1978, 1979; Myrandet al., 1992; Parker et al., 1994; Polak et al., 2002). The generalexpression for this empirical correlation may be written as follows:
sa ¼D�
Do’ nb ð4Þ
where all parameters are the same as previously defined, and valuesfor the exponent, b, have been shown to vary between 1.3 and 5.4depending on the type of porous medium (e.g., see Parker et al.,1994). Based on the correlation indicated by Eq. (4), values for theapparent tortuosity factor, sa, based on the geometric mean D�Soil
values found in this study and the previously noted aqueous diffu-sion coefficient, Do, for chloride of 2.03 � 10�5 cm2/s (Shackelfordand Daniel, 1991a), values for the apparent tortuosity factor, sa,are plotted in Fig. 12 versus values for the arithmetic means ofthe weighted-mean porosities for both the unconfined and confinedspecimens tested in this study (see Fig. 3). Values of sa versus n re-ported by Parker et al. (1994) for a wide range of soil types and trac-ers are also shown in Fig. 12 for comparison.
As indicated in Fig. 12, arithmetic mean porosities and apparenttortuosity factors, sa, based on the results of this study for D�Soil gen-erally correlate with the empirical correlation given by Eq. (4)when the exponent b varies between about 1.8 and 2.4, which isalso within the range for b stated by Parker et al. (1994). In addi-tion, because the weighted mean porosities for the unconfinedspecimens are greater than those for the confined specimens, sa
for the unconfined specimens are generally greater than sa forthe confined specimens. Thus, D�Soil for the unconfined specimensis likely greater than D�Soil for the confined specimens, in part, sim-
ply because the porosities for the unconfined specimens weregreater than those for the confined specimens.
By the same rationale, the fact that D�Confined is greater thanD�Unconfined based on analysis of the reservoir concentrations sug-gests that either some factor other than specimen porosity is dom-inating the interpretation of the D* based on reservoirconcentrations, or that the analysis for D* based on reservoir con-centrations in this study is inconsistent with the analysis for D*
based on soil concentrations. Regardless of the exact reason forD�Confined being greater than D�Unconfined based on reservoir concentra-tions, the results of the comparison in this study provide furtherevidence that D* based on soil concentrations are likely to be morereliable than D* based on reservoir concentrations, despite the rel-atively greater difficulty in obtaining soil concentrations versusreservoir concentrations when performing diffusion tests usingthe procedures in this study.
5. Conclusions
For unconfined specimens with non-uniform porosity distribu-tions, analysis of the reservoir and soil concentration profiles usingan analytical model with a single, weighted mean porosity valuerepresenting the porosity distribution for each specimen consis-tently overestimated D* by a factor ranging from 1.13 to 1.59(i.e., 113–159%) relative to D* based on a commercially availablemodel, POLLUTE, that directly accounted for the non-uniformporosity distribution of the specimens. This overestimation in D*
based on the analytical model tended to be greater when D* wasbased on reservoir concentrations versus soil concentrations. How-ever, for confined specimens with more uniform porosity distribu-tions, the correlation between D* based on the analytical modelversus D* based on POLLUTE typically was more consistent, pre-sumably due to the smaller difference between the weighted meanporosity used with the analytical model versus the actual porositydistribution used with POLLUTE.
Evaluation of the test results based on analyses of the concen-tration distribution (reservoir vs. soil) and test duration (7 vs.14 d) were somewhat inconsistent and less convincing than theevaluation of the test results based on method of analysis or degree
416 C.S. Hong et al. / Waste Management 29 (2009) 404–417
of confinement. However, the use of reservoir concentrations gen-erally resulted in higher D* values than those based on soil concen-trations, and an increasing test duration tended to result in adecreasing D* value for the confined specimens. Both of thesetrends are consistent with those found in previous studies evaluat-ing D* for unconfined specimens.
Regardless of method of analysis, the D* based on unconfinedspecimens was greater than the D* based on confined specimenswhen soil concentrations were used in the analysis, and vice versawhen reservoir concentrations were used in the analysis. The factthat D* for unconfined specimens was greater than D* for confinedspecimens based on soil concentration profiles is consistent withthe established correlation between the porosity of the soil, n,and the apparent tortuosity factor for the diffusing solute, sa, withhigher n resulting in higher sa and higher D*. However, the fact thatD* for the confined specimens was greater than D* for the uncon-fined specimens when reservoir concentrations were used for theanalyses contradicts the same rationale, suggesting that someother factor aside from specimen porosity was prevalent in theinterpretation of the reservoir concentrations. Since both precipita-tion and advective mass transport were negligible in the tests con-ducted in this study, the nature of the reason that D* for theconfined specimens was greater than D* for the unconfined speci-mens based on reservoir concentrations is unknown. Nonetheless,the results of this study provide further evidence that D* based onsoil concentrations is likely to be more reliable than D* based onreservoir concentrations, despite the relatively greater difficultyin obtaining soil concentrations versus reservoir concentrationswhen performing diffusion tests based on the single reservoir,decreasing source concentration method.
Acknowledgments
Financial support for this study was provided by the US Na-tional Science Foundation (NSF) under Grant No. MSS-9122561.This support is gratefully acknowledged. The opinions expressedin this paper are solely those of the authors and are not necessarilyconsistent with the policies or opinions of NSF.
References
Airey, D.W., Carter, J.P., 1995. Properties of a natural clay used to contain liquidwastes. In: Acar, Y.B., Daniel, D.E. (Eds.), Geoenvironment 2000. ASCE, Reston,VA, pp. 58–774.
Barone, F.S., Yanful, E.K., Quigley, R.M., Rowe, R.K., 1989. Effect of multiplecontaminant migration on diffusion and adsorption of some domestic wastecontaminants in a natural clayey soil. Canadian Geotechnical Journal 26 (2),189–198.
Broderick, G.P., Daniel, D.E., 1990. Stabilizing compacted clay against chemicalattack. Journal of Geotechnical Engineering 116 (10), 1549–1567.
Cheung, S.C.H., 1989. Methods to measure apparent diffusion coefficients incompacted bentonite clays and data interpretation. Canadian Journal of CivilEngineering 16 (4), 434–443.
Cotten, T.E., Davis, M.M., Shackelford, C.D., 1998. Effect of test duration andspecimen length on diffusion testing of unconfined specimens. GeotechnicalTesting Journal 21 (2), 79–94.
Crank, J., 1975. The Mathematics of Diffusion, second ed. Oxford University Press.414pp.
Crooks, V.E., Quigley, R.M., 1984. Saline leachate migration through clay: acomparative laboratory and field investigation. Canadian Geotechnical Journal21 (2), 349–362.
Devlin, J.F., Parker, B.L., 1996. Optimum hydraulic conductivity to limit contaminantflux through cutoff walls. Ground Water 34 (4), 719–726.
Edil, T., 2003. A review of aqueous-phase VOC transport in modern landfill liners.Waste Management 23 (7), 561–571.
Foose, G., 2002. Transit-time design for diffusion through composite liners. Journalof Geotechnical and Geoenvironmental Engineering 128 (7), 590–601.
Goodall, D.C., Quigley, R.M., 1977. Pollutant migration from two sanitary landfillsites near Sarnia, Ontario. Canadian Geotechnical Journal 14 (2), 223–236.
Grathwohl, P., 1998. Diffusion in Natural Porous Media, Contaminant Transport,Sorption/Desorption and Dissolution Kinetics. Kluwer Academic Publ., Norwell,MA. 207pp.
Howell, J.L., Shackelford, C.D., Amer, N.H., Stern, R.T., 1997. Compaction of sand-processed clay mixtures. Geotechnical Testing Journal 20 (4), 443–458.
Hrapovic, L., Rowe, R.K., 2002. Intrinsic degradation of volatile fatty acids inlaboratory-compacted clayey soil. Journal of Contaminant Hydrology 58 (3–4),221–242.
Lake, C.B., Rowe, R.K., 2000a. Diffusion of sodium and chloride through geosyntheticclay liners. Geotextiles and Geomembranes 18 (2–4), 103–131.
Lake, C.B., Rowe, R.K., 2000b. Swelling characteristics of needlepunched thermallytreated geosynthetic clay liners. Geotextiles and Geomembranes 18 (2–4), 77–101.
Lerman, A., 1978. Chemical exchange across sediment–water interface. AnnualReview of Earth and Planetary Science 6, 281–303.
Lerman, A., 1979. Geochemical Processes Water and Sediment Environments. JohnWiley and Sons Inc., New York. 119pp.
Lorenzetti, R.J., Bartelt-Hunt, S.L., Burns, S.E., Smith, J.A., 2005. Hydraulicconductivities and effective diffusion coefficients of geosynthetic clay linerswith organobentonite amendments. Geotextiles and Geomembranes 23 (5),385–400.
Malusis, M.A., Shackelford, C.D., 2002. Coupling effects during steady-state solutediffusion through a semipermeable clay membrane. Environmental Science andTechnology 36 (6), 1312–1319.
Malusis, M.A., Shackelford, C.D., 2004. Predicting solute flux through a claymembrane barrier. Journal of Geotechnical and GeoenvironmentalEngineering 130 (5), 477–487.
Manassero, M., Pasqualini, E., 1993. Design and construction of the Barricallahazardous waste landfill. Geotechnical News 11 (4), 23–29.
Manassero, M., Pasqualini, E., and Sani, D., 1995. Properties of compacted clay forwaste containment barriers. In: Proceedings, Fifth International LandfillSymposium, Sardinia ‘95, S. Margherita di Pula, Cagliari, Italy, October 2–6,1995, CISA, Environmental Sanitary Engineering Centre, Cagliari, Italy, vol. II, pp.225–236.
Manassero, M., Pasqualini, E., Sani, D., 1997. Specific topics concerning laboratorysorption and diffusion tests. In: Proceedings, 14th International Conference onSoil Mechanics and Foundation Engineering, Hamburg, Germany, September 6–12, 1997, vol. I. A.A. Balkema Publ., Rotterdam, The Netherlands, pp. 153–156.
Manassero, M., Sani, D., Pasqualini, E., Shackelford, C.D., 1996. Diffusion andsorption parameters of a natural clay and a processed kaolin. In: Proceedings,2nd International Congress on Environmental Geotechnics, Osaka, Japan,November 5–8, 1996, vol. I. A.A. Balkema Publ., Rotterdam, The Netherlands,pp. 269–274.
Manheim, F.T., 1970. The diffusion of ions in unconsolidated sediments. Earth andPlanetary Science Letters 9 (4), 307–309.
Mott, H.V., Weber Jr., W.J., 1991a. Diffusion of organic contaminants through soil–bentonite cut-off barriers. Research Journal of the Water Pollution ControlFederation 63 (2), 166–176.
Mott, H.V., Weber Jr., W.J., 1991b. Factors influencing organic contaminantdiffusivities in soil–bentonite cut-off barriers. Environmental Science andTechnology 25 (10), 1708–1715.
Myrand, D., Gillham, R.W., Sudicky, E.A., O’Hannesin, S.F., Johnson, R.L., 1992.Diffusion of volatile organic compounds in natural clay deposits: laboratorytests. Journal of Contaminant Hydrology 10 (2), 159–177.
Olsen, S.R., Kemper, W.D., Van Schaik, J.C., 1965. Self-diffusion coefficients ofphosphorous in soil measured by transient and steady-state methods. SoilScience Society of America, Proceedings 29 (2), 154–158.
Parker, B.L., Gillham, R.W., Cherry, J.A., 1994. Diffusive disappearance of immiscible-phase organic liquids in fractured geologic media. Ground Water 32 (5), 805–820.
Polak, A., Nativ, R., Wallach, R., 2002. Matrix diffusion in northern Negev fracturedchalk and its correlation to porosity. Journal of Hydrology 268 (1–4), 203–213.
Rabideau, A., Khandelwahl, A., 1998. Boundary conditions for modeling transport invertical barriers. Journal of Environmental Engineering 124 (11), 1135–1139.
Rowe, R.K., Caers, C.J., Barone, F., 1988. Laboratory determination of diffusion anddistribution coefficients of contaminants using undisturbed clayey soil.Canadian Geotechnical Journal 25 (1), 108–118.
Rowe, R.K., Caers, C.J., Booker, J.R., Crooks, V.E., 1985. Pollutant migration throughclay soils. In: Proceedings, 11th International Conference on Soil Mechanics andFoundation Engineering, San Francisco. A.A. Balkema Publ., Rotterdam, TheNetherlands, pp. 1293–1298.
Rowe, R.K., Lake, C.B., Petrov, R.J., 2000. Apparatus and procedures for assessinginorganic diffusion coefficients for geosynthetic clay liners. GeotechnicalTesting Journal 23 (2), 206–214.
Ryan, C.R., 1987. Vertical barrier in soil for pollution. In: Woods, R.D. (Ed.),Geotechnical Practice for Waste Disposal ‘87. ASCE, Reston, VA, pp. 182–204.
Shackelford, C.D., 1988. Diffusion as a transport process in fine-grained barriermaterials. Geotechnical News 6 (2), 24–27.
Shackelford, C.D., 1989. Diffusion of contaminants through waste containmentbarriers. Transportation Research Record No. 1219, Transportation ResearchBoard, National Research Council, Washington, DC, pp. 169–182.
Shackelford, C.D., 1990. Transit-time design of earthen barriers. EngineeringGeology 29 (1), 79–94.
Shackelford, C.D., 1991. Laboratory diffusion testing for waste disposal – a review.Journal of Contaminant Hydrology 7 (3), 177–217.
Shackelford, C.D., 1994. Waste–soil interactions that alter hydraulic conductivity.In: Daniel, David E., Trautwein, Stephen J. (Eds.), Hydraulic Conductivity andWaste Contaminant Transport in Soil, ASTM STP, vol. 1142. ASTM, WestConshohoken, PA, pp. 111–168.
C.S. Hong et al. / Waste Management 29 (2009) 404–417 417
Shackelford, C.D., Cotten, T.E., Davis, M.M., Strauss, S.H., Rohal, K.M., 1997a.Characterizing zinc migration through a high pH sand–clay mixture. In: XIVInternational Conference on Soil Mechanics and Foundation Engineering,Hamburg, Germany, September 6–12. vol. 3. Balkema, Rotterdam, pp. 1935–1938.
Shackelford, C.D., Cotten, T.E., Rohal, K.M., Strauss, S.H., 1997b. Acid buffering a highpH soil for zinc diffusion. Journal of Geotechnical and GeoenvironmentalEngineering 123 (3), 260–271.
Shackelford, C.D., Daniel, D.E., 1991a. Diffusion in saturated soil: I. Background.Journal of Geotechnical Engineering 117 (3), 467–484.
Shackelford, C.D., Daniel, D.E., 1991b. Diffusion in saturated soil: II. Results forcompacted clay. Journal of Geotechnical Engineering 117 (3), 485–506.
Shackelford, C.D., Daniel, D.E., Liljestrand, H.M., 1989. Diffusion of inorganicchemical species in compacted clay soil. Journal of Contaminant Hydrology 4(3), 441–473.
Thoma, G.J., Reible, D.D., Valsaraj, K.T., Thibodeaux, L.J., 1993. Efficiency of cappingcontaminated sediments in situ. 2. Mathematics of diffusion – adsorption in thecapping layer. Environmental Science and Technology 27 (12), 2412–2419.
Tobin, W.R., Wild, P.R., 1986. Attapulgite: a clay liner solution? Civil Engineering 56(2), 56–58.
Toupiol, C., Willingham, T.W., Valocchi, A.J., Werth, C.J., Krapac, I.G., Stark, T.D.,Daniel, D.E., 2002. Long-term tritium transport through field-scale compactedsoil liner. Journal of Geotechnical and Geoenvironmental Engineering 128 (8),640–650.
Van Rees, K.C.J., Sudicky, E.A., Rao, P.S.C., Reddy, K.R., 1991. Evaluation of laboratorytechniques for measuring diffusion coefficients in sediments. EnvironmentalScience and Technology 25 (9), 1605–1611.
Verga, F., Manassero, M., 1994. Mineralogical characterization and laboratory testsfor the determination of the diffusion parameters of the Pianfei silt. In:Proceedings, Conference on the Role of Fluids in Geotechnical EngineeringProblems, Mondovi (CN), Italy, September 6–7, 1994, National Board ofResearch, Sect. III, 109–122 (in Italian).
Wang, X.Q., Thibodeaux, L.J., Valsaraj, K.T., Reible, D.D., 1991. Efficiency of cappingcontaminated sediments in situ. 1. Laboratory scale experiments on diffusion –adsorption in the capping layer. Environmental Science and Technology 25 (9),1578–1584.
Willingham, T.W., Werth, C.J., Valocchi, A.J., Krapac, I.G., Toupiol, C., Stark, T.D.,Daniel, D.E., 2004. Evaluation of multidimensional transport through a field-scale compacted soil liner. Journal of Geotechnical and GeoenvironmentalEngineering 130 (9), 887–895.