Embed Size (px)
Citation preview

Non-linear Process Control 1
NON-LINEAR SYSTEM CONTROL 1. Introduction In practice, all physical processes exhibit some non-linear behaviour. Furthermore, when a process shows strong non-linear behaviour, a linear model may be inadequate; a non-linear model will be more realistic. Unfortunately, this improved closeness to reality is attained at a cost: the convenience and simplicity offered by the linear model is sacrificed. Since many processes exhibit only mildly non-linear dynamic behaviour, linear models can reasonably approximate them. However, even for such systems, the behaviour over a wide range of operating conditions will be noticeably non-linear, and no single linear model is able to represent such behaviour adequately.
The issue of analysing the dynamic behaviour of processes represented by non-linear models is the main concern in this topic; this is motivated by the fact that situations do arise when it is undesirable to neglect the inherent nonlinearities of a process. The objective here is to provide an introduction of how we can expect to carry out dynamic analysis and control when the process models are non-linear.
The nature of non-linear problems is that they are not as easily amenable to the general complete treatment which are possible with linear systems. To keep non-linear dynamic analysis on a realistic and practical level usually involves trade-offs between accuracy and simplicity.
There are two basic properties that characterize the behavior of a linear system:
Superposition:
the response of a process to input 1 1is I R and the response to 2 2is I R , then according to the principle of superposition, the response to 1 2 1 2+ is I I R R+ if the system is linear.
In general, this principle states that the response of a linear system to a sum of N inputs is the same as the sum of the responses to the individual inputs.
As a result of this principle, for example, the response of a linear system to step change of magnitude A is exactly the same as A times the system's unit step response.
Independence of Dynamic Response Character and Process Conditions
The dynamic character of a linear process response to an input change is independent of the specific operating conditions. I.e, identical input changes implemented at different operating steady-state conditions will give rise to output changes of identical magnitude and dynamic character.
The principle of superposition also means that from the same initial steady-state conditions, the output change observed in response to a certain positive input change will be a perfect mirror image of the output observed in response to a negative input change of the same magnitude.
According to this property, the step response of a linear system is the same regardless of the actual initial value of the output or input variable, or, the direction of the input change, the "step down" giving rise to a perfect mirror image of the "step up" response.
A nonlinear system does not exhibit any of these properties:
KNU/EECS/ELEC835001 Dr. Kalyana Veluvolu

Non-linear Process Control 2
the response to a sum of inputs is not equal to a sum of the individual responses;
the response to a step change of magnitude A is not equal to A times the unit step response;
the magnitude and dynamic character of the step response are dependent on the initial steady-state operating conditions;
In particular, the ultimate response of the nonlinear system to a sinusoidal input function is not a perfect sinusoidal output function.
The model equations that will represent the dynamic behavior of such systems adequately must necessarily contain nonlinear terms; and immediately, the convenience of being able to completely characterize the system's dynamic behavior by the linear transfer function is lost.
1.1 Methods of Dynamic Analysis of Nonlinear Systems
Since the process models are almost always nonlinear, the following major questions we wish to ask ourselves are:
How do we analyze the dynamic behavior of processes when they are represented by nonlinear models? Is there a technique for analyzing the dynamic behavior of nonlinear systems that can be generalized to cover a wide variety of such systems?
The answers to these questions form the basis of the material covered in this Section
1. The rigorous analytical approach
2. Numerical analysis
3. Approximate linearization
4. Exact linearization by variable transformation
Each of these method is briefly discussed below:
Rigorous Analytical Techniques
It is well known that very few nonlinear problems can be solved formally, primarily because there is no general theory for the analytical closed-form solution of nonlinear equations. Nevertheless, there are a few analytical method for analyzing the dynamic behavior of nonlinear systems; for example, classical method and the techniques of Liapunov, Hopf, Golubitsky, etc. These techniques will allow one to characterize qualitatively the dynamics of nonlinear systems.
However, these approaches find limited use in process control practice; thus a detailed discussion of their salient features has been excluded from the context. Perhaps, with further research, the analytical treatment of nonlinear systems will evolve to a state where it will be more useful for process control.
Numerical Solutions and Computer Simulations
The first step in the analysis of a system dynamic behavior is the solution of the modeling equation; and the models, are usually in the form of differential equations (ordinary or partial). For linear systems, analytical solutions are possible. For nonlinear system, instead of having an analytical expression that represents the behavior of the process output over time, we make use of numerical values for the process output at specific point of time.
KNU/EECS/ELEC835001 Dr. Kalyana Veluvolu

Non-linear Process Control 3
Note that the recursive calculations required by this procedure are best carried out with the aid of a digital computer. There are many special subroutines available for the numerical integration of differential equations, so that details of this procedure are usually handled by the software.
Variable Transformation
On the basis of the fact that linear systems are easier to analyze than nonlinear ones, it seems attractive to consider the following proposition:
If a system is nonlinear in its original variables is it possible that it will be linear in some transformations of these original variables?
If this were possible, the general strategy for dynamic analysis would then involve first carrying out this transformation, then performing dynamic analysis on the linear, transformed version, and finally transforming the results back to the original variables.
Linearization
In the contest of process dynamic and control, linearization is a term used in general for the process by which a nonlinear system is approximated by a linear process model.
The most popular technique for obtaining the linear approximation is based on Taylor series expansions of the nonlinear aspects of the process model.
Summary: The first two approaches are clearly of limited control applications. The technique of numerical analysis, even though straightforward, provides limited information because it is usually impossible to infer anything of a general form from the numerical response of a process system. It provides specific numerical answers to specific problems; it is not possible to obtain general solutions in terms of arbitrary parameters and unspecified inputs in order to understand the process behavior in a more general fashion, as was the case with linear systems.
The question now is: can we ever achieve this desirable objective of being able to analyze, in a general fashion, the behavior of an arbitrary nonlinear system, in response to unspecified inputs? The answer is yes: but at a cost.
Observe that the nonlinear process model can be linearized around a particular steady-state value, and with this linearized approximation of the true nonlinear model, we can obtain fairly general results regarding the process behavior, but these will only be approximate, never completely representing true behavior accurately.
1.2 Nonlinear Control
The objective here is to examine the main aspects of the rapidly developing subject of nonlinear process control, and to provide a summary of the various alternative techniques available for designing control systems, including those that explicitly recognize the nonlinearities of the process. Control system may be carried out for nonlinear systems along the lines indicated by any of the following four schemes.
Local Linearization
This involves linearizing the modeling equations around a steady-state operating condition and applying linear control systems design results. It is obvious that the controller performance will deteriorate as the process moves further away from the steady state around which the model was linearized, but quite often, adequate controllers can be designed this way.
KNU/EECS/ELEC835001 Dr. Kalyana Veluvolu

Non-linear Process Control 4
Local Linearization with Adaptation
This scheme seeks to improve on Scheme 1 by recognizing the presence of nonlinearities and consequently providing the controller a means for systematically adapting whenever the adequacy of the linear approximation becomes questionable.
Exact Linearization by Variable Transformations
This is a scheme by which a system model that is nonlinear in its original variables is converted into one that is exactly linear in a different set of variables by the use of appropriate nonlinear transformations; controller design may then be carried out for the transformed system with greater facility since it is now linear.
"Special Purpose" Procedures
These are usually custom made for specific processes, or specific types of nonlinearities.
Some of the factors that typically determine which of these approach one should adopt are now summarized below:
The specific nature of the nonlinear control problem at hand; the nature of the process, and the control system performance objectives.
The amount of time available for carrying out the design.
The type of hardware available for implementing the controller.
The availability and quality of the process model.
2. Linearization While there may be an extensive understanding of the behavior of non-linear processes, satisfactory methods for their control are still evolving. The prevalent approach to date has been to use a model of the process linearised about a steady-state operating point to design a linear controller such as the classical PID algorithm. This is only an approximate solution.
The General Linearization Problem
Consider the general nonlinear process model:
( , )
( )
dx f x udty h x
=
= (2.1)
where ( , )f ∗ ∗ is an arbitrary nonlinear function of the two variables, x, the process state variable, and u the process input; ( )h ∗ is another nonlinear function relating the process output, y to the process state variable x .
The linearized approximation of this very general nonlinear model (2.1) may now be obtained by carrying out a Taylor series expansion of the nonlinear functions around the point ( , )s sx u , This gives:
KNU/EECS/ELEC835001 Dr. Kalyana Veluvolu

Non-linear Process Control 5
( ) ( )
( )
, ,
( , ) ( ) ( ) higher order terms
( ) ( ) higher order terms
s s s s
s
s s s sx u x u
s sx
dx f ff x u x x u udt x u
hy h x x xx
∂ ∂⎛ ⎞ ⎛ ⎞= + − + − +⎜ ⎟ ⎜ ⎟∂ ∂⎝ ⎠ ⎝ ⎠
∂⎛ ⎞= + − +⎜ ⎟∂⎝ ⎠
Ignoring the higher order terms now gives the linear approximation:
( ) ( )
( )
( , ) , ( ) , ( )
( ) ( )
s s s s s s s s
s s s
dx f x u a x u x x b x u u udty h x c x x x
= + − + −
= + − (2.2)
where
( )( )
( )( )
( )( )
,
,
,
,
s s
s s
s
s sx u
s sx u
sx
fa x ux
fb x uu
hc xx
∂⎛ ⎞= ⎜ ⎟∂⎝ ⎠
∂⎛ ⎞= ⎜ ⎟∂⎝ ⎠
∂⎛ ⎞= ⎜ ⎟∂⎝ ⎠
It is customary to express the equation in terms of deviation variables:
( )( )( ) ( )
s
s
s s
x x xu u uy y y y h x
= −= −= − = −
%
%
%
If addition to this, the linearization point ( , )s sx u is chosen to be a steady-state operating condition, then observe from the definition of a steady state that both sdx dt and ( , )s sf x u will be zero. (2.2) then becomes
dx ax budt
y cx
= +
=
%% %
% %
(2.3)
where for simplicity, the arguments have been dropped from a, b, and c. A transform-domain transfer function model may now be obtained by the usual procedure; the result is:
( ) ( , )( ) ( )( , )
s s s
s s
c x b x uy s u ss a x u
⎡ ⎤= ⎢ ⎥−⎣ ⎦
% % (2.4)
With the transfer function as indicated in the square brackets. This transfer function should provide an approximate linear model valid in a region close to ( , )s sx u
The principles involved in obtaining approximate linear models by linearization may now be summarized as follows:
KNU/EECS/ELEC835001 Dr. Kalyana Veluvolu

Non-linear Process Control 6
Identify the functions responsible for the nonlinearity in the system model.
Expand the nonlinear function as a Taylor series around a steady state, and truncate after the first-order term.
Reintroduce the linearized function into the model; simplify, and express the resulting model in terms of deviation variables.
The application of these principles to specific problems is usually much simpler can be demonstrated by examples.
Example: linearization of a nonlinear model involving a nonlinear function of a single variable.
Consider a Liquid Level System shown as in Fig. 2.1.
Fig. 2.1 Liquid Level System
Material balance equations to Fig. 2.1 yield
idhA F Fdt
= − (2.5)
But
F c h= (2.6)
where c is flow resistance. Combining (2.5) and (2.6), we have
idhA F c hdt
= − (2.7)
This is a nonlinear equation. To linearise this equation, one can use Taylor’s series. That is, around h=hs,
1 1 12 2 21( ) ( ) ( ) ( )
2s s sf h h h h h h h higher order terms−
= = ≅ + − + (2.8)
The approximation is shown as in Fig. 2.2
KNU/EECS/ELEC835001 Dr. Kalyana Veluvolu

Non-linear Process Control 7
Fig. 2.2 Nonlinear Function and Linearized Approximation
Substitute (2.8) into (2.7) and noting that the steady state flow 12( )is sF c h=
we have
dy Ku ydt
τ = − (2.9)
where 122( ) ;shA
cτ = i isu F F= − ; sy h h= −
From (2.9), we get
( ) ( )1
KY s U ssτ
=+
(2.10)
The linearised system is given in Fig. 2.3.
Fig. 2.3 Linearised Liquid level system (about h=hs)
Linear controller can now be applied to the linearised system of Fig. 2.3.
Fig. 2.4 shows a feedback loop where a Proportional and Integral (PI) controller controls the lineraised liquid level system of Fig. 2.3. Notice that the linearised system is an approximation since it is derived for a particular level h=hs. If the level changes, K and τ will change with it as well.
Fig. 2.4 Feedback Control of (approximately) linearised system
KNU/EECS/ELEC835001 Dr. Kalyana Veluvolu

Non-linear Process Control 8
1c
c
ggcr gg=
+ (2.11)
1 0cgg+ =
where
1; (1 )1 c c
I
Kg g Ks sτ τ
= = ++
The characteristic equation can be put as
2 (1 ) 0c c
I
KK KKs sτ ττ
++ + =
Assuming the closed loop poles to be at the locations -2±2j, which correspond to the roots of the characteristic equation, for a linearised system with K= 2.38 and τ= 0.59, we have Kc= 0.58 and τI= 0.29.
Example: Linearization of a nonlinear model involving a nonlinear function of two variables.
The dynamic behavior of the liquid level h in the conical storage tank system shown in Figure 2.5 can be shown to be represented below, where now the cross section area of the tank is given by:
22 RhA r
Hπ π ⎛ ⎞= = ⎜ ⎟
⎝ ⎠
so that the tank model becomes: 3/ 2
2iFdh h
dt hα β −= − (2.12)
vhere and α β are parameters defined by: 21 , H c
Rα β α
π⎛ ⎞= =⎜ ⎟⎝ ⎠
Here, Fi is, again, the inlet flowrate, the manipulated variable. Obtain an approximate linear model for this system.
KNU/EECS/ELEC835001 Dr. Kalyana Veluvolu

Non-linear Process Control 9
Fig. 2.5 Conical storage tank system
Solution
The process model (2.12) has two types of nonlinear functions: Fih-2, a product of two functions, and 3/ 2h− . We shall have to linearize each of these functions separately around the steady state ( , )s ish F .
The linearization of 2 ( , ) i if h F F h−= proceeds as follows:
( , ) ( , )
( , ) ( , ) ( ) ( ) higher order termss is s is
i s is s i ish F i h F
f ff h F f h F h h F Fh F
⎛ ⎞∂ ∂⎛ ⎞= + − + − +⎜ ⎟⎜ ⎟∂ ∂⎝ ⎠ ⎝ ⎠
whereupon carrying out the indicated operations now gives: 3 2( , ) ( , ) 2 ( ) ( )i s is is s s s i isf h F f h F F h h h h F F− −= − − + − (2.13)
if we ignore the higher order terms.
The steps involved in linearizing the second nonlinear term are no different from those illustrated in the previous example; the result is:
523/ 2 3/ 2 3( ) ( ) ( )
2s s sh h h h h−
− −= − − (2.14)
We may now introduce these expressions in place of the corresponding nonlinear terms in (2.12). Recalling that under steady-state conditions 1/ 2
is sF hα β= , and introducing the deviation variables ( ) and ( )s i isy h h u F F= − = − , the approximate linear model is obtained upon further simplification as:
dy y Kudt
τ + = (2.15)
where the steady-state gain, and time constant associated with this approximate linear model, are given by:
1/ 2 1/ 22 2s sK h h
cαβ
= =
and
5/ 22shτ
β=
If we desire an approximate transform-domain transfer function model, Laplace transformation again gives (2.10). Note that the approximate linear model for the conical tank has the same process gain, K, as for the cylindrical tank; but the time constant is a much stronger function of the liquid level hs.
Some important points to note about the results of these two illustrative examples are the following:
KNU/EECS/ELEC835001 Dr. Kalyana Veluvolu

Non-linear Process Control 10
In each case, the approximate transfer function model is of the first-order process, with the time constants, and steady-state gain values dependent on the specific steady state around which the system model was linearized.
Using such approximate transfer function models will give approximate results which are good in a small neighborhood around the initial steady state; farther away from this steady state, the accuracy of the approximate results becomes poorer.
Using such approximate models, we are able to get a general (even if not 100% accurate) idea about the speed and magnitude of response to expect from any arbitrary nonlinear system. Numerical analysis can give more accurate information, but only about the specific response to a specific input, starting from a specific operating condition for a specific set of parameters.
Let us conclude with a comparison of the responses of the nonlinear model and an approximate linear model for the conical tank of the Example. Suppose that 2, 1, 0.5 cα β= = = so that the nonlinear model is:
3/ 22
2 iFdh hdt h
−= −
while the approximate linear model has the transfer function 1/ 2
5/ 2
4( ) ( )2 1
s
s
hY s U sh s
=+
which in the time domain is
[ ]{ }1/ 25/ 2
1 ( ) 42 s s i is
s
dh h h t h F Fdt h
= − + −
The step response (up and down) for these models is shown in Figure 2.6 for steps of two different magnitudes. The response to a sine wave input of two different amplitudes is shown in Figure 2.7.
For small magnitude step inputs and small amplitude sine waves, the linear model is a good approximation of the nonlinear model;
For the large amplitude inputs the linear model predictions deviate somewhat from the nonlinear model behavior.
The distinct differences in nonlinear response for a step up and step down.
KNU/EECS/ELEC835001 Dr. Kalyana Veluvolu

Non-linear Process Control 11
Fig. 2.6 Response of models (2.15)/(2.12) for step inputs up/down 0.05iF∆ = ± and 0.15iF∆ = ±
Fig. 2.7 Response of models (2.15)/(2.12) to sine wave inputs amplitudes 0.05, 0.15A = .
However, in some situations this may be inadequate (e.g. for the control of highly non-linear processes or batch systems) so the development of nonlinear controllers has featured prominently in process control in the last decade. In the following Sections, we will give an overview of some of the more popular non-linear methodologies that have been proposed for use within the process control industries including, Adaptive Control approaches; Globally Linearising Control (GLC) and Generic Model Control (GMC).
3. Adaptive Controls A controller designed for the systems in the level control example in last section using the approximate transfer function model will function acceptably as long as the level, h, is maintained at, or close to, the steady-state value hs. Under these conditions (h -hs) will be small enough to make the linear approximation adequate. However, if the level is required to change over a wide range, the farther away from hs the level gets, the poorer the linear approximation.
KNU/EECS/ELEC835001 Dr. Kalyana Veluvolu

Non-linear Process Control 12
Observe also from the approximate transfer function model in (2.10) that the apparent steady-state gain and time constant are dependent on the steady state around which the linearization was carried out. This implies that in going from one steady state to the other, the approximate process parameters will change.
The main problem with applying the classical approach under these circumstances is that it ignores the fact that the characteristics of the approximate model must change as the process moves away from hs if the approximate model is to remain reasonably accurate. The immediate implication is that any controller designed on the basis of this changing approximate model must also have its parameters adjusted if it is to remain effective.
In the adaptive control scheme, the controller parameters are adjusted (in an automatic fashion) to keep up with the changes in the process characteristics. We know intuitively that, if properly designed, this scheme will be a significant improvement over the classical scheme.
There are various types of adaptive control schemes, differing mainly in the way the controller parameters are adjusted. The three most popular schemes are: scheduled adaptive control, model reference adaptive control, and self-tuning controllers. We shall discuss each of these in the following subsections.
3.1 Scheduled Adaptive Control
A scheduled adaptive control scheme is one in which, as a result of a priori knowledge and easy quantification of what is responsible for the changes in the process characteristics, the commensurate changes required in the controller parameters are programmed (or scheduled) ahead of time. This type of adaptive control, sometimes referred to as gain scheduling, is illustrated by the block diagram in Fig. 3.1, which is an improvement over that of Fig.2.3.
Fig. 3.1 Scheduled Adaptive Controller
Continuing with the example of liquid level system, Fig. 2.3 represents control of linearised approximation of the original non-linear system. The approximation is in the sense that the process transfer function g only holds good for a particular level of the liquid in the tank. If the level h changes drastically, the transfer function g may fail to represent the original system even approximately. Then there is a need to change the transfer function g to account for the change in level h. One way of doing this is through Scheduled adaptive controller shown in Fig. 3.1.
From (2.10), it is seen that both K and τ are affected by the liquid level h. The effect on K is more prominent since it affects the system gain. The effect on the time constant is less apparent and not so prominent. Thus we only compensate for the effect of liquid level h on K. This is done in a way that the overall system gain KKc is constant. Notice that, from (2.10),
122( )hsK
c=
KNU/EECS/ELEC835001 Dr. Kalyana Veluvolu

Non-linear Process Control 13
So, to keep K Kc = K0 (a constant),
12
0 0
2( )s
cK K c
K K h= =
This means that the controller gain Kc has to be adjusted inversely as the square root of the liquid level h. This is what will be done by the block represented as “Parameter adjustment” in Fig. 3.1.
More generally, if K = K(t), that is, the process gain changes with time, then to keep the product KKc constant it is necessary to adjust Kc inversely with respect to K(t) , i.e.,
Kc ∝ 1/ K(t)
K(t) itself can be determined periodically by inserting a signal u into the process and monitoring the process output y.
In practice, it is often possible to find measured variables that correlate well with changes in process dynamics. These variables can be used to change the controller parameters, using a pre-calculated schedule. The controller parameters are computed off-line for several operating conditions and stored in memory. Gain scheduling can also be based on nonlinear transformations such that the transformed system does not depend on the operating conditions.
It is difficult to give general rules. Each case must be treated individually. The key question is to determine the auxiliary variables to be used as scheduling variables. It is necessary to have a good insight into the dynamics of the process if gain scheduling is going to be used. The controller can be automatically tuned at different operating points and the resulting tuning parameters can be saved and a schedule created.
Example: Fig. 3.2 shows different valve charactrestic, if the scheduling variable in a level control system is the opening of a control valve, then a schedule may look as in Table 3.1:
Fig. 3.2 Different valve charactrestic
Table 3.1 Scheduled control for Valve
Valve opening Kp Ti Td 0.00-0.15 1.7 95 23 0.15-0.22 2 89 22 0.22-0.35 2.9 82 21 0.35-1 4.4 68 17
Example: The nonlinearity of the valve is assumed to be:
KNU/EECS/ELEC835001 Dr. Kalyana Veluvolu

Non-linear Process Control 14
4( )v f u u= =
Fig. 3.3. Gain Schedule for Nonlinear actuator.
Let 1f − be an approximation of the inverse of the valve characteristic. To compensate for the non-linearity, the output of the controller fed through this function before it is applied to the valve. This gives the relation:
1( ) ( ( ))v f u f f c−= =
where c is the output of the PI controller.
Assume that 4( )f u u= is approximated by two lines as shown in Fig. 3.4. One from (0,0) to (1.3,3) and the other from (1.3, 3) to (2,16).
Fig. 3.4 A Crude Approximation of Valve Characteristic
Then we have:
1 0.433 0 3ˆ ( )0.0538 1.139 3 16
c cf c
c c− ≤ ≤⎧
= ⎨ + ≤ ≤⎩
Simulation Results
KNU/EECS/ELEC835001 Dr. Kalyana Veluvolu

Non-linear Process Control 15
Fig. 3.5 Output Response without Gain Scheduling
Fig. 3.6 Output Response with Gain Scheduling
3.2 Model Reference Adaptive Controller (MRAC)
The key component of the MRAC scheme is the reference model that consists of a reasonable closed-loop model of how the process should respond to a set-point change. This could be as simple as a reference trajectory, or it could be a more detailed closed-loop model. The reference model output is compared with the actual process output and the observed error mε is used to drive some adaptation scheme to cause the controller parameters to be adjusted so as to reduce
mε to zero. The adaptation scheme could be some control parameter optimization algorithm that reduces the integral squared value of mε or some other procedure. This is an adaptive control technique where the performance specifications are given in terms of a model. The model represents the ideal response of the process to a command signal. The controller has two loops:
The inner loop, which is an ordinary feedback loop consisting of the process and the controller.
The outer loop, which adjust the controller parameters in such a way that the error me y y= − is small (not trivial)
KNU/EECS/ELEC835001 Dr. Kalyana Veluvolu

Non-linear Process Control 16
Fig. 3.7 Model Reference Adaptive Control Scheme
Approaches: Gradient approach
Tracking error:
me y y= − (3.1a)
Introduce the cost function J:
( ) 212
J eθ = (3.1b)
Where θ is a vector of controller parameters. Change the parameters in the direction of the negative gradient of 2e
d dJ deedt dt dtθ γ γ= − = − (3.1c)
where ∂e/∂θ is called the sensitivity derivative. It indicates how the error is influenced by the adjustable parameters θ.
Example: MRAS of a fist order system
Process:
dy ay budt
= − +
Model:
mm m m c
dy a y b udt
= − +
Controller:
1 2cu u yθ θ= −
Closed loop system:
KNU/EECS/ELEC835001 Dr. Kalyana Veluvolu

Non-linear Process Control 17
1 2 2 1( ) ( )c cdy ay bu ay b u y a b y b udt
θ θ θ θ= − + = − + − = − + +
Ideal controller parameters for perfect model-following:
0 01 2; m mb a a
b bθ θ −
= =
Derivation of adaptive law
Error:
me y y= −
where
1
2c
by us a b
θθ
=+ +
Sensitivity derivatives:
( )
1 22
12
2 22
c
c
e b us a b
e b bu ys a bs a b
θ θ
θθ θθ
∂=
∂ + +
∂= − = −
∂ + ++ +
Approximate
2( ) ( )ms a b s aθ+ + ≈ +
then the MIT rule dθ/dt = - γ' e ∂e/ ∂θ, may be written as follows
'11
'22
mc c
m m
m
m m
d b au e u edt s a s s a
d b ay e y edt s a s s a
θ γγ θ
θ γγ θ
⎛ ⎞ ⎛ ⎞−⎛ ⎞= − ⇒ =⎜ ⎟ ⎜ ⎟⎜ ⎟+ +⎝ ⎠⎝ ⎠ ⎝ ⎠⎛ ⎞ ⎛ ⎞⎛ ⎞= ⇒ =⎜ ⎟ ⎜ ⎟⎜ ⎟+ +⎝ ⎠⎝ ⎠ ⎝ ⎠
where γ = γ' b / am
Block diagram
KNU/EECS/ELEC835001 Dr. Kalyana Veluvolu

Non-linear Process Control 18
Fig. 3.8 Model Reference Adaptive Control for the example
Simulation: a =1, b = 0.5, am = bm = 2, uc : square wave with period 20 s and values 1 and 0.
KNU/EECS/ELEC835001 Dr. Kalyana Veluvolu

Non-linear Process Control 19
3.3 Self-tuning Adaptive Controller
Self-tuning adaptive controllers such as the self-tuning regulator differ from the model-reference adaptive controller in basic principle. The self-tuning controller, illustrated by the block diagram in Figure 3.8, makes use of the process input and output to estimate recursively, on-line, the parameters of an approximate process model. Thus as the actual non-linear process changes operating region or changes with time, an approximate linear model is continuously updated with new parameters. The updated model is then used in a prespecified control system design procedure to generate updated controller parameters. The controller could be a PID controller or some of the model-based controllers.
Fig. 3.8. Self-Tuning Control Scheme
Since the model estimated determines the effectiveness of the controller, the most essential feature of the self-tuning controller is reliable and robust model identification. This requires a good parameter estimation algorithm and procedures for ensuring adequate dynamic experimental design.
Example: Process is assumed to have the transfer function of the form, say,
( )1
sKeg ss
α
τ
−
=+
Let the controller be a PI controller of the form
1(1 )c cI
g Ksτ
= + (3.2)
The controller parameters are typically set according to a tuning formula, such as (Minimum ITAE tuning rule for set-point tracking),
0.9160.556 ( )
1.03 0.165( )1
c
I
KK
τα
ατ
τ τ
=
−=
(3.3)
Notice that the controller parameters Kc and τI are adjusted in terms of the process parameters K, α, and τ. Since the process model parameters are continuously changing as the process operating (load) conditions are changed, the parameter estimator will periodically update the
KNU/EECS/ELEC835001 Dr. Kalyana Veluvolu

Non-linear Process Control 20
parameters K, α, and τ. Based on this updated parameter values, the controller settings Kc and τI are recalculated using (3.3). The new controller parameters are then adjusted on the controller as shown in Fig. 3.8.
3.4 Comparison of Adaptive Controllers
There is a clear differentiation in the philosophy behind each of the three adaptive controllers discussed above. Let us use an analogy to illustrate. When parents send a child off to college, they usually try to provide them with “adaptive controllers” to help them deal with the unknown situations they will counter out on their own. We can easily recognize three types of the adaptive controllers in use:
Scheduled Adaptive Control is used by parents who use a list of “if this occurs, do this” instances. This means they assume they can anticipate and enumerate all the situations that can occur and specify programmed remedies. No thinking or decision making is expected of their children. Thus scheduled adaptive control will work when all possibilities are known in advance.
Model-Reference Adaptive Control is employed by parents when they have a good role model (such as an older sibling) available. They only tell their child to emulate the behavior of the role model; i.e., “do whatever they do in the same situation”. In this case there is some limited decision making on the part of the child, but it is constrained to deciding how best to emulate their role model. So long as such emulation is possible, then MRAC works well.
Self-tuning Adaptive Control is the strategy recommended by parents, have a little more confidence in the thinking ability of their children. While they do not recommend complete independence of action, they ask that the child carefully evaluate the situation based on the data at hand (model building) and then based on their judgment of the situation, take action based on fixed principles.
Self-tuning adaptive control allows the most freedom to the controller and thus provides the broadest range of adaptation to unknown situations; however, it is also the most dangerous, potentially unstable, form of adaptive control because poor model identification (poor assessment of situations) can lead to unstable systems and process runaway.
All these types of adaptive controllers are commercially available and have enjoyed a certain level of industrial acceptance. By their very nature, adaptive controllers can be applied to any system for which the process parameters vary with time; they are also applicable to other systems for which these parameter variations are not due to nonlinearities per se, but to otherphysical phenomena such as fouling in heat exchangers, catalyst decay in catalytic reactors, etc.
4. Variable Transformations The idea of variable transformation can be exploited for nonlinear controller design in the following manner:
Obtain an equivalent linear system by variable transformation.
Design a linear controller for the transformed system, in terms of the new variables.
KNU/EECS/ELEC835001 Dr. Kalyana Veluvolu

Non-linear Process Control 21
Implement the controller in terms of the original variables of the nonlinear system (such a controller will be nonlinear).
Several different methods have been reported in the literature for carrying out such variable transformations for non-linear systems and utilizing the result for controller design. The following is a simple illustration
4.1 Global Liberalization
Let the process be described by
( , )dx f x udt
= (4.1)
We can always separate the RHS of (4.1) into two terms where the first term depends only on x as in (4.2):
1 1 2 2( , ) ( ) ( , )f x u c f x c f x u= + (4.2)
Consider a new variable z(x).
dz dz dxdt dx dt
= (4.3)
That is, using (4.3), (4.2) can be written as
1 1 2 2( ) ( , )dz dz dzc f x c f x udt dx dx
= + (4.4)
If z(x) is chosen such that
11
; ( ) 0( )
dz z f xdx f x
= ≠ (4.5)
then (4.4) becomes,
2 21
1
( , )( )
c zf x udz c zdt f x
= + (4.6)
That is,
1 2 ( , )dz c z c v x udt
= + (4.7)
where
2
1
( , )( , )( )
zf x uv x uf x
=
Notice that in (4.6), v is the new input and (4.6) is linear in the new variable z (because coefficient of z in the first term is a constant c1). Transformation of old input variable u into new input variable v is given by (4.7). One can also express, using (4.7), u in terms of v as
( , )u q x v= (4.8)
for some function q.
KNU/EECS/ELEC835001 Dr. Kalyana Veluvolu

Non-linear Process Control 22
To find the function z(x), integrate (4.5) to get
1( )( )dx
f xz g x e∫= =
Alternatively, one can define, in place of (4.5), z(x) as
11
1 ; ( ) 0( )
dz f xdx f x
= ≠ (4.9)
Using (4.9), (4.2) can be expressed as
21 2
1
( , )( )
f x udz c cdt f x
= + (4.10)
(4.10) can be put as
1 2 ( , )dz c c v x udt
= + (4.11)
(4.11) is linear in the new variable z and v is the new input. As before, new input is expressed as
2
1
( , )( )
f x uvf x
=
Or,
'( , )u q x v= (4.12)
for some function q’. Integrating (4.9), z(x) is obtained as
1
'( )( )
dxz g xf x
= = ∫ (4.13)
KNU/EECS/ELEC835001 Dr. Kalyana Veluvolu

Non-linear Process Control 23
Fig. 4.1. Global Linearized Control
Example: Application to level Control in a Cylindrical Tank (4.2) can be written as 12
1 2dx c x c udt
= +
where , 1 21 and cc c
A A= − = . Consider a change of variable z(x).Then,
dz dz dxdt dx dt
=
Substituting (4.13) into (4.3), 12
1 2dz dz dzc x c udt dx dx
= + (4.14)
Put
12
1 , 0dz xdx
x= ≠ (4.15)
Then (4.14) becomes
1 2dz c c vdt
= + (4.16)
where
12
( , ) uv x ux
=
Integrating (4.15), 122z x= (4.17)
u can also be expressed as
KNU/EECS/ELEC835001 Dr. Kalyana Veluvolu

Non-linear Process Control 24
12u vx= (4.18)
Since (4.16) is linear, one can use a fixed controller, such as, PID controller to control the transformed system.
We now wish to apply these results to a specific flow system cylindrical pipe for which A = 22.062 cm2 (I.D. is 5.3 cm) and, from previous experimentation, it is known that the dependence of the outflowrate on the liquid level in the pipe is given by:
/ 2 30.1176 / loutF A h cm s= ×
The control system is implemented as follows:
Obtain the actual measurement x (in this case h) from the process.
Calculate z from (4.17); i.e., take the square root, and multiply by 2.
From the same expression, given the desired value for x, obtain the desired value for z; i.e., 2d dZ x= .
The PI controller (tuned for the linear, transformed system (4.11)) receives z and zd and prescribes v(t), the control action required for the linear pseudo-system.
The actual flowrate implemented on the real, nonlinear flow system is obtained from (4.18); a control law nonlinear in the original process variable x.
It is interesting to note that the transformation controller bases the prescribed inflowrate on a product of the control action for the linear pseudo- system and the square root of the liquid level in the tank. The physical implications of this are particularly important: the nonlinearity in the flow system is caused by the fact that the outflow is proportional to the square root of the liquid level in the tank; the transformation controller is seen to take advantage of this fact by adopting the indicated strategy. The conventional PI control strategy will base the inlet flowrate on the actual liquid level in the tank; the transformation controller bases its action on the product of the output of a linear controller, and the square root of the liquid level.
Using controller parameters Kc = 90 and 0.2I c IK K τ= = (for the PI controller tuned for the linear pseudo-system), the response of the example flow system to a set-point change in the liquid level from 40 to 75 cm, operating under the nonlinear transformation controller, is shown in the dashed line in Figure 4.2.
A conventional PI controller using the same controller parameters resulted in an almost unstable system upon reducing the controller parameters to Kc = 9 and 1I c IK K τ= = the system response to the same set-point change under conventional PI control (i.e., decisions on the inlet flowrate are taken using direct level measurements) is shown in the solid line. As we would expect, the transformation controller performs better than the conventional PI controller.
KNU/EECS/ELEC835001 Dr. Kalyana Veluvolu

Non-linear Process Control 25
Fig. 4.2 Response to set-point change
Application of the nonlinear transformation strategy is restricted by the considerations:
The nonlinear transformations are not always easy to find (for some general approaches).
The success of the controller design is dependent on having a good linear process model- something that is unusual in practice.
Conclusion: It is not a universally applicable control system design procedure. In general, the conceptual basis for GLC lies in explicitly relating the system output to its manipulated input in terms of an ordinary differential equation. The output is successively differentiated with respect to time until the resulting derivative is a linear function of the input signal. Differential geometric concepts are then applied in developing the control law.
5. Generic Model Control Generic Model Control (GMC) uses a model of the process in formulating the control law. The design framework is similar to other model based approaches such as Dahlin’s algorithm and IMC. However, rather than adopting a classical approach of comparing the trajectory of the process output against a desired trajectory, GMC defines the performance objective in terms of the time derivatives of the process output, i.e minimising the difference between the desired derivative of the process output and the actual derivative.
Generally the following control affine, non-linear state space description is used, ( ) ( )( )
x f x g x uy h x= +=
& (5.1)
where f(x) and g(x) are vector fields, i.e. they are vector valued functions of a vector and h(x) is a scalar field, i.e. a scalar valued function of a vector, x. In terms of a general system of equations this can be expressed as:
11 1, 1 1
1, 1
1,
( ) ( , )
( ) ( , )
( )
n n
nn n n n
n
dx f x x g x x udt
dx f x x g x x udt
y h x x
= +
= +
=
L L
M
L L
L
KNU/EECS/ELEC835001 Dr. Kalyana Veluvolu

Non-linear Process Control 26
The model is termed control affine or, control linear, because the manipulated input appears linearly - it simply multiplies g(x).
Choose the following desired trajectory:
1 2( ) ( )d d dy y y y y dtα α= − + −∫& (5.2)
where α1 and α2 are design constants (to be specified) and dy is the setpoint. This is the form of a PI controller.
In order to design a controller so that the system follows the trajectory defined by equation (5.2) as closely as possible, the following performance index is specified:
2 2
0
( )t
dJ e dt y y dt= = −∫ ∫& & & (5.3)
i.e. minimise the error squared over a specified time horizon. In order to obtain y& from equation (5.1) the chain rule must be used,
dy dy dxdt dx dt
= (5.4)
Note: dydx
is a 'row' vector while dxdt
is a column vector given by,
( ) ( )
( )
dx x f x g x udty h x
= = +
=
& (5.5)
therefore dhdx
is also a 'row' vector and,
[ ]( ) ( )
( ) ( )
dy dh f x g x udt dx
dh dhf x g x udx dx
= +
= + (5.6)
Using equation (5.6) the performance index, equation (5.3), is minimised when 0e =& , i.e.
1 2( ) ( ) ( ) ( ) 0d ddh dhy y y y dt f x g x udx dx
α α ⎡ ⎤− + − − + =⎢ ⎥⎣ ⎦∫ (5.7)
1 21( ) ( ) ( ) ( )
( )d d
dhu t y y y y dt f xdh dxg xdx
α α⎡ ⎤= − + − −⎢ ⎥⎣ ⎦∫ (5.7)
This control law has two desirable properties:
It utilises a process model.
any inaccuracies in the process model (i.e. plant model mismatch) will be compensated for by the integral term within the control law.
KNU/EECS/ELEC835001 Dr. Kalyana Veluvolu

Non-linear Process Control 27
Example: Consider the following continuous stirred tank exothermic reactor as shown in Fig. 5.1,
Figure 5.1. A Continuous Stirred Tank Reactor (CSTR)
The inlet concentration of the reactant and product are Ai and Ri (mol/l) respectively while the outlet concentration is Ao and Ro (mol/l). The inlet temperature is Ti (K) while the outlet temperature is To (K). The concentrations of both reactant and product in the CSTR are taken to be process states, along with the reactor outlet temperature. The dynamic behaviour of these states is described by three nonlinear-coupled differential equations:
1 2
1 2
1 2( )( )
o i oo o
o i oo o
o i oRo o
p
dA A A k A k Rdt
dR R R k A k Rdt
dT T TH k A k Rdt c
τ
τ
ρ τ
−= − +
−= + −
−−∆= − +
where the reaction rates k1 and k2 depend on the reactor temperature via the Arrhenius relationship
1 21 1 2 2exp , exp
o o
E Ek c k cRT RT
⎛ ⎞ ⎛ ⎞− −= =⎜ ⎟ ⎜ ⎟
⎝ ⎠ ⎝ ⎠
and E1 (Cal), E2 (Cal), R (Cal/mol k), Ai (mol/l), ρ (kg/l), Cp (Cal/kg K), τ(s), = time constant of the vessel and RH∆ (Cal/mol) are normal system parameters. The control objective is to regulate reactor temperature (To) using inlet feed temperature (Ti).
This process is evidently highly non-linear due to the inter-relationships of the states, and particularly the exponential dependence of each state on the reactor temperature. The differential equations can be re-arranged into the generic vector representation of the process with the following vector and scalar fields:
State Vector: ( , , )To o ox A R T=
f vector fields: 1 2 3( ) ( ( ), ( ), ( ))Tf x f x f x f x=
KNU/EECS/ELEC835001 Dr. Kalyana Veluvolu
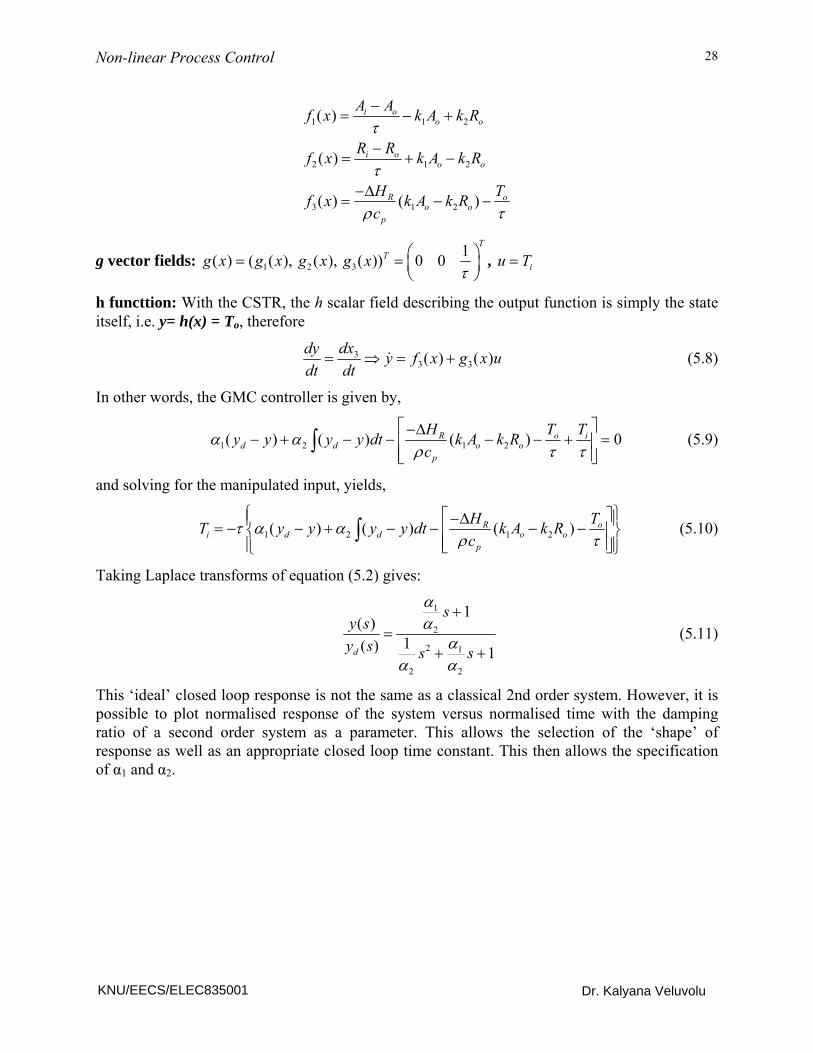
Non-linear Process Control 28
1 1 2
2 1 2
3 1 2
( )
( )
( ) ( )
i oo o
i oo o
R oo o
p
A Af x k A k R
R Rf x k A k R
H Tf x k A k Rc
τ
τ
ρ τ
−= − +
−= + −
−∆= − −
g vector fields: 1 2 31( ) ( ( ), ( ), ( )) 0 0
TTg x g x g x g x
τ⎛ ⎞= = ⎜ ⎟⎝ ⎠
, iu T=
h functtion: With the CSTR, the h scalar field describing the output function is simply the state itself, i.e. y= h(x) = To, therefore
33 3( ) ( )dy dx y f x g x u
dt dt= ⇒ = +& (5.8)
In other words, the GMC controller is given by,
1 2 1 2( ) ( ) ( ) 0R o id d o o
p
H T Ty y y y dt k A k Rc
α αρ τ τ
⎡ ⎤−∆− + − − − − + =⎢ ⎥
⎢ ⎥⎣ ⎦∫ (5.9)
and solving for the manipulated input, yields,
1 2 1 2( ) ( ) ( )R oi d d o o
p
H TT y y y y dt k A k Rc
τ α αρ τ
⎧ ⎫⎡ ⎤−∆⎪ ⎪= − − + − − − −⎢ ⎥⎨ ⎬⎢ ⎥⎪ ⎪⎣ ⎦⎩ ⎭
∫ (5.10)
Taking Laplace transforms of equation (5.2) gives:
1
2
2 1
2 2
1( )
1( ) 1d
sy sy s s s
αα
αα α
+=
+ + (5.11)
This ‘ideal’ closed loop response is not the same as a classical 2nd order system. However, it is possible to plot normalised response of the system versus normalised time with the damping ratio of a second order system as a parameter. This allows the selection of the ‘shape’ of response as well as an appropriate closed loop time constant. This then allows the specification of α1 and α2.
KNU/EECS/ELEC835001 Dr. Kalyana Veluvolu