Embed Size (px)
Citation preview
REVIEW
Non-invasive Investigations of Paintings by PortableInstrumentation: The MOLAB Experience
B. Brunetti1,2 • C. Miliani1,2 • F. Rosi2 •
B. Doherty2 • L. Monico2 • A. Romani1,2 •
A. Sgamellotti1,2
Received: 18 October 2015 / Accepted: 17 December 2015
� Springer International Publishing Switzerland 2016
Abstract The in situ non invasive methods have experienced a significant
development in the last decade because they meet specific needs of analytical
chemistry in the field of cultural heritage where artworks are rarely moved from
their locations, sampling is rarely permitted, and analytes are a wide range of
inorganic, organic and organometallic substances in complex and precious matrices.
MOLAB, a unique collection of integrated mobile instruments, has greatly con-
tributed to demonstrate that it is now possible to obtain satisfactory results in the
study of a variety of heritage objects without sampling or moving them to a labo-
ratory. The current chapter describes an account of these results with particular
attention to ancient, modern, and contemporary paintings. Several non-invasive
methods by portable equipment, including XRF, mid- and near-FTIR, UV–Vis and
Raman spectroscopy, as well as XRD, are discussed in detail along with their impact
on our understanding of painting materials and execution techniques. Examples of
successful applications are given, both for point analyses and hyperspectral imaging
approaches. Lines for future perspectives are finally drawn.
Keywords X-ray fluorescence � Raman spectroscopy � FTIR � UV–Visspectroscopy � Pigment � Binding media
& B. Brunetti
1 Centro di Eccellenza SMAArt (Scientific Methodologies Applied to Archaeology and Art),
Universita degli Studi di Perugia, Via Elce di Sotto 8, 06123 Perugia, Italy
2 Istituto CNR di Scienze e Tecnologie Molecolari (CNR-ISTM), Via Elce di Sotto 8,
06123 Perugia, Italy
123
Top Curr Chem (Z) (2016) 374:10
DOI 10.1007/s41061-015-0008-9
1 Introduction
In recent decades there has been a growing interest in the applications of analytical
chemistry for the study of heritage materials. Through scientific examinations,
satisfactory answers have been given to numerous problems of a multidisciplinary
nature, such as the clarification of historical art and archaeological questions (i.e.
execution techniques, attribution, dating, provenance), the assessment of the state of
conservation of artefacts, the establishment of the best conditions to avoid or slow
down alterations, as well as the monitoring of the behaviour of artwork materials
during and after restoration [1, 2].
These studies were carried out in the past mostly by micro-destructive methods
using minimal samples, taken from marginal areas of the artwork during restoration,
in order to mitigate the visual impact of the operation. In other cases, the first
relevant non-invasive analytical approaches were experimented by moving artifacts,
such as manuscripts or small paintings, into a scientific laboratory, and exploiting
bench-top instrumentation (e.g. micro-Raman spectrometers) [3, 4] or accelerators
and large scale facility methods [5–8].
However, a large portion of historical patrimony consists in immovable objects
that cannot be moved from their usual location (e.g. monuments, sculptures,
buildings) and, even in the case of movable patrimony (including precious
paintings, ceramics, gems, manuscripts, etc.), curators normally avoid moving
artworks to a laboratory due to the risk to their integrity and high insurance costs.
For such reasons, many efforts over the years have been oriented towards the design
and set up of innovative mobile instruments with sensitivity and specificity
comparable to their bench-top counterparts, achieving the best compromise between
efficiency and portability in order to apply a method based on bringing the
laboratory to the object and not vice versa.
Such an in situ, non-invasive approach, being able to get valuable information
without altering or moving the object, registered an immediate success, leading to a
rapid diffusion of the use of portable instrumentation that produced in recent years:
(a) a significant change in diagnostic practices, (b) a net increase of scientific inputs
in heritage studies and (c) a positive modification in the relationships between
curators, conservators, and scientists, thus permitting a common language to be
established and partnership strengthened.
After the first national Italian applications and the pioneering and successful
MOLAB (mobile laboratory) experience of the European projects Eu-ARTECH
(2004–2009) [9] and CHARISMA (2009–2014) [10], where a set of integrated
portable instrumentations were offered to European users for in situ measurements,
more and more mobile tools and facilities flourished in different countries that now
permit users, through the national and European IPERION CH programmes [11], to
exploit integrated portable instruments able to non-invasively obtain satisfying
results in the study of a variety of heritage objects and relative inorganic and organic
materials.
In this chapter, following a short general introduction on the limitations and
advantages intrinsic to the use of compact portable instrumentation for analytical
10 Page 2 of 35 Top Curr Chem (Z) (2016) 374:10
123
applications, selected experimental results are presented, mostly obtained in recent
works by MOLAB [12]. The aim is to show actual performances of the non-invasive
approach in the study of atomic and molecular composition of artwork materials,
with particular focus on pigments, colorants and binding media in ancient and
modern paintings.
More recently, following the success of point analyses, innovative chemical
imaging techniques at the macro scale have been also experimentally applied for
in situ examination of paintings. Indications are given on perspectives for future
developments along this direction.
2 Portable Spectroscopic Instrumentation: Benefits and Drawbacks
Passing from bench-top instrumentation to the compact and manageable equipment
for in situ measurements some limitations may be incurred in term of performance,
due to the miniaturization of optical and electronic components and constraints in
the setup geometry. Nevertheless, the performance of portable spectroscopic
instruments has greatly improved in the past decade, narrowing the gap between
portable and bench-top instruments.
Relevant issues can arise regarding spectral interpretation due to the optical and
matrix effects that are present each time a signal is recorded in backscattering,
emission, or reflection mode from materials having a complex, heterogeneous, and
often multi-layered character, as occurs in polychromies.
However, the use of a variety of equipment, a non-invasive approach, and the
accurate preliminary work carried out in the laboratory prior to the in situ campaign
can overcome these limitations. In fact, observations coming from a manifold of
analytical techniques, each overcoming intrinsic limitations of the others, can
provide extensive and complementary information. In addition, since non-invasive
measurements do not require any contact with the examined object, they can be
carried out all over the painted surface on a virtually infinite number of points,
obtaining numerous integrative and representative data. Finally, the preparatory
work carried out in the laboratory on mock-up samples allows a better understand-
ing of the spectra to be achieved, and interpretation models to be built which include
matrix effects. In conclusion, when all this information is jointly analyzed, a more
thorough understanding of the paint chemical composition can be achieved than in
the case of laboratory analyses on few samples, often consisting of specimens
sampled from the borders of lacunae or close to the frame.
In this section, the analytical technique most frequently applied for non-invasive
in situ investigations are introduced and, for each, advantages and limitations are
presented. The techniques are: X-ray fluorescence (XRF), mid- and near Fourier
transform infrared (FTIR) analysis in reflection mode, Raman spectroscopy (with
and without a microscope), ultraviolet–visible-near infrared (UV–Vis-NIR) absorp-
tion and fluorescence spectroscopies, and X-ray diffraction (XRD).
Top Curr Chem (Z) (2016) 374:10 Page 3 of 35 10
123
2.1 X-ray Fluorescence
X-ray fluorescence (XRF) spectrometry allows for a rapid determination of the
elemental composition of a material. The technique is particularly efficient for the
study of high-Z elements in low Z-matrixes. As a mobile tool, it has been
extensively used for analysis in art and archaeology since the early 1970s and,
therefore, represents the first technique to be historically exploited for intensive
in situ non-invasive investigations [13–15].
Today, it is a primary tool universally exploited as a first approach to any study
carried out in situ. Throughout the years, it has provided answers to a huge number
of questions regarding manufactures in art, revealing specific aspects of the working
practice of ancient masters [16–18].
A main limitation of XRF for in situ analyses is that only qualitative results are
generally obtained, because matrix effects related to diffusion, re-absorption, and
Auger ionization do not allow for reliable quantifications. This is particularly true in
the case of complex layered structures, as occurs in paintings. Only in few
favourable cases, has the modelling of the X-ray’s absorption through different
layers allowed for determining composition and thickness of paint layers on the
basis of Ka/Kb or La/Lb intensity ratios. This method was successfully applied
in situ to estimate the thickness of layers in a painting by Marco d’Oggiono, a pupil
of Leonardo da Vinci, and on the Mona Lisa in the Louvre Museum, to determine
how Leonardo achieved a barely perceptible gradation of facial tones from light to
dark (the Leonardo sfumato) [19–21].
2.2 Reflection Infrared Spectroscopy
Reflection FTIR spectroscopy, from the near-IR (NIR) range up to 400 cm-1, is the
most informative and reliable molecular technique among the MOLAB array of
methods [22–32].
In the medium infrared range (mid-FTIR, 4000–400 cm-1), the matrix effect
appears with large spectral distortions, both in band shape and position, that can
affect the interpretation of reflection spectra [33, 34]. Reflection mid-FTIR
spectroscopy from a complex and optically thick surface (as that of a painting)
generally includes the collection of both diffuse (from the volume) and specular
(from the surface) reflection with a variable and unpredictable ratio that
basically depends on the roughness of the examined surface as well as on the
optical properties of the investigated materials. In particular, the specular
reflection is governed by Fresnel’s law and, accordingly, is a function of both
the absorption index (k) and refractive index (n) [35]. As a consequence,
reflection spectra of organic compounds typically show derivative profiles
(resembling the refractive index dependence on wavenumber), while reflection
spectra of many inorganic compounds (sulfates, carbonates, phosphates,
silicates, etc.) are often distorted by the inversion of those fundamental bands
that show k » n [28].
On the other hand, the diffuse reflection is governed by Kubelka–Munk’s law and
depends on the absorption index and scattering coefficient (s). In diffuse reflection,
10 Page 4 of 35 Top Curr Chem (Z) (2016) 374:10
123
the spectral distortions are smaller and concern mainly the relative intensity of
bands. Typically, weak absorption bands increase in their relative intensity with
respect to stronger absorption bands especially when laying at high wavenumbers.
Consequently, overtones and combination bands, usually neglected in transmission
mode can be profitably exploited in reflection mode with substantial advantage,
especially when the fundamental bands of the fingerprint regions are obscured by
overlap with other signals [27, 28]. Moreover, diffuse reflection can also determine
the enhancement of absorption bands related to minor components, allowing (in
favourable cases) for a fine discrimination between pigments made of similar main
chemical structure, as, for example, natural and synthetic ultramarine blue [36] or
lamp and bone black [23].
In the NIR region (near-FTIR, 7000–4000 cm-1), reflection spectra are
dominated by diffuse (volume) reflection because the absorption indices of
materials are generally rather low. As a drawback, near-FTIR spectra generally
show poor specific profiles generated by an overlap of overtone and combination
modes. Nevertheless, this spectral range proved to be useful for a non-invasive,
initial classification of binding media and other natural polymers [37, 38].
Another important advantage is related to the higher penetration depth of near-
FTIR with respect to mid-FTIR that makes it sensitive and exploitable to also
characterize the binding media in the presence of a (preferably thin) layer of
varnish, whose signal would prevail in the mid-infrared range.
A wide database of reflection spectra recorded on model paints composed of a
variety of pigments and binders (different materials and different surface roughness)
allowed distinctive information to be registered and classified, suitable for a correct
interpretation of the mid- and near-FTIR spectral features during diagnostic
campaigns [22–34].
Great advantage of portable FTIR instrumentation (mid and near) lies in the good
performances of the available mobile instruments, that are comparable to those of
standard bench-top equipment.
2.3 UV–Vis-NIR Absorption and Emission
UV–Vis-NIR reflection spectroscopy (typically in the range 190–1700 nm) in
configuration with optical fibres (known as FORS—fiber optic reflectance
spectroscopy) is a well-established technique for the characterization of pigments
and colorants in works of art. It has the advantage of being easy to apply and it
requires short acquisition times (few seconds). In addition, there is a wide
commercial availability of truly portable and relatively inexpensive instrumentation.
Despite the advantages, some shortcomings prevent the reliable use of FORS as a
self-consistent analytical tool. In particular, reflectance spectra in the UV–Vis-NIR
range features broad bands related to electronic transitions (besides a few
vibrational bands in the NIR) and, therefore, they have an intrinsically lower
fingerprinting ability when compared with spectra obtained with other molecular
spectroscopic techniques, such as FTIR or Raman spectroscopy. However, although
in some cases it cannot allow unambiguous identification, its straightforward
Top Curr Chem (Z) (2016) 374:10 Page 5 of 35 10
123
applicability makes it an ideal spectroscopic method in a multi-technique analytical
approach.
Early publications on the topic (without optical fibres) date back to the 1930s
[39]. Since then, it has been widely used alone (typically applied with extension to
the NIR range up to 2500 nm) or in combination with other techniques for the study
of paintings [40–42] and illuminations in manuscripts [43–45].
More recently, UV–Vis-NIR fluorescence spectroscopy has been exploited as an
additional non-invasive tool to investigate coloured materials in paintings,
manuscripts and other polychromies [46]. Its use is particularly advisable when
organic dyes and/or pigments are present with rather good emission quantum yield.
As for absorption electronic bands, the corresponding emissions are usually quite
broad (i.e. several tens of nanometers full width at half-maximum, [FWHM]). This
often causes overlapping among emissions from distinct fluorophores and makes it
difficult to distinguish among them, thus reducing the specificity of spectrally based
discrimination. In addition, the spectral properties of a fluorophore can vary
depending on its microenvironment (e.g. binding media, mixture with other
pigments) with further complications. Nevertheless, on the basis of in-depth studies
in the laboratory (in solution, solid state and, finally, on paint models) it has been
demonstrated that its fluorescence properties may be used to identify anthraquinone
dyes (differentiating between those of animal or vegetal origin) [47], oxazines [48],
indigoids [49], flavonoids and carotenoid dyes [50]. In addition, a few inorganic
pigments (e.g. zinc white [51], Cd-based pigments [52, 53], and Egyptian blue [54])
show rather specific emission bands (the latter two in the NIR range) which can be
exploited for their non-invasive identification.
Here, the limitations produced by matrix effects are related to self-absorption,
that is, absorption by the fluorophore itself of the emitted light, thus erasing a
variable portion of the emission spectrum on the short wavelength side. The
problem of the correction for self-absorption of fluorescence spectra collected on
pictorial works has been addressed, and a method for the treatment of the
fluorescence signals has been first developed for luminophore dispersed in an
opaque layer [55] and then extended for luminophore in a translucent layer on a
coloured background (i.e. glazing technique) [56].
With the aim of increasing the specificity of emission UV–Vis-NIR spectroscopy
toward the molecular recognition of dyes and organic pigments, the exploitation of
fluorescence kinetic parameters has been recently proposed. In fact, kinetic analysis
of emission decay curves can be used to distinguish among different compounds
that have similar fluorescence spectra and may aid in the identification of the
molecular species by comparison with known standards [57, 58].
Notably, a prototype system for integrated measurements of UV–Vis-NIR
reflection spectroscopy (investigating the absorption properties), steady-state
fluorescence, and luminescence lifetimes is currently applied in MOLAB interven-
tions to record on the same spot, in situ, the full photo-physical behaviour of dyes
and pigments on painted surfaces [59].
10 Page 6 of 35 Top Curr Chem (Z) (2016) 374:10
123
2.4 Raman Spectroscopy
Drawbacks and successes of portable Raman spectrometers for in situ non-invasive
applications have been widely discussed in a recent review paper with a rich,
extended bibliography [60]. Much more than for bench-top applications, molecular
fluorescence represents the main inconvenience for non-invasive Raman spec-
troscopy, especially when analysing paint layers rich of (oxidised) organic
components. In the case of a micro-spectrometry setup, no portable confocal
microscopes are available and this implies the occurrence of matrix effects
producing a high fluorescence background that obscures the weak Raman features.
This limitation is obviously also present in the case of direct use of optical fibres
(i.e. measurements without a microscope).
Other inconveniences arise from the compactness of portable systems, implying a
reduced optical path and, therefore, a lower spectral range and resolution than in
bench-top instruments. Furthermore, shields or correction systems for the daylight are
not always available and, in case of use of scaffoldings, vibrations of the support of the
spectrometer can seriously impede the recording of spectra. A final relevant drawback
is that extreme attentionmust be paid in regulating the laser power, since the surface of
the artefacts may be thermally and/or photochemically altered. This is obviously valid
both for portable and bench-top instrumentation; however, it is evident that
measurements carried out directly on the surface of a precious artwork (i.e. a painting
masterpiece) require much more caution than laboratory investigation on samples.
This calls for careful preliminary studies prior to the in situ campaign to search for the
best compromise between safety of operation and intensity of scattering signals [61].
In general, Raman spectroscopy has proved to be a very successful technique for
in situ studies of illuminations in manuscripts (low fluorescence, due to the
generally high pigment/binder ratio), glasses, enamels, metals, but less for panel and
canvas paintings. In case of mural paintings, the diffuse presence of organic
protectives and/or consolidants, applied in restoration, as well as problems related to
vibrations and defocusing, still usually limits in situ Raman spectroscopy
applications.
As for bench-top instruments, to overcome fluorescence, a great advantage is
offered by the use of high-wavelength lasers, which are able to reduce or eliminate
electronic excitation, as, for example, those at 785 nm (diode laser) or those more
recently introduced in a portable dispersive setup emitting at 1064 nm (Nd:YAG
laser). However, due to the m4 dependence of Raman intensity, the sensitivity of
spectra acquired using a near-infrared excitation is generally very low.
2.5 X-ray Diffraction
XRD is the most reliable method for the identification of minerals or synthetic
crystalline materials. In principle, it represents the fundamental technique to
complement chemical analyses by XRF and vibrational spectroscopy (FTIR and
Raman). However, applications of portable XRD systems for in situ non-invasive
measurements are scarce, mostly due to the severe geometrical restrictions of the
in situ experimental setups that introduce numerous drawbacks. The characteristics
Top Curr Chem (Z) (2016) 374:10 Page 7 of 35 10
123
of existing XRD systems for heritage applications have been recently reviewed and
the performances of each system compared [62]. These instruments are, apart from
two single cases, based on angular dispersion XRD (AD-XRD) and consist of
conventional goniometer-type diffractometers in which data are obtained by
scanning the detector and/or the X-ray source [62–64], or systems that make use of
two-dimensional (2D) detectors, such as charge-coupled devices (CCDs) [65, 66] or
imaging plates, [67–69] that allow for the recording of diffraction data without
mechanical movements.
The positioning of the instrument with respect to the surface to be analyzed is a
critical parameter. For example, referring to the two latter systems, the source (a
selectable X-ray tube) illuminates a small spot on the sample surface at 10�incidence and the 2D detector is set at the nearest distance from the spot. Thus,
steric hindrances inevitably introduce limits in the 2h angular range of the detected
signals, which are 10�–60� and 20�–55� for the two systems, respectively, with
0.25�–0.3� angular resolution [41]. A higher 2h scan range (24�–134�) with 2hresolution of 0.12� is available in another system that uses a goniometer. However,
the beam size that defines the spatial resolution is higher [62]. In all cases, due to the
low intensities of the diffracted beams, in situ XRD analyses require acquisition
times that are much longer than for the other non-invasive techniques, amounting to
30 min or even much more, sometimes hours, to achieve one single accept-
able spectrum. A final drawback of non-invasive XRD is that shifts of the diffraction
2h angles can be recorded, mainly due to the different depth of the crystals of the
minerals to be detected (e.g. the crystals of the pigments). This is a disadvantage
that, in principle, could be turned into an advantage when information on the depth
of the pigment layers is required [70].
The advantage of XRD is that the technique is well established, diffraction
phenomena are theoretically well understood (data can be theoretically simulated
from crystal structure data), and a complete reference database is available as a
powder diffraction file (PDF) supplied by the International Centre for Diffraction
Data (ICDD). All these features make XRD a profitable technique to complement
the data acquired in situ by FTIR and Raman spectroscopy, provided that a long-
term analytical campaign is planned (several days), due to the requested long
accumulation time for each point of measurement.
A drastic reduction of the data acquisition time (one or two orders of magnitude)
is, in principle, possible when energy dispersive XRD (ED-XRD) is used, based on
polychromatic excitation (using the brehmstrahlung X-rays that are filtered off in
conventional X-ray tubes) and X-ray energy dispersive detection (i.e. using the
same detector for XRF measurements). This approach represents a possible
alternative to AD-XRD for in situ heritage applications [70–73]. However, in this
approach, some complications arise: first, the quantities that regulate the scattered
intensity depends on the energy; second, the spectral resolution depends not only on
the angular divergence of the X-ray beam, but also on the energy resolution of the
detector; third and most important, XRD and XRF peaks are recorded together in
the same spectrum, sometimes overlapping, an inconvenience that can be avoided
by changing the detection angle, reintroducing in some way the necessity of a
mechanical angular movement. For these reasons, instruments able to carry out both
10 Page 8 of 35 Top Curr Chem (Z) (2016) 374:10
123
angular and energy dispersive XRD have been assembled with the purpose of taking
advantages of both ED-XRD (shorter time and higher energy penetration) and AD-
XRD (higher d resolution).
The first in situ application of a double ED and AD-XRD system was carried out
in Japan to investigate a bronze mirror from the Eastern Han Dynasty (25–220 AD)
and the painted statue of ‘‘Tamonten holding a stupa’’ from the Heian Period
(794–1192 AD) [71]. Two new prototypes have been very recently set up and
successfully tested at ICP-Elettra, showing promising results [73].
3 In Situ Experimental Results
MOLAB has been operative in Italy and Europe for around 15 years (started in
2001, with a national project dedicated to the monitoring of the state of conservation
of the David of Michelangelo [74]) and, during these years, great experience has
been accumulated with a total number of more than two hundred studies on different
types of heritage artworks, including paintings, bronze and stone sculptures,
manuscripts, and ceramics [12].
On the basis of this experience, selected examples of results are presented in this
section on the identification of pigments, dyes, and binders in paintings. It will be
also shown how an important, key passage for the success of the MOLAB
measurements is represented by the preliminary work developed in the laboratory
prior to the in situ campaign.
Using a protocol that starts with XRF measurements, followed in the order by
(a) near- and mid-FTIR, (b) UV–Vis absorption and emission, (c) Raman
spectroscopy, and (d) XRD, it can be assessed that the general characterization of
the execution technique of a painter [identification of pigments and family of
binder(s)] can be achieved today through direct measurements on the work of art,
without any sampling. The necessity of a few micro-samples is restricted to the
solution of specific problems, as the characterization of the paint stratigraphy or the
determination of the detailed nature of binder(s) and colorants [22–25].
Successful applications of in situ non-invasive approaches for the study of
painting techniques have been carried out on masterpieces of different periods and
schools, as Renaissance paintings by Raphael [16], Perugino[17], Leonardo, on
impressionist and post-impressionist paintings by Cezanne [25], Renoir [23] and
Van Gogh [3, 75, 76], and on contemporary paintings by Picasso [77], Burri [78]
Mondrian [79], De Stael, and many others.
3.1 Non-invasive Characterization of Pigments
3.1.1 Identification of Ancient Masters’ Palette
Among these studies, an exemplary characterization of ground and pigments has
been carried out at the Royal Museum of Fine Arts of Antwerp on the triptych
Christ among Singing and Music Playing Angels by the Flemish painter Memling
[80]. The painting, dated ca. 1487–’90, is composed of three panels (ca.
Top Curr Chem (Z) (2016) 374:10 Page 9 of 35 10
123
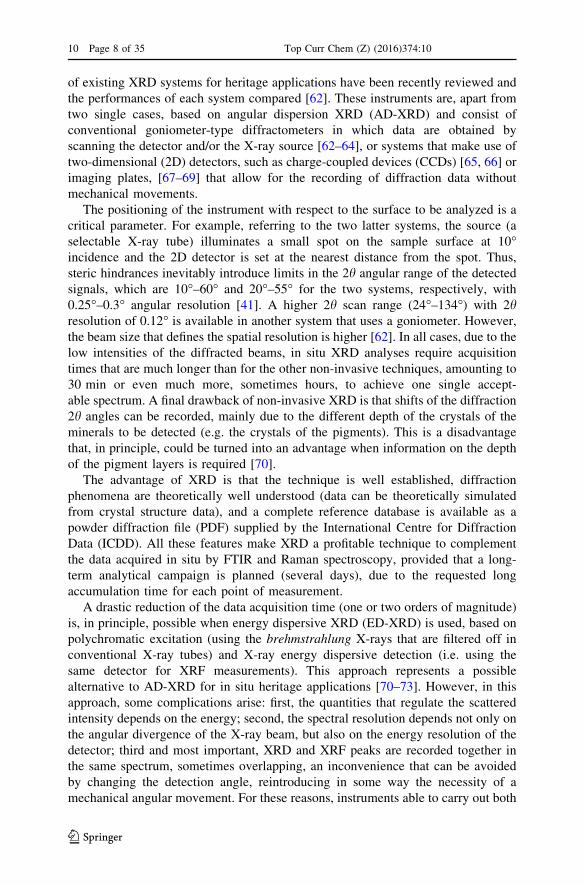
2 m 9 1.5 m, each) which depict Christ in the clouds, surrounded by 16 angels,
singing and playing different musical instruments. The study has been carried out
through a long-term analytical campaign, in occasion of the restoration of the
painting, when the varnish was removed. In Fig. 1, the MOLAB laboratory setup at
the Royal Museum of Fine Arts is shown.
Together with XRF, reflection mid- and near-FTIR, absorption and emission
(steady-state and time-resolved) UV–Vis spectroscopies, and XRD were exploited.
Non-invasive Raman spectroscopy was not used in this case, because scattering was
fully covered by a large fluorescence background induced by the binding medium.
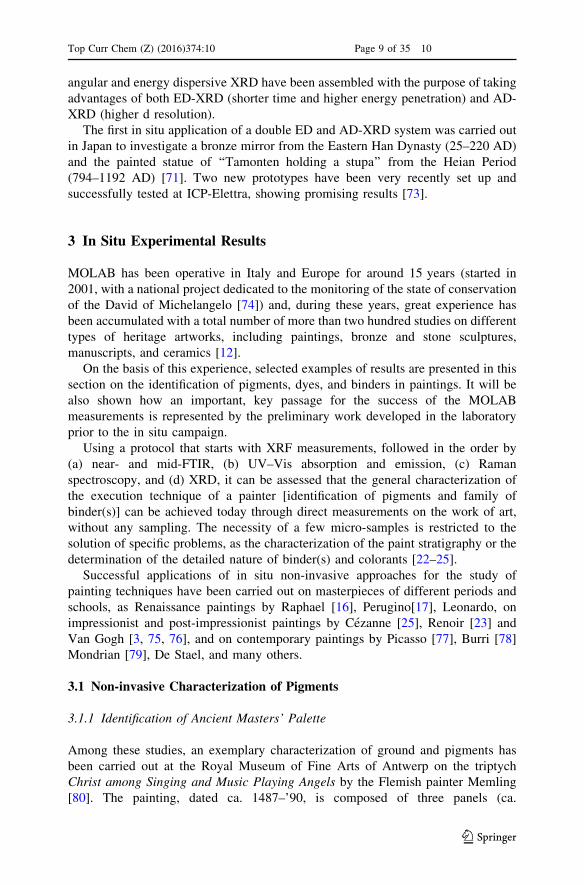
Preliminary to the study of pigments, the presence of a small lacuna (ca. 0.2 cm2)
in the paint, that left the underlying ground uncovered (Fig. 2), permitted the
materials in the ground layer(s) to be first investigated by mid-FTIR and XRD,
without interferences from the paint. The presence of both gypsum (CaSO4�2H2O)
and chalk (CaCO3) in the ground layers was clearly revealed by mid-FTIR through
the combination and overtone bands at 2200 [27] and 2500 cm-1, [25, 81]
respectively. XRD spectra, collected in these areas, confirmed the presence of both
compounds, as shown in Fig. 2.
The discovery of gypsum was rather unexpected. According to this finding,
Memling here combined the practice of the Western and Northern European artists
to use chalk for the ground, with the habits of the Mediterranean School, known to
employ gypsum for the same purpose [82]. Although it remains not fully established
if the two compounds were mixed or separated in two layers, the occurrence of
gypsum as a preparation layer was confirmed by FTIR measurements which clearly
indicated the presence of calcium sulfate not only from areas with emerging ground
(lacunae), but also from several undamaged areas, through the paint (see, for
Fig. 1 The mobile laboratory, MOLAB, during the campaign at the Royal Fine Art Museum of Antwerpfor the study of the triptych Christ among Singing and Music Playing Angels (ca. 1487-’90), by H.Memling. The analytical work is proceeding simultaneously applying different techniques. Theinstruments rotate in front of each panel in order to investigate the selected areas with all theavailable equipment
10 Page 10 of 35 Top Curr Chem (Z) (2016) 374:10
123
example, the spectra reported in Fig. 3: a broad signal at 5150 cm-1, ascribable to
OH combination band of hydrated calcium sulphate [27]).
The figures represented in the three panels of the painting were characterised by a
wide variety of colours and shades that were achieved by the painter combining
different pigments. The variegate chromatic effects were created through specific
mixtures or overlayers, especially on the wings and robes of the playing and singing
angels.
Essential for the unambiguous molecular identification of pigments and mixtures
in these complex areas was the complementary information originated from mobile
FTIR, XRD, and UV–Vis absorption and emission spectroscopy. It was found that
in the wings and robes of the angels, shades from light blue to deep purple were
achieved by combining azurite, 2CuCO3�Cu(OH)2 (identified by FTIR and XRD)
with a variety of other pigments, such as bone black (identified by FTIR), lead white
(revealed by FTIR and XRD), lead-tin yellow type I (revealed by XRD) and/or an
organic red lake, most probably madder lake (identified by UV–Vis absorption and
emission spectral profiles).
These pigments, together with natural ultramarine (present only in precious
details), cinnabar and/or red ochre (in the incarnates), yellow, and brown ochre
composed the full palette of the painter.
In more detail, azurite was characterized by reflection mid-FTIR via the
combination bands of both the copper carbonate (structured signal at 2500 cm-1)
and copper hydroxide moiety (doublet at 4244 and 4373 cm-1) [28] (see Fig. 3);
lead white was mainly identified by the m1 ? m3 combination band of cerussite
(PbCO3) and hydrocerussite [2PbCO3�Pb(OH)2] at 2410 and 2428 cm-1, respec-
tively; while carbon black of animal origin was identified through a small sharp
signal at 2010 cm-1 [28].
Fig. 2 Identification of calcium carbonate and gypsum by both mid-FTIR (a, b) and XRD (c, d) fromtwo areas (01 and 02) of a lacuna in the paint in Fig. 1 (modified from Ref. [80])
Top Curr Chem (Z) (2016) 374:10 Page 11 of 35 10
123
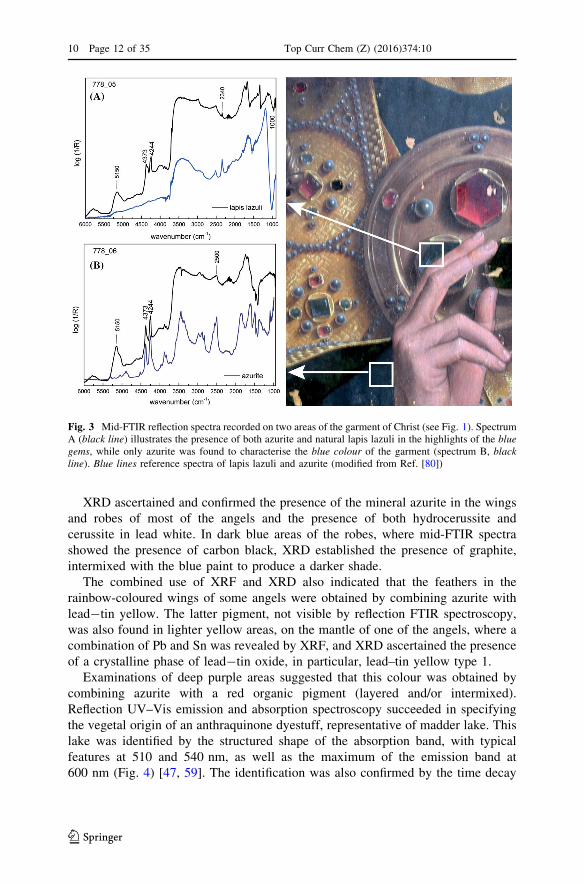
XRD ascertained and confirmed the presence of the mineral azurite in the wings
and robes of most of the angels and the presence of both hydrocerussite and
cerussite in lead white. In dark blue areas of the robes, where mid-FTIR spectra
showed the presence of carbon black, XRD established the presence of graphite,
intermixed with the blue paint to produce a darker shade.
The combined use of XRF and XRD also indicated that the feathers in the
rainbow-coloured wings of some angels were obtained by combining azurite with
lead-tin yellow. The latter pigment, not visible by reflection FTIR spectroscopy,
was also found in lighter yellow areas, on the mantle of one of the angels, where a
combination of Pb and Sn was revealed by XRF, and XRD ascertained the presence
of a crystalline phase of lead-tin oxide, in particular, lead–tin yellow type 1.
Examinations of deep purple areas suggested that this colour was obtained by
combining azurite with a red organic pigment (layered and/or intermixed).
Reflection UV–Vis emission and absorption spectroscopy succeeded in specifying
the vegetal origin of an anthraquinone dyestuff, representative of madder lake. This
lake was identified by the structured shape of the absorption band, with typical
features at 510 and 540 nm, as well as the maximum of the emission band at
600 nm (Fig. 4) [47, 59]. The identification was also confirmed by the time decay
Fig. 3 Mid-FTIR reflection spectra recorded on two areas of the garment of Christ (see Fig. 1). SpectrumA (black line) illustrates the presence of both azurite and natural lapis lazuli in the highlights of the bluegems, while only azurite was found to characterise the blue colour of the garment (spectrum B, blackline). Blue lines reference spectra of lapis lazuli and azurite (modified from Ref. [80])
10 Page 12 of 35 Top Curr Chem (Z) (2016) 374:10
123
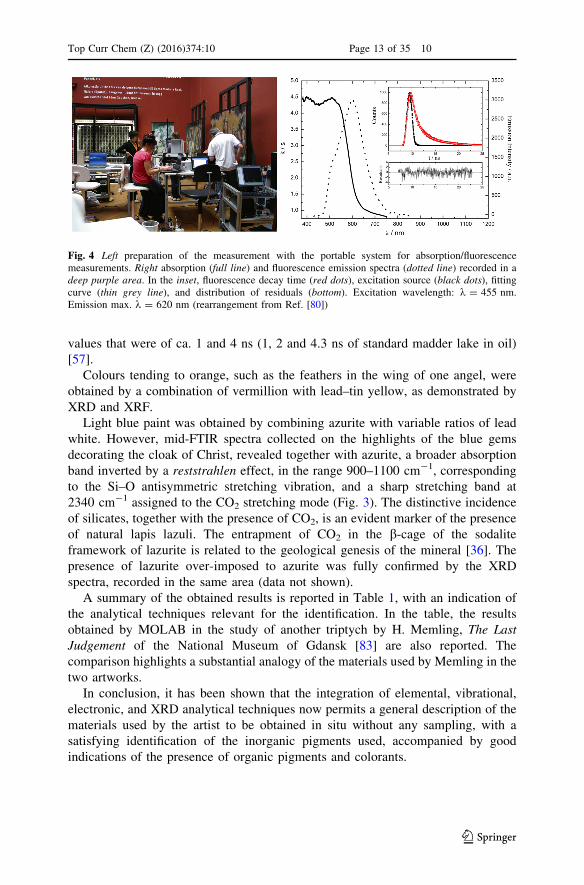
values that were of ca. 1 and 4 ns (1, 2 and 4.3 ns of standard madder lake in oil)
[57].
Colours tending to orange, such as the feathers in the wing of one angel, were
obtained by a combination of vermillion with lead–tin yellow, as demonstrated by
XRD and XRF.
Light blue paint was obtained by combining azurite with variable ratios of lead
white. However, mid-FTIR spectra collected on the highlights of the blue gems
decorating the cloak of Christ, revealed together with azurite, a broader absorption
band inverted by a reststrahlen effect, in the range 900–1100 cm-1, corresponding
to the Si–O antisymmetric stretching vibration, and a sharp stretching band at
2340 cm-1 assigned to the CO2 stretching mode (Fig. 3). The distinctive incidence
of silicates, together with the presence of CO2, is an evident marker of the presence
of natural lapis lazuli. The entrapment of CO2 in the b-cage of the sodalite
framework of lazurite is related to the geological genesis of the mineral [36]. The
presence of lazurite over-imposed to azurite was fully confirmed by the XRD
spectra, recorded in the same area (data not shown).
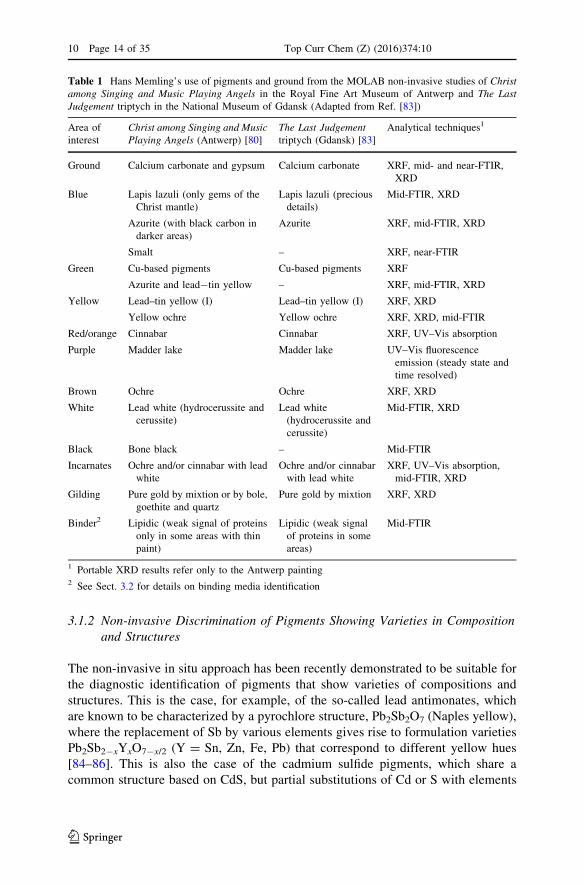
A summary of the obtained results is reported in Table 1, with an indication of
the analytical techniques relevant for the identification. In the table, the results
obtained by MOLAB in the study of another triptych by H. Memling, The Last
Judgement of the National Museum of Gdansk [83] are also reported. The
comparison highlights a substantial analogy of the materials used by Memling in the
two artworks.
In conclusion, it has been shown that the integration of elemental, vibrational,
electronic, and XRD analytical techniques now permits a general description of the
materials used by the artist to be obtained in situ without any sampling, with a
satisfying identification of the inorganic pigments used, accompanied by good
indications of the presence of organic pigments and colorants.
Fig. 4 Left preparation of the measurement with the portable system for absorption/fluorescencemeasurements. Right absorption (full line) and fluorescence emission spectra (dotted line) recorded in adeep purple area. In the inset, fluorescence decay time (red dots), excitation source (black dots), fittingcurve (thin grey line), and distribution of residuals (bottom). Excitation wavelength: k = 455 nm.Emission max. k = 620 nm (rearrangement from Ref. [80])
Top Curr Chem (Z) (2016) 374:10 Page 13 of 35 10
123
3.1.2 Non-invasive Discrimination of Pigments Showing Varieties in Composition
and Structures
The non-invasive in situ approach has been recently demonstrated to be suitable for
the diagnostic identification of pigments that show varieties of compositions and
structures. This is the case, for example, of the so-called lead antimonates, which
are known to be characterized by a pyrochlore structure, Pb2Sb2O7 (Naples yellow),
where the replacement of Sb by various elements gives rise to formulation varieties
Pb2Sb2-xYxO7-x/2 (Y = Sn, Zn, Fe, Pb) that correspond to different yellow hues
[84–86]. This is also the case of the cadmium sulfide pigments, which share a
common structure based on CdS, but partial substitutions of Cd or S with elements
Table 1 Hans Memling’s use of pigments and ground from the MOLAB non-invasive studies of Christ
among Singing and Music Playing Angels in the Royal Fine Art Museum of Antwerp and The Last
Judgement triptych in the National Museum of Gdansk (Adapted from Ref. [83])
Area of
interest
Christ among Singing and Music
Playing Angels (Antwerp) [80]
The Last Judgement
triptych (Gdansk) [83]
Analytical techniques1
Ground Calcium carbonate and gypsum Calcium carbonate XRF, mid- and near-FTIR,
XRD
Blue Lapis lazuli (only gems of the
Christ mantle)
Lapis lazuli (precious
details)
Mid-FTIR, XRD
Azurite (with black carbon in
darker areas)
Azurite XRF, mid-FTIR, XRD
Smalt – XRF, near-FTIR
Green Cu-based pigments Cu-based pigments XRF
Azurite and lead-tin yellow – XRF, mid-FTIR, XRD
Yellow Lead–tin yellow (I) Lead–tin yellow (I) XRF, XRD
Yellow ochre Yellow ochre XRF, XRD, mid-FTIR
Red/orange Cinnabar Cinnabar XRF, UV–Vis absorption
Purple Madder lake Madder lake UV–Vis fluorescence
emission (steady state and
time resolved)
Brown Ochre Ochre XRF, XRD
White Lead white (hydrocerussite and
cerussite)
Lead white
(hydrocerussite and
cerussite)
Mid-FTIR, XRD
Black Bone black – Mid-FTIR
Incarnates Ochre and/or cinnabar with lead
white
Ochre and/or cinnabar
with lead white
XRF, UV–Vis absorption,
mid-FTIR, XRD
Gilding Pure gold by mixtion or by bole,
goethite and quartz
Pure gold by mixtion XRF, XRD
Binder2 Lipidic (weak signal of proteins
only in some areas with thin
paint)
Lipidic (weak signal
of proteins in some
areas)
Mid-FTIR
1 Portable XRD results refer only to the Antwerp painting2 See Sect. 3.2 for details on binding media identification
10 Page 14 of 35 Top Curr Chem (Z) (2016) 374:10
123
as Zn, Hg, and Se lead to a variety of tonalities from yellow to orange and red [52,
53].
The discrimination among formulations and structures of these series of
pigments, within the same family, is not straightforward, because their spectro-
scopic properties usually show strong similarities. In addition, XRD could not
always be applied because synthetic historical pigments have often been prepared
by imperfectly controlled reactions, producing not only crystalline but also highly
disordered phases. In this case, the exploitation of vibrational spectroscopy can be
particularly helpful, confirming FTIR and Raman spectroscopy in particular, as
specifically suitable techniques for non-invasive in situ discrimination of the
possible varieties.
The Raman spectrum of pure Naples yellow (Pb2Sb2O7) displays a typical
feature, that consists of strong band at about 510 cm-1 related to the symmetric
stretching of the SbO6 octahedra [85]. The same Raman scattering mode, in a
modified pyrochlore showing orange color, appears split in two bands, one again at
510 cm-1 (but much less intense) and another around 450 cm-1, with further
modifications occurring in the low wavenumber region. On the basis of a structural
study on standards of lead antimonate yellows, these spectral features have been
demonstrated to be distinctive of a doped pyrochlore with Sb partially substituted by
Zn or Sn [86, 87].
Yellow CdS is a semiconductor with a direct band gap of 2.41 eV (512 nm at
room temperature) [88] whose color can be tuned from yellow to light-yellow hues
by partially substituting cadmium with zinc in the crystal lattice, thus forming solid
solutions of cadmium zinc sulfide (Cd1-xZnxS) [89]. Alternatively, co-precipitation
with variable amounts of selenium leads to the formation of cadmium sulfo-selenide
solid solutions (CdS1-xSex) characterized by tonalities ranging from orange to red
[89]. The resonance-enhanced longitudinal optical Raman modes have been shown
to be linearly dependent on the Se and Zn molar fraction of the ternary solid
solutions. These linear relationships are exploitable for the in situ identification of
the composition of ternary pigments by resonance Raman spectroscopy.
In addition to these cases, the study of lead chromates and lead chromate–sulfate
co-precipitates has attracted specific interest, since their possible identification via
vibrational spectroscopy (i.e. IR and Raman) and XRD. These substances compose
the series of pigments known as chrome yellows that were often used by painters of
the late nineteenth century, as the impressionists and post-impressionists. They
show tonalities that range from yellow-orange to pale-yellow according to their
chemical composition (PbCrO4; PbCr1-xSxO4, with 0\ x\ 0.8) [90, 91]. Another
form of lead chromate-based pigment is the co-precipitate with lead oxide and is
commonly known as chrome orange [(1 - x)PbCrO4�xPbO] due to its deep orange
shade.
From the crystallographic point of view, PbCrO4 and chrome orange show
monoclinic structures, while that of PbSO4 is orthorhombic. It follows that a
structural change in PbCr1-xSxO4 co-precipitates is observed with increasing sulfur
content: when x exceeds 0.4–0.5, a modification from a monoclinic to an
orthorhombic structure takes place [95, 96].
Top Curr Chem (Z) (2016) 374:10 Page 15 of 35 10
123
Van Gogh himself, in the letters to his brother Theo and to his friend Emile
Bernard (letters n. 593, 595, 684, 687, 710, 863), mentions the use of three varieties
of lead chromate-based pigments, namely chrome yellow types I, II, and III,
probably corresponding to pale-yellow (S-richer PbCr1-xSxO4), yellow-orange
(PbCrO4) and orange [(1 - x)PbCrO4�xPbO] hues [92–94].It has been demonstrated that the darkening observed for chrome yellows, caused
by the photo-reduction of original chromates to Cr(III) compounds, is favoured
when the pigment is present in the orthorhombic S-rich form PbCr1-xSxO4 (x[ 0.4)
[75, 95–98]. Thus, the possibility to distinguish among different forms of lead
chromate-based pigments and to map their location all over the surface of a painting
is relevant for the assessment of the areas subject to a major risk of degradation.
In PbCr1-xSxO4 solid solutions, the chromate to sulfate substitution leads to a
volume decrease of the monoclinic unit cell at a low sulfate concentration and to a
change of the crystalline structure from monoclinic to orthorhombic with increasing
sulfur content. These modifications strongly affect the fundamental vibrational
bands of these materials (with changes of shape and wavenumber position of these
signals), making Raman and infrared spectroscopies suitable techniques for their
direct discrimination, even when using a non-invasive in situ approach.
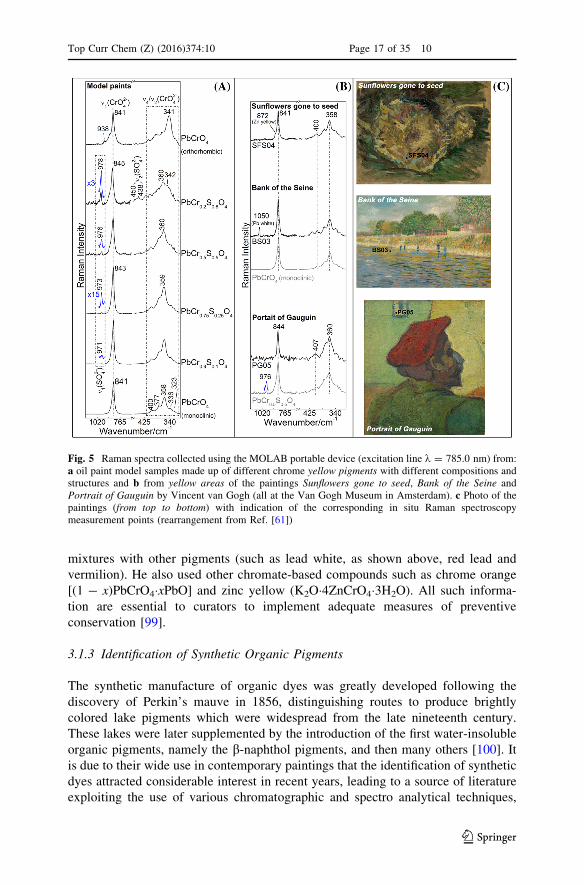
As is visible in Fig. 5, in the Raman spectra collected by a portable instrument
with a 785 nm laser excitation on a series of paint models, the chromate bending
multiplet [m2/m4 (Cr2O42-)] appears to be strongly affected by the sulfate
substitution, showing a clear shift of band positions and a modification of band
shapes related to the change of the crystalline structure. Additionally, the symmetric
stretching band of both sulfate [m1(SO42-)] and chromate [m1(CrO4
2-)] moieties
shifts slightly toward higher energy, as a function of the sulfate amount. Another
relevant effect of the chromate to sulfate substitution is the decrease of the Raman
scattering cross-section.
Based on the knowledge developed by the study of the laboratory model paints,
non-invasive Raman spectroscopy has been successfully applied in situ to study a
series of paintings by Van Gogh conserved at the Van Gogh Museum in
Amsterdam, namely Sunflowers gone to seed, Bank of the Seine, and Portrait of
Gauguin (Fig. 5). In Sunflowers gone to seed, the spectrum acquired from a yellow-
orange area shows the presence of monoclinic PbCrO4. The spectrum from a
greenish yellow area of Bank of the Seine shows again the spectral features of the
monoclinic PbCrO4, with the additional presence of a signal at 1050 cm-1
indicating a mixture with lead white. Finally, in a light yellow area of Portrait of
Gauguin, the chrome yellow pigment is identified as the unstable S-rich PbCr1-x-
SxO4 (x * 0.5). The presence of the sulfate component is well-evidenced by the
m1(SO42-) band at 976 cm-1 and changes of shape and positions of m1(CrO4
2-) and
m2/m4 (Cr2O42-) modes.
The presence of lead chromates and unstable lead chromate–sulfate co-
precipitates has been recently found by non-invasive in situ measurements also
on the Van Gogh’s famous Sunflowers painting, in the Van Gogh Museum of
Amsterdam [76].
These results unequivocally demonstrated that Van Gogh employed different
types of lead chromate–sulfate solid solutions, either in undiluted form or in
10 Page 16 of 35 Top Curr Chem (Z) (2016) 374:10
123
mixtures with other pigments (such as lead white, as shown above, red lead and
vermilion). He also used other chromate-based compounds such as chrome orange
[(1 - x)PbCrO4�xPbO] and zinc yellow (K2O�4ZnCrO4�3H2O). All such informa-
tion are essential to curators to implement adequate measures of preventive
conservation [99].
3.1.3 Identification of Synthetic Organic Pigments
The synthetic manufacture of organic dyes was greatly developed following the
discovery of Perkin’s mauve in 1856, distinguishing routes to produce brightly
colored lake pigments which were widespread from the late nineteenth century.
These lakes were later supplemented by the introduction of the first water-insoluble
organic pigments, namely the b-naphthol pigments, and then many others [100]. It
is due to their wide use in contemporary paintings that the identification of synthetic
dyes attracted considerable interest in recent years, leading to a source of literature
exploiting the use of various chromatographic and spectro analytical techniques,
Fig. 5 Raman spectra collected using the MOLAB portable device (excitation line k = 785.0 nm) from:a oil paint model samples made up of different chrome yellow pigments with different compositions andstructures and b from yellow areas of the paintings Sunflowers gone to seed, Bank of the Seine andPortrait of Gauguin by Vincent van Gogh (all at the Van Gogh Museum in Amsterdam). c Photo of thepaintings (from top to bottom) with indication of the corresponding in situ Raman spectroscopymeasurement points (rearrangement from Ref. [61])
Top Curr Chem (Z) (2016) 374:10 Page 17 of 35 10
123
namely high-performance liquid chromatography (HPLC), infrared and Raman
spectroscopy techniques [79, 101–104].
Mobile Raman spectroscopy can give a decisive contribution to the identification
of synthetic organic pigments when used in integrated applications with other
mobile techniques as XRF and FTIR. For example, identification of red azo b-naphthols occurred in an extensive campaign by MOLAB on paintings by Alberto
Burri dating from 1948 to 1975, belonging to the Collezione Albizzini (Citta di
Castello, Italy). Within the campaign, the use of synthetic red organic pigments by
Burri was identified in two paintings, Rosso (1950) and Rosso Gobbo (1954),
exploiting data from in situ XRF, FTIR and Raman spectroscopy (using a
portable micro-setup equipped with a 532 nm laser excitation).
In the painting Rosso (1950), the generic presence of a red organic pigment was
revealed by UV–Vis fluorescence, which showed a maximum emission around
630 nm. Being, however, insufficient to identify the nature of the pigment, the study
was deepened by exploiting a combination of non-invasive XRF and mid-FTIR
techniques. By XRF examination, these areas showed a weak but clear amount of
chlorine, whose presence was strictly related to the observed red regions (Fig. 6a,
gray line). The same areas, examined by mid-FTIR in reflection mode, revealed
specific distorted bands, consisting of derivative-like bands that corresponded to
those observed on both reflection and transmission spectra on the standard of
pigment red 4 (PR4; Fig. 6b).
This pigment is one of the four commercially available red azo b-naphthols, PR1,PR3, PR4, and PR6, which are characterized by a common structure where the azo
function (–N=N–) is bound to a naphthol group and to a 2,4-substituted aromatic
ring which features different substitutions for each pigment [100]. In particular, only
PR4 (chlorinated para red) and PR6 (parachlor red) show chlorine as an aromatic
ring substituent, although in different positions. This finding allowed the presence of
PR1 and PR3 to be excluded in the examined painting, circumscribing the
possibilities to PR4 or PR6. In spite of the fact that the FTIR spectrum recorded on
Rosso showed features very similar to those of the PR4 standard and in agreement
with literature data [103], the lack of a reference infrared spectrum of the positional
isomer PR6 did not allow a discrimination of the two pigments with absolute
certainty.
In another painting of Burri, Rosso Gobbo (1954), mid-FTIR spectroscopy
suggested the possible presence of the same red organic pigment. However, more
diverse than in the previous case, no secure PR4 distinctive features appeared in
FTIR (see Fig. 6b, black line) nor in XRF spectra, where a peak at 2.65 keV
corresponding to the chlorine Ka emission (Fig. 6a, inset) was too weak to be
assigned to chlorine with certainty. While XRF and FTIR did not permit an
unambiguous identification, here, micro-Raman spectroscopy measurements on the
same areas of the painting (Fig. 6c, black line) showed scattering features very
similar to those of the two red azo b-naphthols PR4 and PR3 (Fig. 6c, gray and light
gray lines). Further comparison of the recorded spectra with the standards indicated
that the observed strong signal at about 1580 cm-1 is present in PR4 and absent in
PR3. Furthermore, following Raman spectroscopy literature data [103, 104] it has
been possible to distinguish between the red azo b-naphthol pigments PR4 and PR3
10 Page 18 of 35 Top Curr Chem (Z) (2016) 374:10
123
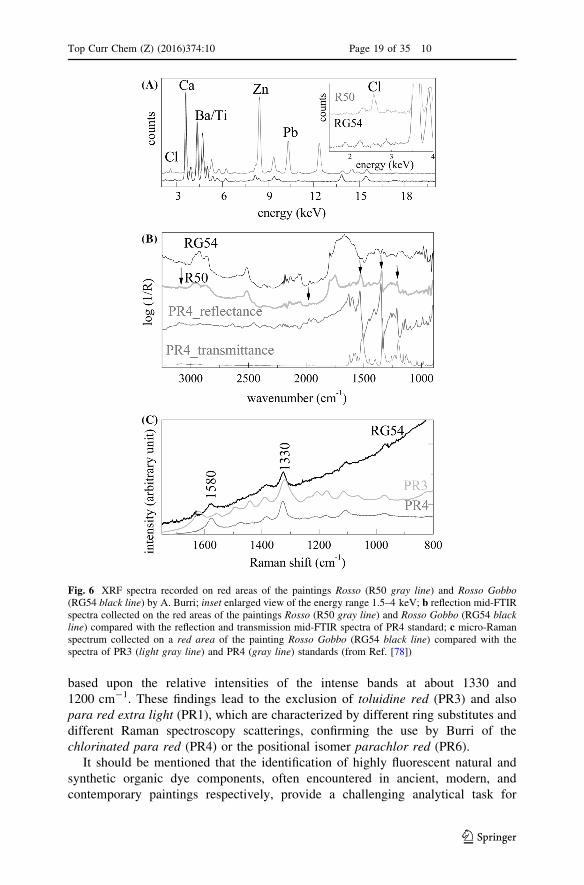
based upon the relative intensities of the intense bands at about 1330 and
1200 cm-1. These findings lead to the exclusion of toluidine red (PR3) and also
para red extra light (PR1), which are characterized by different ring substitutes and
different Raman spectroscopy scatterings, confirming the use by Burri of the
chlorinated para red (PR4) or the positional isomer parachlor red (PR6).
It should be mentioned that the identification of highly fluorescent natural and
synthetic organic dye components, often encountered in ancient, modern, and
contemporary paintings respectively, provide a challenging analytical task for
Fig. 6 XRF spectra recorded on red areas of the paintings Rosso (R50 gray line) and Rosso Gobbo(RG54 black line) by A. Burri; inset enlarged view of the energy range 1.5–4 keV; b reflection mid-FTIRspectra collected on the red areas of the paintings Rosso (R50 gray line) and Rosso Gobbo (RG54 blackline) compared with the reflection and transmission mid-FTIR spectra of PR4 standard; c micro-Ramanspectrum collected on a red area of the painting Rosso Gobbo (RG54 black line) compared with thespectra of PR3 (light gray line) and PR4 (gray line) standards (from Ref. [78])
Top Curr Chem (Z) (2016) 374:10 Page 19 of 35 10
123
conventional Raman spectroscopy in a non-invasive set-up as well as bench-top
applications. For this reason, in recent years, the potential of surface-enhanced
Raman spectroscopy (SERS) methodologies for the ultrasensitive detection of
organic dyes, colorants and pigments used by artists has been widely exploited and
appreciated. The introduction of this analytical tool in the field of heritage research
has significantly improved the chances of successfully identifying dyes on minute
samples. Furthermore, research efforts have been undertaken towards the develop-
ment of an analytical methodology to apply SERS directly to the painting surface.
Minimally invasive SERS substrates have been proposed based on silver-doped
methylcellulose removable gels specifically devised for use when investigating
organic dyes and pigments in paint layers, providing an enhancement of Raman
spectroscopy signals of about 103–104 [102, 105, 106].
3.2 Non-invasive Identification of Binding Media and Other Polymers
Chromatographic techniques (such as gas chromatography mass spectrometry
[GC–MS], pyrolysis gas chromatography mass spectrometry [Py–GC/MS], and
HPLC) have been proven to be the most suitable and consolidated analytical
methods for the full chemical characterization of natural and synthetic polymers
(binders) in paint micro-samples. Often these analyses are profitably preceded by
FTIR measurements on the same micro-samples, as a rapid method for a
preliminary characterization of the polymers, with possible indications on the
presence of pigments and fillers. In fact, binding media, basically proteins,
glycosides, and lipids, in ancient art and a wide range of synthetic polymers in
contemporary art show fairly distinctive vibrational features in the infrared range
[107–110].
Non-invasive reflection FTIR spectroscopy has, therefore, significant diagnostic
potentialities and, even in the presence of distortion effects due to the mixing of
specular and diffuse reflection or overlaps by pigment absorption bands, it has been
demonstrated to be a suitable technique for in situ discrimination of different
families of binders, such as lipids, proteins, and alkyd, vinyl, or acrylic resins,
without any sampling [12, 111].
3.2.1 Preliminary Laboratory Tests
To facilitate diagnostics, detailed studies have been carried out on the most relevant
features of near and mid-FTIR reflection spectra of binders in ancient and modern
art [22, 24, 37, 111, 112]. The investigation was performed recording reflection
spectra on paint reconstructions made of organic media (acrylic emulsion, polyvinyl
acetate resin, alkyd resin, drying oil, and proteinaceous tempera) mixed with several
pigments. This was done to better interpret any possible overlap of relevant
vibrational absorption bands of pigments and binders in the region of interest of the
spectra.
Spectral features relevant for diagnostics have been observed in three different
regions of the infrared spectrum.
10 Page 20 of 35 Top Curr Chem (Z) (2016) 374:10
123
First, the so-called fingerprint region (between 2000 and 400 cm-1) mainly
containing the fundamental modes of binders, as the carbonyl stretching mode
(1740–1730 cm-1), the amide I, II and III bands (1680–1200 cm-1), the CH
bending modes (1380–1480 cm-1), the symmetric stretching C–O–C mode
(1300–1200 cm-1), and the C–O and C–C stretching modes and C=C deformations
(1200–700 cm-1).
Second, the range between 3500 and 2800 cm-1 that includes the CH and NH
stretching modes of the organic binders. In particular, this range can be relevant for
the detection of proteinaceous media thanks to the amide A (at ca. 3300 cm-1) and
amide B (at ca. 3070 cm-1) bands [113] which, although not always visible, are
quite characteristic of polypeptide structures.
Third, the portion of the spectrum between 6000 and 3900 cm-1 corresponding
to the near infrared, mainly including combination and overtone bands of organic
compounds (CH, C=O, NH, C–O functional groups).
It has been noted that in the fingerprint region, vinyl and acrylic spectra show
derivative-shaped profiles, while proteins and oils, and to a lesser extent alkyds,
feature more broad bands (still distorted with respect to the transmission mode
spectra). Thus, it can be inferred that for vinyl and acrylic films, the surface
reflection is dominant while for the others there is a substantial contribution of
volume reflection, the difference being most probably related to the different
absorption coefficient of the polymers influencing the degree of light penetration.
Diversely, the other two regions at higher wavenumbers are characterized by a
prevalence of diffuse reflection. Generally, the presence of a pigment has the effect
of increasing the contribution from volume reflection with a moderate broadening of
the derivative shape that is stronger for the bands positioned at higher wavenum-
bers. Due to the possible coexistence of specular reflection and diffuse reflection, it
is not advisable to transform the reflectance spectra via the Kramers–Kronig
algorithm.
When all these features are taken into account, in spite of the spectral distortions
arising from the sum of the specular and diffuse reflection related to the pigment-
binder mixture and the overlaps with pigment bands, it is possible to individuate
diagnostic bands for each polymeric compound that can be exploited for its non-
invasive identification directly on ancient and modern paintings.
3.2.2 Examples of In Situ Studies
An initial example of the MOLAB analytical campaign is Memling’s triptych, as
presented in Fig. 1. In this case, the near-FTIR investigations registered C–H
combination bands at 4260 cm-1 (msCH ? dCH) and 4340 cm-1 (maCH ? dCH),attributable to lipids [37], on all of the points measured on the three panels. The
presence of lipids pointed towards the use of a drying oil and/or egg yolk as a
binding medium. Weak protein signals (4595 cm-1, first overtone mCO amide
I ? amide II; 4880 cm-1, (m ? d)NH) [37] were exclusively registered in some
small, damaged paint areas, where the inner ground layer emerged, probably bound
by glue [80].
Top Curr Chem (Z) (2016) 374:10 Page 21 of 35 10
123
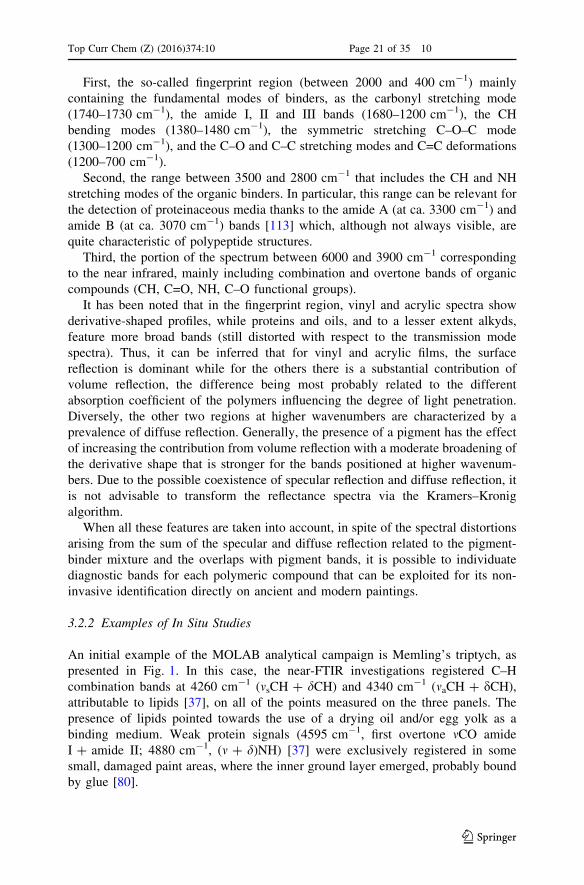
A further example is within the study of the painting Sestante 10 by Alberto
Burri, a modern painting which is part of a series created by the artist in 1982,
characterized by geometrical figures of different colour, shape, and surface
roughness (Fig. 7). Here, the use of different binders in different figures was found.
As shown in Fig. 7a, the spectrum recorded from a blue area showed features
clearly attributable to a vinyl binder, with the contribution of both diffuse and
Fig. 7 Detail of the paintingSestante 10 by A. Burri.a reflection FTIR spectrumrecorded in the indicated bluearea. b reflection FTIRspectrum recorded on theindicated red area (see text)
10 Page 22 of 35 Top Curr Chem (Z) (2016) 374:10
123

specular reflected light, leading to a mixed derivative/positive shape. In addition, the
comparison with reference models of ultramarine blue and ochre in a vinyl medium,
together with other standard reference spectra for fillers (see Fig. 7a), allowed the
presence of compounds, such as gypsum, calcium carbonate and kaolin to be
detected. Diversely, the spectrum of Fig. 7b, recorded in a red area, perfectly fitted
the reference spectrum from a standard of acrylic binder and lithopone, also
reported in the figure. The similarity of the spectral profiles included the presence of
the carbonyl band at about 1740 cm-1, the weaker CH bending at about 1460 cm-1
and the acrylic marker band m(CC) with inflection point around 1175 cm-1.
The exploitation of a large database of reference spectra for the interpretation of
the relevant infrared reflection features recorded on paintings of several contem-
porary artists led very recently to the in situ characterisation of binding media in
masterpieces by Hartung, Capogrossi, Turcato, Afro and other twentieth-century
Italian artists [111].
4 New Perspectives: In Situ Chemical Imaging
The recent development of advanced methods for element-selective or species-
selective imaging of painted surfaces has opened new perspectives for the non-
invasive in situ study of paintings. In fact, through these methods, the distribution of
elements or molecular moieties all over the entire painting can be drawn, giving
relevant information on composition and distribution of materials at the surface and
sub-surface of the paint. The information obtained profitably integrates the data by
point analyses, significantly improving the understanding of the artist’s creative
process (in some cases, including the identification of underpaintings).
Imaging methods for the study of elemental and molecular distributions on the
microscale are currently available in scanning electron microscopes or IR and
Raman micro-spectrometers or at specific micro-analysis synchrotron beam lines.
The extension of these imaging techniques to the macroscopic scale (large surface
of several square centimetres) for in situ non-invasive studies is not straightforward
and different approaches have been put recently into practice, each one with
appropriate advantages and limitations. Some of these methods are full-field
imaging methods, employing cameras or image plates sensitive to the range of the
electromagnetic spectrum of interest, while others are based on a scanning-mode
approach, using well-collimated beams over the painting.
4.1 X-ray Fluorescence Imaging
A scanner for macroscopic X-ray fluorescence imaging has been recently
implemented by Alfeld et al. [114] at Antwerp University to determine the
distribution of pigments on paintings over large areas. Although scanning conditions
can be varied, the scanner consists of an XZ motor stage in a typical setup, covering
a surface of 60 9 25 cm2, on which a 10-W Rh anode transmission tube is mounted,
together with a set of energy dispersive XRF detectors. In the scanning process, a
typical 0.8-mm lead pinhole collimator is employed as a beam-defining optic,
Top Curr Chem (Z) (2016) 374:10 Page 23 of 35 10
123
yielding a beam size of ca. 1.2 mm at the surface of the paint. The scanning is
carried out with a variable step size of 0.5–1 mm, with a variable dwell time.
Another macro-XRF scanner has become commercially available in recent years
from Bruker Nano GmbH (Berlin, Germany) under the name M6-Jetstream. This
system consists of an X-ray tube mounted with a silicon-drift-detector on an XZ
motor stage. Through scanning, the distribution image of the main elements that
compose the surface and sub-surface paint layers in an area of 80 9 60 cm2 is
obtained. The primary beam size can be varied between 50 lm and 1 mm, although
high-resolution scans are only possible in areas of limited size [115].
Alfeld et al. [115] have employed the Antwerp prototype and tested the Bruker
M6-Jetstream to carry out measurements on artworks of several painters. In
particular, with the Antwerp macro-XRF scanner, several paintings by van Gogh,
Goya, Memling, Rembrandt, amongst others [116, 117], have been investigated.
Due to the penetrative character of X-rays, the results obtained have been
profitably exploited, not simply to draw the distribution of elements (and related
pigments) over the surface, but also to reveal distinct features of underpaintings. In
fact, when pigments used in underpaintings have a fairly different atomic
composition with respect to those at the surface, the plot of the distribution of
specific elements leads to underpaint images that emerge with a better clarity than
achievable by traditional radiographies or IR reflectographies. In studies of works
by Van Gogh [118], Goya [119] and Rembrandt [120, 121], paintings that were
erroneously believed to be lost were found below the visible surface.
4.2 Hyperspectral infrared imaging
Delaney et al. have recently described the use of high-sensitivity, portable hyper-
spectral cameras suitable for the examination of paintings, drawings, and
manuscripts’ illuminations. These cameras can operate in various wavelength
ranges, in the visible and near-IR (up to 2500 nm), and are characterized by high
spectral (2.4–4 nm) and spatial resolutions (0.2–0.1 mm/pixel) [122–126].
These visible and near-infrared imaging spectroscopy systems have been
exploited to identify and display the distribution of various pigments, utilizing
electronic transitions, vibrational combination/overtone modes, and near-infrared
luminescence. By this method, through in situ measurements, the pigments used by
Picasso in the Harlequin Musician (1924), [122] part of the collection of the
National Gallery of Art, Washington D.C., were identified and mapped. The results
took significant advantage by the extension of imaging reflection spectroscopy up to
2500 nm and by the inclusion of luminescence imaging spectroscopy data. In
addition, the combination with site-specific in situ analysis, such as XRF, strongly
supported the achievement of a robust pigment identification and their mapping.
Very recently, the coupling of macro-XRF scanning and hyperspectral NIR
imaging have been also attempted, showing the high potentiality of integrating the
two imaging approaches to identify and map artist materials in an early Italian
Renaissance panel painting [127].
In addition to the study of pigments, hyperspectral imaging in the near IR range
has been also experimented to test the performance of the method for the study of
10 Page 24 of 35 Top Curr Chem (Z) (2016) 374:10
123
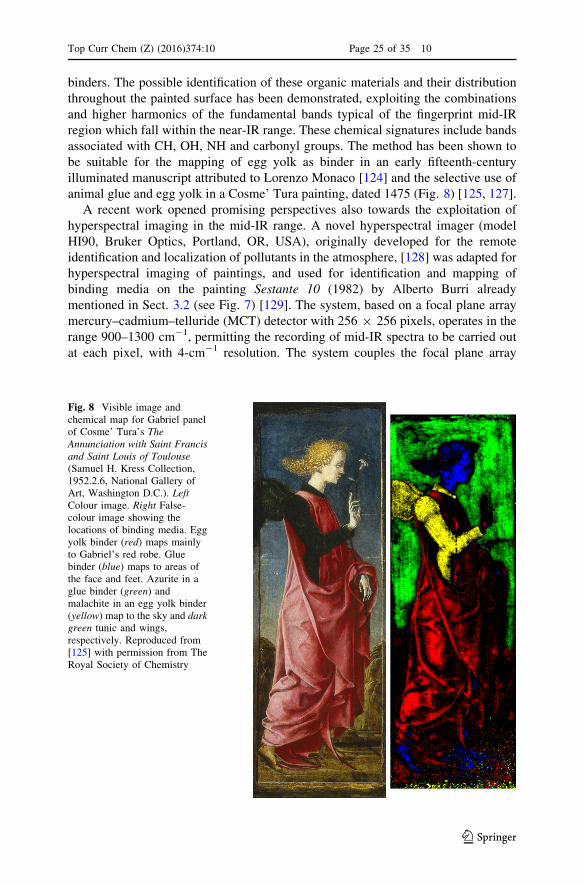
binders. The possible identification of these organic materials and their distribution
throughout the painted surface has been demonstrated, exploiting the combinations
and higher harmonics of the fundamental bands typical of the fingerprint mid-IR
region which fall within the near-IR range. These chemical signatures include bands
associated with CH, OH, NH and carbonyl groups. The method has been shown to
be suitable for the mapping of egg yolk as binder in an early fifteenth-century
illuminated manuscript attributed to Lorenzo Monaco [124] and the selective use of
animal glue and egg yolk in a Cosme’ Tura painting, dated 1475 (Fig. 8) [125, 127].
A recent work opened promising perspectives also towards the exploitation of
hyperspectral imaging in the mid-IR range. A novel hyperspectral imager (model
HI90, Bruker Optics, Portland, OR, USA), originally developed for the remote
identification and localization of pollutants in the atmosphere, [128] was adapted for
hyperspectral imaging of paintings, and used for identification and mapping of
binding media on the painting Sestante 10 (1982) by Alberto Burri already
mentioned in Sect. 3.2 (see Fig. 7) [129]. The system, based on a focal plane array
mercury–cadmium–telluride (MCT) detector with 256 9 256 pixels, operates in the
range 900–1300 cm-1, permitting the recording of mid-IR spectra to be carried out
at each pixel, with 4-cm-1 resolution. The system couples the focal plane array
Fig. 8 Visible image andchemical map for Gabriel panelof Cosme’ Tura’s TheAnnunciation with Saint Francisand Saint Louis of Toulouse(Samuel H. Kress Collection,1952.2.6, National Gallery ofArt, Washington D.C.). LeftColour image. Right False-colour image showing thelocations of binding media. Eggyolk binder (red) maps mainlyto Gabriel’s red robe. Gluebinder (blue) maps to areas ofthe face and feet. Azurite in aglue binder (green) andmalachite in an egg yolk binder(yellow) map to the sky and darkgreen tunic and wings,respectively. Reproduced from[125] with permission from TheRoyal Society of Chemistry
Top Curr Chem (Z) (2016) 374:10 Page 25 of 35 10
123
detector with an interferometer and, exploiting the multiplex advantage, allows for
recording a complete hyperspectral data cube in one single measurement of a few
tens of seconds.
With a setup based on 128 9 128 pixels, three areas (ca. 9 9 9 cm2) of the large
painting (250 9 360 cm2) were analyzed on site at the Ex-Seccatoi del Tabacco
(Citta’ di Castello, Italy), where the painting is in permanent exhibition, through
measurements that required 80 s per each cube.
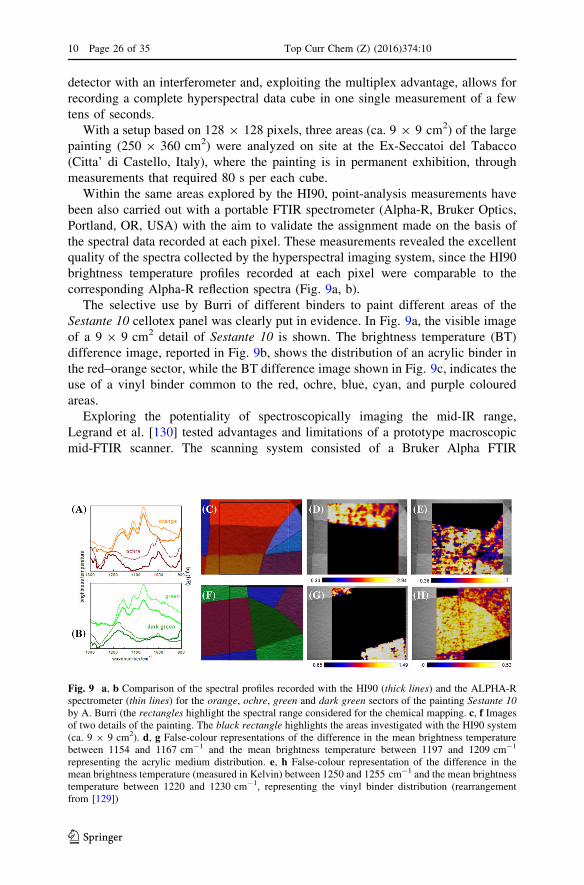
Within the same areas explored by the HI90, point-analysis measurements have
been also carried out with a portable FTIR spectrometer (Alpha-R, Bruker Optics,
Portland, OR, USA) with the aim to validate the assignment made on the basis of
the spectral data recorded at each pixel. These measurements revealed the excellent
quality of the spectra collected by the hyperspectral imaging system, since the HI90
brightness temperature profiles recorded at each pixel were comparable to the
corresponding Alpha-R reflection spectra (Fig. 9a, b).
The selective use by Burri of different binders to paint different areas of the
Sestante 10 cellotex panel was clearly put in evidence. In Fig. 9a, the visible image
of a 9 9 9 cm2 detail of Sestante 10 is shown. The brightness temperature (BT)
difference image, reported in Fig. 9b, shows the distribution of an acrylic binder in
the red–orange sector, while the BT difference image shown in Fig. 9c, indicates the
use of a vinyl binder common to the red, ochre, blue, cyan, and purple coloured
areas.
Exploring the potentiality of spectroscopically imaging the mid-IR range,
Legrand et al. [130] tested advantages and limitations of a prototype macroscopic
mid-FTIR scanner. The scanning system consisted of a Bruker Alpha FTIR
Fig. 9 a, b Comparison of the spectral profiles recorded with the HI90 (thick lines) and the ALPHA-Rspectrometer (thin lines) for the orange, ochre, green and dark green sectors of the painting Sestante 10by A. Burri (the rectangles highlight the spectral range considered for the chemical mapping. c, f Imagesof two details of the painting. The black rectangle highlights the areas investigated with the HI90 system(ca. 9 9 9 cm2). d, g False-colour representations of the difference in the mean brightness temperaturebetween 1154 and 1167 cm-1 and the mean brightness temperature between 1197 and 1209 cm-1
representing the acrylic medium distribution. e, h False-colour representation of the difference in themean brightness temperature (measured in Kelvin) between 1250 and 1255 cm-1 and the mean brightnesstemperature between 1220 and 1230 cm-1, representing the vinyl binder distribution (rearrangementfrom [129])
10 Page 26 of 35 Top Curr Chem (Z) (2016) 374:10
123
spectrometer that was moved all along the XZ plane in front of the painting, while
FTIR spectra were recorded in reflection mode. Since this device scans the object
point-by-point, the recording of full spectra over an extended mid-IR-range
(7500–400 cm-1) at each position is possible, identifying the compounds present
and visualizing their distribution based on their fingerprint features. In one of the
performance tests of the system, spectra were recorded on a detail (8 9 8 cm2) of an
unvarnished folk-art panel painting of Antillean origin (probably twentieth century).
The obtained mid-FTIR chemical distributions were compared and integrated with
the elemental distributions recorded from macroscopic XRF imaging measurements
on the same area, finding good correlations. The crossing of the data by the two
approaches allowed a wide and satisfying visualization of pigment distributions in
red, orange, yellow, green, and blue areas [130].
A comparison between the performances of the two full-field and macro-
scanning approaches in mid-FTIR reveal complementary limits and potentials.
A substantial advantage of the macro-FTIR scanning configuration is that full
spectra are recorded at each position all over the surface of the painting in the whole
range from 7500 to 400 cm-1, obtaining a large quantity of exploitable data.
However, a major important limitation of the prototype macro-FTIR scanner is the
time required to record a hyperspectral dataset that can amount to numerous days
for large surfaces. Nevertheless, many possibilities are available to improve this
aspect, including the use of a more powerful source of mid-IR radiation and of
larger beam focusing and/or collection optics for the reflected radiation. A great
advantage of the full-field configuration of the Bruker HI90 is the fact that the time
necessary to record all the spectra in the examined 9 9 9 cm2 areas (16,384 spectra)
amounts only to 80 s. A major limitation of the HI90 instrument is in the short
wavenumber range that can be explored in the present configuration. This limit is
expected to be overcome in the future with extension to larger wavenumber ranges.
An additional significant limitation of mid-IR imaging, in both full-field and
macro-scanning approaches, lays in the fact that it can be significantly applied only
to unvarnished paintings or to paintings where the varnish has been removed.
Fortunately, for many paintings under restoration, the varnish is at least partially
removed in the preliminary phases of the intervention.
All the innovative data acquired in the most recent years on macroscopic
chemical imaging by XRF and near- and mid-IR spectroscopy open new significant
perspectives for the in situ non-invasive study of paintings. In particular, in situ
macro-XRF imaging is expected to become a widely diffused technique in the near
future, due to both the availability of commercial instrumentation and the
straightforward and reliable interpretation of elemental spectra. On the other side,
both near and mid-IR imaging represent powerful techniques that can deliver
complementary information on the distribution of inorganic and organic materials
which cannot be detected or identified in a unique manner by means of XRF
elemental data. In particular, they can give information on natural and synthetic
binders otherwise impossible to be non-invasively mapped.
Further related research is currently in development for the setup of new methods
for the in situ identification and mapping of chemical components on large areas of
paintings. Of great interest are those regarding macro-XRD imaging, where
Top Curr Chem (Z) (2016) 374:10 Page 27 of 35 10
123
laboratory experiments based on application of synchrotron radiation sources lead to
encouraging successful results [131, 132]. Using synchrotron light, high-energy
(80–120 keV) XRD imaging has been recently experimented for the non-invasive
measurement (in transmission mode) of crystalline phase distributions in paintings.
Potentials and limitations of the experimented technique have been demonstrated
using an authentic sixteenth-century painting as well as model paintings [132]. Very
recently, promising preliminary experimentations have been carried out for the
transfer of the technique from the synchrotron to a compact prototypical system
suitable for in situ applications [117].
5 Conclusions
The results on the most recent in situ application of non-invasive methodologies
outlined in this paper clearly show how the integration of data from different
analytical techniques can successfully overcome the intrinsic limitation of each
single spectroscopic method when applied on heterogeneous samples. At the same
time, an accurate and systematic preliminary work on test samples allows for
overcoming complications imposed by specific optical and matrix effects, making a
satisfactory interpretation of reflection spectra possible.
The presented modus operandi, optimized after years of technological advances
and experience, is based on exploring the atomic and the molecular levels, probing
either electronic or vibrational properties (inducing absorption, emission and/or
scattering phenomena), and employing techniques that are sensitive to highly or
poorly ordered systems. The method allows today’s researchers to successfully
identify pigments in paintings with adequate certainty and completeness, fully
avoiding sampling. In addition, through the exploitation of reflection near- and mid-
FTIR spectroscopy, the family of natural binders widely used in ancient art (lipidic,
proteic, glucosidic) can be disclosed, as well as of synthetic resins, as vinyl, acrylic,
and alkyd, largely employed in contemporary art. Recently, thanks to accurate and
detailed preliminary laboratory tests on a wide set of pigment specimens it has also
become possible in some cases to distinguish composition and structures among a
variety of inorganic pigments belonging to an extended series of compounds sharing
the same chemical class, such as the series of chromate–sulfate coprecipitates,
cadmium sulfides and lead antimonates. In this case, appropriate information is
obtained by Raman spectroscopy through measurements that do not require long
accumulation times nor specific arrangements, apart from control of the power of
the radiation used. The unique advantage of Raman spectroscopy is the possibility
to identify partial or totally amorphous phases frequently encountered in cases of
pigments synthesized in ancient times.
More challenging is the identification of organic pigments. In this case, however,
the synergic use of techniques such as FTIR, UV–Vis and Raman spectroscopy can
lead to satisfactory results. In particular, while UV–Vis absorption and fluorescence
can indicate a colorant’s family, Raman spectroscopy can directly lead, in case of
good scattering cross sections, to its unambiguous molecular identification.
Interesting perspectives are opened by the rapid affirmation of SERS techniques,
10 Page 28 of 35 Top Curr Chem (Z) (2016) 374:10
123
although this approach for non-invasive in situ applications still remains at the
experimental level.
Significant advances in the non-invasive in situ study of painting materials is
represented by the chemical imaging techniques. A prototype macro-XRF scanner
has been set up and exploited to identify and map the distribution of elements (and
related pigments) over the surface of numerous paintings, as well as to reveal
distinct features of underpaintings, with a clearness obtained better than that
obtained by other traditional imaging techniques. By this method, paintings
originally believed to be lost were brought to new light.
The most significant perspectives of further advancements rely on the infrared
hyperspectral imaging. In the near-IR, the most recent hardware and software
achievements allowed successful results to be obtained. A few cases of integrating
macro-XRF and hyperspectral near-IR imaging have been also successfully
experimented.
However, much work remains to be done for the development of methods in the
mid-IR where the systems experimented to date have shown interesting solutions,
but with problems still existing for data acquisition times, for the systems based on
surface scanning, for extension of the explorable wavelength range, and for the full-
field systems. In both cases, good perspectives for improvement are open, which
rely on the use of a more powerful source of mid-IR radiation and better focusing
and collection optics for the reflected radiation in case of the scanning method and
on the introduction of new detectors for the full-field approach.
Acknowledgments The MOLAB activities described in this work were possible thanks to the support
of the European Commission, through the Research Infrastructure projects Eu-ARTECH (FP6-RII3-CT-
2004-506171) and CHARISMA (FP7-GA n. 228330) and of the Laboratorio di Diagnostica di Spoleto.
The authors are grateful to several researchers that contributed to MOLAB activities: C. Anselmi, D. Buti,
L. Cartechini, A. Chieli, A. Daveri, F. Gabrieli, C. Grazia, P. Moretti, F. Presciutti, M. Vagnini. Kind
permission from J. Wiley and Sons to reproduce Fig. 5 (from Ref. [61]) and rearrange Fig. 9 (from Ref.
[129]) is acknowledged. Figures 2, 3 and 4 are reproduced from Ref. [80] and Fig. 8 from Ref. [125] with
permission of the Royal Society of Chemistry.
References
1. Brunetti BG, Clark AJ, Sgamellotti A (eds) (2010) Advanced techniques in art conservation. Acc
Chem Res 43(6):693-4
2. Sgamellotti A, Brunetti BG, Miliani C (eds) (2014) Science and art. The painted surface. The Royal
Society of Chemistry, Cambridge
3. Clark RJH (1995) Raman microscopy: application to the identification of pigments on medieval
manuscripts. Chem Soc Rev 24:187–196
4. Burgio L, Ciomartan DA, Clark RJH (1997) Pigment identification on medieval manuscripts,
paintings and other artefacts by Raman microscopy: applications to the study of three German
manuscripts. J Mol Struct 405:1–11
5. MacArthur JD, Del Carmine P, Lucarelli F, Mando PA (1990) Identification of pigments in some
colours on miniatures from the medieval age and early Renaissance. Nucl Instr Meth B 45:315–321
6. Wagner W, Neelmeijer C (1995) External proton beam analysis of layered objects. Fresenius J Anal
Chem 353:297–302
7. Brissaud I, Guillo A, Lagarde G, Midya P, Calligaro T, Salomon J (1999) Determination of the
sequence and thicknesses of multilayers in an easel painting. Nucl Instr Meth B 155:447–452
Top Curr Chem (Z) (2016) 374:10 Page 29 of 35 10
123
8. Janssens K, Vittiglio G, Deraedt I, Aerts A, Vekemans B et al (2000) Use of microscopic XRF for
non-destructive analysis in art and archaeometry. X-Ray Spectrom 29:73–91
9. Eu-ARTECH, Access, research and technology for the conservation of the European Cultural
Heritage, 6th FP RII3-CT-2004-506171 (2004–2009). www.euartech.org
10. CHARISMA, Cultural heritage advanced research infrastructures: synergy for a multidisciplinary
approach to conservation, 7th FP GA n. 228330 (2009–2014). www.charismaproject.eu
11. IPERION CH, Integrated platform for the European Research Infrastructure on Cultural Heritage,
H2020 RIA n. 654028 (2014–2015). www.iperionch.eu
12. Miliani C, Rosi F, Brunetti BG, Sgamellotti A (2010) In situ non-invasive study of artworks: The
MOLAB multi-technique approach. Acc Chem Res 43:728–738
13. Cesareo R, Frazzoli FV, Mancini C, Sciuti S, Marabelli M, Mora P, Rotondi P, Urbani G (1972)
Non-destructive analysis of chemical elements in paintings and enamels. Archaeometry 14:65–78
14. Hall ET, Schweizer F, Toller PA (1973) X-ray fluorescence analysis of museum objects: a new
instrument. Archaeometry 15:53–78
15. Moioli P, Seccaroni C (2000) Analysis of art objects using a portable X-ray fluorescence spec-
trometer. X-Ray Spectrom 29:48–52
16. Brunetti BG, Seccaroni C, Sgamellotti A (eds) (2004) The painting technique of Pietro Vannucci,
called il Perugino. Nardini, Firenze
17. Roy A, Spring M (eds) (2007) Raphael’s painting technique: working practice before Rome.
Nardini, Firenze
18. Menu M, Ravaud E (eds) (2009) Andrea Mantegna painting technique. Special issue of Techne’.
C2RMF, Paris
19. de Viguerie L, Sole VA, Walter Ph (2009) Multilayers quantitative X-ray fluorescence analysis
applied to easel paintings. Anal Bioanal Chem 395:2015–2020
20. Bonizzoni L, Galli A, Poldi G, Milazzo M (2007) In situ non-invasive EDXRF analysis to
reconstruct stratigraphy and thickness of Renaissance pictorial multilayers. X-Ray Spectrom
36:55–61
21. del Viguerie L, Walter Ph, Laval E, Mottin B, Sole VA (2010) Revealing the sfumato technique of
Leonardo da Vinci by X-Ray fluorescence spectroscopy. Angew Chem Int Ed 49:6125–6128
22. Miliani C, Rosi F, Borgia I, Benedetti P, Brunetti BG, Sgamellotti A (2007) Fiber-optic Fourier
Transform mid-infrared reflectance spectroscopy: A suitable technique for in situ studies of mural
paintings. Appl Spectrosc 61:293–299
23. Miliani C, Rosi F, Burnstock A, Brunetti BG, Sgamellotti A (2007) Non-invasive in situ investi-
gations versus micro-sampling: a comparative study on a Renoir’s painting. Appl Phys A
89:849–856
24. Rosi F, Daveri A, Miliani C, Verri G, Benedetti P, Pique F, Brunetti BG, Sgamellotti A (2009) Non-
invasive identification of organic materials in wall paintings by fiber optic reflectance infrared
spectroscopy: a statistical multivariate approach. Anal Bioanal Chem 395:2097–2106
25. Rosi F, Burnstock A, Van den Berg KJ, Miliani C, Brunetti BG, Sgamellotti A (2009) A non-
invasive XRF study supported by multivariate statistical analysis and reflectance FTIR to assess the
composition of modern painting materials, Spectrochim. Acta A 71:1655–1662
26. Kahrim K, Daveri A, Rocchi P, de Cesare G, Cartechini L, Miliani C, Brunetti BG, Sgamellotti A
(2009) The application of in situ mid-FTIR fibre-optic reflectance spectroscopy and GC–MS
analysis to monitor and evaluate painting cleaning. Spectrochim Acta A 74:1182–1188
27. Rosi F, Daveri A, Doherty B, Nazzareni S, Brunetti BG, Sgamellotti A, Miliani C (2010) On the use
of overtone and combination bands for the analysis of the CaSO4–H2O system by mid-infrared
reflection spectroscopy. Appl Spectrosc 64:956–963
28. Miliani C, Rosi F, Daveri A, Brunetti BG (2012) Reflection infrared spectroscopy for the non-
invasive in situ study of artists’ pigments. Appl Phys A 106:295–307
29. Buti D, Rosi F, Brunetti BG, Miliani C (2013) In-situ identification of copper-based green pigments.
Anal Bioanal Chem 405:2699–2711
30. Doherty B, Daveri A, Clementi C, Romani A, Bioletti S, Brunetti BG, Sgamellotti A, Miliani C
(2013) The Book of Kells: A non-invasive MOLAB investigation by complementary spectroscopic
techniques. Spectrochim Acta A 115:330–336
31. Daveri A, Doherty B, Moretti P, Grazia C, Romani A, Fiorin E, Brunetti BG, Vagnini M (2015) An
uncovered XIII century icon: Particular use of organic pigments and gilding techniques highlighted
by analytical methods. Spectrochim Acta A 135:398–404
10 Page 30 of 35 Top Curr Chem (Z) (2016) 374:10
123
32. Buti D, Domenici D, Miliani C, Garcıa Saiz C, Gomez Espinoza T, Jımenez Villalba F, Verde
Casanova A, Sabıa de la Mata A, Romani A, Presciutti F, Doherty B, Brunetti BG, Sgamellotti A
(2014) Non-invasive investigation of a pre-Hispanic Maya screenfold book: The Madrid Codex.
J Archaeol Sci 42:166–178
33. Fabbri M, Picollo M, Porcinai S, Bacci M (2001) Mid-infrared fiber-optics reflectance spec-
troscopy: A non-invasive technique for remote analysis of painted layers. Part I: Technical setup.
Appl Spectrosc 55:420–427
34. Fabbri M, Picollo M, Porcinai S, Bacci M (2001) Mid-infrared fiber-optics reflectance spec-
troscopy: A non-invasive technique for remote analysis of painted layers. Part II: Statistical analysis
of spectra. Appl Spectrosc 55:428–433
35. Griffiths P, De Haseth JA (2007) Fourier transform infrared spectrometry, 2nd edn. Wiley, New
York
36. Miliani C, Daveri A, Brunetti BG, Sgamellotti A (2008) CO2 entrapment in natural ultramarine
blue. Chem Phys Lett 446:148–151
37. Vagnini M, Miliani C, Cartechini L, Rocchi P, Brunetti BG, Sgamellotti A (2009) FT-NIR spec-
troscopy for non-invasive identification of natural polymers and resins in easel paintings. Anal
Bioanal Chem 395:2107–2118
38. Jurado Lopez A, Luque De Castro MD (2004) Use of near-infrared spectroscopy in a study of
binding media in paintings. Anal Bioanal Chem 380:706–771
39. Wendlandt WW, Hecht HG (1966) Reflectance spectroscopy. Interscience Publishers, New York
40. Bacci M, Baldini F, Carla R, Linari R, Picollo M, Radicati B (1993) Colour analysis of the
Brancacci Chapel frescoes. Appl Spectrosc 47:399–402
41. Bacci M, Casini A, Cucci C, Picollo M, Radicati B, Vervat M (2003) Non-invasive spectroscopic
measurements on the ‘‘Il ritratto della figliastra’’ by Giovanni Fattori: identification of pigments and
colorimetric analysis. J Cult Herit 4:329–336
42. Bacci M, Picollo M, Trumpy G, Tsukada M, Kunzelman D (2007) Non-invasive identification of
white pigments on 20th-century oil paintings by using fiber optic reflectance spectroscopy. J Am
Inst Conserv 46:27–37
43. Bruni S, Caglio S, Guglielmi V, Poldi G (2008) The joined use of non-invasive spectroscopic
analyses – FTIR, Raman, visible reflectance spectrometry and EDXRF – to study drawings and
illuminated manuscripts. Appl Phys A 92:103–108
44. Ricciardi P, Delaney J, Facini M, Glinsman L (2013) Use of imaging spectroscopy and in situ
analytical methods for the characterization of the materials and techniques of 15th century illu-
minated manuscripts. J Am Inst Conserv 52:13–29
45. Aceto M, Agostino A, Fenoglio G, Idone A, Gulmini M, Picollo M, Ricciardi P, Delaney JK (2014)
Characterisation of colourants on illuminated manuscripts by portable fibre optic UV–visible-NIR
reflectance spectrophotometry. Anal Methods 6:1488–1500
46. Romani A, Clementi C, Miliani C, Favaro G (2010) Fluorescence Spectroscopy: A Powerful
Technique for the Noninvasive Characterization of Artwork. Acc Chem Res 43:837–846
47. Clementi C, Doherty B, Gentili P, Miliani C, Romani A, Brunetti BG, Sgamellotti A (2008)
Vibrational and electronic properties of painting lakes. Appl Phys A 92:25–33
48. Clementi C, Miliani C, Romani A, Favaro G (2006) In situ fluorimetry: A powerful noninvasive
diagnostic technique for natural dyes used in artefacts Part I. Spectral characterization of orcein in
solution, on silk and wool laboratory-standards and a fragment of Renaissance tapestry. Spec-
trochim Acta, Part A 64:906–912
49. Miliani C, Romani A, Favaro G (1998) Spectrophotometric and fluorimetric study of some
anthraquinoid and indigoid colorants used in artistic paintings. Spectrochim Acta, Part A
54:581–588
50. Buti D (2009) Ph.D. Thesis, University of Firenze
51. Clementi C, Rosi F, Romani A, Vivani R, Brunetti BG, Miliani C (2012) Photoluminescence
properties of zinc oxide in paints: A study of the effect of self-absorption and passivation. Appl
Spectrosc 66:1233–1241
52. Rosi F, Grazia C, Gabrieli F, Romani A, Paolantoni M, Vivani R, Brunetti BG, Colomban Ph,
Miliani C (2016) UV–Vis-NIR and micro Raman spectroscopies for the non destructive identifi-
cation of Cd1-xZnxS solid solutions in cadmium yellow pigments. Microchem J 124:856–867
53. Grazia C, Rosi F, Gabrieli F, Romani A, Paolantoni M, Vivani R, Brunetti BG, Colomban Ph,
Miliani C (2016) A multitechnique approach for investigating the composition of ternary CdS1-xSexsolid solutions employed as artists’ pigments. Microchem J 125:279–289
Top Curr Chem (Z) (2016) 374:10 Page 31 of 35 10
123
54. Accorsi G, Verri G, Bolognesi M, Armaroli N, Clementi C, Miliani C, Romani A (2009) The
exceptional near-infrared luminescence properties of cuprorivaite (Egyptian blue). Chem Commun
3392–3394
55. Clementi C, Miliani C, Verri G, Sotiropoulou S, Romani A, Brunetti BG, Sgamellotti A (2009)
Application of the Kubelka-Munk correction for self-absorption of fluorescence emission in car-
mine lake paint layers. Appl Spectrosc 63:1323–1330
56. Simonot L, Thoury M, Delaney JK (2011) Extension of the Kubelka-Munk theory for fluorescent
turbid media to a non-opaque layer on a background. J Opt Soc Am 28:1349–1357
57. Romani A, Clementi C, Miliani C, Brunetti BG, Sgamellotti A, Favaro G (2008) Portable equip-
ment for luminescence lifetime measurements on surfaces. Appl Spectrosc 62:1395–1399
58. Nevin A, Cesaratto A, Bellei S, D’Andrea C, Toniolo L, Valentini G, Comelli D (2014) Time-
Resolved Photoluminescence Spectroscopy and Imaging: New Approaches to the Analysis of
Cultural Heritage and Its Degradation. Sensors 14:6338–6355 and references therein59. Romani A, Grazia C, Anselmi C, Miliani C, Brunetti BG (2011) New portable instrument for
combined reflectance, time-resolved and steady-state luminescence measurements on works of art.
In: Pezzati L, Salimbeni R (eds) SPIE Proceedings Vol. 8084: O3A: Optics for Arts, Architecture,
and Archaeology III. doi:10.1117/12.889529
60. Colomban Ph (2012) The on-site/remote Raman analysis with mobile instruments: a review of
drawbacks and success in cultural heritage studies and other associated fields. J Raman Spectrosc
43:1529–1535
61. Monico L, Janssens K, Hendriks E, Brunetti BG, Miliani C (2014) Raman study of different
crystalline forms of PbCrO4and PbCr1-xSxO4 solid solutions for the non-invasive identification of
chrome yellows in paintings: a focus on works by Vincent van Gogh. J Raman Spectrosc
45:1034–1045
62. Nakai I, Abe Y (2012) Portable X-ray powder diffractometer for the analysis of art and archaeo-
logical materials. Appl Phys A 106:279–293
63. Gatto Rotondo G, Romano FP, Pappalardo G, Pappalardo L, Rizzo F (2010) Nondestructive
characterization of fifty various species of pigments of archaeological and artistic interest by using
the portable X-ray diffraction system of the LANDIS laboratory of Catania (Italy). Microchem J
96:252–258
64. Romano FP, Pappalardo L, Masini N, Pappalardo G, Rizzo F (2011) The compositional and
mineralogical analysis of fired pigments in Nasca pottery from Cahuachi (Peru’) by the combined
use of the portable PIXE-alpha and portable XRD techniques. Microchem J 99:449–453
65. Chiari G (2008) Saving art in situ. Nature 453:159
66. Sarrazin P, Chiari G, Gailhanou M (2008) A portable non-invasive XRF/XRD instrument for the
study of art objects. Adv X-Ray Anal 52:175–186
67. Gianoncelli A, Castaing J, Ortega L, Dooryhee E, Salomon J, Walter Ph, Hodeau JL, Bordet P
(2008) X-Ray Spectrom 37:418–423
68. Duran A, Perez-Rodriguez JL, Espejo T, Franquelo ML, Castaing J, Walter Ph (2009) Anal Bioanal
Chem 395:1997–2004
69. Pages-Camagna S, Laval E, Vigears D, Duran A (2010) Non-destructive and in situ analysis of
Egyptian wall paintings by X-ray diffraction and X-ray fluorescence portable systems. Appl Phys A
100:671–675
70. Chiari G (2010) Analyzing stratigraphy with a dual XRD/XRF instrument. Denver X-ray confer-
ence abstracts. http://www.dxcicdd.com/10/DXC_list_abstract.asp
71. Uda M, Ishizaki A, Satoh R, Okada K, Nakajima Y, Yamashita D, Ohashi K, Sakuraba Y, Shimono
A, Kojima D (2005) Portable X-ray diffractometer equipped with XRF for archaeometry. Nucl Instr
Meth B 239:77–84
72. Mendoza Cuevas A, Perez Gravie H (2011) Portable energy dispersive X-ray fluorescence and
X-ray diffraction and radiography system for archaeometry. Nucl Instrum Methods A 633:72–78
73. Mendoza Cuevas A, Bernardini F, Gianoncelli A, Tuniz C (2015) Energy dispersive X-ray
diffraction and fluorescence portable system for cultural heritage applications. X-Ray Spectrom
44:105–115
74. Bracci S, Falletti F, Matteini M, Scopigno R (eds) (2004) Exploring David. Diagnostic tests and
state of conservation. Giunti, Firenze
75. Monico L, Janssens K, Miliani C, Brunetti BG, Vagnini M et al (2013) Degradation process of lead
chromate in paintings by Vincent van Gogh studied by means of spectromicroscopic methods. 3.
10 Page 32 of 35 Top Curr Chem (Z) (2016) 374:10
123
Synthesis, characterization, and detection of different crystal forms of the chrome yellow pigment.
Anal Chem 85:851–859
76. Monico L, Janssens K, Hendricks E, Vanmeert F, Van der Schnickt G, Cotte M, Falkemberg G,
Brunetti BG, Miliani C (2015) Evidence for degradation of the chrome yellows in Van Gogh
Sunflowers: a study by non-invasive methods and synchrotron radiation-based X-ray techniques.
Angew Chem Int Ed 54:13923–13927
77. Casadio F, Miliani C, Rosi F, Romani A, Anselmi C, Brunetti BG, Sgamellotti A, Andral JL,
Gautier G (2013) Scientific investigations on an important corpus of Picasso paintings in Antibes:
New insights into technique, conditions and chronological sequence. J Am Inst Conserv 52:184–204
78. Rosi F, Miliani C, Clementi C, Kahrim K, Presciutti F, Vagnini M, Manuali V, Daveri A, Cartechini
L, Brunetti BG, Sgamellotti A (2010) An integrated spectroscopic approach for the non-invasive
study of modern art materials and techniques. Appl Phys A 100:613–624
79. Van Bommel MR, Janssen H, Spronk R (eds) (2012) Inside out Victory Boogie Woogie. A material
history of Mondrian’s masterpiece. Amsterdam University Press, Amsterdam
80. Van der Snickt G, Miliani C, Janssens K, Brunetti BG, Romani A, Rosi F, Walter Ph, Castaing J, De
Nolf W, Klaassen L, Labarque I, Wittermann R (2011) Material analyses of ‘‘Christ with singing
and music-making angels’’, a late 15th C panel painting attributed to Hans Memling and assistants:
Part I. non-invasive in situ investigations. J Anal At Spectrom 26:2216–2229
81. Ricci C, Miliani C, Brunetti BG, Sgamellotti A (2006) Non-invasive identification of surface
materials on marble artifacts with fiber optic mid-FTIR reflectance spectroscopy. Talanta
61:1221–1226
82. Gettens RJ, Mrose ME (1954) Calcium Sulphate Minerals in the Grounds of Italian Paintings. Stud
Conserv 1:174–189
83. Szmelter I, Cartechini L, Romani A, Pezzati L (2014) Multi-criterial studies of the masterpiece The
Last Judgement, attributed to H. Memling, at the National Museum of Gdansk. In: Sgamellotti A,
Brunetti BG, Miliani C (eds) Science and art. The painted surface. The Royal Society of Chemistry,
Cambridge
84. Hradil D, Grygar T, Hradilova J, Bezdicka P, Grunwaldova V, Fogas I, Miliani C (2007) Micro-
analytical identification of Pb-Sb-Sn yellow pigment in historical European paintings and its dif-
ferentiation from lead tin and Naples yellows. J Cult Herit 8:377–383
85. Rosi F, Manuali V, Miliani C, Brunetti BG, Sgamellotti A, Grygar T, Hradil D (2009) Raman
scattering features of lead pyroantimonate compounds. Part I: XRD and Raman characterization of
Pb2Sb2O7 doped with tin and zinc. J Raman Spectrosc 40:107–111
86. Rosi F, Manuali V, Grygar T, Bezdicka P, Brunetti BG, Sgamellotti A, Burgio L, Seccaroni C,
Miliani C (2011) Raman scattering features of lead pyroantimonate compounds: implication for the
non-invasive identification of yellow pigments on ancient ceramics. Part II. In situ characterisation
of Renaissance plates by portable micro-Raman and XRF studies. J Raman Spectrosc 42:407–414
87. Cartechini L, Rosi F, Miliani C, D’Acapito F, Brunetti BG, Sgamellotti A (2011) Modified Naples
yellow in Renaissance majolica: study of Pb–Sb–Zn and Pb–Sb–Fe ternary pyroantimonates by
X-ray absorption spectroscopy. J Anal At Spectrom 26:2500–2507
88. Fiedler I, Bayard MA (1986) Cadmium yellow orange and red. In: Feller RL (ed) Artist’s Pigments,
a handbook of their history and characteristics, vol 1. Cambridge University Press, Cambridge,
pp 65–108
89. Huckle WG, Swigert GF, Wiberley SE (1966) Cadmium Pigments. Structure and Composition. Ind
Eng Chem Prod Res Dev 5:362–366
90. Kirby J, Stonor K, Roy A, Burnstock A, Grout R, White R (2003) Seurat’s Painting Practice:
Theory, Development and Technology. Natl Gallery Tech Bull 24:4–37
91. Van der Snickt G, Janssens K, Schalm O, Aibeo C, Kloust H, Alfeld M (2010) James Ensor’s
pigment use: artistic and material evolution studied by means of portable X-ray fluorescence
spectrometry. X-Ray Spectrom 39:103–111
92. Hendriks E (2006) In: Hendriks E, Van Tilborgh L (eds) New Views on Van Gogh’s development
in Antwerp and Paris: an integrated art historical and technical study of his paintings in the Van
Gogh Museum. University of Amsterdam, Amsterdam, pp 149–150
93. Kuhn H, Curran M (1986) Chrome yellow and other chromate pigments. In: Feller RL (ed) Artists’
pigments: a handbook of their history and characteristics, vol 1. Cambridge University Press,
Cambridge, pp 187–200
94. Eastaugh N, Walsh V, Chaplin T, Siddall R (2004) The pigment compendium (CD-ROM). Elsevier,
Amsterdam
Top Curr Chem (Z) (2016) 374:10 Page 33 of 35 10
123
95. Monico L, Van der Snickt G, Janssens K, De Nolf W, Miliani C, Verbeeck J, Tian H, Tan H, Dik J,
Radepont M, Cotte M (2011) Degradation process of lead chromate in paintings by Vincent van
Gogh studied by means of synchrotron X-ray spectromicroscopy and related methods. 1. Artificially
aged model samples. Anal Chem 83:1214–1223 and references therein96. Monico L, Van der Snickt G, Janssens K, De Nolf W, Miliani C, Dik J, Radepont M, Hendriks E,
Geldof M, Cotte M (2011) Degradation process of lead chromate in paintings by Vincent van Gogh
studied by means of synchrotron X-ray spectromicroscopy and related methods. 2. Original paint
layer samples. Anal Chem 83:1224–1231 and references therein97. Monico L, Janssens K, Miliani C, Van der Snickt G, Brunetti BG, Cestelli Guidi M, Radepont M,
Cotte M (2013) Degradation Process of Lead Chromate in Paintings by Vincent van Gogh Studied
by Means of Spectromicroscopic Methods. 4. Artificial aging of model samples of co-precipitates of
lead chromate and lead sulfate. Anal Chem 85:860–867
98. Monico L, Janssens K, Vanmeert F, Cotte M, Brunetti BG, Van der Snickt G, Leeuwestein M,
Salvant Plisson J, Menu M, Miliani C (2014) Degradation process of lead chromate in paintings by
Vincent van Gogh studied by means of spectromicroscopic methods. Part 5. Effects of non-original
surface coatings into the nature and distribution of chromium and sulfur species in chrome yellow
paints. Anal Chem 86:10804–10811
99. Monico L, Janssens K, Cotte M, Romani A, Sorace L, Grazia C, Brunetti BG, Miliani C (2015)
Synchrotron-based X-ray spectromicroscopy and electron paramagnetic resonance spectroscopy to
investigate the redox properties of lead chromate pigments under the effect of the visible light.
J Anal At Spectrosc 30:2024
100. Herbst W, Hunger K (2004) Industrial organic pigments production, properties, applications. Wiley,
New York
101. Van Bommel MR, Vanden Berghe I, Wallert AM, Boitelle R, Wouters J (2007) High-performance
liquid chromatography and non-destructive three-dimensional fluorescence analysis of early syn-
thetic dyes. J Chromatogr A 1120:260–272
102. Doherty B, Vagnini M, Dufourmantelle K, Sgamellotti A, Brunetti BG, Miliani C (2014) A
vibrational spectroscopic and principal component analysis of triarylmethane dyes by comparative
laboratory and portable instrumentation. Spectrochim Acta A 12:292–305
103. Sherrer NC, Stephan Z, Francoise D, Annette F, Renate K (2009) Synthetic organic pigments of the
20th and 21st century relevant to artist’s paints: Raman spectra reference collection. Spectrochim
Acta A 73:505–524
104. Vandenabele P, Moens L, Edwards HGM, Dams R (2000) Raman spectroscopic database of azo
pigments and application to modern art studies. J Raman Spectrosc 31:509–517
105. Doherty B, Brunetti BG, Sgamellotti A, Miliani C (2011) A detachable SERS active cellulose film:
a minimally invasive approach to the study of painting lakes. J Raman Spectrosc 42:1932–1938
106. Doherty B, Presciutti F, Sgamellotti A, Brunetti BG, Miliani C (2014) Monitoring of optimized
SERS active gel substrates for painting and paper substrates by unilateral NMR profilometry.
J Raman Spectrosc 45:1153–1159
107. Learner TJ (2004) Analysis of modern paints. Research in conservation. Getty Conservation
Institute, Los Angeles
108. Cappitelli F, Learner T, Chiantore O (2002) An initial assessment of thermally assisted hydrolysis
and methylation—gas chromatography/mass spectrometry for the identification of oils from dried
paint films. J Anal Appl Pyrolysis 63:339–348
109. Silva MF, Domenech-Carbo MT, Fuster-Lopez L, Martın-Rey S, Mecklenburg MF (2009) Deter-
mination of the plasticizercontent in poly(vinyl acetate) paint medium by pyrolysis–silylation–gas
chromatography–mass spectrometry. J Anal Appl Pyrolysis 85:487–491
110. Peris-Vicente J, Baumer U, Stege H, Lutzenberger K, Gimeno Adelantado JV (2009) Characteri-
zation of commercial synthetic resins by Pyrolysis-Gas Chromatography/Mass Spectrometry:
Application to modern art and conservation. Anal Chem 81:3180–3187
111. Rosi F, Daveri A, Moretti P, Brunetti BG, Miliani C (2016) Interpretation of mid and near-infrared
reflection properties of synthetic polymer paints for the non-invasive assessment of binding media
in twentieth-century pictorial artworks. Microchem J 124:898–908
112. Ploeger R, Chiantore O, Scalarone D, Poli T (2011) Mid-infrared fiber-optic reflection spectroscopy
analysis of artists’ alkyd paints on different supports. Appl Spectrosc A 65:429–435
113. Barth A, Zscherp C (2002) What vibrations tell us about proteins. Q Rev Biophys 35:369–430
10 Page 34 of 35 Top Curr Chem (Z) (2016) 374:10
123
114. Alfeld M, Janssens K, Dik J, de Nolf W, van der Snickt G (2011) Optimization of mobile scanning
macro-XRF systems for the in situ investigation of historical paintings. J Anal At Spectrom
26:899–909
115. Alfeld M, Pedroso JV, Hommes MV, van der Snickt G, Tauber G, Blaas J, Haschke M, Erler K, Dik
J, Janssens K (2013) A mobile instrument for in situ scanning macro-XRF investigation of historical
paintings. J Anal At Spectrom 28:760–776
116. Janssens K, Dik J, Cotte M, Susini J (2010) Photon-Based Techniques for Nondestructive Sub-
surface Analysis of Painted Cultural Heritage Artifacts. Acc Chem Res 43:814–825
117. Legrand S, Vanmeert F, Van der Snickt G, Alfeld M, De Nolf W, Dik J, Janssens K (2014)
Examination of historical paintings by state-of-the-art hyperspectral imaging methods: from
scanning infra-red spectroscopy to computed X-ray laminography. Herit Sci 2:13 and referencestherein
118. Alfeld M, van der Snickt G, Vanmeert F, Janssens K, Dik J, Appel K, van der Loeff L, Chavannes
M, Meedendorp T, Hendriks E (2013) Scanning XRF investigation of a Flower Still Life and its
underlying composition from the collection of the Kroller-Muller Museum. Appl Phys A
111:165–175
119. Bull D, Krekeler A, Alfeld M, Dik J, Janssens K (2011) An intrusive portrait by Goya. Burlingt Mag
153:668–673
120. Alfeld M, De Nolf W, Cagno S, Appel K, Siddons DP, Kuczewski A, Janssens K, Dik J, Trentelman
K, Walton M, Sartorius A (2013) Revealing hidden paint layers in oil paintings by means of
scanning macro-XRF: a mock-up study based on Rembrandt’s ‘‘An old man in military costume’’.
J Anal At Spectrom 28:40–43
121. Trentelman K, Janssens K, van der Snickt G, Szafran Y, Woollett AT, Dik J (2015) Rembrandt’s
‘‘An old man in military costume’’ the underlying image re-examined. Appl Phys A. doi:10.1007/
s00339-015-9426-3
122. Delaney JK, Zeibel JG, Thoury M, Littleton R, Palmer M, Morales KM, de la Rie ER, Hoenigswald
A (2010) Visible and Infrared imaging spectroscopy of Picasso’s Harlequin musician: mapping and
identification of artist materials in situ. Appl Spectrosc 64:584–594
123. Thoury M, Delaney JK, de la Rie ER, Palmer M, Morales K, Krueger J (2011) Near-infrared
luminescence of cadmium pigments: in situ identification and mapping in paintings. Appl Spectrosc
65:939–951
124. Ricciardi P, Delaney JK, Facini M, Zeibel JG, Picollo M, Lomax S, Loew M (2012) Near infrared
reflectance imaging spectroscopy to map paint binders in situ on illuminated manuscripts. Angew
Chem Int Ed 51:5607–5610
125. Dooley KA, Lomax S, Zeibel JG, Miliani C, Ricciardi P, Hoenigswald A, Loew M, Delaney JK
(2013) Mapping of egg yolk and animal skin glue paint binders in Early Renaissance paintings
using near infrared reflectance imaging spectroscopy. Analyst 138:4838–4848
126. Muir K, Langley A, Bezur A, Casadio F, Delaney JK, Gautier G (2012) Scientifically investigating
Picasso’s suspected use of Ripolin house paints in still life, 1922, and the red armchair, 1931. J Am
Inst Conserv 52:156–172
127. Dooley KA, Conover DM, Deming Glinsman L, Delaney JK (2014) Complementary Standoff
Chemical Imaging to Map and Identify Artist Materials in an Early Italian Renaissance Panel
Painting. Angew Chem Int Ed 53:13775–13779
128. Sabbah S, Harig R, Rusch P, Eichmann J, Keens A, Gerhard J (2012) Remote sensing of gases by
hyperspectral imaging: system performance and measurements. Opt Eng 51:111717
129. Rosi F, Miliani C, Braun R, Harig R, Sali D, Brunetti BG, Sgamellotti A (2013) Noninvasive
analysis of paintings by mid-infrared hyperspectral imaging. Angew Chem Int Ed 52:5258–5261
130. Legrand S, Alfeld M, Vanmeert F, De Nolf W, Janssens K (2014) Macroscopic reflection Fourier
Transformed Mid-Infrared (MA-rFTIR) scanning, a new technique for in situ imaging of painted
cultural artefacts. Analyst 139:2489–2498
131. Doryhee F, Anne M, Bardies I, Hodeau JL, Martinetto P, Rondot S, Salomon J, Waughan GBM,
Walter Ph (2005) Non-destructive synchrotron X-ray diffraction mapping of a Roman painting.
Appl Phys A 81:663–667
132. De Nolf W, Dik J, Van der Snickt G, Wallert A, Janssens K (2011) High energy X-ray powder
diffraction for the imaging of (hidden) paintings. J Anal At Spectrom 26:910–916
Top Curr Chem (Z) (2016) 374:10 Page 35 of 35 10
123