Embed Size (px)
Citation preview

NON-INVASIVE ELECTROMAGNETIC WAVESENSOR FOR FLOW MEASUREMENT AND
BIPHASE APPLICATION
CHEEN SEAN OON
A thesis submitted in partial fulfillment of therequirements of Liverpool John Moores University for
the degree of Doctor of Philosophy
This research programme was carried out incollaboration with University of Malaya.
FEBRUARY 2017

ABSTRACT
Multiphase flow measurement is important in chemical processing, water treatment and
oil & gas industry. The multiphase flow sensor proposed in this research utilizes the res-
onant frequencies that occur inside a cavity and the differences in the permittivity of the
measures phases. By measuring this response over the range of discrete frequencies the
sample can be characterised. Polar material like water has relatively high permittivity
(εr = 81), while non-polar material such as oil and gas have low permittivity value (εr =
2.2-2.5) and (εr = 1) respectively. Hence, a small change in the water fraction may result
in a comparatively large frequency shift. In this research, the electromagnetic cylindrical
cavity sensor system successfully demonstrated its capability to analyze various fractions
of water-gas mixture. The results were consistent in the case of both the static and dy-
namic flow. The statistical analysis of the captured data showed a linear relationship of
the amplitude data with the change in the water fractions. It was also found that the tech-
nique was independent of the temperature change. The system was able to successfully
detect the stratified, wavy, elongated bubbles and homogeneous flow regimes. The elec-
tromagnetic rectangular cavity sensor system is introduced to pick up the tiny shifts in
the permittivity when the low permittivity material is used or temperature changes. The
microwave sensor system is able to detect water-air fraction, water-oil fraction, oil-air
fraction and water temperature. The novel solution of the combination of both cylindri-
cal and rectangular sensor system demonstrates the ability to detect both high and low
permittivity changes. These dual-cavity sensor cavity systems have been able to detect
water level, flow regime and temperature in the pipe. It also demonstrates that microwave
sensors based on the principle of changing permittivity can replace conventional mea-
surement techniques.
ii

ACKNOWLEDGEMENTS
Here I express my sincere gratitude to my supervisors, Professor Ahmed Al-Shamma’a,
Associate Professor Kazi Md Salim Newaz, Professor Andrew Shaw, Dr Ahmad Badarudin
and Dr Stephen Wylie for their visionary guidance, insightful advices and genuine sup-
ports during my Dual-PhD study, without which this thesis would not have been accom-
plished to its least content.
I would like to acknowledge the contribution of University of Malaya and Liverpool
John Moores University in successfully jointly offered Dual-PhD program.
Thanks to Institute of Graduate Studies, University of Malaya who provide manage-
rial support and aid during my PhD study. The Faculty of Engineering, University of
Malaya play an important role in providing laboratory facilities and work space for my
research.
The help and support provided by the staff and management team from the Depart-
ment of the Built Environment is highly appreciated, especially the Radio Frequency &
Microwave (RFM) group at Liverpool John Moores University in providing the laboratory
facilities and conducting this research.
iii

TABLE OF CONTENTS
ABSTRACT ii
ACKNOWLEDGEMENTS iii
TABLE OF CONTENTS iv
LIST OF FIGURES vi
LIST OF TABLES ix
LIST OF ABBREVIATION x
LIST OF APPENDICES xi
CHAPTER 1: INTRODUCTION 11.1 Background of research 11.2 Problem statement 61.3 Significance of Research 121.4 Project aims and objectives 151.5 Scope and limitation of the study 161.6 Organization of thesis 17
CHAPTER 2: LITERATURE REVIEW 182.1 Introduction 182.2 Multiphase flow detection 182.3 Multiphase flow calculation 252.4 Electromagnetic waves propagation 272.5 Electromagnetic wave resonance cavity 292.6 Boundary conditions in waveguides 332.7 Microwaves sensor basic 352.8 Microwave Waveguides 382.9 Microwave sensors application/potential 422.10 Current available electromagnetic wave sensor 47
2.10.1 Attenuation sensor 472.10.2 Phase shift sensor 482.10.3 Transmission sensor 492.10.4 Reflection sensor 50
2.11 Summary 51
CHAPTER 3: METHODOLOGY 523.1 Introduction 523.2 Experimental setup 53
3.2.1 Microwave cavity 543.2.2 Static experiment and real time measurement 55
iv

3.3 Labview software application 563.4 Samples tested and measurements procedure 573.5 Temperature effect study 603.6 Comsol simulation 61
3.6.1 Simulation using different level of water 613.7 Two phase flow experimental and real time measurement 643.8 Rectangular sensor cavity system 673.9 Summary 70
CHAPTER 4: RESULTS AND DISCUSSION 714.1 Introduction 714.2 Microwave spectrum analysis of the results 714.3 Statistical analysis of repeatability and amplitude change 774.4 Static Experiment 794.5 Temperature effect study 814.6 Two Phase flow Experiment 834.7 Wavy and elongated bubbles flow measurement and detection 874.8 Homogeneous flow measurement and detection 904.9 Dual Cavity sensor system 924.10 Summary 97
CHAPTER 5: CONCLUSION AND FUTURE WORK 985.1 Conclusion 98
5.1.1 Objective achieved 1005.2 Recommendation 1015.3 Future work 102
REFERENCES 103
LIST OF PUBLICATIONS AND PAPER PRESENTED 112
APPENDIX 117
v

LIST OF FIGURES
Figure 1.1 Microchannel heat sink 3Figure 1.2 Various morphologies under slug flow conditions 4Figure 1.3 A generic model of multiphase flow diagram for horizontal pipe 5Figure 1.4 Multiphase flow meters application in multiple wells 8Figure 1.5 Conventional multiphase flow measurement utilizing phase seperators 9Figure 1.6 Online multiphase flow measurement 9Figure 1.7 Flow regimes effect on real measurement (true concentration = 25%) 11
Figure 2.1 Electromagnetic waves propagation in free space. The wavepropagates in the x direction. and E and H are transverse. 27
Figure 2.2 Rectangular waveguide (a) and Cylindrical waveguide (b). 28Figure 2.3 E field boundary condition. It meets boundary conditions. 33Figure 2.4 E field boundary condition. It does not meet boundary conditions. 34Figure 2.5 H field meets the boundary conditions. 34Figure 2.6 Rectangular waveguide with internal dimension a and b. 39Figure 2.7 Cylindrical waveguide with inner radius, r. 39Figure 2.8 (T E10) mode field configurations in rectangular waveguide. 40Figure 2.9 Dominate mode (T E11) field configuration in circular waveguide. 40Figure 2.10 The basic geometrical configuration of a transmission sensor. 49
Figure 3.1 Electromagnetic wave cavity sensor development flow chat 52Figure 3.2 Schematic diagram of the resonant cavity with pipeline 53Figure 3.3 Cylindrical microwave cavity resonator with embedded antennas 54Figure 3.4 Experimental setup of the measurement system showing the cavity,
VNA, cables and connectors 55Figure 3.5 Offline front panel display 56Figure 3.6 The working principle of the electromagnetic microwave sensor
flow chat 59Figure 3.7 Partially filled horizontal cylinder 61Figure 3.8 Schematic diagram of 60% of water in the pipe (front view). 62Figure 3.9 Schematic diagram of 60% of water in the pipe (3D view). 63Figure 3.10 Two phase flow experimental setup 64Figure 3.11 Two phase flow experiment setup (Full View) 64Figure 3.12 Schematic diagram of the two-phase flow experiment setup. 65Figure 3.13 Rectangular sensor cavity design. 67
Figure 4.1 S21 (dB) measurements of the frequency response of water-airfractions using microwaves at 5-5.7 GHz 72
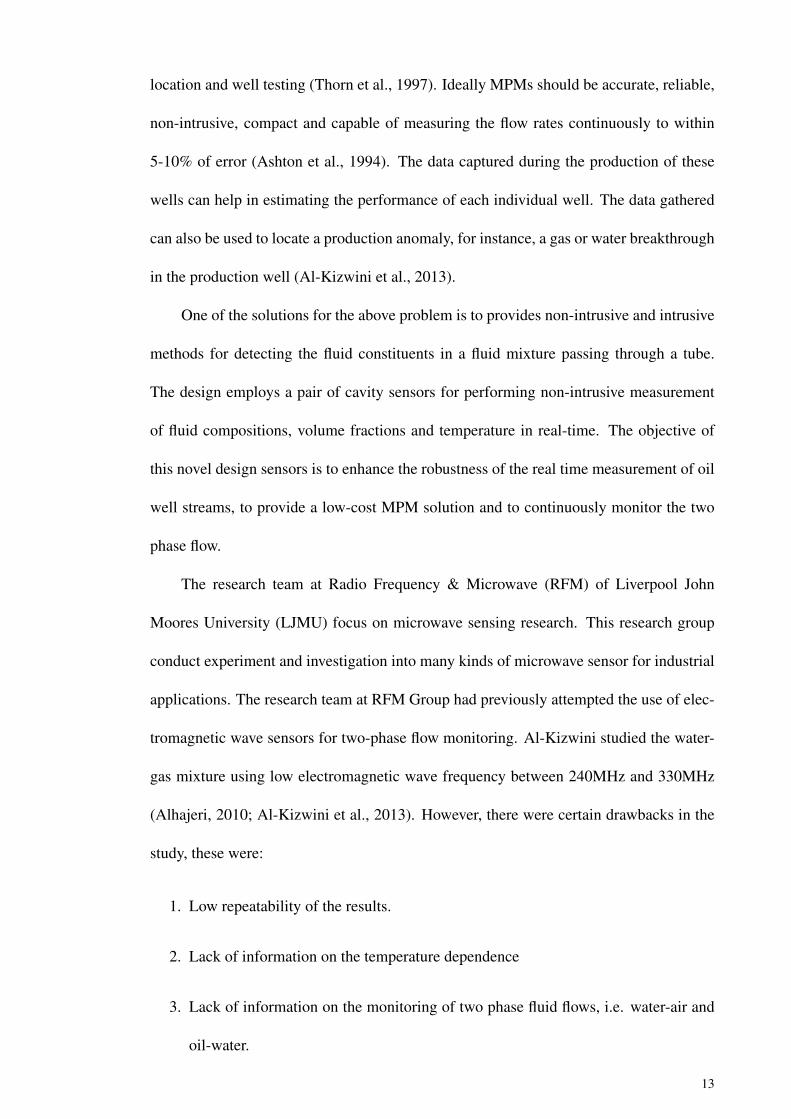
Figure 4.2 S21 (dB) measurements of the frequency response of water-oilfractions using microwaves at 5-5.7 GHz 73
Figure 4.3 Graph of the frequency shift for each of the water-air and water-oilvolume fractions change 74
Figure 4.4 Electrical field intensity inside the cylindrical cavity. 75
vi

Figure 4.5 Comparison of resonant frequency between experimental andsimulation results 76
Figure 4.6 Average amplitude for each percentage of water with standarddeviation error bars. 77
Figure 4.7 Relationship between the change in the volume fraction of waterand amplitude in two phase systems 78
Figure 4.8 Graph of S21 (dB) versus frequency for different percentage of water. 79Figure 4.9 Graph of Percentage of water versus S21 (dB) 80Figure 4.10 Online front panel reading for different percentage of water. 80Figure 4.11 Graph of S21 (dB) versus the frequency at different temperatures
for 100% water. 82Figure 4.12 Experimental of 20% of water flowing in the pipe. 83Figure 4.13 Experimental of 80% of water flowing in the pipe. 84Figure 4.14 Graph of S21 (dB) versus frequency for different percentage of
flowing water. 85Figure 4.15 Graph of Percentage of water versus power (dB). 86Figure 4.16 Snapshot of the wavy flow. 87Figure 4.17 Graph of the percentage of water versus time for the wavy flow. 87Figure 4.18 Snapshot of the elongated bubbles flow. 88Figure 4.19 Graph of the percentage of water versus time for the elongated
bubbles flow. 88Figure 4.20 Combination of stratified, wavy and elongated flow result. 89Figure 4.21 Snapshot of the Homogeneous flow produced with different air input. 91Figure 4.22 Graph of determination of the homogeneous flow type with
varying air input using microwave response parameter S21. 91Figure 4.23 Graph of S21 versus frequency for different percentage of oil. 93Figure 4.24 Graph of frequency shift versus oil fraction increment. 94Figure 4.25 Graph of S21 versus frequency for different temperature. 94Figure 4.26 Graph of frequency shift versus temperature change. 95
Figure 5.1 Dual microwave sensor cavity system. 99
Figure 1 Multiphase flow metering system measurement for the relativevolumetric proportions and temperature 149
Figure 2 Apparatus utilized for relative volumetric proportions andtemperature detection 150
Figure 3 Flowchart of the relative volumetric proportion measurement 151Figure 4 Comparison of water-air fractions in the fluid mixture 152Figure 5 Comparison of resonant frequency between experimental and
simulation results 153Figure 6 Graph of S21 versus frequency at different temperature for 100% water 154Figure 7 Graph of frequency shift versus oil fraction increment 155Figure 8 Graph of frequency shift versus temperature change 156
Figure 9 Cylindrical cavity 3D view 157
vii

Figure 10 Cylindrical cavity front view 158Figure 11 Cylindrical cavity top view 159Figure 12 Cylindrical cavity side view 160Figure 13 Rectangular cavity 3D view 161Figure 14 Rectangular cavity front view 162Figure 15 Rectangular cavity top view 163Figure 16 Rectangular cavity side view 164Figure 17 Antenna 3D view 165Figure 18 Antenna front view 166Figure 19 Antenna side view 167Figure 20 Dual microwave cavity sensor 3D view 168Figure 21 Dual microwave cavity sensor front view 169Figure 22 Dual microwave cavity sensor back view 170Figure 23 Dual microwave cavity sensor side view 171
Figure 24 Labview data record front panel 172Figure 25 Data record block diagram (first half) 173Figure 26 Data record block diagram (second half) 174Figure 27 Labview data record and control front panel 175Figure 28 Data record and control block diagram (first half) 176Figure 29 Data record and control block diagram (second half) 177
viii

LIST OF TABLES
Table 3.1 List of two phase system of water-air and water-oil tested for themonitoring and analysis of the volume fractions 57
Table 3.2 Analysis of the water sample to monitor the change in temperatureand its impact on the microwave response frequency/amplitude 60
Table 3.3 Height of water in different percentage of water. 62Table 3.4 List of two phase system of oil-air tested for the monitoring and
analysis of the volume fractions 68Table 3.5 List of temperature of fully filled pipe for the temperature detection 69
Table 4.1 Analysis of the water sample to monitor the change in temperatureand its impact on the microwave response frequency/amplitude 81
Table 4.2 List of two phase system of oil-air tested for the monitoring andanalysis of the volume fractions 92
Table 4.3 Average frequency and standard deviation for each temperature 95
ix

LIST OF ABBREVIATION
ANN Artificial Neural Network.LJMU Liverpool John Moores University.MPM Multiphase Flow Meter.NMR Nuclear Magnetic Resonance.RFM Radio Frequency & Microwave.TE Transverse Electric.TM Transverse Magnetic.VNA Vector Network Analyzer.WLR Water-in-liquid Ratio.
x

LIST OF APPENDICES
APPENDIX A Award 118
APPENDIX B Patent 119
APPENDIX C Dual Microwave Cavity Drawing 157
APPENDIX D Labview 172
xi

CHAPTER 1: INTRODUCTION
1.1 Background of research
Multiphase flow is a real world phenomenon exists in many engineering industries
like petroleum, chemical processing, petroleum and even in nature, like living organ-
ism. The interaction between different phases and their highly complicated and random
movement, hence, the flow distribution and multiphase flow mixture is widely studied for
engineering application. The pattern of the flow is defined as the major feature of the mul-
tiphase flow and the flow distribution. When both liquid and gas mixture is flowing inside
a pipe, many flow patterns can be identified depending on the velocity of each flowing
liquid, a typical flowing regime can include stratified, homogeneous, slug, elongated bub-
bles and annular flow. The energy and mass transport mechanism varies for different kind
of flow regimes. It is vital to recognise the flow pattern in order to understand the physi-
cal phenomena and the mechanism of multiphase flow. Flow regimes are one of the most
important aspects affecting accuracy of the multiphase flow measurement especially for
the phase fraction and flow rate. Consequently, it is of great scientific and technological
importance to research and develop methods of sensing multiphase flow regime.
Numerous flow patterns of gas-liquid stratified and gas-liquid slug flow occurs in
the chemical, civil, oil and gas, nuclear and water treatment industries. The flows can
be characterized by observing sequence of elongated bubbles surrounded by liquid flows
that may contain tiny bubbles inside the fluid. This phenomenon can be separated into
two groups, terrain and hydrodynamic slugging. The terrain slugging is the result of
changing of flow line topography which contributes to a local rise and fall in the flow.
The hydrodynamic slugging is the normal slugging pattern often happening in straight
fluid flow. Due to its transient and intermittent behaviour, it is very hard to accurately
predict the flow characteristics. Hence, reliable sensor is crucial for the safety, operations
1

and cost efficient design of industrial facilities.
Slug flow occupies the biggest share of all the in flow-pattern maps particularly the
upward inclination pipe. Over the past few dacades, huge attention has been focusing on
slug flow characteristics study inside flowing pipelines. Researchers were highly inter-
ested in hydrodynamic characteristics such as slug liquid hold-up, slug length distribu-
tions, slug frequency and translational velocity (the study of interface velocity between
liquid slug and bubble). Other slug or chunk flow related studies were focused on higher
liquid viscosities (Gokcal et al., 2009). The period flow of the liquid slugs and the al-
terations in the flow velocities of different phases of fluid makes the research of slug or
chunk flow interesting and challenging.
For horizontal and slight incline or decline pipeline systems, slug flow and elongated
bubbled flow are among the frequently reported flow-pattern in industrial application as
well as academia. The turbulence level in the flowing liquid slug is the major different
between these two flow regimes. For the slug flow pattern, particularly for low viscos-
ity fluidic system, the liquid slug-body turbulence level is relatively high which means
it creates a recirculation zone at the front of the slug. The recirculation zone forces the
gas entrainment into the liquid slug-body. In contrast, for the case of elongated bub-
ble flow-pattern, the low turbulence level in the liquid slug-body zone result in no gas
entrainment. As far as constant superficial liquid velocity, geometric and fluid properties
are concerned, slug flow happens at comparatively high superficial gas velocity compared
to the elongated bubbles flow pattern (Kesana et al., 2017).
Multiphase flow is also important in heat transfer. Heat transfer inside microchan-
nels under the conditions of phase change received increasing attention due to the ongoing
trend of miniaturization of various engineering and industrial applications, for instance
fuel cells, heat transfer electronics, green energy technologies and many other applica-
tions. Figure 1.1 shows the heat sink using microchannel technology.
2

Figure 1.1. Microchannel heat sink
The permittivity of a nominally homogeneous mixture depends upon the volumetric
ratio of the constituent materials and upon the permittivity of the individual components.
Microwave instruments exploit this fact to analyze the properties of substances or the
composition of mixtures by measuring and analyzing various attributes of a microwave
signal or set of signals that depend directly upon the permittivity of the substance or
mixture. For example, instruments in a variety of configurations are available which
measure the attenuation or phase shift of signals that are transmitted through an unknown
mixture.
Two-phase stratified flows are vital in many industrial applications, for example hor-
izontal heat exchanger, industrial pipelines and fluid storage tanks. Flow characteristics
such as the measurement flow regimes, pressure drops and flow rates have been the sub-
ject of interest of engineering as well as researches around the world. (Taitel & Dukler,
1976) introduce flow maps which forecast the transitions between different flow regimes
3

inside horizontal pipes. Special attention is given to the study of wavy flow, elongated
bubble flow, slug flow and smooth stratified flow regimes. Figure 1.2 shows the many
morphologies under slug flow conditions (Höhne & Mehlhoop, 2014).
Figure 1.2. Various morphologies under slug flow conditions
Characteristically, free surfaces manifest such as two phase stratified flow, wavy
flow, slug flow in horizontally flow domain where liquid and gas are divided by the force
of gravity. The numerical simulation of slug flow regime is a very sensitive case study
for the modelling setup due to interfacial friction quality of the model with respect to
the momentum transfer. Many geometrical and multidimensional numerical models were
developed to simulate stratified flows inside a horizontal pipe. All these methods, in prin-
ciple are able to capture accurately most of the physics in the stratified flow condition. On
the other hand, they were unable to capture all the morphological formation for instance
droplets and small bubbles due to the grid size are not sufficiently small in the modelling.
It is observed that various flow regimes are formed as a result of the physical distri-
bution of the fluid phases in a pipeline section (Amdal et al., 1995). The flow regimes are
formed due to the magnitude of the force acting on the fluid. The flow regimes could be
significantly influenced by the varying degrees of forces such as surface tension, oil, gas
and water flow rates and properties, the pipe diameter and pipe inclination can also sig-
nificantly influence. In horizontal and near horizontal pipe geometry configuration of the
general flow regime of streams can be classified as: stratified, elongated bubbles, bubbles,
wavy, slug, mist and annular flow. Figure 1.3 depicts these flow regimes for horizontal
pipeline geometry as a function of superficial liquid (oil and or water) and gas velocities.
The main mechanisms of formation these flow regimes are classified into three effects:
4
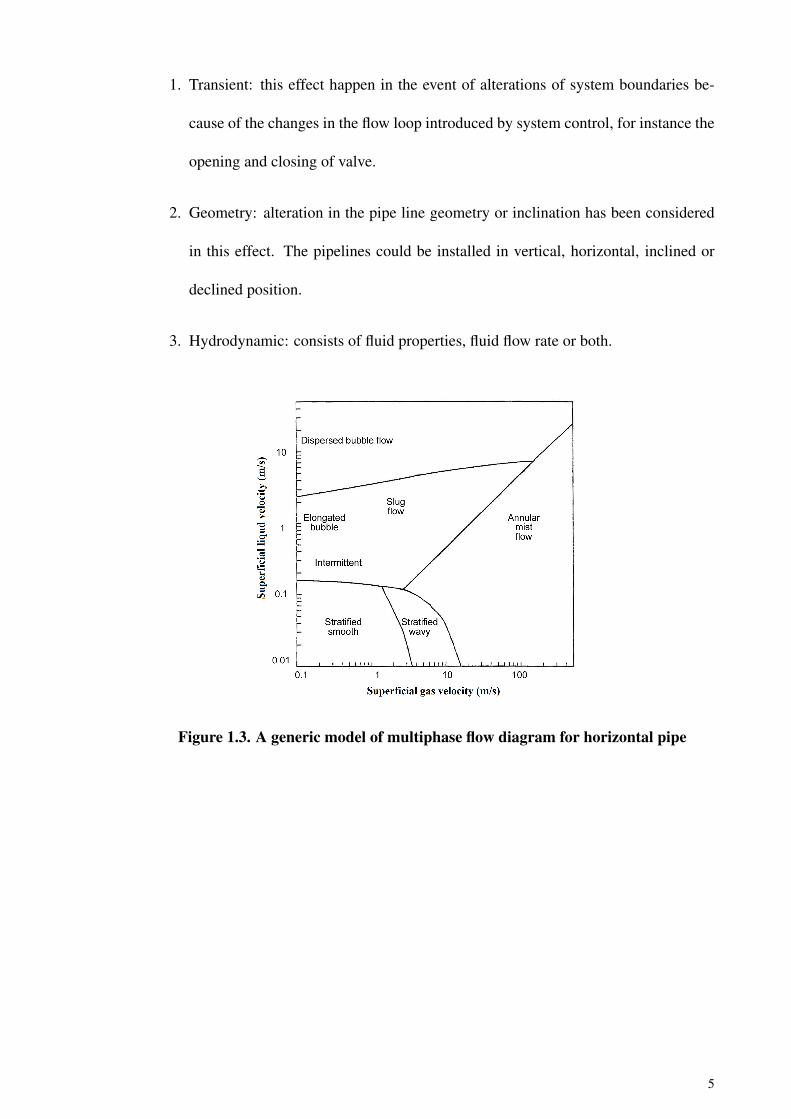
1. Transient: this effect happen in the event of alterations of system boundaries be-
cause of the changes in the flow loop introduced by system control, for instance the
opening and closing of valve.
2. Geometry: alteration in the pipe line geometry or inclination has been considered
in this effect. The pipelines could be installed in vertical, horizontal, inclined or
declined position.
3. Hydrodynamic: consists of fluid properties, fluid flow rate or both.
Figure 1.3. A generic model of multiphase flow diagram for horizontal pipe
5

1.2 Problem statement
Various Multiphase Flow Meter (MPM)s for measuring the mixture of different flu-
ids, for instance, water-oil mixture are currently available on the market today. Many
of the MPMs are based on radioactive radiation technology, others are capacitance and
electromagnetic wave based sensors. Generally, radioactive sensors are not very suit-
able owing to environmentals and safety issues posed by the radiation and also security
concerns. The capacitive based sensor detects the permittivity two phase flow at low fre-
quency compared to the microwave sensor. Owing to their complex array construction,
capacitive sensors can be very slow to measure the fluid fraction compared to other com-
peting technologies. Moreover, it is sensitive to the fluid temperature change. The capac-
itive sensor likewise needs a complex design utilizing a dielectric material as a protection
to avoid direct contact between flow fluid and the electrodes. Ultrasonic sensor is a rela-
tively new technology in multiphase flow measurement, however, resolution, repeatability
and sensitive temperature changes make it not so popular in industrial applications. On
the other hand, the above identified problems were not synonymous with the microwave
sensors.
It is crucial to measure gas or liquid fraction, phase velocities and the Water-in-liquid
Ratio (WLR), in order to acquire the production flow rates of oil and water. Several MPMs
have been designed and developed by companies and research organizations, utilizing
various measurement technologies. Although those MPMs are commercially available,
there are number of challenging problems yet to be solved, for instance, different flow
regimes, changes in the fluid properties and sensitivity of the measurement of phase-
fraction.
The product of an oil and gas reservoir consists of a mixture of oil, gas, and water.
During the oil extraction, gas and water are produced as by-products as a natural phe-
6

nomenon, which occurs in the petroleum field. In order to maximize the amount of oil
that can be retrieved, water and gas are often injected at various locations into the well.
Thus, monitoring and measuring the output of oil, gas and water mixture are crucial re-
quirements. The information not only can be used to optimize both the operation and
transportation management but to enhance the quality of production as well (Al-Hajeri et
al., 2009).
Increased offshore exploration and production of the oil and gas industry lead to the
transportation of fluids over relatively long distances. Usually, the fluid consists of water
which already existed in the stratum. The percentage of water often increases during
the production life of a well (X.-X. Xu, 2007). Many wells are still considered to have
economic production even if the percentage of water in liquid phase exceeds 90% (Hewitt,
1997b). The presence of water must be taken into consideration when designing and
predicting the flow behaviour in both wells and pipelines.
Conventionally, the flow rates of well production were measured by first separating
the phases and measuring the output of each separated fluid by conventional single phase
MPM. The drawback of this conventional technique is it takes several hours to determine
the flow rates for every single well and for well production control, while there might
be ten or more wells to be monitored in the oil fields. Furthermore, the water-oil-gas
separators are maintenance intensive and expensive (Wang et al., 1998).
MPM offers one of the alternatives to replace the utilization of conventional sepa-
rators. In the oil and gas industry, generally, it is recognized that MPMs could greatly
benefit the production allocation, monitoring, reservoir management, well testing and
layout of production facilities (Thorn et al., 1997). Figure 1.4 shows the offshore oil and
gas production that involve several adjacent wells (Al-Kizwini et al., 2013). The data
captured during the production of these wells can help in estimating the performance of
each individual well. The data gathered can be used as a reference to locate anomalies
7

during production, for example water or gas breakthrough in a production well.
Figure 1.4. Multiphase flow meters application in multiple wells
Another drawback of conventional multiphase flow measurement is the utilization
of phase separators in a complicated network of pipelines which also occupy valuable
spaces. Figures 1.5 and 1.6 show the Conventional Multiphase flow measurement utiliz-
ing phase separators and Online Multiphase flow measurement respectively (Amdal et al.,
n.d.). The MPM can be installed and used in the same way as the test separator. It will cut
down on the number of unnecessary pipeline and simplify the piping network. Moreover,
MPM responds more quickly to the change in the well fluids which also needs less time
to stabilize.
Petroleum resources are finite and becoming ever more elusive. As oil reserves are
depleted over time, efficient management of existing reservoirs is becoming even more
important. For the purposes of reservoir management, the oil and gas industry needs a
multiphase flow meter which is compact and capable of measuring the flow rates con-
8
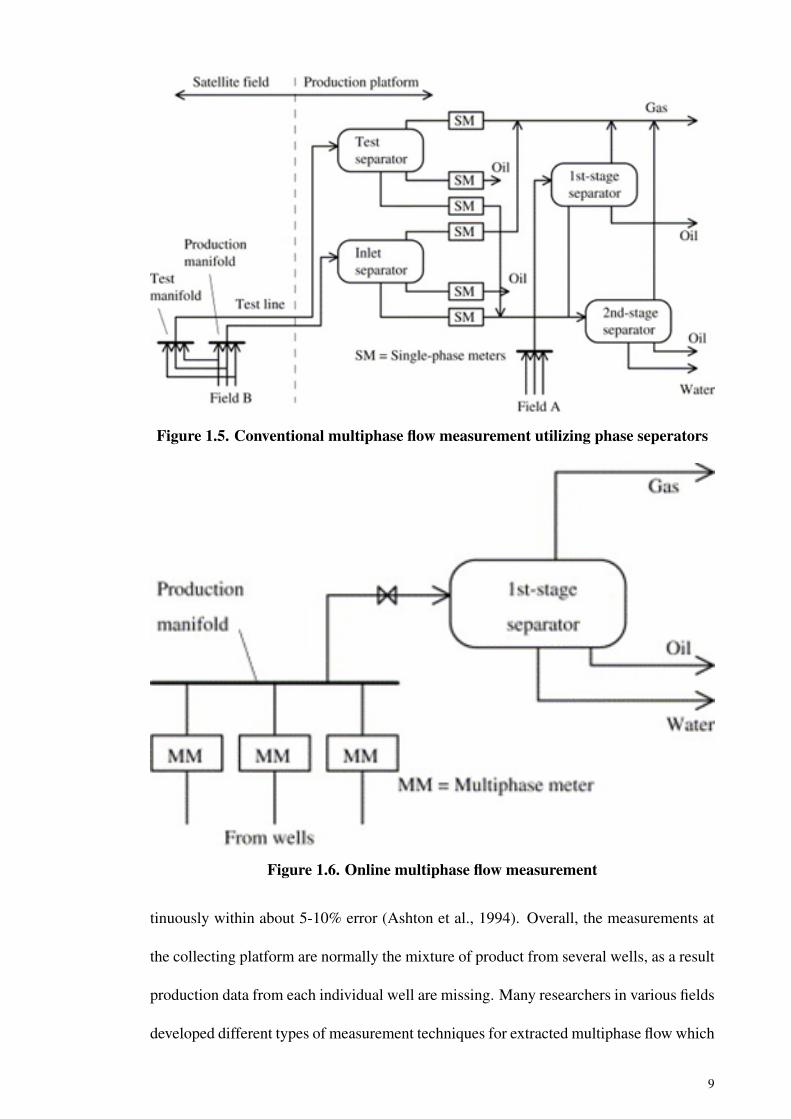
Figure 1.5. Conventional multiphase flow measurement utilizing phase seperators
Figure 1.6. Online multiphase flow measurement
tinuously within about 5-10% error (Ashton et al., 1994). Overall, the measurements at
the collecting platform are normally the mixture of product from several wells, as a result
production data from each individual well are missing. Many researchers in various fields
developed different types of measurement techniques for extracted multiphase flow which
9

involve the γ-ray radiation (Roach & Watt, 1996), process tomography and impedance
techniques (Dykesteen et al., 1985), which are expensive, inaccurate and hazardous to
health.
Another major problem faced by current available MPMs is flow regime dependent.
Figure 1.7 shows three cases of oil-gas flow regimes with the oil volume fraction of 25%.
However, the readings obtained with three different flow regimes, which were annular,
homogeneous and stratified flow regimes, by using a conventional calibrated MPM for
homogeneous flow volume fraction were inaccurate (Ismail et al., 2005). Therefore,
flow regimes will add to considerable errors due to the localised sensing path. Thus,
the conventional MPM is only limited to a range of flow regimes (quasi-homogeneous
or homogeneous flow). Flow regime independent measurements are considered vital for
down hole flow measurement for multilateral wells, inclined or horizontal due to the flow
regimes tending to stratify or becoming other types of flow regimes that are difficult to
measure with the currently available MPMs (Hammer & Johansen, 1997).
10

Figure 1.7. Flow regimes effect on real measurement (true concentration = 25%)
11

1.3 Significance of Research
During the oil extraction, water and gas are produced as by-products. To maximise
the production of oil from a reservoir, water and gas are often injected into the well. Water
is used to maintain the pressure whereas the gas is used to reduce the viscosity of the oil.
To enhance the production and optimise the process it is crucial to monitor the output of
the mixture of water, oil and gas. The monitoring also helps to improve the operational
and transportation management (Al-Hajeri et al., 2009; Alhajeri, 2010). Water naturally
occurs in the stratum and the percentage of water often increases with the production life
of a well (X.-X. Xu, 2007). The water fraction also increases as the well is flooded with
water. Many wells are still considered to be economic if the percentage of water in the
liquid phase is more than 90% (Hewitt, 1997a). It is, therefore, important to consider the
presence of water when predicting and designing a method to monitor flow behaviour in
both pipelines and wells. In recent years, a numbers of studies have been published on
water, oil and gas flow in pipes (De Castro et al., 2012; J.-y. Xu et al., 2008; Rodriguez &
Oliemans, 2006; Hapanowicz, 2008).
Conventionally, single phase monitoring techniques are utilised to measure the flow
rates of well fluids by separating the mixture. The drawback is the time needed, which can
take up to several hours, to obtain the flow rate of each well because each phase has to be
separated before measuring it. The complexity of this technique increases when it comes
down to monitoring up to 10 or more wells in the oil field which could be substantially
time consuming and inconvenient. In addition, the oil-water-gas separators are expensive
and maintenance-intensive (Wang et al., 1998).
One alternative to replace the water-oil-gas separators is the utilization of MPMs. It
is acknowledged that MPMs could bring benefits to the oil and gas industry in terms of
layout of production facilities, reservoir management, regular monitoring, production al-
12
location and well testing (Thorn et al., 1997). Ideally MPMs should be accurate, reliable,
non-intrusive, compact and capable of measuring the flow rates continuously to within
5-10% of error (Ashton et al., 1994). The data captured during the production of these
wells can help in estimating the performance of each individual well. The data gathered
can also be used to locate a production anomaly, for instance, a gas or water breakthrough
in the production well (Al-Kizwini et al., 2013).
One of the solutions for the above problem is to provides non-intrusive and intrusive
methods for detecting the fluid constituents in a fluid mixture passing through a tube.
The design employs a pair of cavity sensors for performing non-intrusive measurement
of fluid compositions, volume fractions and temperature in real-time. The objective of
this novel design sensors is to enhance the robustness of the real time measurement of oil
well streams, to provide a low-cost MPM solution and to continuously monitor the two
phase flow.
The research team at Radio Frequency & Microwave (RFM) of Liverpool John
Moores University (LJMU) focus on microwave sensing research. This research group
conduct experiment and investigation into many kinds of microwave sensor for industrial
applications. The research team at RFM Group had previously attempted the use of elec-
tromagnetic wave sensors for two-phase flow monitoring. Al-Kizwini studied the water-
gas mixture using low electromagnetic wave frequency between 240MHz and 330MHz
(Alhajeri, 2010; Al-Kizwini et al., 2013). However, there were certain drawbacks in the
study, these were:
1. Low repeatability of the results.
2. Lack of information on the temperature dependence
3. Lack of information on the monitoring of two phase fluid flows, i.e. water-air and
oil-water.
13

4. The antennas were in contact with water that may cause rust and error in measure-
ments.
This experimental study extended the work carried out by Al-Kizwini to address
the above aspects as well as to make the measurements more reliable, accurate and re-
peatable. An electromagnetic wave cavity sensor was designed and used to measure the
fractions of two phase water-air and oil-water stratified flows in the pipe. The outer cavity
was left empty whereas the pipe inside was filled with the two phase fluids. To measure
the former, i.e. water-air mixture, water was added in the pipe in various percentages to
air. In the latter case, water in various percentages to oil was added in the pipe. Any sci-
entific measurements and monitoring system needs to be reliable and repeatable. Hence,
measurements were carried out at higher frequencies, more specifically in the microwave
region, in contrast to previous research to address the repeat-ability. The measurements
were also carried out at a range of temperatures in the case of the water-air phase system to
study the impact of temperature change on the microwave measurements. It is important
to mention that this study only focused on one type of flow, i.e. stratified. Further research
work is needed to measure other flow types using this technique. The new knowledge will
contribute to the team and microwave sensor community the understanding of multiphase
flow detection and temperature effect under different kinds of flow regimes.
14

1.4 Project aims and objectives
This research was set up to develop a novel non-intrusive sensor that can detect
in real time the two phase flow regimes under continuous flow condition. The main
feature of this sensor is to have the capability to monitor the flow regimes continuously
without touching the flowing fluid inside the pipe so it gives live data of what is the
fraction of different fluids for chemical and oil and gas industry for production monitoring
proposes. Other features of the developed sensor are that it should be simple, require
little maintenance and robust that would minimize the running cost. This aim was met by
applying the following objectives:
1. Test an experimental sensor under static and stratified condition (water-air and
water-oil).
2. Determine the effect of temperature on the above measurements and devise a method
to negate the temperature effect.
3. Design an experimental rig for testing the sensor under continuous flow conditions
with different flow regimes.
4. Run Comsol simulations to compare the experimental results and determine the
validity of the experiment.
5. Design an experimental sensor for low permitivity fluid under stratified condition
(oil-air).
15

1.5 Scope and limitation of the study
The scope of study in this report will include, but not be limited to fundamental
studies with substantial analysis on the non-invasive multiphase flow detection in the
chemical, water treatment and oil and gas industries. These include studies on the mi-
crowave cavity sensor to detect static conditions with two stratified phases (water-air and
water-oil), the effect of temperature of the fluids, different flow regimes detection and
run simulation to verify the results. These are the crucial information for the multiphase
flow measurement in industry applications. As mentioned, variable parameters used are
the frequency of the microwave generated, size and type of the resonant cavity and flow
condition that the laboratory facilities can generate. The approach for this research will
be devised based on publications from the past researches. Results obtained in the ex-
periment will be verified using the simulation results obtained from Comsol simulation
package. To solve the problem during the investigation, new ideas and designs will be
introduced. The scope will not involve oil and gas standard parameters due to safety and
cost involved and only focus on laboratory scale of experiment. The temperature involved
in the study will be limited to less than the boiling point of water. It is hope that the results
and knowledge from this research will provide better understanding and contribute to the
development of multiphase flow sensor and related areas.
16

1.6 Organization of thesis
Chapter 1 explains about research background, problem statement, project descrip-
tion, research objectives and scope. This will provide a general overview for the research
project. Moreover, it will also explain how relevant and significant the research is in the
current industry.
Chapter 2 contains a literature review made from various journals, publications, con-
ference papers and articles on the field area. Emphasis is on, but not limited to the ap-
plication of non-invasive multiphase flow detection in the chemical, water treatment and
oil and gas industries. Basic principles of microwave, advantages and disadvantages of
microwave cavity sensor are among the fundamental issues discussed.
Chapter 3 is dedicated to the methodology used for this research. The parameters
and design experiment are discussed in detail in this section. This chapter will discuss
the methodology on how to use this technology for the non-invasive sensing of two phase
flow. A series of experiments is planned and conducted to validate the usability of the
design.
Chapter 4 details results and discussion obtained from experiments and simulations.
The response of the frequency to the changes of fluid fraction is identified and shown in
this section. Comsol simulation is carried out to verify the results. A novel solution of
incorporating a rectangular cavity to the system to pick up the tiny shift of the frequency
will be implemented. Selected cases will be chosen for comparison between static and
stratified flow for validation purpose.
Chapter 5 concludes overall findings for the project and significance of the results.
This chapter will also explain whether or not all research objectives drawn in Chapter 1
have been achieved, there are three sections in this chapter, conclusion, recommendations
and future works.
17

CHAPTER 2: LITERATURE REVIEW
2.1 Introduction
This chapter contains a literature review made from various journal, publications,
conference papers and articles on the field area. Emphasis is on, but not limited to, the
application of non-invasive multiphase flow detection in the chemical, water treatment
and oil and gas industries. Basic principles of microwave, and advantages and disadvan-
tages of microwave cavity sensors are among the fundamental issues discussed.
2.2 Multiphase flow detection
Two-phase flows are commonly encountered in various engineering applications
such as chemical industry, heat exchangers, oil and gas industry, rocketry, nuclear en-
gineering and food production (Thorn et al., 2012; Huh et al., 2009). Out of these, the
liquid-gas flow is one of the most common types of flow. As the interaction takes place
between the gas and the liquid during the flow process, the distribution and the shape
of the interface of two-phase flow changes (Rao et al., 2011) The characterization of the
behaviour of gas–liquid flow is very important for the sake of understanding the mea-
surements as well as the chemical processes associated with it. Thus, multiphase flow
measurement before processing within the pipeline for the purpose of production is es-
sential for safety and efficiency (Dukler & Hubbard, 1975).
The product of an oil and gas reservoir consists of a mixture of oil, gas, and water.
During the oil extraction, gas and water are produced as by-products as a natural phe-
nomenon, which occurs in the petroleum field. In order to maximize the amount of oil
that can be retrieved, water and gas are often injected at various locations into the well.
Thus, monitoring and measuring the output of oil, gas and water mixture are crucial.
The information not only can be used to optimize both the operation and transportation
management but also to enhance the quality of production (Al-Hajeri et al., 2009).
18

Single phase flow is well characterized by turbulence, velocity profile and the bound-
ary layer whereas these are not suitable to describe the multiphase flows phenomenon
(Corneliussen et al., 2005). Generally, MPMs are designated according to flow regimes.
These flows could be either horizontal, vertical or incline orientations. Flow regimes
are heavily influenced by their constituent transport properties (surface tension, density
and viscosity), the orientation and the flow-line geometry and individual phase flow rates
(Thorn et al., 2012). In order to determine phase fractions and achieve efficient operation
of the multiphase flow systems, the requirement to identify the flow regimes in multiphase
flow is vital (Arvoh et al., 2012). In the recent past scientists have developed several
mechanisms to classify flow regimes according to the topological similarities. Typical
two phase flow in horizontal pipes is classified into elongated bubble, annular, slug, wavy
and stratified flow pattern, whereas the flow of liquid-gas in vertical direction is classified
into the flow regimes churn, annular, bubbly and slug flow (Falcone et al., 2009). To study
two phase flow the different regimes are required to be identified from the sensor signals
of the flow by using a pattern recognition technique.
Different techniques have been applied for analysis of two phase flow. The advan-
tages of the non-radioactive MPM over MPM techniques involving radioactive sensors
have been discussed by some authors (Arora, 2009). Considering cost involvement the
non-radioactive MPMs do not use radioactive elements so they are much cheaper to con-
struct. Also an additional advantage is that, the operational cost is very much less com-
pared to the radioactive instrumentation due to the enormous expenditure associated with
environmental, health and safety requirements for the latter. Furthermore, non-radioactive
MPM do not require specialized packaging and the procedure for customs clearance is
much simpler, thus the expenditure of exporting and importing are substantially lower.
As for applications for mobile non-radioactive MPMs, they are applicable for well test-
ing and during the fluid drilling phase for early production checks. None of the special
19

safety requirements associated with radioactive MPMs is needed.
Multiphase flows characterized by the use of the impedance technique were stud-
ied as early as the 1960s (Falcone et al., 2009); they were also used in characterization
of commercial MPMs (Goncalves et al., 2011) and (Scheers, 2001). Flow pattern mea-
surement using the impedance methods is very sensitive to the flow pattern inside the
channel (Falcone et al., 2009) and is affected by the phase inversion problem, for exam-
ple, a change from capacitance to conductance has appeared when the flow change from
oil to water is continuous. On the top of that, this electrodes operates on direct contact
with the flow (this is an invasive method of approach), which in some cases may lead
to difficulties for the instrument production and in some other cases it will distort the
true reading. A system for overall flow rate measurement combining differential pressure
cone meter and conductance-ring sensors for phase fraction detection was introduced by
the researchers(Tan et al., 2013). The system was introduced for the application of the
measurement for water–oil flows, whereas the authors also claimed that the introduced
methodology could be further used for gas–liquid two-phase flows. However, for these
flows no experimental data are generated and presented yet. The instantaneous void frac-
tion distribution in pipe flow could be determined by the wire-mesh impedance technique
(Prasser et al., 1998) and (Da Silva, 2008). This technique is considered as simple, high
temporal resolution and low cost when it is compared to other imaging systems, although
it operates though intrusion, which is restricted to the laboratory environment. This tech-
nique is still safer, cheaper and faster than radiation based tomographic techniques. With
reference to the Electrical Capacitance Tomography, this can also be readily digitized and
automated. Nonetheless, its spatial resolution is inferior to that of nuclear based tomog-
raphy and it is also subject to the phase inversion problem (Falcone et al., 2009).
Poette and Reynier have investigated a comparison of non-intrusive techniques for
three-dimensional mapping of multiphase flows occurring during tank sloshing (Poette &
20

Reynier, 2014). Considering applications, this can assure propeller feeding during flight
and manoeuvers of launchers and satellites which is a major issue. Electrical and ultra-
sonic tomography was given particular attention as both of them have a similar nature,
for instance non-invasive, non-intrusive, fast, simple and low cost to operate, and suit-
able for real time measurements. Later acoustic attenuation of sound wave signals was
used to measure the void fraction of bubbly water–air flows, a semi-empirical model of
the interaction of the sound wave with the two-phase flow was developed for the flow
investigation.
Theoretical and experimental investigations on the feasibility of using acoustic res-
onant spectroscopy was performed by (Chen et al., 2010) to measure the gas volume
fraction of liquid-gas flows. In their experimental investigation a cylindrical cavity with
open ends was allowed to be immersed in transformer oil through which air was bubbled;
a hydrophone was used to capture their effect on the resonant amplitude and resonant
frequency of the assembly.
When the air bubbles are even below 0.1% of the size of cylindrical cavity then
they are capable of causing a prominent resonant frequency shift; in this investigation
this shift was observed at its maximum when the bubbles were located in the middle
of the cavity. In this investigation both the resonant frequency and resonant amplitude
were investigated which decreased dramatically with the increasing of gas flow rate, thus
decreasing the sensitivity of the technique. The electromagnetic wave sensing technology
utilizes the resonant frequencies that occur in a cylindrical cavity and monitor the changes
in the permittivity of the measured phases to differentiate between the volume fractions
of different fluids and flow regimes, which is proven successful (C. Oon et al., 2016;
C. S. Oon et al., 2016).
A comprehensive investigation was performed on the application of pressure fluc-
tuations of statistical analyzes for characterization and two-phase flow signals. Several
21

pressure transducers were used to pick-up the two-phase flow signals and were analyzed
for features extraction using power spectral density to generate input parameters for the
neural network (Santhosh & Roy, 2012; Xie et al., 2004; Sun & Zhang, 2007). In or-
der to classify flow regime, other sensor signals have been utilizing statistical moment of
analysis, for example radioactive images and conductance probe (Sunde et al., 2005; Her-
nandez et al., 2006). It is concluded that the pattern identification of flow regimes using
pressure signals for real time online flow regime identification is fast enough (Xie et al.,
2004; Santhosh & Roy, 2012). However, in these cases the transducers introduced are the
invasive type of sensors. The requirement for a non-invasive technique for two phase flow
regime classification for instance ultrasound or γ-ray is becoming important. On the basis
of the review of the methods of the flow regime classification, it is shown that the tech-
niques used earlier were empirical models or mechanistic models. The multiphase flow
patterns in these investigations were identified by using equations governing the physics
of the fluid developed from the mechanistic models. In this process the flow patterns are
identified by using these models with the disadvantage in fact that the components of the
flow are required to be examined independently (Ozbayoglu & Ozbayoglu, 2009).
Continuous wave ultrasound signals are used in Ultrasound Doppler Flow Sensors,
which potentially achieve non-invasive flow velocity measurement. The existing medical
ultrasound system uses the techniques of continuous wave ultrasound. This techniques
utilize frequency shift phenomena representing the flow velocities that could be used to
develop methods for predicting flow regimes (Übeyli & Güler, 2005). This technique
can be used in application of Continuous Wave Doppler Ultrasound velocity measure-
ment of two-phase flow in pipes. In multiphase flow measurement, (Kouamé et al., 2003)
present an application of Continuous Wave Doppler Ultrasound velocity measurement to
two-phase flow in pipes. They proposed the use of the frequency resolution techniques to
overcome the hindrance to the velocity profile measurement by the presence of coloured
22
noise, which introduces a significant obstacle to the classical frequency estimators. It was
observed that the Pulse echo ultrasound techniques have limited liquid velocity informa-
tion due to the restriction on the maximum measurable velocity in two-phase flow mea-
surement by using pulse wave ultrasound in the Nyquist criterion. (Evans & McDicken,
2000). It is noted that the characteristics of the reflected wave are being influenced by the
shape and size of the interface of the ultrasound wave length (Murai et al., 2010).
(Abbagoni & Yeung, 2016) investigates the feasibility of using a clamp-on instru-
ment for flow regime identification of two-phase flow using an ultrasonic Doppler sensor
and Artificial Neural Network (ANN), which could record and process the ultrasonic sig-
nals reflected from the two-phase flow. A non-linear mapping between input and output
variables and the cross-correlation among these variables are provided by ANNs which
could be an alternative tool for automatic identification of flow patterns (Figueiredo et al.,
2016). Due to fast responses and simplification the ANNs are often preferred over statis-
tical methods of pattern recognition. (Mi et al., 2001). Moreover, the ANNs have good
performance on pattern recognition due to their efficiency and learning algorithms (Jain
et al., 2000). Therefore considering the flow regime classification, ANN has advantages
over other analytical tools like the expert system and clustering.
Normally for two phase flow, the phase fraction in liquid is measured with a two-
phase flow meter where the gas fraction is passed through a gas flow meter and the liquid
through the liquid flow meter. After separate flow measurement the two streams are
then recombined together to pass through a specific process. Thus the fully two-phase
separation system has the advantages such as high accuracy and the suitability for all
types of flow. The phase fractions in water-oil flow are commonly measured by two
methods such as γ-ray and electric impedance methods in the industries. The hazard of
radiation has limited the application of γ-ray method, however, the performance is stable.
The electrical impedance across two capacitance plates, develops the electric impedance
23

technique which is a function of the ratio of the two fraction. There is a limitation of
developing electric impedance technique which short circuit will occur when the high
electrical conductivity material such as the water concentration in the fluid is high. With
development of new methods, including microwave attenuation and infrared absorption
were introduced to address the problem of the limitation of water-cut range (Qu et al.,
2013).
Detail and specific data of flowing products from a well is needed for trouble free
processing. Thus it is necessary to measure directly or indirectly the phase velocities,
water-in-liquid ratio and liquid or gas fraction to estimate the production flow rates of oil,
produced water and gases. Several companies and research organizations have introduced
different measurement technologies for developing a number of MPMs to overcome this
challenge. Nowadays, many challenges are yet to address, for instance the effect of fluid
properties and multiphase flow regimes of phase-fraction measurements even though the
MPMs are commercially used. Thus in the attempt at improving the robustness of real
time measurement for crude oil production or well streams; the multiphase flow measure-
ment is still an ongoing research topic with a motive to monitor continuous production
of each individual oil well in a group of wells and to provide a low-cost MPMs solution,
which is especially needed for monitoring the marginal-field production. (Li et al., 2013).
In the present research for measuring the fraction of two phase water-gas stratified flow
in the pipe an electromagnetic cavity sensor is used where the outer cavity is filled with
air and the water is allowed to flow inside the pipe without disturbance. From the hazard
point of view it has high safety features and it is a non-ionizing technique utilizing low
power output and the microwave is contained in the cavity.
24

2.3 Multiphase flow calculation
The mass flow rate of a system is the measurement of the mass of fluid or fluids
passing through a single point in a system per unit of time. The mass flow rate and the
volumetric flow rate can be related as shown in equation 2.1.
m = ρV (2.1)
Where m is the mass flow rate, ρ is the density of the fluid and V is the volume flow
rate.
If the volumetric flow rate is in cubic metres per second and the density is in kg per
cubic metre, Equation 2.1 results in mass flow rate measured in kg per second. Other
common units for measurement of mass flow rate include pounds per hours and pounds
per second. Replacing the velocity in equation 2.1 with the appropriate terms from equa-
tion 2.4 can be used to calculate the mass flow rate directly.
m = ρAv (2.2)
Where m is the mass flow rate, ρ is the density of the fluid, A is the area and v is the
velocity of the flowing fluid.
Three phases in a pipeline could be measured by different methods to express the
quantities of each phase. The primary information required by the user of a three phase
flow instrument are the volumetric flow rate and or mass flow rate of the oil, water and
gas components in the flow (Amdal et al., 1995). Thus the direct measurements of each of
these quantities are the objectives of the application of the ideal three phase flow meter.
Generally, the use of a direct volumetric flow or mass flow instrument cannot measure
separately each individual three phases of the flow. The alternative to direct volumetric
flow rate measurement is the use of an inferential measurement technique which requires
25

the density, cross sectional fraction and superficial or phase velocity of each phase in order
to calculate each component of the mixture volumetric and mass flow rates. Equations
2.3 and 2.4 represents the volumetric flow rates Q of each phases and the mixture flow
rate respectively.
Qw = Aαvw;Qo = Aβvo;Qg = Aγvg (2.3)
Qt = Qw +Qo +Qg (2.4)
where Q is the volumetric flow rate, the α , β and γ are the water, oil and gas phase
fractions, the vw, vo and vg are the superficial velocities of the water, oil and gas phases
in the flowing fluid and A is the cross sectional area of the pipe. The flow velocity of
one phase is defined as superficial phase velocity, assuming the phase (water, oil and gas)
filled up the pipe. The phase mass flow rate M of each phase and the total mass flow rate
can be calculated as:
Mw = Qw pw;Mo = Qo po;Mg = Qg pg (2.5)
Mt = Mw +Mo +Mg (2.6)
where M is the mass flow rate, Q is the volumetric flow rate and ρw, ρo and ρg are
the density of the water, oil and gas fractions.
26

2.4 Electromagnetic waves propagation
Figure 2.1 shows the electromagnetic waves in free space. The electric and magnetic
fields oscillating in phase and perpendicular to the direction in which the wave travels,
they are also oscillating perpendicular to each other and in phase. The amplitude of
the electric and magnetic fields oscillate simultaneously between positive maximum and
negative minimum amplitude along the propagation direction.
The electromagnetic waves in free space is presented in Figure 2.1. It is seen that the
electric and magnetic fields are in phase, mutually perpendicular, and also perpendicular
to the direction in which the wave travels. The electric and magnetic fields oscillate
together between the highest positive and the lowest negative values along the direction
of propagation. The electromagnetic waves travel at the speed of light in the free space,
which relates the wavelength to the propagation frequency of the wave.
Figure 2.1. Electromagnetic waves propagation in free space. The wave propagatesin the x direction. and E and H are transverse.
In communication systems radar operation the free space electromagnetic waves are
widely used. In general the electromagnetic waves need to be transmitted from one loca-
tion and be received at another location. The microwave sensors are designed for indus-
trial applications, where the microwave signals have to be connected or coupled from the
source to the system.
For efficient signal transmission the electromagnetic energy must be transmitted in
an efficient manner from the source to the sensors with minimal attenuation. In building
27

the setup, waveguide and coaxial transmission line are the two commonly used microwave
devices. At the microwave frequencies, each devices offer advantages and disadvantages.
On the other hand, the waveguides have the advantages of high power handling capability
and low loss, but have large size and narrow bandwidth. On the other hand, coaxial cable
could be used advantageously for the large bandwidth and small sizes but has high attenu-
ation and limited power handling capability. Figure 2.2 presents the shapes of rectangular
and circular cross section waveguides. It is to be noted that the shape and material of
each types of these devices vary according to the required applications (Connor, 1972).
A cylindrical cavity resonator could be made by the use of a cylindrical waveguide with
shorted ends, for installation of a microwave sensor for measuring the flowing material
components in a pipeline, containing flow of water, oil and gas components.
Figure 2.2. Rectangular waveguide (a) and Cylindrical waveguide (b).
28

2.5 Electromagnetic wave resonance cavity
The process of microwave analysis and monitoring is based on the material interac-
tion with microwaves (Bjarnadottir et al., 2015). It could be presumed that the unique
signal spectrums in the form of reflection coefficient (S11) and transmission coefficient
(S21) based on the parameters such as conductivity and permittivity could be provided
by the broadband microwave analysis of the material. Conductivity is represented by
the ability of the materials to conduct electric current. On the other hand the effect of
a dielectric medium on the applied electric field is the permittivity, a complex value.
The material’s ability determines the polarisation in response to the applied field and the
mechanism of the total electric field reduction inside the material. There are two main
parameters being accounted for by these properties, i.e. dielectric constant and dielectric
loss of the material (Ateeq, Senouci, et al., 2012; Mason, Wylie, et al., 2014).
Dielectric constant (ε′): It is noted that the alternating polarisation inside the material
appears when the EMW passes through the material. It has been observed that some of the
energy is stored and the rest is being released slowly causing a reduction in the velocity
of the wave. This phenomenon provides support in identifying materials with different
dielectric constant values.
Dielectric loss (ε′′): It determines the reduction in the applied EMW’s magnitude.
Under the influence of the electric field the molecules begin to rotate and produce friction
causing the energy loss which reduces the magnitude of the wave.
Change of any kind in the material’s concentration, percentage, type, etc. will likely
change its permittivity which causes the change in the microwave response when the
material interacts with the microwaves. Thus the material can be characterised by mea-
suring this response over the range of discrete frequencies. Water is considered as a polar
molecule due to the charge separation that exists between the hydrogen and oxygen atoms
29

and due to this it has relatively high permittivity (εr=81, at 15◦C). Hence, a comparatively
large frequency shift could be obtained for a small change in water fraction. On the other
hand, gases have low permittivity values approximately (εr=1). Non-polar materials such
as oil have low permittivity value ( εr=2.2 to 2.5) (Mason, Wylie, et al., 2014; S. Wylie et
al., 2006).
Depending on the dimensions of the cavity and permittivity of the fluid flowing
through the cavity the electromagnetic wave resonance cavity resonates at certain fre-
quencies. When an electric and magnetic fields forms a standing wave then the resonance
occurs. Various combinations of standing waves may exist inside the cavity. Thus vari-
ous electromagnetic wave resonance modes possibly can occur inside a particular cavity.
The fundamental modes for cylindrical cavities are the T M010, T E111 and T E011 modes.
The Transverse Magnetic (TM) Mode and the Transverse Electric (TE) Mode have elec-
tric and magnetic components respectively in the propagation direction. It is reported
that when an electromagnetic wave resonance cavity oscillation is applied then each of
the modes show its own resonant frequency, with a quality factor Q associated with it
which is in fact inversely proportional to the power dissipated in the cavity. When fluid is
exposed to EM irradiation it alters the velocity of the signal, attenuates, or reflects it.
Consider a cavity when it is excited at an appropriate EM frequency by some means
for example, via a small antenna placed inside it. Depending on the dimensions of the
cavity and the dielectric properties of the fluid, the resonant modes occur inside the cavity
when the electric or magnetic components of the EM signal form standing waves. Equa-
tions 1 and 2 can be applied to calculate the resonant frequencies for T Enml and T Mnml
modes in a cylindrical and rectangular cavities respectively.
30

fnml =c
2π√
µrεr
[(pnm
b
)2
+
(lπd
)] 12
(2.7)
where c is the velocity of light, εr is the relative permittivity of the material, µr is
the relative permeability of the material, b is the radius of the cavity, d is the depth of the
cavity and Pmn is the mth root of the Bessel function of the nth order.
fmnl =c
2π√
µrεr
√(mλ
a
)2
+
(nλ
b
)2
+
(lπd
)2
(2.8)
where c is the velocity of light, µr is the relative permeability, εr is the relative
permittivity, Pmn is the Bessel function of the nth order for the TE or TM modes of a
rectangular cavity, a is the width of the cavity, b is the height of the cavity and d is the
depth.
For the purposes of transmission and reception of electromagnetic energy, any num-
ber of antennas may be placed within the cavity, however one and two ports (thus, one
or two antennas) cavities are involved in the most typical configurations. Using a Vector
Network Analyzer (VNA) in a one port configuration it is possible to measure the power
which is reflected back from the cavity as a result of microwaves interaction with the ma-
terial and this phenomenon is often referred to as a S11 parameter/signal. However, S11
measurements provide most effective results only for near field or close contact. Thus
the power is transmitted through the cavity in a two port configuration i.e. microwaves
are inserted in the cavity to interact with the material and then the signals are received on
the other end by a receiver antenna. The received signal named as S21 parameter/signal is
then forwarded to the VNA. Since the material under test sits in the centre of the cavity,
S21 is the better option (Mason et al., 2016).
In order to transmit the microwaves inside and to monitor its resonant behaviour a
coupling structure or an antenna is required. To experience least interaction with the fields
31

inside, the antenna should be relatively small. A pair of loop antennas was used for the
purpose of monitoring the S21 signal. Considering other options such as patch antenna
may not be suitable because they can only measure the S11 (reflected signal), the recorded
results of which in the previous study were not promising.
With reference to the variable permittivity inside the pipeline and the air in the outer
cavity, the resonant modes of the cavity do not change all at the same rate with respect to
the permittivity, as they would if the entire cavity were filled by a homogeneous material.
It has been observed that some modes would interact more with the central portion of
the cavity containing the pipe so it would be more sensitive to changes in the pipeline
permittivity than that of other modes.
32

2.6 Boundary conditions in waveguides
The electromagnetic waves propagation inside a waveguide or cavity resonators dif-
ferent from the electromagnetic waves propagation in free space. The waveguide confines
the electromagnetic wave propagation inside a metallic enclosure, it has physical limits.
In order to enable the energy to travel through a waveguide or cavity resonator, there are
two boundary conditions. The first boundary condition is the electric field has to be per-
pendicular to the metallic conductor as shown in Figure 2.3. In other word the electric
field cannot exist parallel to a metallic conductor, as illustrated in Figure 2.4.
Figure 2.3. E field boundary condition. It meets boundary conditions.
The second boundary condition refers to figure 2.5 where an alternating magnetic
field exists in an enclosure where it forms closed loops, is perpendicular to the electric
field and is parallel to the metallic conductors.
E field induces current flow and that produces an H field, where both the fields always
coexist at the same time inside a waveguide or cavity resonators. In other words, the
system satisfies both the boundary conditions simultaneously, since neither field can exist
alone.
33

Figure 2.4. E field boundary condition. It does not meet boundary conditions.
Figure 2.5. H field meets the boundary conditions.
34

2.7 Microwaves sensor basic
In the wake of the industrial revolution, the automation of applied processes has
come up with an incredible need for sensors. Different problems are being solved by
different types of sensors (Thorn et al., 1997). The electromagnetic wave sensors operat-
ing at microwave frequencies are based on the principle of interaction of signals with the
medium material. Hence the type of interaction generated could be in the form of am-
plitude attenuation, phase shift as reported by some researchers (Nyfors & Vainikainen,
1989). Depending upon the measurement technique and interactions, the Microwave sen-
sors can be divided into groups. Research on resonance cavity or waveguide sensors,
transmission sensors, reflection sensors, etc. are used for measuring water, oil and gas
flowing in a pipe (Nyfors & Vainikainen, 1989). Another group of sensors are the ra-
diometers sensor, radar sensor and topographic sensor developed to measure physical
quantities for instance solid material properties, movement, shape and distance. The mea-
surement of material with microwave sensors are based on the relative permittivity and
permeability which are completely determined by the interaction between microwave sig-
nal and the medium of material. Equations 2.9 and 2.10 represent the relative permittivity
and relative permeability respectively.
εr = ε′− jε ′′ (2.9)
Where ε ′ is the real part of the permittivity, j is the imaginary unit and ε ′′ is the
imaginary part of the permittivity.
µr = µ′− jµ ′′ (2.10)
Where µ ′ is the real part of the permeability, j is the imaginary unit and µ ′′ is the
imaginary part of the permeability.
35

The real part of the relative permittivity has been specifically considered in this thesis
as the interaction (resonant frequency) effect of the microwave signal, unless otherwise
stated,ε”= 0, and µr= 1. As different materials have different permittivity, a mixture of
permittivity depends on the relatively large component of permittivity as well. In other
words, depending upon the permittivity of the mixed materials, the measurement of the
applied microwave properties can provide information about the material taken under in-
vestigation. Hence, in general the total permittivity for two components is 100% for a
simple case. In this case, if there is one unknown permittivity of the components then it
could be possible to evaluate from the total and the known permitivities of the compos-
ite material. Therefore, it is possible to deduce the composition using one measurement
which is the resonant frequency. When there are more than two components in the mix-
ture, the identification become complicated, for instance the mixture of water, oil and gas
mixture. For this type of flow measurement the multiphase flow sensor or three phase
meter is needed, where different kinds of technology is used to detect or measure the
components of a mixture in a three phase flow system (Thorn et al., 1997; Kolev, 2005).
The simplicity of the process is the advantage of the microwave sensor, but the sen-
sitivity of the reflections in many different components in the system pose the main prob-
lem, for example the interaction between the material and electromagnetic wave depends
on the flow regime and the dielectric windows. There are ripples formed on the frequency
response in the system caused by the reflections and the amplitude is much more affected
than the phase. Measuring only one microwave parameter by the sensor could provide
higher accuracy, it can be achieved better by using measuring the signal phase shift mea-
surement compare to the amplitude of attenuation measurement (Klein, 1981).
When the small losses fluid is flowing inside the pipe compare to the reflections from
the pipe walls, it will also experience strong effect on both the phase and the amplitude
(Brodwin & Benway, 1980). The errors are substantial if the measurement is taken on
36

one single frequency as it moves the cut off frequency of the applied frequency mode.
37

2.8 Microwave Waveguides
Guided electromagnetic energy at microwave frequencies can be obtained by waveg-
uides or resonance cavities which can be recognized as hollow conducting pipes. Copper,
brass, or aluminium, are used to make waveguides and they can be employed to construct
either rectangular or cylindrical cross section. In this case the lower operating frequency
limit is governed by the physical dimensions of the waveguides.
A single conductor constitutes the waveguides; therefore, they can only support
transverse electric TE and transverse magnetic TM waves, which are also characterized
by the longitudinal magnetic or electric field components respectively. This type of trans-
mission method has the drawback of the relation between the physical size of the waveg-
uide and the wavelength of the electromagnetic wave (Colline, 1992). The relationship
requirement reveals that the width of a waveguide must be approximately half of the
wavelength at the frequency of the wave to be transported. Thus a waveguide for use at
1 MHz would be about 150 metres wide. Thus it has become impractical to use waveg-
uides at low frequencies. Figures 2.6 and 2.7 predicts, the cylindrical and the rectangular
waveguides respectively with internal dimensions.
TE and TM waves but not the TEM waves could be propagated by the rectangular
and cylindrical waveguides. This phenomenon refers to the fact that a unique voltage
cannot be defined since there is only one conductor. Thus various possible solutions
for both the TE and TM waves are available; so the subscripts are used to complete the
description of the field pattern in the mode to be transmitted. In case of the rectangular
waveguide, the number of half waves in the a dimension represent the first subscript
and the number of half waves in the b dimension represent the second subscript. Figure
2.8 depicts the T E10 mode field configurations in the rectangular waveguide. The first
subscript is considered 1 as there is only one half wave pattern across the, a dimension.
38

Figure 2.6. Rectangular waveguide with internal dimension a and b.
Figure 2.7. Cylindrical waveguide with inner radius, r.
Across the, b dimension there are no E-field patterns as well, so the second subscript could
be denoted 0. However, T E10 represents the complete mode description of the dominant
mode in rectangular waveguides.
The subscripts have a different meaning for a circular waveguide. The first sub-
script represents the number of full-wave around the circumference of the waveguide.
The second subscript represent the number of half-wave patterns across the diameter. In
39

Figure 2.8. (T E10) mode field configurations in rectangular waveguide.
the circular waveguide shown in Figure 2.9, it could be reported that the E field is per-
pendicular to the length of the waveguide with no E lines parallel to the direction of wave
propagation.
Figure 2.9. Dominate mode (T E11) field configuration in circular waveguide.
Therefore, while operating in the TE mode it must be classified. If the E line pattern
is following a counter clockwise direction starting from the top, the E lines move from
zero, through maximum positive or the tail of arrows (9 oclock) and then back to zero,
it continues through the maximum negative or the head of arrows (3 oclock), and returns
40

back to zero again. Here the first subscript is 1 because this is one full wave. For the
horizontal direction across the diameter, the E lines go from zero through maximum and
then back to zero, making a half wave. It is represented by 1 for the second subscript.
Therefore, T E11 is used to describe the dominant mode in circular waveguides. A sim-
ilar procedure can be used to identify different modes for both circular and rectangular
waveguides.
Based on the desired mode of operation and the frequencies the dimension for a
waveguide is chosen to be operated at a given wavelength. It is noted that the set dimen-
sions are based on the cut off frequency in waveguide standard design of the fundamental
mode. The cut off frequency of a waveguide is defined as the lowest frequency below
which the energy will not radiate in a waveguide. In that stage a lower frequency will
attenuate rather than propagating.
41

2.9 Microwave sensors application/potential
Sensors operating within microwave frequencies or microwaves sensors are broadly
utilized in commercial and industrial sectors; they are also widely studied by researches
around the world. The use of microwave sensor include water quality monitoring (Korostynska,
Ortoneda-Pedrola, et al., 2014; Korostynska et al., 2013; Korostynska, Mason, Ortoneda-
Pedrola, & Al-Shammaa, 2014), medical applications (Lu et al., 2009; Dei et al., 2009;
Fok et al., 2015; Korostynska, Mason, & Al-Shamma’a, 2014; Blakey et al., 2013; Mason
et al., 2013) and structural analysis (Adous et al., 2006; Ali et al., 2015). Quality clas-
sification of fresh (Castro-Giráldez, Aristoy, et al., 2010; Castro-Giráldez, Botella, et al.,
2010) and cured meats (Fulladosa et al., 2013; Bjarnadottir et al., 2015) using microwave
sensors is also extensively studied.
One researcher from Liverpool John Moores University, O. Korostynska proposed
that no currently available sensor system today can fully address the customers’ require-
ments. The sensor is required to detect the composition of water solutions to the desired
resolution in real time, plus there is the need for system mobility and cost effectiveness.
Consequently, novel real-time monitoring methods are essential. One method highly
capable of meeting these requirements is based on the microwave sensing technology
(Korostynska, Ortoneda-Pedrola, et al., 2014).
Microwave sensors offer robust and real-time non-invasive method of materials anal-
ysis. The researchers have shown that the sensor can take on many physical forms, in-
cluding planar structures (Korostynska et al., 2013; Mason et al., 2013), fluidic devices
(Blakey et al., 2013) and resonant cavities (Mason, Korostynska, et al., 2014), It is highly
adaptable to different working environment and versatile sensing applications. Moreover,
it is fairly inexpensive to generate and detect microwave signals using currently avail-
able technology; it is featured in the many wireless communications devices for example
42

tablets, portable computers and smart phones. Microwave sensors are particularly attrac-
tive for the meat industry, given the needs for high-resolution drip loss detection with low
cost devices, which is expensive using the current technologies like γ-ray and X-ray. In
addition, the microwave technique is non-ionizing, uses less power than modern wireless
communication devices which is no more than 10 mW. Consequently, it is considered
safe to be used in food production facilities without the risk of radiation leaks (Adous et
al., 2006).
Ateeq, Senouci, et al. (2012) studied the optimum detection of bitumen using the
frequency range between 0.25 to 3.20 GHz. According to his study, the higher frequency
range can be used depending upon the microwave response and physical properties of
the materials. Microwave can penetrate dielectric materials, for example, glass, plas-
tics, composite materials (a few centimetres thick) and ceramics (Wellock & Walmsley,
2004). Therefore, interaction of Microwave with bitumen samples needs the thorough
understanding of both its thermal and physical properties. It is thought best to use cavity
resonators which can contain the whole sample for analysis (Scheffler, 2004).
Recently in the water treatment industry, many technologies have been developed to
detect nutrient level in real time to avoid environmental pollution and hefty fine by the au-
thority. Al-Dasoqi uses two cavity microwave sensor to detect high and low concentration
of Phosphorus and Nitrogen in waste water treatment plant. To detect high concentration
liquid (≥ 24 mg/L of dissolved phosphorus), the sample was introduced into the centre
of the cylindrical cavity in 15ml Polypropylene tubes. For low concentration liquid de-
tection (≥ 5mg/L of phosphorus and ≥ 2mg/L of nitrogen), the sample was introduces
into the centre of rectangular cavity in Nuclear Magnetic Resonance (NMR) tube. The
combination of these two cavities sensor solved the high and low concentrate nutrient
detection. On the other hand, the major disadvantage is that two different sampling tubes
have to be used for the detection. The samples also have to be physically taken by human
43

and put inside the sampling tubes which require trained personal to avoid contamination
and error during the process (Al-Dasoqi, 2012).
Mason, Korostynska, et al. (2014) proposed a rapid microwave detection method
based on the interaction of electromagnetic waves and a material. Microwaves are com-
mon in sensing applications such as waste water monitoring (Al-Dasoqi et al., 2011) and
oil pipeline monitoring (S. R. Wylie et al., 2006; Al-Hajeri et al., 2009) because of their
response to the different dielectric properties of materials. In another study, activated car-
bons filter ages over time due to the exposure to atmospheric conditions and reaction with
various gases including toxic ones. Consequently, the amount of the activated carbon will
decline, hence the dielectric properties of the material changes. This phenomenon can
be detected through measurement of microwave power transmitted through and reflected
from an activated carbon sample. Microwave measurement methods have been demon-
strated to offer excellent speed and precision; moreover, the applications of it are versatile
enough to adapt to a wide range of filter sizes and configurations.
Microwaves are widely utilized for material characterization because the electromag-
netic wave transmitted through or reflected by a medium highly depends on the dielectric
properties of the material, and the electromagnetic wave easily propagates through low-
loss dielectrics material (Mukhopadhyay et al., 2013). The signal is distorted when inter-
acting with the medium, and this appears in the form of compression or broadening of the
pulse, specifically water, which reaches its maximum at or approximate to the resonant
frequencies (Georgiadou et al., 2006).
(Kapilevich & Litvak, 2007) reported that a cavity resonator utilized microwave for
accurate measurements of organic (alcohol, sugar) and inorganic (KMnO4,NaCl) water
solutions concentrations. Particularly, the resolution of the sensor to detect NaCl was
0.4 dB (mgml−1)−1 for concentration between 0–1%. The concentrations of other water
solutions were able to be detected as well, however, its resolution are highly depends on
44

the type of chemical.
Planar printed patterns electromagnetic sensors have been getting attention in recent
years due to their, flat profile, low weight and versatility. It can be designed to suit specific
applications, addition to cost-efficiency and reliability. The manufacturing process is
easy and common similar to that of the printed circuit board production. By changing
the micro-strip line feed configuration, their impedance can be matched to the input line
(Korostynska et al., 2013).
A broadband 433MHz bow-tie antenna is conducted by Abdou et al. (2013) in air
and water with wirelss sensor. The antennas are connected to transceivers and form a
Wireless Sensor Network underwater application. The bow-tie antenna was designed and
constructed in laboratory with the aid of simulations. Many experiments were conducted
to avoid airborne transmission using isolated transmitter from electronics. The bow-tie
antenna (using 433MHz frequency) has proven its feasibility for underwater use.
Communication via electromagnetic waves has been marginalized due to attenua-
tion at high frequencies. The velocity of electromagnetic wave is 3x10⁷m/s, it offers
many benefits over conventional acoustic methods, better transmission across boundaries
and data rate including bandwidth. Attenuation is the major hindrance in underwater ra-
dio wave propagation. But (Abdou, Shaw, Cullen, et al., 2011) demonstrated theoretically
and experimentally that electromagnetic wave can propagate in the water at certain dis-
tances in relatively low frequency bands. In order to deploy underwater Wireless Sensor
Network electromagnetic wave communications, many experiments were conducted by
(Abdou, Shaw, Mason, et al., 2011) using custom made radio transceivers. Loop anten-
nas were used in (Abdou et al., 2012), (Shaw et al., 2006) and other researchers due to
their directional behaviour, they are highly sensitive to magnetic fields thus they are more
suitable for seawater.
Microwave sensor technology even though in its early stages has been utilized in
45

many research and industrial applications including the water industry or multiphase flow
monitoring (S. Wylie et al., 2006; C. Oon et al., 2016), glucose concentration monitoring
(Bababjanyan et al., 2010), food industry (Muradov et al., 2016) water level measure-
ments, characterisation of construction materials and material moisture contents (Ateeq,
Senouci, et al., 2012; Ateeq, Wylie, et al., 2012) and healthcare industry (Blakey et al.,
2012).
46

2.10 Current available electromagnetic wave sensor
The electromagnetic wave sensors operating at microwave frequencies are based on
the principle of interaction of signals with the medium material. Hence the type of inter-
action generated could be in the form of amplitude attenuation or phase shift, depending
upon the measurement technique and interactions. There are phase shift sensor, attenua-
tion sensor, transmission sensor, reflection sensors, etc. used for measuring water, oil and
gas in a flowing pipe.
2.10.1 Attenuation sensor
On the other hand, based on an open ends hollow cavity or waveguide (Hasted,
1973; Basrawi et al., 1999) the Roxar phase component sensor was manufactured. In this
sensor the electromagnetic waves are transmitted into a particular flowing mixture which
at a characteristic frequency, resonates to produce distinct peak amplitude. The generated
peak is directly proportional to and corresponds with the phase fraction or component,
e. g. water content (Gaisford, 2001). It can also be said that the mixture components
produce different and distinct peak amplitudes at the resonance state. This difference
appears due to their different dielectric constants. On the other hand, the developed peaks
are captured and translated directly as a phase component measurement in the mixture.
This sensor is only accurate for low loss media measument, which is the major limitation
in this case. A loss in signal simply means there is oil in the fluid. This is due to the fact
that the water in the fluid absorbs energy too fast for resonance to occur (Basrawi et al.,
1999; Gaisford, 2001).
47

2.10.2 Phase shift sensor
Based on the measurement of phase shifts and a microwave resonance cavity of
coaxial configuration (waveguide), the electromagnetic wave sensor Agar is commer-
cially used (Scott et al., 1993; Mehdizadeh et al., 1995). As a measure of the component
in a mixture it can measure the phase shift of the applied electromagnetic wave signal as
per permittivity of the constituents of the mixture. Here the transmitting signal is applied
from one side and the transmitted signal is received by two antennas at the other side at
a distance from the source antenna. Then the phase shift between the received signals is
used for calculation of (with regard to the transmitted signal) the difference as a measure
of the phase components in the mixture.
The damping effect of electromagnetic waves signals at microwave frequency by
water and oil for various measurement cause the different degree of attenuation. For
water medium the attenuation of microwave amplitude is quite substantial (Scott et al.,
1993). The energy loss during transmitting and receiving of microwave signal between
transmitter and receiver is clearly observed.
The major problem faced using this technique is the fluid is in contact with the trans-
mitter which dominates the readings (Agar, 1992). If the fluid is immersible as it is with
water-oil mixture then the effect on microwave signal is serious. False reading could ap-
pear in this system because of the uneven distribution of the fluid particles result in the
energy loss and phase change. In this system the transmitter and the receivers are required
to intrude into the flow channel (Mehdizadeh et al., 1995; Agar, 1992). The drawback of
this method is wear and tears and replacement of the antennas from time to time in this
system. Also, the antenna surface needs to be cleaned due to fluid clogged which incurred
higher operational cost and downtime. As this approach required intensive maintenance,
it would not be applicable in a remote environment.
48

2.10.3 Transmission sensor
Figure 2.10. depicts a transmission sensor. This sensor is built of two dielectric
windows fitted symmetrically on either sides of a metal pipe with a transmitting antenna
and a receiving antenna. The material flowing in the pipeline between the antennas (Klein,
1981) is being penetrated by the microwave signals. The amplitude and the frequency
shift of the signal are affected by the permittivity of the flowing fluid or liquids. The
transmission sensor is easy to construct, however, it is highly sensitive to the flow regime.
Also, the antenna in contact with the flowing liquid may cause rust and deposition on the
antenna.
Figure 2.10. The basic geometrical configuration of a transmission sensor.
49

2.10.4 Reflection sensor
Measuring the reflection coefficient for a wave reflected at the end of a transmission
line is the basic of a reflection sensor. In this system the fringing field at the end gets in
contact with the flowing material that affects the magnitude and phase of the reflection
coefficient (Stuchly & Stuchly, 1999; Colpitts et al., 1992).
The open ended coaxial sensor measures with the fringing field at the front surface
of the sensor. In this system a small fraction of the mass flowing in the pipe could be
measured. Generally, the reflection senor is not suitable for applications in the oil and gas
industry, but it may be suitable for emulsions of water and oil with little liquid drop size
as the presence of a small volume affects the measurement.
50

2.11 Summary
Microwave spectroscopy utilizes the transmission, absorption, reflection and scat-
tering of electromagnetic waves to study and analyze samples, molecules and materials.
Since microwave (operating frequency between 300MHz to 300GHz) are highly related to
the changes of the molecule’s rotational energy, the geometrical structure of the molecule
plays an important role. Thus, microwave spectroscopy can be use to identify the rota-
tional spectra of the molecules acquired from the interaction between microwave with
molecules of liquid, gas, solid and suspension. Higher frequency detection can be used
depending on the material responses to electromagnetic waves interaction and its phys-
ical properties. Dielectric materials are penetrable by electromagnetic waves, such as
ceramics, composite materials, plastics and glass up to a few centimetres thick. Thus, the
interaction between the samples and electromagnetic waves needs the understanding and
knowledge of the material’s thermal and physical properties. According to the literature
review, it is best to utilize cavity resonators in which the fluids or sample can pass through
the center of the cavity for analysis and measurement.
The current research work uses electromagnetic waves sensors, operating at mi-
crowave frequency to measure the phase components (for instance oil and water mixture)
are based on microwave resonant cavity or waveguide technologies. When microwave
signals are applied at a characteristic frequency to a mixture of flow in a pipeline then
the resonance and properties of these signals (amplitude or phase shift) are affected by
the flow permittivity and then it could be measured and used as an estimate of phase
components in the mixture.
51

CHAPTER 3: METHODOLOGY
3.1 Introduction
The previous chapter explained the details of current available technology of mul-
tiphase flow sensors and the theory of microwave sensors. This chapter will discuss the
methodology on how to use this technology for the non-invasive sensing of two phase
flow. A series of experiments is planned and conducted to validate the usability of the
design. A novel approach is also introduced to solve the low permitivity detection. A
flow chat is included to briefly explain the process of design and experiment. The figure
3.1 shows the flow chat for electromagnetic wave cavity sensor development.
Figure 3.1. Electromagnetic wave cavity sensor development flow chat
52

3.2 Experimental setup
In this experimental study, the cylindrical cavity utilized had its diameter larger than
the pipeline and is open at both ends. This design allowed the pipeline to appear con-
tinuous. The schematic diagram of the cavity along with the pipeline and the embedded
coupling structures/antennas is shown in Figure 3.2. The non-intrusive design of the cav-
ity allowed the antennas to be placed at the appropriate locations on the cavity. It also
enabled the excitation of the resonant frequency for the analysis of water-air and water-oil
fractions in the pipeline. The design of the cavity allowed the pipeline to be kept isolated
and the antennas to be protected from the fluid. Although, the technique is robust and
instantaneous, the limitation of this electromagnetic cavity sensor is that the pipe carry-
ing the fluid should be non-conductive material to allow the penetration of microwaves
through the pipe at higher frequencies.
Figure 3.2. Schematic diagram of the resonant cavity with pipeline
53

3.2.1 Microwave cavity
The resonant cavity used is shown in Figure 3.3. It has an outer radius of 50 mm and
a length of = 300 mm. The PVC pipeline inside the cavity has an outer radius of 25 mm.
The outer cavity is made from brass. Antennas are attached to each side of the cavity as
shown in Figure 3.3.
The non-intrusive design of the cavity enabled the outer pipe to be kept empty and
the inner pipe filled with water-air and/or water-oil fractions. The mode at which mea-
surements were taken only interacted with the central portion of the cavity where the
PVC pipe sits and was sensitive to the permittivity changes in the pipe due to change in
the fractions.
Figure 3.3. Cylindrical microwave cavity resonator with embedded antennas
54

3.2.2 Static experiment and real time measurement
The experimental setup of the measurement system is shown in Figure 3.4. The setup
consists of Rodhe and Schwarz Vector Network Analyzer (VNA) model ZVL-6 with a
frequency range of 9 kHz -6 GHz, an online data processing computer with LabVIEW
display to capture and analyze the data, the cylindrical resonant cavity along with loop
antennas embedded on both sides, a PVC pipe passing through the cavity, cables and
connectors. The input power used to launch the microwave inside the cavity was 0 dBm
and 4000 data points were selected for each measurement. Two antennas were used to
monitor the resonant frequencies so that the measurements can be obtained.
Figure 3.4. Experimental setup of the measurement system showing the cavity, VNA,cables and connectors
The experiment is conducted by measuring the volume of fully filled water in the
pipe which is 740ml. Water was then added to the empty pipe in increments of 148ml
of water, each representing a 20% increase in water fraction. The data was captured
during testing of the prototype sensor, when the percentages volume of water-gas mixtures
increased from 0-100% in the pipeline.
55

3.3 Labview software application
A Labview software application was designed to enable the system to display real
time results and an equation was introduced in the data processing. Figure 3.5 shows the
system front panel offline screen shots for real time water or air fraction detection.
The research team at RFM Group of Liverpool John Moores University had previ-
ously attempted the use of Electromagnetic Wave sensors for measuring and monitoring
purposes. A data base is created to store all data collected and compared with the real
time measurement in order to obtain the results. The drawback of this approach is a huge
data storage space and a large amount of iteration is needed to perform the task. An in-
novative approach to over come this problems is by modelling all the data collected using
an mathematical interpretation. Instead of storing all the data, the new approach identi-
fies the interested points and represents them using a mathematical equation. The new
approach uses shorter time, less computational power and substantially reduces the error
of comparing the stored data and newly obtained data.
Figure 3.5. Offline front panel display
56

3.4 Samples tested and measurements procedure
For the first phase of the research, only static water-air and water-oil were tested.
The analysis of the temperature impact on the water sample was used to establish and
demonstrate the independence of the temperature of water on the microwave frequency
response. The consistent output of this technique to the temperature change was useful to
demonstrate the effectiveness of the microwave analysis technique not only at the room
but also at higher temperatures. This study could be extended further in the future work to
include two phase fractions and the temperature impact on them. The samples analyzed
for the percentage of the volume fraction between water-air and water-oil is shown in
Table 3.1.
Table 3.1. List of two phase system of water-air and water-oil tested for the monitor-ing and analysis of the volume fractions
Sample type Volume fraction (%) Temperature (◦C)Air fraction Water fraction
water-air (two phase) 0 100 2020 80 2040 60 2060 40 2080 20 20
100 0 20Sample type Oil fraction Water fraction Temperature (◦C)
water-oil (two phase) 0 100 2020 80 2040 60 2060 40 2080 20 20
100 0 20
The sample of the fractions of water-air and water-oil were analyzed at a constant
room temperature of 20◦C. This was maintained easily because the tests were carried out
in a temperature controlled environment with a thermostat fitted in the room to constantly
monitor and control the temperature.
The measurements of the change in the volume fraction of two phase systems were
first conducted over the full range of the spectrum between 9 kHz and 6 GHz. However, it
57

was found that the frequency below 5 GHz did not correspond to the changes in percent-
age of water. The results of the frequency response were also not consistent with change
in the fraction percentage. The frequencies above 5.7 GHz were eliminated because of
the ambiguous microwave response as well as to avoid the multi modes and complexities
in the data analysis in the later stage. The measurements were taken between 5-5.7 GHz
with the cylindrical cavity operating in 124 mode. The experimentation was conducted by
measuring the volume fraction of water required to fill the PVC pipe that was equal to
740 ml. The volume was then divided by 5 to get the amount of volume fraction increase
each time in the pipe which equalled 148 ml. The measurement was first taken with the
empty pipe, i.e. filled with 100% of air. Afterwards, as worked out, each 148ml of water
was added into the pipe representing 20% increase in the water fraction and in proportion
20% decrease in the air fraction. The data was captured and recorded in real-time using
LabVIEW program designed to display the microwave response curves. The percentage
of the volume of water was increased from 0-100% in the pipeline. Likewise, a similar
procedure was repeated with water-oil volume fractions with oil starting at 0% and water
at 100%, i.e. 740 ml. The percentage of water was decreased and oil increased by 20%
and measurements taken for each of the percentage increase till the pipe was filled with
100% oil. The measurements were repeated five times to check the consistency in the
response pattern. The repetition of the measurements of fractions along with the standard
deviation were calculated.
The figure 3.6 flow chat below shows the working principle of the electromagnetic
microwave sensor for two phase flow detection.
58

Figure 3.6. The working principle of the electromagnetic microwave sensor flow chat
59

3.5 Temperature effect study
In the temperature dependent study of water, the pipe was filled with 100% of boiling
water and the microwave response was captured and recorded. The temperature of water
was monitored and recorded using a laboratory thermometer. The accuracy of thermome-
ters is 0.5◦C. The interval of the data recording was set manually corresponding to the
temperature drop (approximately every 10◦C).This was done because the permittivity of
polar materials, including water, is a function of temperature. The permittivity of water
reduces with temperature, so resonant modes will occur at higher frequencies when the
water is hot. As the changing permittivity causes the modes to change frequency at dif-
ferent rates, however, they will overlap and this causes some frequency ranges to appear
to be more (or less) sensitive to temperature than the individual modes would be. The
sample of water tested along with the temperature parameter is shown in Table 3.2.
Table 3.2. Analysis of the water sample to monitor the change in temperature andits impact on the microwave response frequency/amplitude
Sample type Volume fraction(%) Temperature (◦C)Water sample 100 28
100 30100 41100 49100 58100 68100 74100 83
60

3.6 Comsol simulation
COMSOL 5.1 simulation package was used to simulate for the resonant frequency
inside the cylindrical cavity. Radio Frequency physic was used for the simulation. All the
dimensions were drawn according to the experimental setup. The height of water level
was calculated according to the percentages utilized in the experiment. The frequency was
set between 5-5.7 GHz with 100 points to reduce the number of computational iterations.
The design of the measurement system must be feasible and applicable in the real
world environment. The design has to be modified to maximize the accuracy of the re-
sult. Computational simulations will cut down the cost and time of fabricating different
experimental cavity designs. The percentage of water is represented by using a circular
section of the pipe.
3.6.1 Simulation using different level of water
The level of water was calculated using the Equation 3.1. Figure 3.7 shows the
partially filled horizontal cylinder divided into sectors for calculations. The calculated
level of water in different percentages is shown in table 1. The water level obtained
is then used to define the different water level in the simulations. Figure 3.8 and 3.9
represent 60% of water in the pipe.
Figure 3.7. Partially filled horizontal cylinder
61

AL = πr2− r2cos−1(
r−hr
)+(r−h)
√r2−h2 (3.1)
Where AL is the area of the liquid, r is the radius of pipe and h is the distance from
the top of the pipe to the surface of the liquid.
Table 3.3. Height of water in different percentage of water.
Percentage of water (%) Height (mm)0 020 13.8540 17.6960 24.3180 31.33
100 42.00
Figure 3.8. Schematic diagram of 60% of water in the pipe (front view).
It is important the simulation is carried out to verify the results due to the complexity
and high order of resonant modes occuring inside the electromagnetic wave cavity sensor.
By utilizing this technology, we will be able to understand what is happening inside the
resonant cavity while the microwave resonate inside the cavity. Also, the result will help
to verify the accuracy of the sensor compare to the expeimental results.
62

Figure 3.9. Schematic diagram of 60% of water in the pipe (3D view).
63

3.7 Two phase flow experimental and real time measurement
The sensor prototype set up is shown in Figures 3.10 and 3.11. An experimental test
rig has been constructed and water is pumped through the pipe. The clear pipe before and
after the cavity allows the water level to be measured using a transparent ruler, and the
water volume fraction to be determined. The flow rate of the water is controlled using the
controller built in the pump.
Figure 3.10. Two phase flow experimental setup
Figure 3.11. Two phase flow experiment setup (Full View)
This prototype uses the R&S Network Analyzer (ZVL 9 kHz -13.6 GHz), and it
64

consists of the Microwave Cavity System, Online Data processing computer (laptop com-
puter), the loop antenna (transmitting and receiving antenna), and a PVC pipe. The fre-
quency range is set from 5 GHz to 5.7 GHz with a 17kHz resolution (4000 points over
700 MHz of frequency). It captured the data during testing of the prototype sensor, when
the percentage volume of water-gas mixtures was increased from 0-100% in the pipeline,
in steps of 20%.
To visualize the flow before entering, and after coming out of the cavity sensor,
acrylic pipe was connected to both ends of the PVC pipe. The diameter of the pipe was
50mm. The whole setup for the flow measurements consisted of the water tank, cavity
sensor, PVC pipe, acrylic pipe, air pump, flow meter and a pump. The setup is shown
in figure 3.12. The water flow rate and air flow rate is set to produce stratified, wavy,
elongated and homogeneous flow. Then, the sensor is put in place to measure/detect the
flow regime.
Figure 3.12. Schematic diagram of the two-phase flow experiment setup.
The flow experiment is carried out by first filling the water tank with 70% of water.
The water pump is then switched on and the desired flow rate is adjusted by referring to
65

the flow meter. After that, the air compressor is turned on. The air valve opens slowly to
introduce air to the system. The air flow rate is adjusted to the desired flow rate and is
selected by referring to the air flow meter. When the water air mixture is returned to the
tank, the air escapes to the environment and the water is recirculated back to the system.
66

3.8 Rectangular sensor cavity system
As we know any change in the material’s concentration, percentage, type, etc. will
change its permittivity that causes the change in the microwave response when the mate-
rial interacts with it. By measuring this response over the range of discrete frequencies the
material can be characterised. Water, for example, has relatively high permittivity. Hence,
a small change in water fraction may result in comparatively large frequency shift. This
can be detected using a cylindrical cavity operating at 5-5.7 GHz frequency. On the other
hand, a non-polar material such as oil or gas also has low permittivity. This tiny change in
the permittivity is hardly detected by the cylindrical cavity sensor. To address this prob-
lem, a newly designed rectangular cavity sensor is added to the system to pick up the tiny
shifts in the permittivity as shown in Figure 3.13. It is a complement to the cylindrical
cavity’s function.
Figure 3.13. Rectangular sensor cavity design.
The experimental detection of oil-gas was tested using a 50mm diameter PVC pipe
in a rectangular cavity sensor, and conducted using 20% fraction increment of oil from
67

0% to 100% of oil. For better understanding of the different fraction of oil-air, the samples
analyzed for the percentage of the volume fraction between oil and air is shown in Table
3.4. The experiment for the monitoring and analysis of the volume fractions was repeated
three times and the average value was calculated.
Table 3.4. List of two phase system of oil-air tested for the monitoring and analysisof the volume fractions
Sample type Volume fraction (%) Temperature (°C)Oil Fraction Air fraction
Oil-air (two phase) 0 100 2020 80 2040 60 2060 40 2080 20 20
100 0 20
An interesting phenomenon was observed during the experiment of oil-air liquid
fraction. The little changes in the permeability can be detected using the rectangular
cavity. An experiment was carried out to detect the temperature changes using 100%
water fully filled pipe. The pipe was filled using 100◦C water and the heat in the water was
dissipated to the environment via conduction and convection while the data was taken.
The data was recorded for every drop of 5◦C. For better understanding of the different
temperature of water-air analysis, the samples analyzed for the temperature of the fully
filled pipe with water are shown in Table 3.5. A temperature probe was inserted inside
the pipe away from the cavity to measure the water temperature. The experiment was
repeated three times and the average temperature was calculated.
Error is a measure of the reliability and the accuracy of the data obtained in an
experiment. It is vital to be able to calculate and estimate the experimental error. For
this research work, the margin of error for this experiment should be less than 5-10% as
mentioned in the literature review.
68

Table 3.5. List of temperature of fully filled pipe for the temperature detection
Sample type Volume fraction (%) Temperature (°C)Water Fraction Air fraction
Water-air 100 0 40100 0 45100 0 50100 0 55100 0 60100 0 65100 0 70100 0 75100 0 80100 0 85
69

3.9 Summary
The present invention relates to a multiphase flow metering system, a microwave
transmitting and receiving antenna and an associated method for measuring the relative
fluid fraction and temperature of fluid mixture passing through a pipe. The present re-
search work utilizes a non-intrusive microwave sensor detection method to determine the
fluid fraction and temperature of two phase flow inside a pipe.
The permittivity (or dielectric constant) in the fluid mixture passing through the pipe
causes shifts in the frequencies and amplitude, which can be measured using a receiving
loop antenna to detect the changes in the permittivity. The changes in the permitivity can
be the different phases or the changes between the volume fractions of the fluid mixture.
In this research, the electromagnetic sensor cylindrical cavity system is used to an-
alyze various fractions of water-air mixture. The results were compared to check for
consistency for both the case of static and dynamic flow. The statistical analysis of the
captured data is observed and modelled using mathematical interpretation to relate the re-
lationship between the amplitude data with the changes in the water-air fractions. Then, a
temperature independent study is carried out to check for the effect of temperature mea-
suring fluid. The system will also be tested for stratified, wavy, elongated bubbles and
homogeneous flow regimes detection.
While the cylindrical cavity sensor is used to be detect the water level independent
to the temperature change. The electromagnetic rectangular cavity sensor system is de-
veloped to pick up the tiny shifts in the permittivity when the low permittivity material
is used or temperature changes. The microwave sensor system is also tested for water-air
fraction, water-oil fraction, oil-air fraction and water temperature detection.
70

CHAPTER 4: RESULTS AND DISCUSSION
4.1 Introduction
This chapter details results and discussion obtained from experiments and simula-
tions. The response of the frequency to the changes of fluid fraction is identified and
shown in this section. To validate the results of the cylindrical cavity sensor, Comsol
simulation is carried out to verify the results. A temperature independent study is also
conducted to study the effect of fluid temperature to the sensors. Then, an experiment
test rig is set up to study the detection of different flow regimes. It is concluded that the
system is able to identify different flow regimes. The problem of detecting low permit-
tivity arises when the detection of oil and gas fraction is carried out. A novel solution
of incorporating a rectangular cavity to the system is used to pick up the tiny shift of the
frequency. Selected cases will be chosen for comparison between static and stratified flow
for validation purposes.
4.2 Microwave spectrum analysis of the results
Figure 4.1 shows the comparison of water-air fractions as in Table 3.1 and discussed
in the previous section. The highlighted area in the figure demonstrate a shift in the
frequency and change in the amplitude (peak of the curve) of samples when the ratio
of the volume fraction of air decreases from 100-0% and water increase from 0-100%.
Analysis of Figure 4.1 shows that:
• The frequency of the microwave response curve decreases and shifts to the left
from 5.496 GHz to 5.470 GHz as the increase in the water fraction takes place
in five steps of 20% each. It equates to a total shift of approximately 25.5 MHz.
Keeping into consideration the sensitivity of the technique, the shift is significant.
• In addition to the frequency shift, a significant change in the amplitude was also
71

Figure 4.1. S21 (dB) measurements of the frequency response of water-air fractionsusing microwaves at 5-5.7 GHz
observed as in Figure 4.1. The amplitude decreases as the percentage of the water
increase and air decreases. The overall decrease in the amplitude from 100% air to
100% water is approximately -11.2789 dB.
• Collectively it is demonstrated that both the shift in the frequency and change in the
amplitude can be used to distinguish the increase/decrease in the volume fractions
of water and gas in two phase flows.
• The results of the frequency shift and amplitude follow a specific pattern throughout
the measurements showing the consistency of the microwave measurement tech-
nique.
A second set of measurements was carried out to monitor the change in the volume
fraction of water-oil. The fractions of two phase fluid of water-oil analyzed are shown
in Table 1. The similar sample design was used whereby the measurements started with
100% of oil and 0% of water in the pipe. The ratio was then changed in 20% step changes
with decreases in the oil and increases in the water up to the point where the whole pipe
72
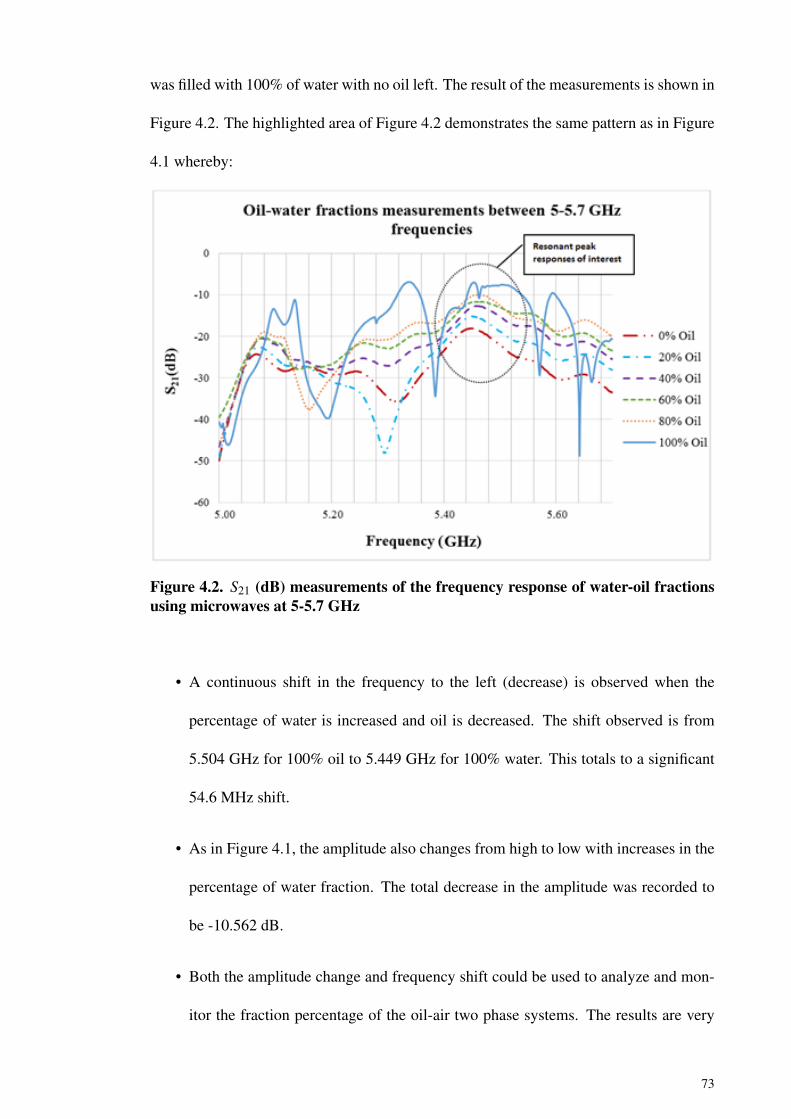
was filled with 100% of water with no oil left. The result of the measurements is shown in
Figure 4.2. The highlighted area of Figure 4.2 demonstrates the same pattern as in Figure
4.1 whereby:
Figure 4.2. S21 (dB) measurements of the frequency response of water-oil fractionsusing microwaves at 5-5.7 GHz
• A continuous shift in the frequency to the left (decrease) is observed when the
percentage of water is increased and oil is decreased. The shift observed is from
5.504 GHz for 100% oil to 5.449 GHz for 100% water. This totals to a significant
54.6 MHz shift.
• As in Figure 4.1, the amplitude also changes from high to low with increases in the
percentage of water fraction. The total decrease in the amplitude was recorded to
be -10.562 dB.
• Both the amplitude change and frequency shift could be used to analyze and mon-
itor the fraction percentage of the oil-air two phase systems. The results are very
73

consistent in terms of changes in both the frequency and amplitude. The measure-
ments were also repeated 5 times to check the accuracy and repeat-ability of the
results.
It was also important to analyze the changes between each of the 20% fraction
change of both water-air and water-oil flows. The frequency shift and amplitude change
profile was plotted for each of the water-air and water-oil fractions and is shown in Fig-
ure 4.2. The results of the frequency plot in Figure 4.3 show that there is a measureable
frequency shift for each of the fraction percent changes. The frequency decreases when
the water fraction increases to 100% in both water-air and water-oil two phase flows.
Figure 4.3. Graph of the frequency shift for each of the water-air and water-oilvolume fractions change
A common phenomenon was a shift to the right with a decrease in the water percent-
age in the fractions. This showed a decrease in the dielectric properties of the mix. There
was a prominent change in the amplitude in the case of both the water-air and water-oil
fractions. From the results, reduction in the amplitude can be linked to the increase in the
74

water fraction percentage in proportion to both the air and oil. Since, water is “lossy” in
nature, the experimental results obtained supported this theoretical fact.
Figure 4.4 shows the COMSOL simulation 3D view of the electric field inside the
cylindrical cavity for 0% of water (filled with air) for illustration purposes.
Figure 4.4. Electrical field intensity inside the cylindrical cavity.
Figure 4.5 shows the comparison between the experimental and simulation results.
Only water-air fraction was simulated in this research to illustrate the accuracy of exper-
imental analysis in comparison to the simulated results. The resonant frequency of each
percentage of water from the experimental results was obtained and compared with the
simulated results. Both the results show a drop in frequency when the percentage of water
increases. The average error between the experiment and simulation result is 13MHz. It
can be observed that the noticeable errors were 0% and 100% of water inside the pipe, the
error were 34MHz and 17MHz respectively. It is due to tiny amount of water present or
the pipe was not completely dry for 0% of water. For the 100% water, it is cause by tiny
air bubbles trapped inside the pipe when it is fully filled. Overall, both of the experiment
and simulation results shows similar trend.
75

Figure 4.5. Comparison of resonant frequency between experimental and simulationresults
76

4.3 Statistical analysis of repeatability and amplitude change
To address the repeatability, experimental measurements of both the water-air and
water-oil fractions were repeated five times at different times. The data was then used to
calculate the average amplitude and standard deviation as shown in Figure 4.6. The major
errors are observed at 0% of water for water-oil and 100% of water for water-air. These
errors may due to the air bubbles that may be trapped inside the oil or water when fully
filled.
Figure 4.6. Average amplitude for each percentage of water with standard deviationerror bars.
It can also be observed that a slightly higher error was noticed at 0% and 100% water
fraction in the mix. This could be attributed to the instrumentation and measurement error.
However, most of the response of microwaves to the material (mix) was consistent. The
accuracy presented in the measurement technique shows that it can be further developed
for industrial scale analysis.
The output from the microwave responses in section 4.2 shows that the amplitudes
77

obtained can be modeled accurately using a linear equation and could be presented as
a function of change in the water fraction percentage. Figure 4.7 shows the linear rela-
tionship of the amplitude change to the fraction change of water in two phase system. It
can be observed that the microwave signal amplitude decreases proportionally with the
increase in the percentage of water. The plotted data shows a linear relationship between
the volume fraction of water and amplitude of microwave signal captured.
Figure 4.7. Relationship between the change in the volume fraction of water andamplitude in two phase systems
A linear fit of the response of the microwave interaction with the water-air and water-
oil fractions showed that each of the 20% change in the water fractions can be modelled
accurately and predicted if required. This could be helpful in the further development of
the sensor system and intelligent analysis software tool to predict and detect in real-time
various types of two phase water-air and water-oil fractions.
78

4.4 Static Experiment
Figure 4.8 shows the S21 spectra in the range 5GHz to 5.7GHz as the percentage
volume of water in the pipeline increased from 0-100%. This frequency, specifically
around 5.5GHz, was identified as suitable for further investigation due to its steady change
with water fraction and its insensitivity to temperature. The total frequency shift for this
peak, between 0% water to 100% water in the pipeline, is 300 MHz. It can be observed
that the maximum amplitude for each of the percentages drops steadily from 0% to 100%
and shifts to the left. The resonant frequencies in this range means that the maximum
amplitude can be accurately modelled using a linear equation which is a function of the
water fraction.
Figure 4.8. Graph of S21 (dB) versus frequency for different percentage of water.
Figure 4.9, shows how the detected microwave amplitude decreases proportionally
with the increase in the percentage of water. The maximum error calculated from the
equation to the data acquired is less than 5%.
Figure 4.10 shows the system front panel using Labview software. This research
software application was designed to enable the system to display and save the data in
79

Figure 4.9. Graph of Percentage of water versus S21 (dB)
real time. The system was connected and tested in real time.
Figure 4.10. Online front panel reading for different percentage of water.
80

4.5 Temperature effect study
Another analysis was on a water filled pipe to monitor if the change in temperature
affects the microwave response curves. This was to monitor the temperature dependence
of the microwave measurement technique. The results of the captured data corresponding
to the temperature of water were listed in Table 4.1.
Table 4.1. Analysis of the water sample to monitor the change in temperature andits impact on the microwave response frequency/amplitude
Sample type Volume fraction(%) Temperature (◦C)Water sample 100 28
100 30100 41100 49100 58100 68100 74100 83
Figure 4.11 shows the frequency and amplitude of 100% water in the pipe with dif-
ferent temperatures. It shows that no frequency shift is observed down to the temperature
of 28◦C. The temperature of the water was varied between 83◦C and 28◦C and this has
negligible effect on the accuracy of the system, despite the permittivity of water changing
with the temperature. The reason behind the phenomenon is the different overlapping
modes negating the affect.
Furthermore, the results were promising with no shift in the resonant peak observed
with temperature decrease. This potentially shows the independence of the microwave
measurement technique despite the changing permittivity of water when heated. It is im-
portant in terms of the industrial applications because the measurements could be carried
out in real-time without the two phase mix dependence on the important factors such as
temperature. This however needs to be verified for smaller changes in the temperature
through a temperature controlled data recording tool. The temperature dependence also
need to be verified for the three phase systems and more complex percentages of mix.
81
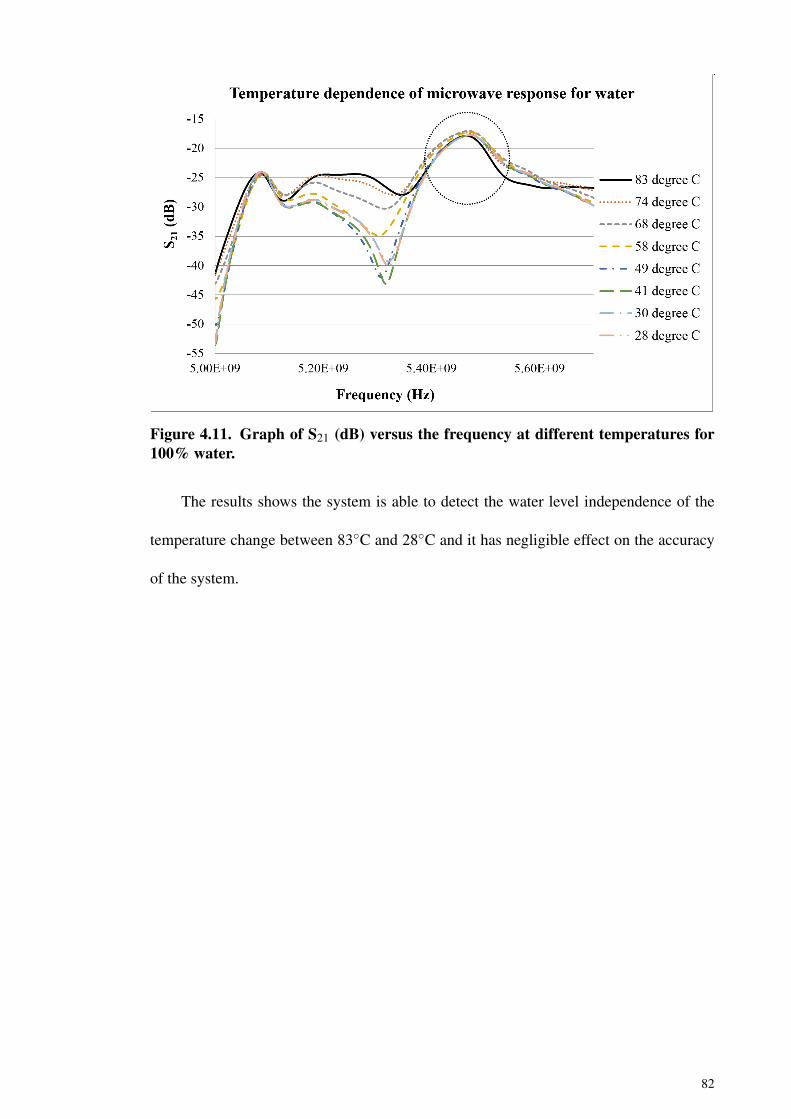
Figure 4.11. Graph of S21 (dB) versus the frequency at different temperatures for100% water.
The results shows the system is able to detect the water level independence of the
temperature change between 83◦C and 28◦C and it has negligible effect on the accuracy
of the system.
82

4.6 Two Phase flow Experiment
Figures 4.12 and 4.13 represent experiments for 20% and 80% of water respectively.
The system captures the data and display it using Labview software. The system was
automated, using National Instrumentation (NI) devices by monitoring the maximum am-
plitude shift. Due to the flowing water, it is difficult to measure the percentage or volume
of water in the pipe precisely. Parallax error may also contribute to the measurement. The
error in the flowing water was slightly higher than 5% in this experiment.
Figure 4.12. Experimental of 20% of water flowing in the pipe.
83

Figure 4.13. Experimental of 80% of water flowing in the pipe.
84

Figure 4.14 shows how the mode peaks changed as the percentage volume of water
in the pipeline increased from 0-100%. The peak decreased by about 2.2 dB as the per-
centage of water increased by 20%. These phenomena can be represented using a linear
equation.
Figure 4.14. Graph of S21 (dB) versus frequency for different percentage of flowingwater.
85

Figure 4.15 shows the peak value of each percentage of static and flowing water in
the pipe. The movement of water does not affect the spectrum. Both static and flowing
water produce almost the same result. It can be concluded that, the electromagnetic wave
cavity sensor used in the experiment in this research has successfully detected the water
fraction (stratified flow) inside the pipe in real time.
Figure 4.15. Graph of Percentage of water versus power (dB).
The results show the system is able to detect both static and dynamic flow of two
phase flow. The movement of water does not affect the sensor detection and analysis of
the result. It can be concluded that, the electromagnetic wave cavity sensor used in the
experiment in this research has successfully detected in real time the two phase stratified
flow inside the pipe.
86

4.7 Wavy and elongated bubbles flow measurement and detection
Figure 4.16 shows the snapshot of the wavy flow during the experiment. The flow
rate of water was set to 8 L/min whereas the air input was set at 1.4 Nm3/hr. The con-
tinuous wave was observed as a result traveling along the pipe. Figure 4.17 shows the
maximum and minimum level of water flowing inside the pipe over time. The amplitude
oscillation is observed to be approximately 50-55% indicating the wavy flow.
Figure 4.16. Snapshot of the wavy flow.
Figure 4.17. Graph of the percentage of water versus time for the wavy flow.
87

Similarly, figure 4.18 shows the snapshot of the elongated bubbles flow produced
during the experiment. The water flow rate was set to 18 L/min and the amount of air
was fixed at 1.5 Nm3/hr. As a result, continuous elongated bubbles flow was observed
traveling along the pipe. Figure 4.19 shows the maximum and minimum level of water
flowing through the pipe over the period of measurements. The amplitude oscillation was
significantly different in comparison to the wavy flow and was recorded approximately
between 50-100% indicating the elongated bubbles flow.
Figure 4.18. Snapshot of the elongated bubbles flow.
Figure 4.19. Graph of the percentage of water versus time for the elongated bubblesflow.
88

Overall, the combination of stratified, wavy and elongated bubbles flow results were
shown in figure 4.20. By analyzing the result of each flow characteristic, the data can be
used to identify what type of flow in real time. This method is quick and simple to be
utilized for laboratory and industry application. In order to process the data, software like
Labview, Matlab, C programming and etc. can be programmed to capture, process and
display the data in real time.
Figure 4.20. Combination of stratified, wavy and elongated flow result.
This study demonstrate the effectiveness of microwave sensing techniques in the
analysis of many types of flows including wavy and elongated bubbles flow. The results
show substantial evidence to demonstrate the suitability of using microwave sensors in
the analysis of wavy and elongated bubbles flow with different air input.
89

4.8 Homogeneous flow measurement and detection
In order to create a homogeneous flow, the test section was changed to vertical setup.
Figure 4.21 shows the homogeneous flow regime before entering the cavity sensor. The
water flow rate was set to 56 L/min and air input was varied between 0 ,approximate 0.2
Nm3/hr, 1 Nm3/hr and 2 Nm3/hr. The water and air flow meter were used in the exper-
iment. The difference in the air input affects the number and size of bubbles flowing
inside the pipe. Tiny bubbles can be observed at low air flow rate and vice versa. Figure
4.22 show the results of the microwave response to varying homogeneous flow types in-
side the pipe with changing air input. The measurements of S21 parameters (transmission
co-efficient) were taken between 5-5.7 GHz frequency range. It can be observed that the
microwave response peaks of the minimum points (highlighted in figure 4.22) shift to the
right when the air input increases. There is also a reduction in the amplitude with the in-
crease in the air input. The curves obtained can be processed further using sophisticated
analysis techniques such as neural network to determine air or water fraction in a two
phase system (Kntor & Plik, 2016; OConnor et al., 2012). In such a case, the shift in the
frequency as well as the minimum point obtained (amplitude value) can be potentially
used to estimate the rate of air input.
This study demonstrate the effectiveness of microwave sensing techniques in the
analysis of many types of flows including homogeneous flow. The results show substan-
tial evidence to demonstrate the suitability of using microwave sensors in the analysis of
Homogeneous flow with different air input.
90

Figure 4.21. Snapshot of the Homogeneous flow produced with different air input.
Figure 4.22. Graph of determination of the homogeneous flow type with varying airinput using microwave response parameter S21.
91
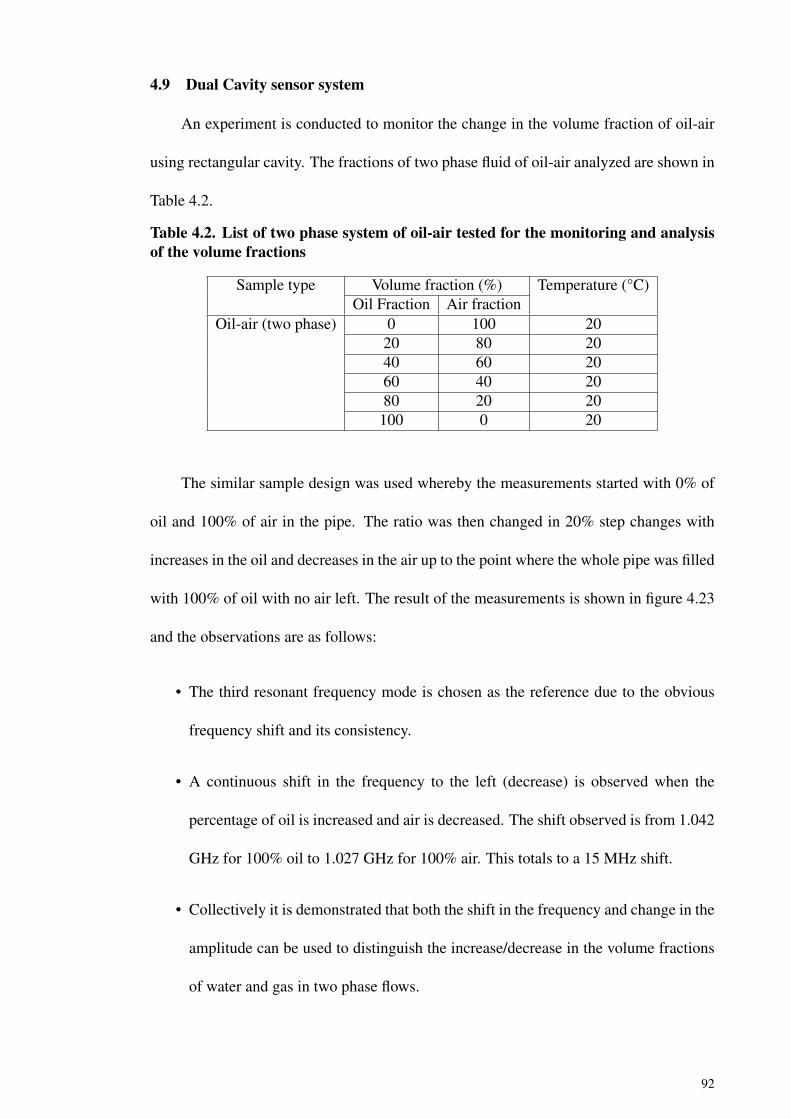
4.9 Dual Cavity sensor system
An experiment is conducted to monitor the change in the volume fraction of oil-air
using rectangular cavity. The fractions of two phase fluid of oil-air analyzed are shown in
Table 4.2.
Table 4.2. List of two phase system of oil-air tested for the monitoring and analysisof the volume fractions
Sample type Volume fraction (%) Temperature (°C)Oil Fraction Air fraction
Oil-air (two phase) 0 100 2020 80 2040 60 2060 40 2080 20 20
100 0 20
The similar sample design was used whereby the measurements started with 0% of
oil and 100% of air in the pipe. The ratio was then changed in 20% step changes with
increases in the oil and decreases in the air up to the point where the whole pipe was filled
with 100% of oil with no air left. The result of the measurements is shown in figure 4.23
and the observations are as follows:
• The third resonant frequency mode is chosen as the reference due to the obvious
frequency shift and its consistency.
• A continuous shift in the frequency to the left (decrease) is observed when the
percentage of oil is increased and air is decreased. The shift observed is from 1.042
GHz for 100% oil to 1.027 GHz for 100% air. This totals to a 15 MHz shift.
• Collectively it is demonstrated that both the shift in the frequency and change in the
amplitude can be used to distinguish the increase/decrease in the volume fractions
of water and gas in two phase flows.
92

Figure 4.23. Graph of S21 versus frequency for different percentage of oil.
• The frequency shift could be used to analyze and monitor the fraction percentage
of the oil-air two phase systems. The repeat-ability of the frequency is plotted in
Figure 4.24. The results were highly repeatable and very consistent in terms of
changes in the frequency.
• The frequency decreases consistently when the oil fraction increases from 0% to
100% in this case, it can be represented using a linear function.
Following the experiment of the low permittivity detection method. Another exper-
iment is conducted to investigate the temperature detection of water temperature using
a rectangular cavity. The results of the measurements is shown in Figure 4.25 and the
observations are as follows:
• The fourth resonant frequency mode is chosen as the reference due to the obvious
frequency shirt and its consistency.
• A continuous shift in the frequency to the left (decrease) is observed when the
93

Figure 4.24. Graph of frequency shift versus oil fraction increment.
Figure 4.25. Graph of S21 versus frequency for different temperature.
temperature is decreased. The shift observed is from 1.209 GHz for 85◦C to 1.197
GHz for 40◦C. This totals to a 12 MHz shift.
• The frequency shift could be used to detect and monitor the temperature of the
94

water in the systems. The repeat-ability of the frequency is plotted in Figure 4.26.
The results were fairly repeatable and consistent as shown in table 4.3. The average
standard deviation of the data is 0.965 MHz which is relatively low.
Figure 4.26. Graph of frequency shift versus temperature change.
Table 4.3. Average frequency and standard deviation for each temperature
Temperature (◦C) Average (GHz) Standard Deviation (MHz)85 1.211 1.63880 1.21 1.35975 1.208 1.31370 1.205 1.23165 1.205 0.51460 1.203 0.47155 1.202 0.47150 1.2 1.31345 1.199 0.58940 1.198 0.408
• The frequency increases consistently when the temperature increases from 40◦C to
85◦C in this case, it can be represented using a linear function.
The electromagnetic wave cylindrical cavity sensor demonstrated the ability to de-
tect the high permitivity change, for instance the changes in water level. The electro-
95

magnetic wave rectangular cavity sensor system is introduced to pick up the tiny shifts in
the permittivity when the low permittivity material is used or temperature changes. The
microwave sensor system is able to detect water-air fraction, water-oil fraction, oil-air
fraction and water temperature.
96

4.10 Summary
The electromagnetic waves ranging from 5GHz up to 5.7GHz for cylindrical cavity
sensor and 1GHz to 1.25GHz for rectangular cavity have been used to analyze the two
phase fluid fraction in a pipeline. Labview software is utilized to capture and process the
data, and display the results in real time. The temperature independent study have been
carried out and shown not to affect the accuracy of the system, despite the permittivity of
the water changing. This is assumed to be due to the different overlapping modes negating
the affect. While the cylindrical cavity sensor is used to detect the water level independent
to the temperature change. The rectangular cavity sensor is responsible for picking up the
tiny shifts in the permittivity when the temperature change or low permittivity material is
used. The microwave sensor system is able to detect water-air fraction, water-oil fraction,
oil-air fraction and water temperature.
Overall, the novel solution of the combination of both cylindrical and rectangular
sensor systems demonstrates the ability to detect both high and low permittivity changes.
These dual-cavity sensor cavity systems have been able to detect water level, flow regime
and temperature in the pipe. This research demonstrates the suitability of using mi-
crowave sensors in the analysis of two phase systems. It also demonstrate that microwave
sensors based on the principle of changing permittivity can replace conventional mea-
surement techniques.
97

CHAPTER 5: CONCLUSION AND FUTURE WORK
5.1 Conclusion
An electromagnetic sensor cavity have been developed to detect multiphase flow
in this research. It is shown that the cylindrical cavity with the electromagnetic waves
ranging from 5 GHz to 5.7 GHz was able to detect two phase stratified flow systems of
water, air-water and oil-water in a pipeline. The change in the permittivity of the fluids
was used to differentiate between the changing volume fractions of water, oil and gas.
In order to analysis and interpret the data efficiently, an innovative approach is intro-
duced by modelling all the data collected using an mathematical interpretation. Labview
software was selected to capture and analyze the data for real time monitoring. Instead
of storing all the data, the new approach identified the interested points and represented
them using a mathematical equation. The new approach uses shorter time, less computa-
tional power and substantially reduces the error of comparing the stored data and newly
obtained data.
The sensor also successfully demonstrated its capability to analyze various fractions
of gas-water mix. The results were consistent in the case of both the static and dynamic
flow. The statistical analysis of the captured data showed a linear relationship of the
amplitude data with the change in the water fractions. It was also found that the technique
was independent of the temperature change. The change in the temperature didn’t affect
the accuracy of the system despite the permittivity of the water changing. The system
was able to successfully detect the stratified, wavy, elongated bubbles and homogeneous
flow regimes. Based on the results obtained it is recommended that the microwave based
sensors have a potential to accurately determine various parameters in the case of flow
regime measurements. The sensor and the technique can be developed further as a stable
and reliable option for the industry.
98

While the cylindrical cavity sensor is used to be detect the water level independent of
the temperature change the rectangular cavity sensor is introduce to pick up the tiny shifts
in the permittivity when the temperature change or low permittivity material is used. The
microwave sensor system is able to detect water-air fraction, water-oil fraction, oil-air
fraction and water temperature.
Overall, the novel solution of combination of both cylindrical and rectangular sensor
systems demonstrates the ability to detect both high and low permittivity changes. These
dual-cavity sensor cavities as shown in figure 5.1 have been able to detect water level,
flow regime and temperature in the pipe. This research demonstrate the suitability of us-
ing microwave sensors in the analysis of two phase systems. It also demonstrates that
microwave sensors based on the principle of changing permittivity can replace conven-
tional measurement techniques.
Figure 5.1. Dual microwave sensor cavity system.
99

5.1.1 Objective achieved
The aims of the present research work conducted were based on the objective pro-
posed. A total of five objectives have been devised for this research work. Based on the
results and analysis from the data collected, the following conclusion have been made.
• The sensor is successfully tested in static and stratified condition (water-air and
water-oil) and the results obtained is almost identical, the flowing fluid does not
affect the two phase detection.
• The effect of temperature on the above measurements were limited, it is found
that the temperature does not effect the peak of the amplitude and frequency at
5-5.7GHz especially for 100% water inside the pipe.
• An experimental test rig is constructed for continuous two phase flow detection, is
is concluded that the sensor is able to detect different flow regimes.
• Comsol simulations is conducted to compare the experimental and simulations re-
sults, both the experimental and simulations results exhibit the same trend and the
errors were within acceptable range.
• An novel approach by introducing a rectangular sensor for low permitivity detection
is carried out and experimented. The sensor was tested under stratified condition
(oil-air) and the system was able to detect low permitivity change. Further testing
shows the system can also be use to detect the water temperature in real time.
Finally, all the objectives proposed have been achieved, however, more experiments
are needed to carry out in the future for improvement and commercialize purposes.
100

5.2 Recommendation
The current study only focuses on the laboratory scale of experimental set up. Fur-
ther study using industrial standards is recommended. The dual microwave cavity sensor
demonstrated the ability to detect both high permitivity change and tiny shifts in the per-
mittivity when the temperature change or low permittivity material is used. It is recom-
mended that the system is tested for industrial applications. Although the scale will affect
the frequency range, the cavities can be redesigned to suit the industrial piping standard.
Microwave cavity sensor method is also recommended for commercial application for
two phase flow detection. It is a viable detection technique given its superiority in terms
of cost, simplicity and real time analysis compared to the conventional approach.
Further research is required to establish the validity that dual microwave cavity sen-
sors are robust and highly suitable for industrial application. It is also recommended to
compare this with the existing flow meter in industrial scale to demonstrate that the in-
vention is superior to the conventional flow meter as this will impact on the demand and
marketability of this product.
One of the major problems faced by today’s water treatment industry is how to de-
tect low concentrations of nutrients in real time before discharge to the environment.
This technology is vital for the industry to avoid environmental pollution and hefty fine.
Present research is highly applicable to solve the problem in water treatment industry; the
system is capable of detecting low and high permittivity change. The treated water can
run continuous through the pipe and the detection can be carried out in real time and no
human intervention is required. Further study using dual microwave cavity sensor in this
area is highly recommended.
101
5.3 Future work
On the basis of this experimental study, future work is recommended to fulfill the
industrial requirements. Hence, it is recommended that:
• A detailed temperature study of both the two phase and three phase systems is re-
quired. This is to evidence the temperature dependence of the technique as well
as to verify the claim made in this research work. This can also include fractions
in various uneven percentages to replicate the real-world conditions where the per-
centages of the water-air-oil can vary in the mix.
• An intelligent software system is recommended to be built in the future study. The
database would capture all the spectra to match the measurements in later stage and
to verify the accuracy, repeatability and versatility of the sensing system.
• A standard operation procedure is to be proposed to address the limitations in the
current study in terms of measurements and to remove any anomalies and errors in
the measurements. For instance, wet gas is easily found in oil and gas production,
the system should be calibrated to detect both the wet and dry gas.
• It is also important to relate more complex properties of the two or three phase
fractions to the spectra obtained. Three phase flow experimental set up should be
used to analyze the accuracy of present Dual Microwave cavity sensor.
102

REFERENCES
Abbagoni, B. M., & Yeung, H. (2016). Non-invasive classification of gas–liquid two-phase horizontal flow regimes using an ultrasonic doppler sensor and a neural net-work. Measurement Science and Technology, 27(8), 084002.
Abdou, A., Shaw, A., Cullen, J., Wylie, S., Mason, A., & Al-Shamma, A. (2011). A reviewof underwater em wave propagation to investigate the development of a throughwater wsn. 6th built environment and natural environment. LJMU.
Abdou, A., Shaw, A., Mason, A., Al-Shamma’a, A., Cullen, J., & Wylie, S. (2011). Elec-tromagnetic (em) wave propagation for the development of an underwater wirelesssensor network (wsn). In Sensors, 2011 ieee (pp. 1571–1574).
Abdou, A., Shaw, A., Mason, A., Al-Shamma’a, A., Cullen, J., Wylie, S., & Diallo, M.(2013). A matched bow-tie antenna at 433mhz for use in underwater wireless sensornetworks. In Journal of physics: Conference series (Vol. 450, p. 012048).
Abdou, A., Shaw, A., Mason, A., Wylie, S., & Cullen, J. (2012). Antennas experiment,design and simulation for underwater em wave propagation at ism frequency bands.Built Environment and Natural Environment, 1–6.
Adous, M., Qufflec, P., & Laguerre, L. (2006). Coaxial/cylindrical transition line forbroadband permittivity measurement of civil engineering materials. MeasurementScience and Technology, 17(8), 2241. Retrieved from http://stacks.iop.org/0957-0233/17/i=8/a=026
Agar, J. (1992, March 31). Oil/water measurement. Google Patents. (US Patent5,101,163)
Al-Dasoqi, N. (2012). The development of an online real time sensor for determiningnutrient concentration level in wastewater (Unpublished doctoral dissertation). Liv-erpool John Moores University.
Al-Dasoqi, N., Mason, A., Alkhaddar, R., Shaw, A., & Al-Shamma’a, A. (2011). Real-time non-destructive microwave sensor for nutrient monitoring in wastewater treat-ment. Journal of Physics: Conference Series, 307(1), 012043. Retrieved fromhttp://stacks.iop.org/1742-6596/307/i=1/a=012043
Al-Hajeri, S., Wylie, S., Shaw, A., & Al-Shamma’a, A. (2009). Real time em wavesmonitoring system for oil industry three phase flow measurement. In Journal ofphysics: Conference series (Vol. 178, p. 012030).
Alhajeri, S. H. H. (2010). Online electromagnetic wave monitoring system for petroleumindustry applications (Unpublished doctoral dissertation). Liverpool John MooresUniversity.
Ali, A., Hu, B., & Ramahi, O. (2015). Intelligent detection of cracks in metallic surfacesusing a waveguide sensor loaded with metamaterial elements. Sensors, 15(5), 11402.Retrieved from http://www.mdpi.com/1424-8220/15/5/11402 doi: 10.3390/
103

s150511402
Al-Kizwini, M., Wylie, S., Al-Khafaji, D., & Al-Shammaa, A. (2013). The monitoringof the two phase flow-annular flow type regime using microwave sensor technique.Measurement, 46(1), 45–51.
Amdal, J., Danielsen, H., Dykesteen, E., Flolo, D., Grendstad, J., Hide, H., . . . Torkildsen,B. (1995). Handbook of multiphase metering. The Norwegian Society for Oil andGas Measurement, Oslo, Norway.
Amdal, J., Danielsen, H., Dykesteen, E., Flolo, D., Grendstal, J., Hide, H., . . . Torkildsen,B. (n.d.). Handbook of multiphase metering, 2004.
Arora, R. (2009). Production well testing using non-radioactive multiphase flow meters.Exploration & Production, 7(1), 86–89.
Arvoh, B. K., Hoffmann, R., & Halstensen, M. (2012). Estimation of volume fractionsand flow regime identification in multiphase flow based on gamma measurementsand multivariate calibration. Flow Measurement and Instrumentation, 23(1), 56–65.
Ashton, S., Cutmore, N., Roach, G., Watt, J., Zastawny, H., McEwan, A., et al. (1994).Development and trial of microwave techniques for measurement of multiphase flowof oil, water and gas. In Spe asia pacific oil and gas conference.
Ateeq, M., Senouci, A., Al-Nageim, H., & Al-Shammaa, A. (2012). Microwave spec-troscopy for the analysis of absorption properties of treated waste rubber aggregates.Journal of Hazardous, Toxic, and Radioactive Waste, 16(4), 334–342.
Ateeq, M., Wylie, S., Al-Shammaa, A., & Al-Nageim, H. (2012). Microwave spec-troscopy: a potential technique to analyse bitumen dielectric and physical properties.Measurement Science and Technology, 23(8), 085503.
Bababjanyan, A., Melikyan, H., Kim, S., Kim, J., K, Lee, & Friedman, B. (2010). Real-time noninvasive measurement of glucose concentration using a microwave biosen-sor. Journal of Sensors, 2010, 7. Retrieved from http://www.sciencedirect.com/science/article/pii/S0924424716302151 doi: http://dx.doi:10.1155/2010/452163
Basrawi, Y. F., et al. (1999). Crude and hydrocarbon measurement technologies. In Speannual technical conference and exhibition.
Bjarnadottir, S., Lunde, K., Alvseike, O., Mason, A., & Al-Shamma’a, A. (2015). As-sessing quality parameters in dry-cured ham using microwave spectroscopy. Meatscience, 108, 109–114.
Blakey, R., Korostynska, O., Mason, A., & Al-Shammaa, A. (2012). Real-time mi-crowave based sensing method for vegetable oil type verification. Procedia Engi-neering, 47, 623–626.
Blakey, R., Nakouti, I., Korostynska, O., Mason, A., & Al-Shamma’a, A. (2013, Dec).
104
Real-time monitoring of pseudomonas aeruginosa concentration using a novel elec-tromagnetic sensors microfluidic cell structure. IEEE Transactions on BiomedicalEngineering, 60(12), 3291-3297. doi: 10.1109/TBME.2013.2268277
Brodwin, M., & Benway, J. (1980). Experimental evaluation of a microwave transmissionmoisture sensor. J. Microwave Power, 15(4), 267–276.
Castro-Giráldez, M., Aristoy, M.-C., Toldrá, F., & Fito, P. (2010). Microwave dielectricspectroscopy for the determination of pork meat quality. Food research interna-tional, 43(10), 2369–2377.
Castro-Giráldez, M., Botella, P., Toldrá, F., & Fito, P. (2010). Low-frequency dielectricspectrum to determine pork meat quality. Innovative Food Science & EmergingTechnologies, 11(2), 376–386.
Chen, D., Wang, X., Che, C., Cong, J., Xu, D., & Wang, X. (2010). A transient methodfor measuring the gas volume fraction in a mixed gas-liquid flow using acousticresonance spectroscopy. Science China Physics, Mechanics and Astronomy, 53(8),1412–1418.
Colline, R. E. (1992). Foundation for microwave engineering. McGraw Hill, New York.
Colpitts, B., Pelletier, Y., & Cogswell, S. (1992). Complex permittivity measurementsof the colorado potato beetle using coaxial probe techniques. Journal of MicrowavePower and Electromagnetic Energy, 27(3), 175–182.
Connor, F. R. (1972). Signals. Hodder Arnold.
Corneliussen, S., Couput, J., Dahl, E., Dykesteen, E., Frøysa, K., Malde, E., . . . Tunheim,H. (2005). Handbook of multiphase flow metering, revision 2. Oslo: NorwegianSociety for Oil and Gas Measurement (NFOGM) and The Norwegian Society ofChartered Technical and Scientific Professionals (Tekna).
Da Silva, M. J. (2008). Impedance sensors for fast multiphase flow measurement andimaging.
De Castro, M. S., Pereira, C. C., Dos Santos, J. N., & Rodriguez, O. M. (2012). Geo-metrical and kinematic properties of interfacial waves in stratified oil–water flow ininclined pipe. Experimental Thermal and Fluid Science, 37, 171–178.
Dei, D., Grazzini, G., Luzi, G., Pieraccini, M., Atzeni, C., Boncinelli, S., . . . Lo Dico,J. (2009). Non-contact detection of breathing using a microwave sensor. Sensors,9(4), 2574. Retrieved from http://www.mdpi.com/1424-8220/9/4/2574 doi:10.3390/s90402574
Dukler, A. E., & Hubbard, M. G. (1975). A model for gas-liquid slug flow in horizontaland near horizontal tubes. Industrial & Engineering Chemistry Fundamentals, 14(4),337–347.
Dykesteen, E., Hallanger, A., Hammer, E., Samnoy, E., & Thorn, R. (1985). Non-intrusive three-component ratio measurement using an impedance sensor. Journal of
105

Physics E: Scientific Instruments, 18(6), 540.
Evans, D. H., & McDicken, W. N. (2000). Doppler ultrasound: physics, instrumentationand signal processing. John Wiley & Sons.
Falcone, G., Hewitt, G., & Alimonti, C. (2009). Multiphase flow metering: principlesand applications (Vol. 54). Elsevier.
Figueiredo, M., Goncalves, J., Nakashima, A., Fileti, A., & Carvalho, R. (2016). The useof an ultrasonic technique and neural networks for identification of the flow patternand measurement of the gas volume fraction in multiphase flows. ExperimentalThermal and Fluid Science, 70, 29–50.
Fok, M., Bashir, M., Fraser, H., Strouther, N., & Mason, A. (2015). A novel microwavesensor to detect specific biomarkers in human cerebrospinal fluid and their relation-ship to cellular ischemia during thoracoabdominal aortic aneurysm repair. Jour-nal of Medical Systems, 39(4), 1–5. Retrieved from http://dx.doi.org/10.1007/s10916-015-0208-4 doi: 10.1007/s10916-015-0208-4
Fulladosa, E., Duran-Montg, P., Serra, X., Picouet, P., Schimmer, O., & Gou, P. (2013).Estimation of dry-cured ham composition using dielectric time domain reflectome-try. Meat Science, 93(4), 873 - 879. Retrieved from http://www.sciencedirect.com/science/article/pii/S030917401200410X doi: http://dx.doi.org/10.1016/j.meatsci.2012.12.002
Gaisford, G. S. (2001, February 6). Emulsion composition monitor. Google Patents. (USPatent 6,182,504)
Georgiadou, E., Panagopoulos, A., & Kanellopoulos, J. (2006). Millimeter wave pulsepropagation through distorted raindrops for los fixed wireless access channels. Jour-nal of Electromagnetic Waves and Applications, 20(9), 1235–1248.
Gokcal, B., Al-Sarkhi, A. S., Sarica, C., et al. (2009). Effects of high oil viscosity ondrift velocity for horizontal and upward inclined pipes. SPE Projects, Facilities &Construction, 4(02), 32–40.
Goncalves, J., Paiva, T., Abud, J., Carvalho, R., Venturini, O., et al. (2011). Developmentof a multiphase flow metering procedure based on the ultrasonic technique. In 15thinternational conference on multiphase production technology.
Hammer, E. A., & Johansen, G. A. (1997). Process tomography in the oil industrystateof the art and future possibilities. Measurement and Control, 30(7), 212–216.
Hapanowicz, J. (2008). Slip between the phases in two-phase water–oil flow in a hori-zontal pipe. International Journal of Multiphase Flow, 34(6), 559–566.
Hasted, J. B. (1973). Aqueous dielectrics. Chapman and Hall.
Hernandez, L., Julia, J., Chiva, S., Paranjape, S., & Ishii, M. (2006). Fast classification oftwo-phase flow regimes based on conductivity signals and artificial neural networks.Measurement Science and Technology, 17(6), 1511.
106
Hewitt, G. (1997a). Gas-liquid-liquid flow: A phase too far? In Bhr group conferenceseries publication (Vol. 24, pp. 215–240).
Hewitt, G. (1997b). Keynote speech:" gas-liquid-liquid flow: a phase too far. In Proceed-ings bhr conference multiphase (Vol. 97, pp. 215–239).
Höhne, T., & Mehlhoop, J.-P. (2014). Validation of closure models for interfacial dragand turbulence in numerical simulations of horizontal stratified gas–liquid flows.International Journal of Multiphase Flow, 62, 1–16.
Huh, D., Kuo, C., Grotberg, J., & Takayama, S. (2009). Gas–liquid two-phase flow pat-terns in rectangular polymeric microchannels: effect of surface wetting properties.New journal of physics, 11(7), 075034.
Ismail, I., Gamio, J., Bukhari, S. A., & Yang, W. (2005). Tomography for multi-phaseflow measurement in the oil industry. Flow Measurement and Instrumentation,16(2), 145–155.
Jain, A. K., Duin, R. P. W., & Mao, J. (2000). Statistical pattern recognition: A review.IEEE Transactions on pattern analysis and machine intelligence, 22(1), 4–37.
Kapilevich, B., & Litvak, B. (2007). Microwave sensor for accurate measurements ofwater solution concentrations. In 2007 asia-pacific microwave conference (pp. 1–4).
Kesana, N. R., Parsi, M., Vieira, R. E., Azzopardi, B., Schleicher, E., McLaury, B. S., . . .Hampel, U. (2017). Visualization of gas-liquid multiphase pseudo-slug flow usingwire-mesh sensor. Journal of Natural Gas Science and Engineering.
Klein, A. (1981). Microwave determination of moisture in coal. comparison of attenua-tion and phase measurement. Journal of Microwave Power, 16(3&4), 289–304.
Kolev, N. I. (2005). Multiphase flow dynamics: Fundamentals. Springer.
Korostynska, O., Mason, A., & Al-Shamma’a, A. (2014). Microwave sensors for the non-invasive monitoring of industrial and medical applications. Sensor Review, 34(2),182-191. Retrieved from http://dx.doi.org/10.1108/SR-11-2012-725 doi: 10.1108/SR-11-2012-725
Korostynska, O., Mason, A., & Al-Shammaa, A. I. (2013). Flexible microwave sensorsfor real-time analysis of water contaminants. Journal of Electromagnetic Waves andApplications, 27(16), 2075–2089.
Korostynska, O., Mason, A., Ortoneda-Pedrola, M., & Al-Shammaa, A. (2014). Electro-magnetic wave sensing of no 3 and cod concentrations for real-time environmentaland industrial monitoring. Sensors and Actuators B: Chemical, 198, 49–54.
Korostynska, O., Ortoneda-Pedrola, M., Mason, A., & Al-Shamma’a, A. I. (2014). Flexi-ble electromagnetic wave sensor operating at ghz frequencies for instantaneous con-centration measurements of nacl, kcl, mncl 2?and cucl solutions. MeasurementScience and Technology, 25(6), 065105. Retrieved from http://stacks.iop.org/
107

0957-0233/25/i=6/a=065105
Kouamé, D., Girault, J.-M., Remenieras, J.-P., Chemla, J.-P., & Lethiecq, M. (2003). Highresolution processing techniques for ultrasound doppler velocimetry in the presenceof colored noise. ii. multiplephase pipe-flow velocity measurement. IEEE transac-tions on ultrasonics, ferroelectrics, and frequency control, 50(3), 267–278.
Kntor, Z., & Plik, Z. (2016). Artificial neural network assisted compact inductive distancesensor. Procedia Engineering, 168(Supplement C), 23 - 26. Retrieved from http://www.sciencedirect.com/science/article/pii/S1877705816334300 (Proceed-ings of the 30th anniversary Eurosensors Conference Eurosensors 2016, 4-7. Sepem-ber 2016, Budapest, Hungary) doi: https://doi.org/10.1016/j.proeng.2016.11.121
Li, Y., Yang, W., Xie, C.-g., Huang, S., Wu, Z., Tsamakis, D., & Lenn, C. (2013).Gas/oil/water flow measurement by electrical capacitance tomography. Measure-ment Science and Technology, 24(7), 074001.
Lu, G., Yang, F., Tian, Y., Jing, X., & Wang, J. (2009). Contact-free measurement ofheart rate variability via a microwave sensor. Sensors, 9(12), 9572. Retrieved fromhttp://www.mdpi.com/1424-8220/9/12/9572 doi: 10.3390/s91209572
Mason, A., Abdullah, B., Muradov, M., Korostynska, O., Al-Shammaa, A., Bjarnadottir,S. G., . . . Alvseike, O. (2016). Theoretical basis and application for measuring porkloin drip loss using microwave spectroscopy. Sensors, 16(2), 182.
Mason, A., Korostynska, O., Ortoneda-Pedrola, M., Shaw, A., & Al-Shamma’a, A.(2013). A resonant co-planar sensor at microwave frequencies for biomedical appli-cations. Sensors and Actuators A: Physical, 202, 170 - 175. Retrieved from http://www.sciencedirect.com/science/article/pii/S0924424713001799 (SelectedPapers from the 26th European Conference on Solid-State Transducers Krakow,Poland, 9-12 September 2012) doi: http://dx.doi.org/10.1016/j.sna.2013.04.015
Mason, A., Korostynska, O., Wylie, S., & Al-Shamma’a, A. (2014). Non-destructiveevaluation of an activated carbon using microwaves to determine residual life. Car-bon, 67, 1 - 9. Retrieved from http://www.sciencedirect.com/science/article/pii/S0008622312005404 doi: http://dx.doi.org/10.1016/j.carbon.2012.06.034
Mason, A., Wylie, S., Korostynska, O., Cordova-Lopez, L., & Al-Shammaa, A. (2014).Flexible e-textile sensors for real-time health monitoring at microwave frequencies.International Journal on Smart Sensing and Intelligent Systems, 7(1), 31–47.
Mehdizadeh, P., Farchy, D., et al. (1995). Multi-phase flow metering using dissimilarflow sensors: theory and field trial results. In Middle east oil show.
Mi, Y., Ishii, M., & Tsoukalas, L. (2001). Flow regime identification methodologywith neural networks and two-phase flow models. Nuclear Engineering and Design,204(1), 87–100.
Mukhopadhyay, S. C., Mason, A., et al. (2013). Smart sensors for real-time water qualitymonitoring. Springer.
108

Muradov, M., Cullen, J., & Mason, A. (2016). Real-time monitoring of meat dryingprocess using electromagnetic wave sensors. In Next generation sensors and systems(pp. 221–233). Springer.
Murai, Y., Tasaka, Y., Nambu, Y., Takeda, Y., et al. (2010). Ultrasonic detection of movinginterfaces in gas–liquid two-phase flow. Flow Measurement and Instrumentation,21(3), 356–366.
Nyfors, E., & Vainikainen, P. (1989). Industrial microwave sensors. Artech HousePublishers.
Oon, C., Ateeq, M., Shaw, A., Al-Shammaa, A., Kazi, S., & Badarudin, A. (2016).Experimental study on a feasibility of using electromagnetic wave cylindrical cavitysensor to monitor the percentage of water fraction in a two phase system. Sensorsand Actuators A: Physical, 245, 140–149.
Oon, C. S., Ateeq, M., Shaw, A., Wylie, S., Al-Shammaa, A., & Kazi, S. N. (2016).Detection of the gas–liquid two-phase flow regimes using non-intrusive microwavecylindrical cavity sensor. Journal of Electromagnetic Waves and Applications, 1–15.
Ozbayoglu, E., & Ozbayoglu, M. (2009). Estimating flow patterns and frictional pressurelosses of two-phase fluids in horizontal wellbores using artificial neural networks.Petroleum Science and Technology, 27(2), 135–149.
OConnor, E., Smeaton, A. F., OConnor, N. E., & Regan, F. (2012). A neural net-work approach to smarter sensor networks for water quality monitoring. Sensors,12(4), 4605–4632. Retrieved from http://www.mdpi.com/1424-8220/12/4/4605 doi: 10.3390/s120404605
Poette, C., & Reynier, P. (2014). Evaluation of 3d mapping experimental non-intrusivemethods for multiphase flows. The International Journal of Multiphysics, 8(1), 69–90.
Prasser, H.-M., Böttger, A., & Zschau, J. (1998). A new electrode-mesh tomograph forgas–liquid flows. Flow measurement and instrumentation, 9(2), 111–119.
Qu, Z., Zhao, Q., & Meng, Y. (2013). Online measurement of water concentration of oil–water mixtures in the flow of pipeline by using eddy current method. MeasurementScience and Technology, 24(12), 125304.
Rao, Y., Wang, S., Zhou, S., Yu, Y., & Wei, M. (2011). Reviewed of gas-liquid two-phaseflow pattern in level and inclined tube. In Computational and information sciences(iccis), 2011 international conference on (pp. 563–566).
Roach, G., & Watt, J. (1996). Current status of development of the csiro gamma-raymultiphase flow meter. In Proc. 14th north sea flow measurement workshop.
Rodriguez, O., & Oliemans, R. (2006). Experimental study on oil–water flow in hori-zontal and slightly inclined pipes. International Journal of Multiphase Flow, 32(3),323–343.
109

Santhosh, K., & Roy, B. (2012). An intelligent flow measurement technique using ultra-sonic flow meter with optimized neural network. International Journal of Controland Automation, 5(4), 185–195.
Scheers, A. (2001). Multi-phase flow metering... on it’s way from nursing to maturetechnology. Shell report.
Scheffler, M. (2004). Broadband microwave spectroscopy on correlated electrons.
Scott, B., Cregger, B., Shortes, S., et al. (1993). Technology for full-range water-cutmeasurements. In Offshore technology conference.
Shaw, A., Wylie, S., Toal, D., et al. (2006). Experimental investigations of electromag-netic wave propagation in seawater. In 2006 european microwave conference (pp.572–575).
Stuchly, S., & Stuchly, M. (1999). Coaxial line reflection method for measuring dielectricproperties at radio and microwave frequencies, a review. IEEE Trans. Instrum. Meas,29(3), 1640–1648.
Sun, Z., & Zhang, H. (2007). Neural networks approach for prediction of gas–liquid two-phase flow pattern based on frequency domain analysis of vortex flowmeter signals.Measurement Science and Technology, 19(1), 015401.
Sunde, C., Avdic, S., & Pázsit, I. (2005). Classification of two-phase flow regimes viaimage analysis and a neuro-wavelet approach. Progress in Nuclear Energy, 46(3),348–358.
Taitel, Y., & Dukler, A. (1976). A model for predicting flow regime transitions in hori-zontal and near horizontal gas-liquid flow. AIChE Journal, 22(1), 47–55.
Tan, C., Wu, H., & Dong, F. (2013). Horizontal oil–water two-phase flow measurementwith information fusion of conductance ring sensor and cone meter. Flow Measure-ment and Instrumentation, 34, 83–90.
Thorn, R., Johansen, G., & Hammer, E. (1997). Recent developments in three-phase flowmeasurement. Measurement Science and Technology, 8(7), 691.
Thorn, R., Johansen, G., & Hjertaker, B. (2012). Three-phase flow measurement in thepetroleum industry. Measurement Science and Technology, 24(1), 012003.
Übeyli, E. D., & Güler, I. (2005). Improving medical diagnostic accuracy of ultrasounddoppler signals by combining neural network models. Computers in Biology andMedicine, 35(6), 533–554.
Wang, H., Priestman, G., Beck, S., & Boucher, R. (1998). A remote measuring flowmeter for petroleum and other industrial applications. Measurement Science andTechnology, 9(5), 779.
Wellock, R., & Walmsley, A. D. (2004). Applications of microwave spectroscopy inprocess analysis. Spectroscopy Europe, 16(4), 23–26.
110

Wylie, S., Shaw, A., & Al-Shamma’a, A. (2006). Rf sensor for multiphase flow mea-surement through an oil pipelinethis paper was presented at the 13th internationalconference on sensors and held in chatham, kent, on 6–7 september 2005. Measure-ment Science and Technology, 17(8), 2141.
Wylie, S. R., Shaw, A., & Al-Shamma’a, A. I. (2006). Rf sensor for multiphase flowmeasurement through an oil pipeline. Measurement Science and Technology, 17(8),2141. Retrieved from http://stacks.iop.org/0957-0233/17/i=8/a=013
Xie, T., Ghiaasiaan, S., & Karrila, S. (2004). Artificial neural network approach for flowregime classification in gas–liquid–fiber flows based on frequency domain analysisof pressure signals. Chemical Engineering Science, 59(11), 2241–2251.
Xu, J.-y., Wu, Y.-x., Feng, F.-f., Chang, Y., & Li, D.-h. (2008). Experimental investi-gation on the slip between oil and water in horizontal pipes. Experimental Thermaland Fluid Science, 33(1), 178–183.
Xu, X.-X. (2007). Study on oil–water two-phase flow in horizontal pipelines. Journal ofPetroleum Science and Engineering, 59(1), 43–58.
111
LIST OF PUBLICATIONS AND PAPER PRESENTED
Journal Publication
1 C. S. Oon, M. Ateeq, A. Shaw, S. Wylie, A. Al-Shamma’a, S. N. Kazi. Detection of
the Gas-Liquid Two-Phase Flow Regimes Using Non-intrusive Microwave Cylindrical
Cavity Sensor. Journal of electromagnetic waves & applications, Volume 30, Issue 17,
November 2016, Pages 2241-2255.
2 C.S. Oon, M. Ateeq, A. Shaw, A. Al-Shamma’a, S.N. Kazi, A. Badarudin. Experi-
mental study on a feasibility of using electromagnetic wave cylindrical cavity sensor to
monitor the percentage of water fraction in a two phase system. Sensors and Actuators
A: Physical, Volume 245, 1 July 2016, Pages 140–149
3 C.S. Oon, A. Al-Shamma’a, S.N. Kazi, B.T. Chew, A. Badarudin, E. Sadeghinezhad.
Simulation of heat transfer to separation Air flow in a concentric pipe. International
Communications in Heat and Mass Transfer, Volume 57, October 2014, Pages 48-52.
4 C.S.Oon, A. Badarudin, S.N. Kazi, M. Fadhli. Simulation of Heat Transfer to Turbulent
Nanofluid Flow in an Annular Passage. Advanced Materials Research, Volume 925,
2014 Pages 625-629.
5 E. Sadeghinezhad, M Mehrali, S.T. Latibari, M. Mehrali, S. N. Kazi, C.S. Oon, H.S.C.
Metselaar. Experimental Investigation of Convective Heat Transfer Using Graphene
Nanoplatelet Based Nanofluids under Turbulent Flow Conditions. Industrial & Engi-
neering Chemistry. Research., 2014, Volume 53, Issue 31, Pages 12455–12465
6 Emad Sadeghinezhad, Salim N. Kazi, Ahmad Badarudin, Hussein Togun, Mohd N.M.
Zubir, Cheen S. Oon, Samira Gharehkhani. Sustainability and environmental impact
112

of ethanol as a biofuel, Reviews in Chemical Engineering. Volume 30, Issue 1, Pages
51–72.
7 E. Sadeghinezhad, S.N. Kazi, A. Badarudin, C.S. Oon, M.N.M. Zubir, Mohammad
Mehrali. A comprehensive review of bio-diesel as alternative fuel for compression
ignition engines. Renewable and Sustainable Energy Reviews, Volume 28, December
2013, Pages 410–424.
8 Ahmad Badarudin Mohamad Badry, Yin-Jen Lee, Wen-Tong Chong, Nik-Nazri Nik-
Ghazali, Cheen-Sean Oon, Kazi Salim Newaz. Numerical analysis of the effect of
vortex control mechanism on longitudinal aerodynamics of lifting body. Aerospace
Science and Technology, Volume 30, Issue 1, October 2013, Pages 232–238.
9 C.S. Oon, Hussein Togun, S.N. Kazi, A. Badarudin, E. Sadeghinezhad. Computational
simulation of heat transfer to separation fluid flow in an annular passage. International
Communications in Heat and Mass Transfer, Volume 46, August 2013, Pages 92-96.
10 W.T. Chong, K.C. Pan, S.C. Poh, A. Fazlizan, C.S. Oon, A. Badarudin, N. Nik-
Ghazali. Performance investigation of a power augmented vertical axis wind turbine
for urban high-rise application. Renewable Energy, Volume 51, March 2013, Pages
388-397.
11 E. Sadeghinezhad, S.N. Kazi, A. Badarudin, C.S. Oon, M.N.M. Zubir, Mohammad
Mehrali. A comprehensive review of bio-diesel as alternative fuel for compression
ignition engines. Renewable and Sustainable Energy Reviews, Volume 28, December
2013, Pages 410-424.
12 C.S. Oon, Hussein Togun, S.N. Kazi, A. Badarudin, M.N.M. Zubir, E. Sadeghinezhad.
Numerical simulation of heat transfer to separation air flow in an annular pipe. Interna-
113

tional Communications in Heat and Mass Transfer, Volume 39, Issue 8, October 2012,
Pages 1176-1180.
114

Conference Publication
1 Experiment Verification of Fluid Fraction and Temperature Detection Using Cylindri-
cal and Rectangular Microwave Cavity Sensor System. Faculty Research Week 2016,
Liverpool, UK, 9-13 May 2016. (Oral Presentation)
2 Electromagnetic Wave Sensor for Multiphase Flow Measurement in the Oil and Gas
Industry. Bean Conference 2014, Liverpool John Moores University, UK, 18 June
2014. (Poster Presentation)
3 Comsol Conference 2014 Cambridge, University of Cambridge, UK, 17-19 September
2014 (Participate)
4 Numerical Simulation of Heat Transfer to Separation TiO2/Water Nanofluids flow in an
Asymmetric Abrupt Expansion. Experimental Fluid Mechanics 2014, Cesky Krumlov,
Czech Republic.18-21 November 2014. (Poster Presentation)
5 Electromagnetic Wave Sensor for Temperature Independent Multiphase Flow Measure-
ment. Faculty Research Week 2015, Liverpool John Moores University, UK, 15-19
June 2015. (Oral and Poster Presentation)
6 Numerical Simulation of Heat transfer to TiO2-water nanofluid flow in a double-tube
counter flow heat exchanger. International Conference on Clean Energy 2014. Istanbul
Turkey. 8-12 June 2014. (Oral Presentation)
7 Numerical Investigation of Heat Transfer to Fully Developed Turbulent Air Flow in a
Concentric Pipe. Fifth International Conference on Computational Intelligence, Mod-
elling and Simulation (CIMSIM 2013, IEEE Proceeding). Seoul, South Korea. 24-26
September 2013. (Oral Presentation)
115

8 Simulation of Heat Transfer to Turbulent Nanofluid Flow in an Annular Passage. Joint
International Conference on Nanoscience, Engineering and Management (BOND21).
Penang, Malaysia. 19-21 August 2013. (Oral Presentation)
9 Simulation of Heat Transfer to Turbulent Air Flow in an Annular Passage. 2nd Interna-
tional Conference on Mechanical, Automotive and Aerospace Engineering (ICMAAE
2013) Kuala Lumpur, Malaysia. 2-4 July 2013. (Oral Presentation)
10 Numerical Simulation and Experiment of a Lifting Body with Leading-edge Rotating
Cylinder. International Conference on Mechanical, Materials and Mechatronics Engi-
neering (ICMMME 2013). Madrid, Spain. 28-29 March 2013. (Oral Presentation)
11 A Computational Simulation of Heat Transfer to Separation Air Flow in a Concentric
Pipe. International Conference on Applications and Design in Mechanical Engineering
(ICADME). Penang, Malaysia. 27-28 February 2012. (Oral Presentation)
12 Vertical axis wind turbine with omni-directional-guide-vane for urban high rise appli-
cation. International Conference of WREC-Asia & SuDBE2011, Chongqing, China.
28-31 October 2011.
13 Exhaust Air and Wind Energy Recovery system for Clean Energy Generation. Pro-
ceedings of International Conference on Environment and Industrial Innovation (ISI
Proceedings). Kuala Lumpur. 4-5 June 2011.
116

Appendices
117

APPENDIX A AWARD
Award
1 Associate Fellow of The Higher Education Academy (UK Professional Standards Frame-
work for teaching and learning support in higher education) 2015
2 Dual-Phd Scholarship 2013
3 Gold Medal Award – Malaysia Technology Expo 2011
4 University of Malaya Fellowship Scheme (Skim Biasiswazah) 2011
118

APPENDIX B PATENT
Patent: Dual Microwave Cavity Sensor System
Title of Invention: Dual Microwave Cavity Sensor System
Application Status: Pending Filling
FIELD OF THE INVENTION
The present invention relates to a multiphase flow metering system for measuring of
the mixture proportions within fluids. More particularly, the present invention relates to
a multiphase flow metering system, an apparatus and measuring method for continuous,
real-time measurement of the mixture proportions within fluids.
119

BACKGROUND OF THE INVENTION
Several meters for measuring of the mixture proportions within fluids, such as, water
contents in oil, are available on the market today. Some of these meters are based on the
use of radioactive radiation, some of them are capacitive and some are based on use of
microwaves. Radioactive sensors are not acceptable or rather controversial in many envi-
ronments due to the health hazard represented by the radiation, and the required security
precautions. Sufficient accuracy also represents a problem in radioactive sensors as the
radiation is most sensible for variations in density, and the difference in density between
water and oil is rather low. The capacitive meters detect the permittivity of the mixture
of fluids at a frequency much lower than the frequency regularly used in sensors based
upon microwaves. Such sensors are rather sensitive for different coatings as a large in-
crease of the impedance will be the result of even a thin coating. The capacitive sensors
also require a relatively complex design using a dielectric internal protection in the sensor
to avoid direct contact between the electrodes and the fluid or the liquid, which is to be
measured. The above problems are not involved with the microwave sensors.
The electrical permittivity of a nominally homogeneous mixture depends upon the
volumetric ratio of the constituent materials and upon the permittivity of the individual
components. Microwave instruments exploit this fact to analyze the properties of sub-
stances or the composition of mixtures by measuring and analyzing various attributes of
a microwave signal or set of signals that depend directly upon the permittivity of the sub-
stance or mixture. For example, instruments in a variety of configurations are available
which measure the attenuation or phase shift of signals that are transmitted through an
unknown mixture.
It is crucial to measure gas or liquid fraction, phase velocities and the water-in-
liquid ratio (WLR), in order to acquire the production flow rates of oil and water. Several
120

Multi Phase Flow Meters (MPFMs) have been designed and developed by companies
and research organizations, utilizing various measurement technologies. Although those
MPFMs are commercially available, there are number of challenging problems yet to be
solved, for instance, different flow regimes, changes in the fluid properties and sensitivity
of the measurement of phase-fraction.
U.S. Pat. No. US 5083089 A issued to Spatial Dynamics, Ltd discloses an appara-
tus and associated measuring method for monitoring the dielectric constants of the fluid
ingredients in a heterogeneous mixture flowing through a conduit and thereby measuring
the relative volume of each of the constituents of the mixture. The apparatus includes a
microwave source generating microwaves at a predetermined frequency along an axis and
a measuring means for measuring the reflected microwave along that axis. The apparatus
further includes a transmitter/receiver lens, which is a part of the microwave source, ca-
pable of radiating microwave energy at a predetermined frequency along the above said
axis and also capable of measuring the reflected microwaves along the axis. The appara-
tus further includes a cylindrical cavity surrounding the conduit through which the fluid
mixture passes. The reflected microwaves from the heterogeneous fluid mixture passing
through the conduit are received by the microwave energy receiver and is analyzed, which
in the end provides a volumetric ratio between the oil and water constituents of the fluid
mixture passing through the conduit.
Another prior art EP 1082606 B1 titled “Microwave fluid sensor and a method for
using same”, issued to Multi-Fluid Asa discloses a microwave sensor capable of measur-
ing relative portions of fluids in a fluid mixture passing through a tube having radially
extending, conducting internal fins along an axis of the tube. The length of the tube is uti-
lized as a part of the sensor. A number of sensor probes are also provided in the tube for
transmitting electromagnetic energy in the microwave region into the sensor and for re-
ceiving the microwave energy from the sensor. The sensor employs a resonant frequency
121

below a cut- off frequency of the tube to measure the contents in the tube. The method of
measuring the relative proportions of the constituents of the fluid mixture passing through
the tube includes the steps of determining the resonant frequency of the microwave sig-
nals generated by the sensor and calculating the permittivity of the fluid constituents from
the resonant frequency. The measured permittivity is then compared with standard per-
mittivity of known fluids and then analyzed to determine the relative proportions of the
constituents.
Another prior art WO 2007129901 A1 titled “Method and Apparatus for Measuring
the Conductivity of the Water Fraction of a Wet Gas” issued to Arnstein Wee discloses a
method and apparatus for determining the water conductivity of a multi-component mix-
ture of gas and one or more liquid containing water in a pipe is proposed. The proposed
method includes the steps of performing electromagnetic measurements at least two mea-
surement frequencies, within the range of within the range of 1 MHz to 10000 MHz, in a
pipe near the pipe wall at a first cross-sectional location where the mixture predominantly
contains gas and at a second cross-sectional location where the mixture predominantly
contains liquid. The method further includes the steps of determining the temperature of
the multi-component mixture and determining the conductivity of the water in the in the
multi-component mixture based on an empirically determined relationship between the
measurements performed is the above two steps and the conductivity of pure water.
The above cited prior arts provides non-intrusive and intrusive methods for detecting
the fluid constituents in a fluid mixture passing through a tube. However none of the above
cited prior arts employ a pair of cavity sensors for performing non-intrusive measurement
of fluid compositions, volume fractions and temperature in real-time. The objective of this
invention is to enhance the robustness of the real time measurement of oil well streams,
to provide a low-cost MPFM solution and to continuously monitor the production of each
well.
122

SUMMARY OF THE INVENTION
The present invention relates to a multiphase flow metering system for measuring the
relative volumetric proportions and temperature of a number of constituents present in a
fluid mixture passing through a pipe. The multiphase flow metering system includes an
apparatus non-intrusively placed around the pipe carrying the fluid mixture. The appara-
tus includes a cylindrical cavity structure longitudinally and coaxially placed around the
pipe carrying the fluid mixture. The cylindrical cavity structure has a pair of open ends
and a diameter larger than the diameter of the pipe and is longitudinally placed around the
pipe carrying the fluid mixture. The cylindrical cavity structure includes a first microwave
sensor system having a first loop antenna placed on an inner wall of the cylindrical cav-
ity structure and a first electronic means capable of generating microwave signals at a
first predetermined frequency. The apparatus further includes a rectangular cavity struc-
ture vertically placed across the pipe. The rectangular cavity structure includes a second
microwave sensor system having a second loop antenna placed on an inner wall of the
rectangular cavity structure and a second electronic means or platform capable of gener-
ating electromagnetic signals at a second predetermined frequency. Each of the first loop
antenna connected to the first electronic means and the second loop antenna connected
to the second electronic means are configured to operate in a two port configuration, i.e.
capable of transmission and reception of signals, to transmit and receive the microwave
signs within the apparatus. The microwave signals transmitted by the first loop antenna
at the first predetermined frequency within the cylindrical cavity structure passes through
the constituents of the fluid mixture flowing through the pipe and gets a shift in fre-
quency caused by the difference in permittivity of the constituents present in the fluid
mixture. Similarly, the microwave signals transmitted by the second loop antenna at the
second predetermined frequency within the rectangular cavity structure passes through
123

the constituents of the fluid mixture flowing through the pipe and gets a slight shift in
frequency caused by the difference in permittivity and temperature variation of the con-
stituents present in the fluid mixture. The attenuated and reflected microwave signals with
shifts in frequency from its first predetermined frequency and the second predetermined
frequency are detected by the first loop antenna and the second loop antenna, both op-
erating in two-port configuration, respectively. A computer system running a frequency
analysis and multiphase flow metering application analyzes the outputs from the first mi-
crowave sensor system and the second microwave sensor system to identify the relative
volumetric proportion of the constituents in the fluid mixture passing through the pipe in
real-time.
Other main features of the present multiphase flow metering system and method
are discussed below. The present invention is designed to fulfill the below and other
additional features as detailed in the following claims section and detailed description
section of the invention.
A primary feature of the invention is to provide a multiphase flow metering system
capable of measuring the relative volumetric concentrations of a number of constituents
in a fluid mixture passing through a pipe in real-time, continuously.
Another feature of the invention is to provide an apparatus having rectangular and
cylindrical cavities capable of non-intrusively placing around the pipe carrying the fluid
mixture.
Another feature of the invention is to provide an apparatus having a cylindrical cavity
structure longitudinally and coaxially placed around the pipe carrying the fluid mixture.
Another feature of the invention is to provide an apparatus having a rectangular cav-
ity structure vertically placed across the pipe carrying the fluid mixture.
Another feature of the invention is to provide an apparatus having a cylindrical cavity
structure with a loop antenna operating in a two-port configuration non-intrusively placed
124

around the pipe carrying the fluid mixture.
Another feature of the invention is to provide an apparatus having a rectangular cav-
ity structure with a loop antenna operating in a two-port configuration non-intrusively
placed across the pipe carrying the fluid mixture.
Another feature of the invention is to provide an apparatus having a cylindrical cavity
structure and a rectangular cavity structure capable of creating resonant electromagnetic
waves along and across the pipe carrying the fluid mixture.
Another feature of the invention is to provide a computer system running a frequency
analysis and multiphase flow metering application to analyze the shift in frequency to
determine the relative volumetric proportions and temperature of the constituents in the
fluid mixture, in real-time.
Another feature of the invention is to provide a computer system running a frequency
analysis and multiphase flow metering application to continually display the relative vol-
umetric proportions of the constituents in the fluid mixture passing through a pipe.
Another feature of the invention is to provide a multiphase flow metering system
capable of determining the relative volumetric proportions including water-air fraction,
water-oil fraction and oil-air fraction in the fluid mixture having the constituents in form
of water, air and oil.
125

DETAIL DESCRIPTION OF THE INVENTION
The present invention relates to a multiphase flow metering system, a microwave
radiating and receiving apparatus and an associated method for measuring the relative
volumetric proportions and temperature of a number of constituents present in a fluid
mixture passing through a pipe. The present multiphase flow metering system utilizes
a non-intrusive microwave sensing method for determining the relative volumetric pro-
portions and temperature of the constituents present in a fluid mixture flowing through a
pipe. Further, the present non-intrusive microwave sensing method utilizes the resonant
frequencies of microwave signals occurring in an enclosed cavity when microwave signals
of a desired frequency are radiated into the cavity. The present multiphase flow metering
system and associated measuring method makes use of the fact that the frequency of mi-
crowave signals, when passed through a polarizing or dielectric material, changes depend-
ing on the permittivity of the material. The apparatus used in the present multiphase flow
metering system generates microwave signals at desired frequencies and transmits the
microwave signals through the constituents present in the fluid mixture passing through
the pipe. The microwave signals within a selected range of frequencies, when generated
inside the cavity creates resonance at a particular frequency, and these resonating mi-
crowave signals are non-intrusively passed through the constituents present in the fluid
mixture passing through the pipe. The permittivity changes in the constituents present in
the fluid mixture passing through the pipe causes shifts in the resonant frequencies, which
are measured using a receiver antenna or a loop antenna to recognize the changes in the
permittivity of the measured phases and differentiate between the volume fractions of the
constituents present in the fluid mixture. The present system, apparatus and method can
be used for determining the volume fractions of different types of constituents, such as,
but not limited to, water, air and oil, present in the fluid mixture obtained from oil drilling
126

operations. Further the present system, apparatus and method can also be employed for
non-intrusive real-time continuous measurement of constituents, such as, but not limited
to, water, air and oil, present in the fluid mixture obtained from oil drilling operations,
while it is passing through the pipe.
Referring to the figure 1 is a schematic diagram showing a multiphase flow meter-
ing system (100) for measuring the relative volumetric proportions and temperature of a
number of constituents present in a fluid mixture passing through a pipe (118), accord-
ing to a preferred embodiment of the present invention. The multiphase flow metering
system (100) for measuring the relative volumetric proportions the constituents in the
fluid mixture passing through the pipe (118) includes an apparatus (102) non-intrusively
placed around the pipe (118) carrying the fluid mixture. The apparatus (102) includes
a cylindrical cavity structure (104) longitudinally and coaxially placed around the pipe
(118) carrying the fluid mixture. The cylindrical cavity structure (104) has a pair of open
ends and a diameter larger than the diameter of the pipe (118) and is longitudinally placed
around the pipe (118) carrying the fluid mixture. In a preferred embodiment, the cylin-
drical cavity structure (104) includes a first microwave sensor system (108) having a first
loop antenna (114) placed on an inner wall of the cylindrical cavity structure (104) and a
first electronic means or platform not shown capable of generating electromagnetic sig-
nals at a first predetermined frequency. The apparatus (102) further includes a rectangular
cavity structure (106) vertically placed across the pipe (118). In a preferred embodiment,
the rectangular cavity structure (106) includes a second microwave sensor system (110)
having a second loop antenna (116) placed on an inner wall of the rectangular cavity
structure (106) and a second electronic means or platform not shown capable of generat-
ing electromagnetic signals at a second predetermined frequency. Each of the first loop
antenna (114) connected to the first electronic means and the second loop antenna (116)
connected to the second electronic means are configured to operate in a two port config-
127
uration, i.e. capable of transmission and reception of signals, to transmit and receive the
microwave signs within the apparatus (102).
The microwave signals generated by the first electronic means and transmitted by the
first loop antenna (114), at the first predetermined frequency within the cylindrical cavity
structure (104), passes through the constituents of the fluid mixture flowing through the
pipe (118) and gets a shift in frequency caused by the difference in permittivity of the con-
stituents present in the fluid mixture. Similarly, the microwave signals generated by the
second electronic means and transmitted by the second loop antenna (116), at the second
predetermined frequency within the rectangular cavity structure (106), passes through the
constituents of the fluid mixture flowing through the pipe (118) and gets a shift in fre-
quency caused by the difference in permittivity of the constituents present in the fluid
mixture. The attenuated and reflected microwave signals with shifts in frequency from
its first predetermined frequency and the second predetermined frequency are detected by
the first loop antenna (114) and the second loop antenna (116), both operating in two-port
configuration, respectively. The present multiphase flow metering system (100) further
includes a computer system (120) running a frequency analysis and multiphase flow me-
tering application analyzes the outputs from the first microwave sensor system (108) and
the second microwave sensor system (110). The frequency analysis and multiphase flow
metering application compares the first predetermined frequency of the microwave sig-
nals generated by the first loop antenna (114) and transmitted inside cylindrical cavity
structure (104) and the shift in the frequency of the reflected or received microwave sig-
nals and the second predetermined frequency of the microwave signals generated by the
second loop antenna (116) and transmitted inside the rectangular cavity structure (106)
and the shift in the frequency of the reflected or received microwave signals to identify
the relative volumetric proportion of the constituents in the fluid mixture passing through
a pipe (118). The present multiphase flow metering system (100) measures and analyzes
128

the shift in frequency of the microwave signals passing through the constituents present
in the fluid mixture to determine the relative volumetric proportions and a temperature of
the constituents in the fluid mixture in real-time.
Referring to the figure 2 is a schematic diagram showing the apparatus (102) utilized
for determining the relative volumetric proportions and temperature of the constituents
present in the fluid mixture passing through a pipe (118), according to a preferred em-
bodiment of the present invention. The apparatus (102) includes the cylindrical cavity
structure (104) having the pair of open ends configured to be longitudinally and coaxially
placed around the pipe (118), which is having a smaller diameter, carrying the fluid mix-
ture. The coaxially placed cylindrical cavity structure (104) guides the microwave signals
generated by the first microwave sensor system (108) at the first predetermined frequency
in a longitudinal direction along the axis of the pipe (118). The cylindrical cavity struc-
ture (104) includes the first microwave sensor system (108) placed, non-intrusively, within
the inner walls of the cylindrical cavity structure (104) for generating and transmitting the
microwave signals at the first predetermined frequency within the cylindrical cavity struc-
ture (104) through the constituents present in the fluid mixture passing through the pipe
(118). The first microwave sensor system (108) also acts as the receiver for receiving the
reflected microwave signals at a first altered frequency. The apparatus (102) also includes
the rectangular cavity structure (106) placed vertically across the pipe (118) carrying the
fluid mixture. The rectangular cavity structure (106) guides the microwave signals gener-
ated by the second microwave sensor system (110) at the second predetermined frequency
in a transverse direction across the pipe (118). The rectangular cavity structure (106) in-
cludes the second microwave sensor system (110), which is non-intrusively placed, within
the inner walls of the cylindrical cavity structure (104) for generating and transmitting the
microwave signals at the second predetermined frequency within the rectangular cavity
structure (106) through the constituents present in the fluid mixture passing through the
129
pipe (118). The second microwave sensor system (110) also acts as a receiver for receiv-
ing the reflected microwave signals at a second altered frequency. The shift in frequency
of the microwave signals from the first predetermined frequency to the first altered fre-
quency and from the second predetermined frequency to the second altered frequency are
analyzed using the frequency analysis and multiphase flow metering application running
on the computer system (120), which is in communication with the first microwave sen-
sor system (108) and the second microwave sensor system (110), to determine the relative
volumetric proportions and the temperature of the constituents in the fluid mixture.
In a preferred embodiment of the present invention, the first microwave sensor sys-
tem (108) includes the first electronic means or an electronic board capable of generating
the microwave signals at the first predetermined frequency, which is selected between
a frequency range of 5-5.7 GHz, and the first loop antenna (114) connected to the first
electronic means capable of transmitting the microwave signals at the first predetermined
frequency, through the constituents in the fluid mixture, both placed on the inner walls of
the cylindrical cavity structure (104). The first loop antenna (114) is configured to oper-
ate in a two-port configuration and is capable of transmitting the microwave signals at the
first predetermined frequency and receiving the reflected microwave signals, which are
passed though the constituents in the fluid mixture, at the first altered frequency. In some
other instances, the first electronic means or an electronic board of the first microwave
sensor system (108) is placed outside the cylindrical cavity structure (104). However, in
all these instances, the first microwave sensor system (108) involving the first electronic
means and the first loop antenna (114) is non-intrusively or non-invasively placed outside
the pipe (118) carrying the fluid mixture.
Similarly in a preferred embodiment of the present invention, the second microwave
sensor system (110) includes the second electronic means or an electronic board capable
of generating the microwave signals at the second predetermined frequency, which is
130

selected between a frequency range of 1-1.25GHz, and the second loop antenna (116)
connected to the second electronic means capable of transmitting the microwave signals
at the second predetermined frequency through the constituents in the fluid mixture, both
placed on the inner walls of the rectangular cavity structure (106). The second loop
antenna (116) is also configured to operate in a two-port configuration and is capable of
transmitting the microwave signals at the second predetermined frequency and receiving
the reflected microwave signals, which are passed though the constituents in the fluid
mixture, at the second altered frequency. In some other instances, the second electronic
means or an electronic board of the second microwave sensor system (110) is placed
outside the rectangular cavity structure (106). However, in all these instances, the second
microwave sensor system (110) involving the first electronic means and the second loop
antenna (116) is non-intrusively or non-invasively placed outside the pipe (118) carrying
the fluid mixture. In some other embodiment, the first microwave sensor system (108)
and the second microwave sensor system (110) shares a common electronic means or
electronic board for generating microwave signals in the first predetermined frequency
and the second predetermined frequency.
In a preferred embodiment of the present invention, the first loop antenna (114) is
placed on the inner wall of the cylindrical cavity structure (104) to create resonance at
a resonant frequency, within 5-5.7 GHz range, for monitoring changes in permittivity of
each of the constituents in the fluid mixture. Similarly, the second loop antenna (116) is
placed on the inner wall of the rectangular cavity structure (106) to create resonance at a
resonant frequency, within 1-1.25GHz ranges, for monitoring slight variations in permit-
tivity and a change in temperature of each of the constituents in the fluid mixture. The
present multiphase flow metering system (100) and the apparatus (102) enables real-time
continuous measurements of the relative volumetric proportions of the constituents in the
fluid mixture passing through the pipe (118). In some instances, the present multiphase
131

flow metering system (100) and the apparatus (102) also enables real-time continuous
measurements of the temperature of one or more constituents in the fluid mixture passing
through the pipe (118). The present multiphase flow metering system (100) and appara-
tus (102) has a wide range of applications, including in oil drilling, where the apparatus
(102) can be employed to determine the relative volumetric proportions including water-
air fraction, water-oil fraction and oil-air fraction in the oil-water mixture flowing through
the oil extracting pipe (118). Several other modifications to the present multiphase flow
metering system (100) and the apparatus (102) can be made without departing from the
scope of the claims of the present disclosure. However all such modifications are cov-
ered under the present disclosure for the multiphase flow metering system (100) and the
apparatus (102).
Referring to the figure 3 shows a flowchart of a method of measuring the relative vol-
umetric proportion of the constituents in the fluid mixture passing through the pipe (118),
according to an embodiment of the present invention. The present method of measuring
the relative volumetric proportion of the constituents in the fluid mixture passing through
the pipe (118) includes the steps of providing the apparatus (102) having the cylindri-
cal cavity structure (104) with the first microwave sensor system (108) non-intrusively
placed around the pipe (118) and the rectangular cavity structure (106) with the sec-
ond microwave sensor system (110) non-intrusively placed across the pipe (118), as in
block 200. Once the apparatus (102) is properly placed, non-intrusively around the pipe
(118) carrying the fluid mixture, the users can manually or remotely instruct the first mi-
crowave sensor system (108) to transmit the microwave signals at the first predetermined
frequency, which is anywhere from 5-5.7 GHz frequency range in a longitudinal direc-
tion through the fluid mixture, as in block 202. In a preferred embodiment of the present
invention, the first loop antenna (114) associated with the first microwave sensor system
(108) creates resonance inside the cylindrical cavity structure (104) at a first resonant fre-
132
quency, which is a value within 5-5.7 GHz. Similarly, the second microwave sensor sys-
tem (110) transmit the microwave signals at the second predetermined frequency selected
from 1-1.25GHz frequency range across the pipe (118) carrying the fluid mixture, as in
block 204. In a preferred embodiment of the present invention, the second loop antenna
(116) associated with the second microwave sensor system (110) creates resonance at a
second resonant frequency within 1-1.25GHz. In a preferred embodiment of the present
invention, both the first microwave sensor system (108) comprising the first loop antenna
(114) and the second microwave sensor system (110) comprising the second loop antenna
(116) operates in a two port configuration, capable of transmitting the microwave signals
through the constituents in the fluid mixture and receiving the reflected signals. Now as in
block 206, the reflected microwave signals at the first altered frequency are received using
the first loop antenna (114) of the first microwave sensor system (108). And the reflected
microwave signals at the second altered frequency are received using the second loop an-
tenna (116) of the second microwave sensor system (110), as in block 208. Now as in
block 210, the shift in frequency in the first altered frequency and the second altered fre-
quency from the first resonant frequency and the second resonant frequency, respectively,
is automatically calculated in real-time using the frequency analysis and multiphase flow
metering application running on the computer system (120), such as a central server in
communication with the first and second microwave sensor systems (108, 110). Then
the real-time continuous measurements of the relative volumetric proportions of the con-
stituents and the temperature of the constituents in the fluid mixture, based on the shift
in frequency, is provided to the users via a user interface of the frequency analysis and
multiphase flow metering application running on the computer system (120), as in block
212,
The following sections discuss the field analysis process and the relative volumetric
concentrations of the constituents in a fluid mixture obtained by analyzing of the mi-
133

crowave signals using the present multiphase flow metering system (100), according to
one or more embodiment of the present invention.
The principle of real-time continuous monitoring the relative volumetric concentra-
tions of the constituents in the fluid mixture passing through a pipe (118), such as the
one’s used in hydrocarbon excavation, using the microwave sensors, is based on the in-
teraction of electromagnetic, EM, waves. When a fluid mixture sample is exposed to the
EM irradiation, it alters the velocity of the signal, attenuates, or reflects it. If the elec-
tromagnetic, EM, waves is directed into a hollow structure with conducting walls i.e., a
cavity, it will resonate when it is excited at an appropriate EM frequency. In order to
generate the electromagnetic waves at resonant frequency within the cavity, such as the
cylindrical and rectangular cavity structures (104, 106) used in the present system (100),
for example, a small antenna placed inside it. In one or more embodiment of the present
invention, as discussed above, the antennas placed inside the cylindrical and rectangular
cavity structures (104, 106) are the first loop antenna (114) and the second loop antenna
(116), respectively, each operating in a two port configuration capable of transmitting and
receiving the electromagnetic signals, i.e. the electromagnetic signals in the microwave
region. The resonant modes occur inside the cylindrical and rectangular cavity structures
(104, 106) or any type of cavity when the electric or magnetic components of the EM
signal form standing wave pattern, which is dependent on the dimensions of the cavity
and the dielectric properties of the constituents of the test sample, i.e. the fluid mixture.
The resonant frequency for TEnml mode in a rectangular waveguide, which is created
inside the rectangular cavity structure (106), can be calculated using Equation:
fnml =c
2π√
µrεr
[(pnm
b
)2
+
(lπd
)] 12
(1)
where εr is the relative permittivity of the material, µr is the relative permeability of
134

the material, c is the velocity of light, d is the depth of the cavity, Pmn is the mth root of
the Bessel function of the nth order and b is the radius of the cavity.
fmnl =c
2π√
µrεr
√(mλ
a
)2
+
(nλ
b
)2
+
(lπd
)2
(2)
where c is the velocity of light, µr is the relative permeability, εr is the relative
permittivity, pnm is the Bessel function of the nth order foor the TE or TM modes of a
rectangular cavity, a is the width of the cavity, b is the height of the cavity, d is the depth
of the cavity.
The main principle of microwave analysis and monitoring, according to present in-
vention, is based on the material interaction, i.e. the interaction of the constituents of
the fluid mixture with microwave signals. According to one or more embodiment of
the present invention, the broadband microwave analysis of the constituents of the fluid
mixture provides unique signal spectrums in the form of reflection coefficient (S11) and
transmission coefficient (S21) based on the parameters such as conductivity and permit-
tivity of each of the constituents in the fluid mixture. Conductivity is defined as the
material’s ability to conduct electric current. Permittivity is a complex value that mea-
sures the effect of a dielectric medium, such as the constituents in the fluid mixture, on
the applied electric field. This is determined by the constituents’ ability to polarize in
response to the applied field and how the total electric field is reduced inside the material
inside the cavity. The above properties accounts for two main parameters, such as the
dielectric constant and dielectric loss of the constituents. The dielectric constant accounts
for the energy stored inside the constituents on the application of EM waves whereas the
dielectric loss represents any losses of energy when polarizing the constituents.
Any change in the constituents’ concentration, percentage, type, etc. changes its per-
mittivity that causes the change in the microwave response when the constituents interact
135

with it. The present apparatus (102) and the multiphase flow metering system (100) can
be used to measure the response over the range of discreet frequencies the material can
be characterized. Water, for example, is a polar molecule due to the charge separation
that exists between the hydrogen and oxygen atoms. As a result, it has relatively high
permittivity (epsilonr = 81, at 15°C). This can be detected using the cylindrical cavity
structure (104) operating at 5-5.7 GHz frequency. Hence, a small change in water frac-
tion may result in comparatively large frequency shift. On the other hand, gases have low
permittivity values approximately equal to (epsilonr = 1). Non-polar materials such as oil
have low permittivity value (epsilonr = 2.2 to 2.5). This tiny change in the permittivity
is hardly detected by the first microwave sensor system (108) installed in the cylindrical
cavity structure (104). The second microwave sensor system (110), of the present multi-
phase flow metering system (100), with the second loop antenna (116) placed on the inner
wall of the rectangular cavity structure (106) picks up these tiny shifts in the permittivity
when the temperature change or low permittivity material is used.
The following description shows the actual experimental data obtained by using
the present multiphase flow metering system (100), according to an embodiment of the
present invention.
The measurements of the change in the volume fraction of two-phase systems, using
the present multiphase flow metering system (100), is first conducted over the full range of
spectrum between 9 kHz and 6 GHz. However, it is then found that the frequency below
5 GHz has a high noise and do not correspond to the changes in percentage of water.
The results of the frequency response are also not consistent with change in the fraction
percentage. The frequencies above 5.7 GHz are eliminated because of the ambiguous
microwave response as well as to avoid the multi modes and complexities in the data
analysis in the later stage. The following measurements were taken between 5-5.7 GHz
with the cylindrical cavity structure (104) operating in T E124 mode. The experimentation
136

is conducted by measuring the volume fraction of water required to fill the PVC pipe
(118), which is preset to value equal to 740 ml. The volume is then divided by 5 to get the
amount of volume fraction increase each time in the pipe (118), which equaled to 148 ml.
The measurements are first taken with the empty pipe (118), i.e. filled with 100% of air.
Afterwards, each 148ml of water is added into the pipe (118) representing 20% increase
in the water fraction and in proportion 20% decrease in the air fraction. The LabVIEW
program designed to display the microwave spectra is used to capture and record the data
in real-time. The percentage of the volume of water is increased from 0-100% in the
pipeline (118). Likewise, similar procedure was repeated with oil-water volume fractions
with oil starting at 0% and water at 100%, i.e. 740 ml. The percentage of water is
decreased and oil increased by 20% and measurements taken for each of the percentage
increase till the pipe (118) is filled with 100% oil. Same measurement technique is applied
using the rectangular cavity structure (106) operating in TE113 mode. The measurements
are taken between 1-1.25 GHz.
The sensors are designed such that the cavity diameter is larger than the pipeline
(118) and open at both ends. This design allowed the pipeline (118) to appear continuous
as shown in the figure 2. This non-intrusive design allows the first loop antenna (114)
and the second loop antenna (116), which were used to excite the resonant modes, to be
separate from the fluid and the pipeline (118). This also allows both the pipeline (118)
to be clean with the cavity and the first loop antenna (114) and the second loop antenna
(116) in place and protected from the flowing fluid within the pipe (118).
After setting up the system (100) as discussed above, a temperature independent
study of the cylindrical cavity structure (104) is conducted. In the temperature dependent
study of water in the cylindrical cavity structure (104), the pipe (118) is filled with 100%
of water at 83°C and the microwave signal response is captured and recorded as dis-
cussed above. The variation of resonant frequency with drop in temperature is recorded.
137

The interval of the data recording is set manually corresponding to the temperature drop,
approximately every 10°C. The data is digitally controlled in an actual measuring envi-
ronment and recorded to enable real-time measurements.
Referring to the figure 4 shows the comparison of water-air fractions as discussed in
the previous paragraphs. The highlighted section in the figure demonstrate a shift in the
frequency and change in the amplitude of samples when the ratio of the volume fraction
of air decreases from 100-0% and water increase from 0-100%. Analysis of the figure 4
shows that:
• The frequency of the microwave response curve decreases and shifts to the left
from 5.496 GHz to 5.470 GHz as the increase in the water fraction takes place
in five steps of 20% each. It equates to a total shift of approximately 25.5 MHz.
Keeping into consideration the sensitivity of the technique the shift is significant.
• In addition to the frequency shift, a significant change in the amplitude is also
observed as in the figure 4. The amplitude decreases as the percentage of the water
increase and air decreases. The overall decrease in the amplitude from 100% air to
100% water is approximately -11.2789 dB.
The changes between each of the 20% fraction change of both water-air and water-
oil flows are also analyzed. The frequency shift and amplitude change profile was plotted
for each of the air-water and oil-water fractions and is shown in the figure 5. The results
of the frequency plot in the figure 5 shows that there is a measureable frequency shift
for each of the fraction percent change. The frequency decreases when the water fraction
increases to 100% in both water-air and water-oil two phase flows. The figure 5 shows the
comparison between the experimental and simulation results. The frequency correspond-
ing to the maximum amplitude of each percentage of water is obtained and compared
138

between experimental and simulation results. Both the results show drop in frequency
when the percentage of water increases.
The third set of analysis is conducted on water filled pipe (118) to monitor if the
change in temperature affects the microwave response curves. This is to monitor the
temperature dependence of microwave measurement technique. The figure 6 shows the
frequency and amplitude of 100% water in the pipe (118) with different temperatures. It
shows that no frequency shift is observed up to the temperature of 280C. The temperature
of the water is varied between 83°C and 28°C and this has been seen not affecting the
accuracy, despite the permittivity of water changing with the temperature. This is assumed
to be due to the different overlapping modes negating the affect, as in adjacent frequency
ranges if it is found that the affect is obvious.
The detection of oil-gas is then tested using the second microwave sensor system
(110) in the rectangular cavity structure (106). The changes in peak frequency each of
the 20% fraction increment of oil is plotted, as shown in the figure 7. The experiment is
repeated three times and the average value is calculated. The results of the frequency plot
in the figure 7 shows that there is a measureable frequency shift for each of the fraction
percent change. The frequency decreases when the oil fraction increases to 100% in this
case, it can be represented using a linear function.
During the experiment of oil-gas liquid fraction, little changes in the permeability
can be detected using the rectangular cavity structure (106). An experiment was carried
out to detect the temperature changes using 100% water fully filled pipe (118). The pipe
(118) is filled using hot boiling water and it is left to cold down while the data was taken.
A temperature probe was inserted inside the pipe away from the cavity to measure the
water temperature. The experiment is repeated for three times and the average tempera-
ture is calculated, the results are plotted shown in figure 8. The results show that there is
a measureable frequency shift for each 5°C, it can be represent as a linear function. The
139

frequency decreases when the water cool from 85°C to 40°C.
In the above experiments and comparisons, the electromagnetic waves ranging from
5GHz up to 5.7GHz for the first microwave sensor system (108) and 1GHz to 1.25GHz
for the second microwave sensor system (110) have been used to analyze the two phase
fluid fraction in a pipeline (118). Labview software, which functions as the frequency
analysis and multiphase flow metering application, is utilized to capture and process the
data, and display the results in real time. The first microwave sensor system (108) of
the cylindrical cavity structure (104) is used to detect the water level independent to the
temperature change. The second microwave sensor system (110) of the rectangular cavity
structure (106) picks up the tiny shifts in the permittivity when the temperature change
or low permittivity material is used. Hence the present multiphase flow metering system
(100) utilizing the apparatus (102) involving the cylindrical cavity structure (104) and the
rectangular cavity structure (106) is able to detect water/air fraction, water/oil fraction,
oil/air fraction and water temperature.
Further, it should be noted that the steps described in the method of use can be carried
out in many different orders according to user preference. Upon reading this specification,
it should be appreciated that, under appropriate circumstances, considering such issues as
design preference, user preferences, marketing preferences, cost, structural requirements,
available materials, technological advances, etc., other methods of use arrangements such
as, for example, different orders within above-mentioned list, elimination or addition of
certain steps, including or excluding certain maintenance steps, etc., may be sufficient.
The foregoing description of the preferred embodiment of the present invention has
been presented for the purpose of illustration and description. It is not intended to be
exhaustive or to limit the invention to the precise form disclosed. Many modifications
and variations are possible in light of the above teachings. It is intended that the scope of
the present invention not be limited by this detailed description, but by the claims and the
140

equivalents to the claims appended hereto.
141

WE CLAIM
1. A multiphase flow metering system (100) for measuring at least one relative volu-
metric proportion of a plurality of constituents in a fluid mixture passing through a
pipe (118) comprising: an apparatus (102) non-intrusively placed around the pipe
(118) carrying the fluid mixture, wherein the apparatus (102) includes: a cylindrical
cavity structure (104) having a first microwave sensor system (108); a rectangular
cavity structure (106) having a second microwave sensor system (110); and a com-
puter system (120) running a frequency analysis and multiphase flow metering ap-
plication for analyzing at least once output from the first microwave sensor system
(108) and the second microwave sensor system (110); characterized in that at least
one shift in frequency of a plurality of microwave signals passed through the plu-
rality of constituents are analyzed to determine the relative volumetric proportions
and at least one temperature of the plurality of constituents in the fluid mixture.
2. The multiphase flow metering system (100) of claim 1, wherein the cylindrical
cavity structure (104) is longitudinally and coaxially placed around the pipe (118)
and the rectangular cavity structure (106) is vertically placed across the pipe (118).
3. The multiphase flow metering system (100) of claim 1, wherein the first microwave
sensor system (108) includes a first loop antenna (114) placed on an inner wall of
the cylindrical cavity structure (104), the first loop antenna (114) being capable
of operating in a two port configuration for: transmitting a plurality of microwave
signals through the fluid mixture at a first predetermined frequency selected from 5-
5.7 GHz frequency range; and receiving a plurality of reflected microwave signals
at a first altered frequency.
4. The multiphase flow metering system (100) of claim 1, wherein the second mi-
crowave sensor system (110) includes a second loop antenna (116) placed on an
142

inner wall of the rectangular cavity structure (106), the second loop antenna (116)
being capable of operating in a two port configuration for: transmitting a plurality of
microwave signals through the fluid mixture at a second predetermined frequency
selected from 1-1.25 GHz frequency range; and, receiving a plurality of reflected
microwave signals at a first altered frequency.
5. The multiphase flow metering system (100) of claim 3, wherein the first loop an-
tenna placed on the inner wall of the cylindrical cavity structure (104) creates res-
onance at a resonant frequency within the first predetermined frequency of 5-5.7
GHz for monitoring changes in permittivity of each of the constituents in the fluid
mixture.
6. The multiphase flow metering system (100) of claim 4, wherein the second loop
antenna placed on an inner wall of the rectangular cavity structure (106) creates
resonance at a resonant frequency within the second predetermined frequency of
1-1.25GHz for monitoring slight variations in permittivity with a change in temper-
ature of each of the constituents in the fluid mixture.
7. The multiphase flow metering system (100) of claim 1, wherein the computer sys-
tem (120) running the frequency analysis and multiphase flow metering application
analyzes the shift in the first altered frequency and the second altered frequency to
enable real-time continuous measurements of the relative volumetric proportions of
the plurality of constituents in the fluid mixture and temperature of the at least one
constituent in the fluid mixture passing through the pipe (118).
8. The multiphase flow metering system (100) of claim 1 is capable of determining
the relative volumetric proportions including water-air fraction, water-oil fraction
and oil-air fraction in the fluid mixture having the constituents in form of water, air
143

and oil.
9. A method of measuring at least one relative volumetric proportion of a plurality of
constituents in a fluid mixture passing through a pipe (118) comprising the steps
of: providing an apparatus (102) having a cylindrical cavity structure (104) with a
first microwave sensor system (108) non-intrusively placed around the pipe (118)
and a rectangular cavity structure (106) with a second microwave sensor system
(110) non-intrusively placed across the pipe (118); instructing the first microwave
sensor system (108) to transmit a plurality of microwave signals at a first prede-
termined frequency selected from 5-5.7 GHz frequency range in a longitudinal di-
rection through the fluid mixture, wherein the first microwave sensor system (108)
creates resonance at a first resonant frequency within 5-5.7 GHz; instructing the
second microwave sensor system (110) to transmit a plurality of microwave signals
at a second predetermined frequency selected from 1-1.25GHz frequency range
across the pipe (118) carrying the fluid mixture, wherein the second microwave
sensor system (110) creates resonance at a second resonant frequency within 1-
1.25GHz; receiving a plurality of reflected microwave signals using the first mi-
crowave sensor system (108) at a first altered frequency; receiving a plurality of
reflected microwave signals using the second microwave sensor system (110) at a
second altered frequency; calculating a shift in frequency in the first altered fre-
quency and the second altered frequency from the first resonant frequency and the
second resonant frequency, respectively, using a frequency analysis and multiphase
flow metering application; and presenting real-time continuous measurements of
the relative volumetric proportions of the plurality of constituents in the fluid mix-
ture and temperature of the at least one constituent in the fluid mixture based on the
shift in frequency.
144

10. The method of claim 9, wherein the first microwave sensor system (108) includes a
first loop antenna (114) and the second microwave sensor system (110) includes a
second loop antenna (116) operating in a two port configuration.
145

BRIEF DESCRIPTION OF THE DRAWINGS
These and other features, aspects, and advantages of the present invention will be-
come better understood, when the following detailed description is read with reference to
the accompanying drawings in which like characters represent like parts throughout the
drawings, wherein:
1. Figure 1 is a schematic diagram showing a multiphase flow metering system for
measuring the relative volumetric proportions and temperature of a number of con-
stituents present in a fluid mixture passing through a pipe, according to a preferred
embodiment of the present invention.
2. Figure 2 is a schematic diagram showing the apparatus utilized for determining the
relative volumetric proportions and temperature of the constituents present in the
fluid mixture passing through a pipe, according to a preferred embodiment of the
present invention.
3. Figure 3 shows a flowchart of a method of measuring the relative volumetric pro-
portion of the constituents in the fluid mixture passing through the pipe, according
to an embodiment of the present invention.
4. Figure 4 shows the comparison of air-water fractions in the fluid mixture passing
through the pipe, according to an embodiment of the present invention.
5. Figure 5 shows comparison of resonant frequency between experimental and sim-
ulation results and shows the frequency shift and amplitude change profile for each
of the air-water and oil-water fractions, according to an embodiment of the present
invention.
6. Figure 6 is a graph of S21 versus frequency at different temperature, which shows
the frequency and amplitude of 100% water in the pipe with different temperatures,
146

according to an embodiment of the present invention.
7. Figure 7 is a graph of frequency shift versus oil fraction increment that shows the
changes in peak frequency each of the 20% fraction increment of oil during the
detection of gas/oil using the second microwave sensor system in the rectangular
cavity structure, according to an embodiment of the present invention.
8. Figure 8 is a graph of frequency shift versus temperature change, in 100% water
fully filled pipe, according to an embodiment of the present invention.
147

ABSTRACT
A MULTIPHASE FLOW METERING SYSTEM FOR MEASURING CONSTITUENTS INA FLUID MIXTURE
The present invention relates to a multiphase flow metering system (100) and ap-
paratus (102) for measuring the relative volumetric proportions and temperature of con-
stituents in a fluid mixture passing through a pipe (118). The apparatus (102) includes
a cylindrical cavity structure (104) having a first microwave sensor system (108) with a
first loop antenna (114) is coaxially placed around the pipe (118) and a rectangular cavity
structure (106) having a second microwave sensor system (110) with a second loop an-
tenna (116) is vertically placed across the pipe (118). The first and the second microwave
sensor system (108, 110), both placed external to the pipe (118), transmits microwave
signals at a first and a second predetermined resonant frequencies. A computer system
(120) analyzes the shifts in frequencies, based on the permittivity and temperature of the
constituents, to identify the relative volumetric proportion of the constituents in real-time.
148

Most Illustrative Figure: Figure 1
Figure 1. Multiphase flow metering system measurement for the relative volumetricproportions and temperature
149

Figure 2. Apparatus utilized for relative volumetric proportions and temperaturedetection
150

Figure 3. Flowchart of the relative volumetric proportion measurement
151

Figure 4. Comparison of water-air fractions in the fluid mixture
152

Figure 5. Comparison of resonant frequency between experimental and simulationresults
153

Figure 6. Graph of S21 versus frequency at different temperature for 100% water
154

Figure 7. Graph of frequency shift versus oil fraction increment
155

Figure 8. Graph of frequency shift versus temperature change
156

APPENDIX C DUAL MICROWAVE CAVITY DRAWING
Cylindrical cavity 3D view
Figure 9. Cylindrical cavity 3D view
157

Cylindrical cavity front view
Figure 10. Cylindrical cavity front view
158

Cylindrical cavity top view
Figure 11. Cylindrical cavity top view
159

Cylindrical cavity side view
Figure 12. Cylindrical cavity side view
160
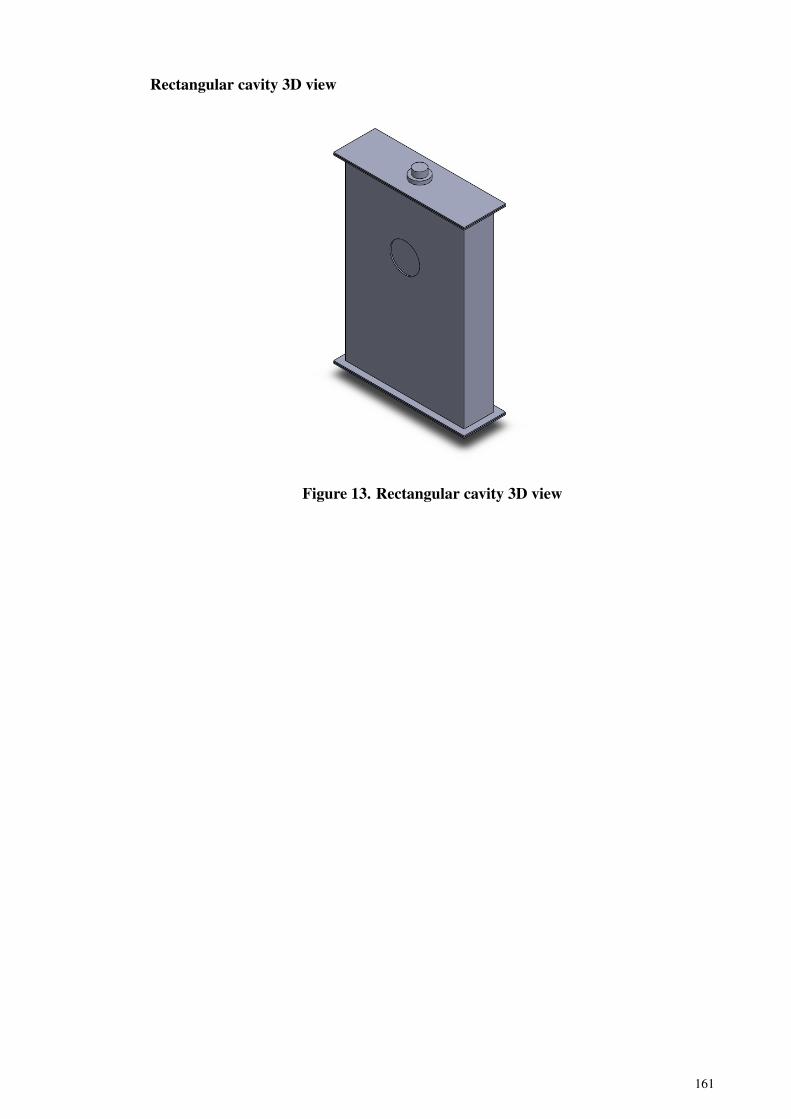
Rectangular cavity 3D view
Figure 13. Rectangular cavity 3D view
161
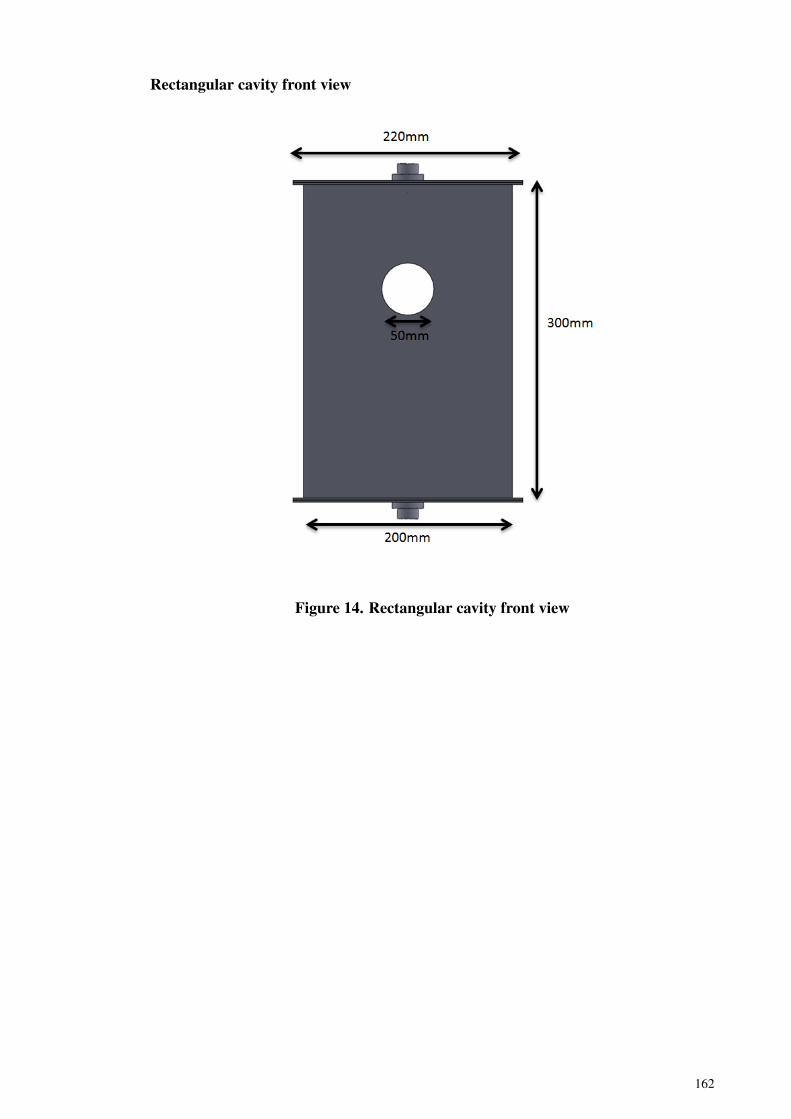
Rectangular cavity front view
Figure 14. Rectangular cavity front view
162

Rectangular cavity top view
Figure 15. Rectangular cavity top view
163

Rectangular cavity side view
Figure 16. Rectangular cavity side view
164

Antenna 3D view
Figure 17. Antenna 3D view
165

Antenna front view
Figure 18. Antenna front view
166

Antenna side view
Figure 19. Antenna side view
167

Dual microwave cavity sensor 3D view
Figure 20. Dual microwave cavity sensor 3D view
168

Dual microwave cavity sensor front view
Figure 21. Dual microwave cavity sensor front view
169

Dual microwave cavity sensor back view
Figure 22. Dual microwave cavity sensor back view
170

Dual microwave cavity sensor side view
Figure 23. Dual microwave cavity sensor side view
171

APPENDIX D LABVIEW
Labview data record front panel
Figure 24. Labview data record front panel
172

Data record block diagram (first half)
Figure 25. Data record block diagram (first half)
173

Data record block diagram (second half)
Figure 26. Data record block diagram (second half)
174

Labview data record and control front panel
Figure 27. Labview data record and control front panel
175

Data record and control block diagram (first half)
Figure 28. Data record and control block diagram (first half)
176

Data record and control block diagram (second half)
Figure 29. Data record and control block diagram (second half)
177