Embed Size (px)
Citation preview

2
Executive Summary This report provides information about the estimated number of unintentional non-fire deaths attributed to carbon monoxide (CO) poisoning that were associated with the use of consumer products in 2006 and companion statistics since 1999. The U.S. Consumer Product Safety Commission (CPSC) established a strategic goal to reduce the CO poisoning mortality rate associated with the use of consumer products by 20 percent from the 1999-2000 average rate by the year 2013. It should be noted that CPSC staff continues to receive reports of CO poisoning fatalities and the estimates may change in subsequent reports. Some of the key findings in this report are:
For 2006: • There were an estimated 180 unintentional non-fire CO poisoning deaths associated with
consumer products under CPSC’s jurisdiction. The estimated annual average from 2004-2006 was 181 deaths.1
• Engine-Driven Tools were associated with the largest percentage of non-fire CO poisoning fatalities at 58 percent (104 deaths). Heating Systems-related CO fatalities were associated with 28 percent (50 deaths) and five of the remaining six product categories [Charcoal Grills or Charcoal (10 deaths), Gas Water Heaters (4 deaths), Gas Grills, Camp Stoves, Lanterns (4 deaths), Other Appliances (1 deaths), and Multiple Appliances (7 deaths)] combined were associated with a total of 14 percent. There were no reported deaths in the Gas Ranges/Ovens category.
Generators: • Of the estimated 104 CO fatalities in 2006 that were associated with Engine-Driven
Tools, 82 percent (85 deaths) involved generators. Additionally, generator usage was associated with three of the estimated seven multiple appliance CO poisoning fatalities.
• The estimated number of generator-related CO fatalities doubled in 2005 and 2006 from
the two prior years with an estimated 182 fatalities combined in 2005 and 2006 compared to an estimated 92 in 2003 and 2004.
• Much of the increase in generator-related CO fatalities in 2005 may be attributable to the
unusually severe weather which knocked out power to a large number of consumers who then turned to generators as an alternative power source. Nearly half of the generator-related CO fatalities in 2005 were associated with power outages caused by weather conditions. In 2006, only 19 percent of the generator-related CO fatalities were associated with severe weather-caused power outages.
1 Not all of these fatalities are addressable by an action the CPSC could take; however, it was not the purpose of this report to evaluate the addressability of the incidents but rather to update the estimates of the number of consumer product associated CO poisoning deaths.
3
• Non-weather related CO fatalities associated with the use of generators increased by 53 percent (32 to 49) from 2004 to 2005, and another 41 percent (49 to 69) from 2005 to 2006.
Heating Systems: • Of the estimated 50 Heating Systems-related fatalities in 2006, 90 percent involved gas
heating. Natural gas heating accounted for 46 percent of heating system-related fatalities, liquefied petroleum (LP or propane) gas heating accounted for 38 percent, and an additional six percent were only identified as unspecified gas heating. Kerosene/oil heating and unspecified heating systems accounted for the remaining eight percent.
Location/Demographics: • Seventy-one percent of the estimated 180 CO deaths in 2006 occurred in a home; while
an estimated 17 percent of deaths occurred in tents, campers, and other temporary shelters.
• In 2006, adults between 25 and 44 represented 34 percent of the estimated number of CO
poisoning deaths while adults between 45 and 64 years of age represented another 32 percent. Adults 25 years of age and older represented 85 percent and three percent of the estimated CO fatalities were children under 15 years old.
• In 2006, 79 percent of CO poisoning victims were males and 21 percent were females.
• Country of origin does not appear to be a significant factor in CO poisoning deaths. From 2004 through 2006, 86 percent of all non-fire CO poisoning victims were born in the United States while approximately 87 percent of the U.S. population were born in the U.S.
• There appears to be a disproportionate number of Black or African American victims of CO poisoning comprising 18 percent of all CO poisoning fatalities in 2004 through 2006 even though the Blacks or African Americans represent only about 12 percent of the U.S. population.
• CO poisoning fatalities in isolated locations account for a larger proportion of all CO fatalities (13% in 2004 through 2006) than the proportion of the U.S. population living in isolated areas (4%). The disparity is even higher at isolated non-home locations which account for 25 percent of all CO fatalities occurring at non-home locations.
Historical Data: • There is a statistically significant increasing trend in consumer product-related non-fire
CO fatalities from 1999 to 2006 that is attributable to generators.
• The CO poisoning three-year average mortality rate for 2004 through 2006 associated with consumer products (6.13 per 10 million population) has increased 40 percent from the 1999/2000 average of 4.38 per 10 million population. However, for non-engine-driven tool products, the mortality rate has decreased by 16 percent since 1999/2000, from 3.67 in 1999/2000 down to a 3.08 average mortality rate in 2004 through 2006. The

4
increase in the mortality rate of consumer product related CO poisoning is due to a quadrupling in the mortality rate of CO poisonings from engine-driven tools during the same time period (0.71 in 1999/2000 up to 3.06 average for 2004 through 2006). Details are given in Appendix B of this report.

5
Introduction Carbon monoxide (CO) is a colorless, odorless, and poisonous gas that results from the incomplete combustion of fuels such as natural or liquefied petroleum (LP) gas, gasoline, oil, wood, coal, and other fuels. The health effects related to CO depend upon its concentration in blood, which in turn depends on its concentration in air, the duration of exposure, and each individual’s general health. Carbon monoxide combines with hemoglobin (Hb) with an affinity about 250 times that of oxygen, forming carboxyhemoglobin (COHb) and interfering with oxygen transport, delivery, and utilization. Generally, there are no perceptible health effects or symptoms in healthy individuals at COHb levels below 10 percent. Symptoms associated with blood levels at or above 10 percent COHb include headache, fatigue, nausea, and cognitive impairment. Loss of consciousness, coma, and death can occur at COHb levels greater than 20 percent, although for healthy adults CO fatalities typically require levels above 50 percent COHb2. Some symptoms of CO poisoning may mimic common illnesses, such as influenza or colds; thus, there likely is a high incidence of initial misdiagnosis by physicians and victims (Long and Saltzman, 1995). Patients are frequently unaware of exposures, and health care providers may not always consider CO poisoning as a cause of such non-specific symptoms. COHb formation is reversible, as are some clinical symptoms of CO poisoning. However, some delayed neurological effects that develop following severe poisonings, especially those involving prolonged unconsciousness, may not be reversible. Prompt medical attention is important to reduce the risk of permanent damage. Any fuel-burning appliance can be a potential source of fatal or hazardous CO levels. Fuels, such as natural and LP gas, kerosene, oil, coal, and wood can produce large amounts of CO when there is insufficient oxygen available for combustion. Consumer products that burn kerosene, oil, coal, or wood (such as wood stoves, oil boilers, and kerosene heaters) produce an irritating smoke that can alert the victim to a potentially hazardous situation. Engine-driven tools powered by gasoline engines produce large amounts of CO even when they are run where there is sufficient oxygen available for combustion yet they may not emit an irritating exhaust smoke. Other fuels, such as charcoal briquettes and pressed wood-chip logs, produce relatively smokeless fires, even at times of inefficient combustion. In these cases, victims receive no obvious sensory warning that high CO levels are present. Another hazard scenario is present when gas appliances are not vented properly or are malfunctioning. Natural and LP gas burn more efficiently and cleanly compared with other forms of fuel. In circumstances of poor maintenance, inadequate ventilation, or faulty exhaust pathways, natural and LP gas appliances may emit potentially lethal amounts of CO without any irritating fumes. Again, many victims may be unaware of a potential problem.
2 Inkster S.E. Health hazard assessment of CO poisoning associated with emissions from a portable, 5.5 kilowatt, gasoline-powered generator. Washington, D.C.: U.S. Consumer Product Safety Commission. 2004.

6
National Estimates of Non-Fire CO Poisoning Deaths Associated with Consumer Products During 2006, there were an estimated 180 carbon monoxide (CO) poisoning deaths associated with the use of a consumer product under the jurisdiction of the U.S. Consumer Product Safety Commission (CPSC). The estimates presented in this report are based on nearly complete reporting of consumer product-related CO poisoning fatalities which occurred in 2006. The National Center for Health Statistics (NCHS) has records of every death certificate filed in the United States and its territories. A comparison of CPSC records to NCHS records indicates that CPSC records have data on approximately 90 percent of all the CO poisoning cases which occurred in 2006 in the United States. Therefore, CPSC staff anticipates data obtained in the future may change the estimates, but are not likely to have a large impact. In 2006, all CPSC records of non-fire consumer product CO poisoning fatalities were contained within the NCHS records. This indicates that the differences in the number of fatalities between the two databases are due to a small number of records missing from the CPSC database. Carbon monoxide poisonings referred to in this report do not include those where the CO gas resulted from a fire or a motor vehicle, were intentional in nature, or were directly work-related.
Although there can be multiple factors contributing to a CO poisoning fatality, the source of CO is virtually always a fuel-burning product. As mentioned earlier, poor product maintenance by professionals or consumers, inadequate ventilation, faulty exhaust pathways, and poor user judgment in operating these products can result in fatal scenarios. It should be noted that CPSC staff produces the CO estimates by associated consumer products in order to identify product groups involved in fatal CO scenarios and to monitor this distribution over time. It is within the individual, product-specific CPSC projects that further analysis is done to consider whether improvements are warranted in the areas of product design, ventilation safeguards, or user information and education.
The annual CO estimates for the years 1999 through 2006 are presented in two formats:
by product type (Table 1) and by product within fuel type (Table 2). The data are presented as yearly estimates for each of the eight years covered by this report and as an average of the most recent three year period (2004 through 2006). Data collection is nearly complete for 2006 at this time. Estimates for this year may change in the future if additional data become available and are, therefore, reported using italic font in the tables.
Table 1 presents the consumer product distribution of CO poisoning deaths. The estimate
for Heating Systems, historically a large percentage of the consumer product estimate, is further distributed among the various fuel types. Fatality estimates for the Engine-Driven Tools category were further distributed between generators and other engine-driven tools. The consumer product estimate and product distributions were derived using the methodology described in Appendix A.
Of the estimated 180 CO poisoning deaths associated with a consumer product that occurred between January 2006 and December 2006, Heating Systems were associated with 50 deaths (28% of the total consumer product estimate). Of the 50 deaths associated with heating systems, the majority (90% or 45 fatalities) involved gas heating systems. Among gas heating

7
systems, natural gas heating was associated with an estimated 23 deaths (46% of heating system-related deaths), LP gas heating was associated with an estimated 19 deaths (38% of heating system-related deaths), and unspecified gas heating was associated with an estimated three deaths (6% of heating system-related deaths). Kerosene/oil heating was associated with an estimated three deaths (6% of heating system-related deaths). There are no reported coal/wood heating system or diesel-fueled heating system fatalities in the 2006 data. An additional estimated one death was associated with a heating system, not specified (2% of heating system-related deaths).
Table 1
Estimated Non-Fire Carbon Monoxide Poisoning Deaths by Associated Fuel-Burning Consumer Product, 1999-2006.
Consumer Product
2004 - 2006+ Annual Estimate Average Estimate
Average Percent 1999 2000 2001 2002 2003 2004 2005+ 2006+
Total Deaths 181 100% 109 137 122 181 154 167 197 180 Heating Systems 63 35% 50 81 72 97 66 87 53 50 Unspecified Gas Heating 8 4% 5 1 5 2 4 14 6 3 LP Gas Heating 22 12% 22 28 24 41 22 28 20 19 Natural Gas Heating 20 11% 20 42 28 32 27 30 8 23 Coal/Wood Heating 2 1% * 2 6 4 2 4 3 * Kerosene/Oil Heating 4 2% 2 8 6 8 6 4 4 3 Diesel Fuel Heating * * * * * 1 * * * * Heating Systems, Not Specified 6 3% 1 * 3 9 5 6 12 1 Charcoal Grills or Charcoal 6 3% 17 8 10 11 8 3 6 10 Gas Water Heaters 4 2% 1 3 1 1 7 2 6 4 Gas Grills, Camp Stoves, Lanterns 6 3% 14 4 1 5 2 8 6 4 Gas Ranges/Ovens 3 2% 6 12 9 3 3 4 6 * Other Appliances 1 1% 1 * * * 2 1 2 1 Multiple Appliances 7 4% 6 2 7 12 8 4 9 7 Engine-Driven Tools 90 50% 13 27 22 51 57 57 111 104 Generators 75 41% 7 19 21 41 50 42 97 85 Other Engine-Driven Tools 16 9% 6 8 1 10 7 15 13 18 + Data collection for 2005 and 2006 is nearly complete. Italicized estimates may change in the future if more reports of fatalities are received. * No reports received by CPSC staff. Source: U.S. Consumer Product Safety Commission / EPHA. CPSC Death Certificate File, CPSC Injury or Potential Injury Incident File, CPSC In-Depth Investigation File, National Center for Health Statistics Mortality File, 1999 - 2006. Note: Reported annual estimates and estimated averages and percentages may not add to subtotals or totals due to rounding.
Of the estimated 19 deaths in 2006 that were associated with LP gas heating systems, 11
(58%) involved unvented portable propane heaters. These unvented portable propane heaters were fueled by a propane tank and were not a component of an installed heating system. Unvented portable propane heaters were either camping heaters that used disposable propane tanks, one pound propane bottles, or tank top heaters that used bulk tanks larger than one pound.

8
In 2006, an estimated 10 CO deaths (6% of the 180 total consumer product estimate) were associated with charcoal or charcoal grills; an estimated four deaths (2% of the total consumer product estimate) were associated with gas water heaters; an estimated four deaths (2% of the total consumer product estimate) were associated with a subcategory of products which include gas grills, camp stoves, and lanterns; and one death was either associated with a consumer product that did not fit into the categories given above or there was insufficient detail to categorize the appliance involved. This latter incident involved the use of a grill inside a house, but it is unclear whether the grill was a gas grill or a charcoal or wood burning grill. This incident was categorized as Other Appliances. Additionally, in 2006, an estimated seven deaths were associated with multiple appliances (4% of the total consumer product estimate). The Multiple Appliances category includes all incidents where multiple fuel-burning products were used simultaneously such that a single source of the CO could not be determined. Of the estimated seven multiple appliance fatalities, three were associated with the simultaneous use of a gasoline-fueled generator and an LP heater. Of the estimated seven multiple appliance fatalities, six were associated with some type of LP heater.
An estimated 104 CO poisoning deaths (58% of the estimated total from 2006) were
associated with the category of Engine-Driven Tools, which includes generators, riding mowers or garden tractors, pressure washers, a snowmobile, a snow thrower, an air compressor, a water pump, and a non-vehicular internal compression engine. The only detail obtained on the latter product was that it was a small, non-vehicular engine that the victim was working on. It is not clear if this engine was part of a riding mower, a generator, or some other consumer product. Generator associated deaths comprise the majority of this category. There were an estimated 85 generator-related CO poisoning deaths in 2006 (82% of all engine-driven tool fatalities and nearly half (47%) of the total consumer product estimate). This is the second consecutive year that there were more CO fatalities associated with engine-driven tools than with heating systems.
Table 1 shows the estimated average annual number of CO poisoning deaths associated
with a consumer product for 2004-2006. The average yearly total number of CO deaths for this three-year period is estimated to be 181 (with a standard error of approximately 8.7). The 95 percent confidence interval+ for this estimated average ranged from 144 to 219 deaths. Appendix B contains a graph and the data point values for the annual estimates of CO poisoning deaths associated with a consumer product for 1980 through 2006.
Detailed information regarding the conditions of products associated with fatalities was
not reliably collected, and the availability of such information in the CPSC’s files varied widely. However, information collected often did describe conditions regarding compromised vent systems, flue passageways, and chimneys for furnaces, boilers, and other heating systems. Vent systems include the portion of piping that connects the flue outlet of the appliance and exhausts air to the outside through a ceiling or sidewall, or connects to a chimney. Some vented products had vents that became detached or were improperly installed or maintained. Vents were also sometimes blocked by soot caused by inefficient combustion, which in turn may have been caused by several factors, such as leaky or clogged burners, an over-firing condition, or inadequate combustion air.
+ Confidence interval based on a t-distribution with two degrees of freedom.

9
Other conditions related to furnaces included compromised heat exchangers or filter doors or covers that were removed or not sealed. Some products were old and apparently poorly maintained such that there were several factors involved in generating and exacerbating the amount of CO produced. Other incidents mentioned a backdraft condition, large amounts of debris in the chimney, and the use of a product that was later red-tagged by the utility company (taken out of commission by the utility company and not to be turned on until repaired).
Table 2 organizes the estimates by product within fuel type. The three major fuel types
include Gas Fueled Appliances (natural gas and liquid petroleum [LP or propane] gas); Solid Fueled Appliances (charcoal, coal, and wood); and Liquid Fueled Appliances (gasoline, kerosene, and oil). Of these fuel types, Gas Fueled Appliances were associated with 54 of the 180 (30%) estimated CO fatalities in 2006. Solid Fueled Appliances and Liquid Fueled Appliances were associated with 10 (6%) and 106 (59%) estimated fatalities in the same time period, respectively. An additional seven (4%) fatalities were associated with multiple products and there were two (1%) fatalities associated with consumer products where the fuel type was unknown.
In the Gas Fueled Appliances category, the vast majority of CO fatalities in 2006 were
associated with heating-related products. Of the estimated 54 gas fueled appliance fatalities in 2006, 45 (83%) were associated with heating systems or heaters. In 2006, all of the estimated 10 fatalities in the Solid Fueled Appliances category were associated with charcoal or charcoal grills. Of the estimated 106 liquid fueled appliance-related fatalities in 2006, 103 (97%) were associated with engine-driven tools (generators, lawn mowers/garden tractors, power washers, etc.). Generators accounted for 85 of the estimated 106 fatalities (80%) in the Liquid Fueled Appliances category for 2006.

10
Table 2 Estimated Non-Fire Carbon Monoxide Poisoning Deaths
Associated with Consumer Products Organized by Fuel Type, 1999-2006.
Consumer Product
2004-2006+ Annual Estimate Average Estimate
Average Percent
1999 2000 2001 2002 2003 2004 2005+ 2006+
Total Deaths 181 100% 109 137 122 181 154 167 197 180 Gas Fueled Appliances 69 38% 67 91 71 92 72 91 63 54 Room / Space Heater 26 14% 20 39 23 35 30 35 29 13 Natural Gas Fueled 4 2% 3 17 5 9 8 8 3 1 Propane Fueled 16 9% 16 21 17 21 19 20 19 10 Other / Unspecified 6 3% 1 1 1 5 3 8 7 2 Furnace 30 17% 25 33 37 48 28 43 15 32 Natural Gas Fueled 16 9% 16 25 23 24 19 23 4 22 Propane Fueled 6 3% 6 8 7 20 3 8 1 9 Other / Unspecified 8 4% 3 * 7 4 6 13 10 1 Range, Oven 3 2% 6 12 9 3 3 4 6 * Water Heater 4 2% 1 3 1 1 7 2 6 4 Refrigerator 0 0% 1 * * * 1 * 1 * Lantern 4 2% 8 3 * 2 1 4 6 3 Gas Grill, Camp Stove 1 1% 5 1 1 3 1 2 * 1 Other 0 0% 1 * * * 1 * 1 * Solid Fueled Appliances 9 5% 17 10 16 15 10 8 10 10 Charcoal / Charcoal Grill 6 3% 17 8 10 11 8 3 6 10 Wood / Coal Heater 3 2% * 2 6 4 2 4 4 * Coal Furnace 0 0% * 1 1 1 * 1 * * Wood / Coal Stove 1 1% * 1 5 1 2 1 3 * Chimney / Fireplace 1 1% * * * 2 * 2 1 * Liquid Fueled Appliances 94 52% 16 34 28 59 63 62 115 106 Oil Heater / Heating 2 1% * 4 5 3 1 * 2 1 Kerosene Heater / Heating 3 2% 2 3 1 4 5 5 2 2 Generators 75 41% 7 19 21 41 50 42 97 85 Other Engine-Driven Tools 15 8% 6 8 1 10 7 15 13 18 Lantern / Product / Appliance * * 1 1 * 1 * * * * Other Appliance – Fuel Unspecified 1 1% * * * * * * * 2 Multiple Products Involved 7 4% 7 2 8 13 8 5 9 7 + Data collection for 2005 and 2006 is nearly complete. Italicized estimates may change in the future if more reports of fatalities are received. * No reports received by CPSC staff. Source: U.S. Consumer Product Safety Commission / EPHA. CPSC Death Certificate File, CPSC Injury or Potential Injury Incident File, CPSC In-Depth Investigation File, National Center for Health Statistics Mortality File, 1999 - 2006. Note: Reported annual estimates and estimated averages and percentages may not add to subtotals or totals due to rounding.

11
Table 3 shows a breakdown of the fatality estimates for the eight-year period from 1999 through 2006 in the Engine-Driven Tools category. During 2006, engine-driven tools were associated with an estimated 104 carbon monoxide poisoning deaths (58% of the total consumer product estimate). Eighty-five of these 104 engine-driven tool-related CO poisoning deaths (82%) were associated with generators, and 18 were associated with the classification Other Engine-Driven Tools. In 2006, the other engine-driven tool-related fatalities included an estimated 11 deaths that were associated with lawn mowers (this includes riding mowers, garden tractors, and gas-fueled powered push mowers), and one death each associated with a power washer, a snowmobile, a snow blower, an air compressor, a water pump, and a small non-vehicular engine of unknown usage.
Table 3
Estimated Non-Fire Carbon Monoxide Poisoning Deaths Associated with Engine-Driven Tools, 1999-2003 vs. 2004-2006.
Engine-Driven Tools
1999-2003 2004-2006+ Annual Estimate
Average Estimate
Average Estimate
1999 2000 2001 2002 2003 2004 2005+ 2006+
Total 34 90 13 27 22 51 57 57 111 104 Generators 28 75 7 19 21 41 50 42 97 85 Other Engine-Driven Tools 6 15 6 8 1 10 7 15 13 18 Lawn Mowers1 5 9 6 7 1 5 6 9 8 11 Gas Welder 1 * * * * 2 1 * * * Concrete Saw 0 0 * * * 1 * 1 * * Power Washer * 2 * * * * * 2 3 1 ATV 0 1 * * * 1 * 1 1 * Snowmobile 0 0 * * * 1 * * * 1 Small Engine 0 0 * * * 1 * * * 1 Snow Blower 0 1 * 1 * * * * 1 1 Air Compressor 0 1 * * * * * 1 * 1 Water Pump * 1 * * * * * 1 * 1 1 Lawn Mowers includes riding mowers, garden tractors and gas-fueled powered push mowers. + Data collection for 2005 and 2006 is nearly complete. Italicized estimates may change in the future if more reports of fatalities are received. * No reports received by CPSC staff. Source: U.S. Consumer Product Safety Commission / EPHA. CPSC Death Certificate File, CPSC Injury or Potential Injury Incident File, CPSC In-Depth Investigation File, National Center for Health Statistics Mortality File, 1999 - 2006. Note: Reported annual estimates and estimated averages and percentages may not add to subtotals or totals due to rounding.
As can be seen in Table 3, the estimated numbers of fatalities associated with engine-driven tools increased dramatically from 1999 to 2006. The estimated annual average number of CO deaths from generators for the period of 2004-2006 is nearly triple that of the annual average from 1999-2003 and has more than doubled for other engine-driven tools. From 1999 to 2006, the number of CO fatalities associated with consumer products appears to be increasing. Regression analysis confirms this observation (p-value = 0.0074). Yet, if the generator fatalities are removed from the totals for all products, the apparent trend disappears (regression analysis p-value = 0.6467). When looked at separately, a regression analysis confirms a statistically significant upward trend in generator-related CO fatalities (p-value = 0.0009). In 1999, generator-related CO fatalities accounted for only six percent (7 of 109 estimated fatalities) of all

12
consumer product-related CO fatalities. In 2006, the percentage had risen to 47 percent (85 of 180). Figure 1 provides a graphic representation of the CO fatality trends related to all consumer products, related to generators alone, and related to non-generator products.
Figure 1: Comparison of Trends in Consumer Product-Related Deaths – 1999 to 2006
0
20
40
60
80
100
120
140
160
180
200
1999 2000 2001 2002 2003 2004 2005 2006
generator non-generator All products
The number of CO fatalities associated with the use of generators has doubled in the two
most recent years of this report (2005 and 2006) over the previous two years, increasing from an estimated 92 fatalities (50 in 2003 and 42 in 2004) to 182 (97 in 2005 and 85 in 2006). Much of this increase in 2005 may be attributable to the unusually severe weather which knocked out power to a large number of consumers who then turned to generators as an alternative power source. Nearly half of the generator-related CO fatalities in 2005 (an estimated 48 of 97, 49%) were associated with power outages caused by weather conditions. An estimated 27 generator-related CO fatalities were associated with five hurricanes which affected primarily Florida, Louisiana, and Texas (Hurricanes Katrina, Rita, Wilma, Dennis, and Isabelle). In addition to the severe hurricane season, there were also an estimated 21 generator-related CO fatalities associated with ice storms, including major storms in the Midwest (January) and the Carolinas and Georgia (December). An additional CO fatality in the ice storm in Georgia was associated

13
with multiple products including a generator. By contrast, in 2006, a year with apparently milder weather, only an estimated 16 of 85 (19%) of the generator-related CO fatalities were associated with severe weather-caused power outages. The two most common reasons for using a generator, outside of weather-related power outages, are that the structure being powered did not have utility service, such as a shed or remote cabin, or due to power disconnection by the utility company because of billing disputes. Non-weather-related CO fatalities associated with the use of generators increased by 53 percent (32 to 49) from 2004 to 2005, and another 41 percent (49 to 69) from 2005 to 2006.
Lawnmowers were associated with the majority of the deaths in the Other Engine-Driven Tools category for the eight-year period. There was an estimated average of nine lawnmower-related CO fatalities per year in 2004-2006 and five in 1999-2003. CO fatalities related to power washer usage was the next largest subcategory with an estimated six deaths from 2004-2006 (an average of two per year) while there were no reports of CO fatalities from this product in the 1999-2003 period.
Table 4 shows that in 2006, 76 percent of fatal CO incidents reported to the CPSC
involved a single death. Table 4 accounts for only the fatally injured victims in each CO poisoning incident. It is not uncommon for CO incidents involving one or more fatalities to also result in one or more non-fatal CO poisoning injuries, but they were not quantified for analysis in this report. It should be noted that these are the incidents reported in CPSC databases and do not represent the national estimates of fatalities per CO incident. Death certificates do not include information about other fatalities for the same incident. The number of fatalities for a particular incident are based on CPSC In-Depth Investigation files and may include fatalities for which CPSC staff does not have death certificates. Some additional multiple fatality incidents were identified by matching date of death and location of death on death certificates.
Table 4
Number of Carbon Monoxide Poisoning Incidents Reported to CPSC by Number of Deaths Per Incident, 1999-2006.
Number of Deaths Reported in
Incident
2004-2006+ Annual Incidents Annual Average
Average Percent
1999 2000 2001 2002 2003 2004 2005+,3 2006+
Total Incidents 131 100% 79 104 89 131 122 124 145 123 1 105 80% 64 82 72 103 97 102 120 94 2 18 14% 14 19 15 23 22 14 20 21 3 6 5% * 2 2 1 2 7 4 6 4 1 1% 1 * * 2 * 1 * 2
5 or more 1 1% * 1 * 2 1 * 1 * + Data collection for 2005 and 2006 is nearly complete. Italicized estimates may change in the future if more reports of fatalities are received. * No incident reports received by CPSC staff for this time period. Source: U.S. Consumer Product Safety Commission / EPHA. CPSC Death Certificate File, CPSC In-Depth Investigation File, CPSC Injury or Potential Injury Incident File, 1999 - 2006. Note 1: Reported annual estimates and estimated averages and percentages may not add to subtotals or totals due to rounding. Note 2: Data in Table 4 do not add to totals presented in Table 1. Data presented in Table 4 are not national estimates derived from NCHS totals, but reported deaths contained in the CPSC files. NCHS data do not contain enough detail to identify multiple victims of the same CO poisoning incident. These figures include fatalities reported in CPSC In-Depth Investigation files for which CPSC may not have a death certificate. Note 3: 2005 data include two cases where there were two CO fatalities but only one was considered in scope for this report due to the work-related nature of the incident (one worker, one non-worker). These incidents are identified in this table as a 2-death incident.
14
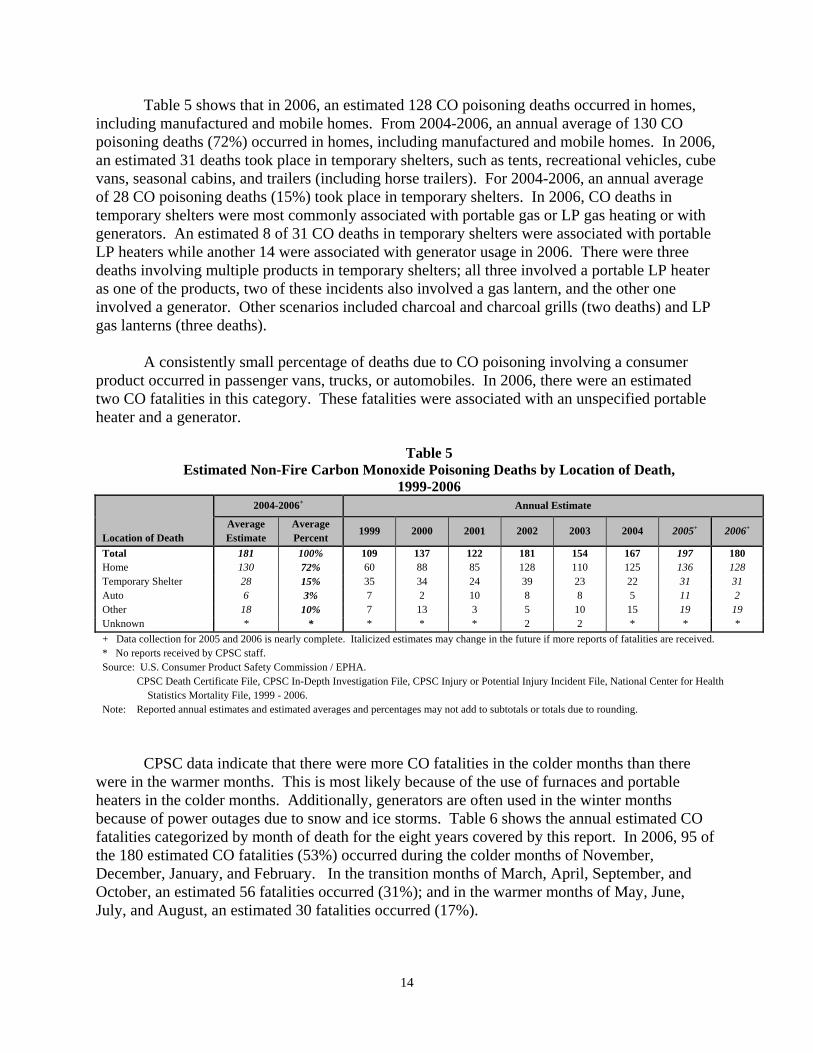
Table 5 shows that in 2006, an estimated 128 CO poisoning deaths occurred in homes, including manufactured and mobile homes. From 2004-2006, an annual average of 130 CO poisoning deaths (72%) occurred in homes, including manufactured and mobile homes. In 2006, an estimated 31 deaths took place in temporary shelters, such as tents, recreational vehicles, cube vans, seasonal cabins, and trailers (including horse trailers). For 2004-2006, an annual average of 28 CO poisoning deaths (15%) took place in temporary shelters. In 2006, CO deaths in temporary shelters were most commonly associated with portable gas or LP gas heating or with generators. An estimated 8 of 31 CO deaths in temporary shelters were associated with portable LP heaters while another 14 were associated with generator usage in 2006. There were three deaths involving multiple products in temporary shelters; all three involved a portable LP heater as one of the products, two of these incidents also involved a gas lantern, and the other one involved a generator. Other scenarios included charcoal and charcoal grills (two deaths) and LP gas lanterns (three deaths).
A consistently small percentage of deaths due to CO poisoning involving a consumer
product occurred in passenger vans, trucks, or automobiles. In 2006, there were an estimated two CO fatalities in this category. These fatalities were associated with an unspecified portable heater and a generator.
Table 5
Estimated Non-Fire Carbon Monoxide Poisoning Deaths by Location of Death, 1999-2006
Location of Death
2004-2006+ Annual Estimate
Average Estimate
Average Percent
1999 2000 2001 2002 2003 2004 2005+ 2006+
Total 181 100% 109 137 122 181 154 167 197 180 Home 130 72% 60 88 85 128 110 125 136 128 Temporary Shelter 28 15% 35 34 24 39 23 22 31 31 Auto 6 3% 7 2 10 8 8 5 11 2 Other 18 10% 7 13 3 5 10 15 19 19 Unknown * * * * * 2 2 * * * + Data collection for 2005 and 2006 is nearly complete. Italicized estimates may change in the future if more reports of fatalities are received. * No reports received by CPSC staff. Source: U.S. Consumer Product Safety Commission / EPHA. CPSC Death Certificate File, CPSC In-Depth Investigation File, CPSC Injury or Potential Injury Incident File, National Center for Health Statistics Mortality File, 1999 - 2006. Note: Reported annual estimates and estimated averages and percentages may not add to subtotals or totals due to rounding.
CPSC data indicate that there were more CO fatalities in the colder months than there were in the warmer months. This is most likely because of the use of furnaces and portable heaters in the colder months. Additionally, generators are often used in the winter months because of power outages due to snow and ice storms. Table 6 shows the annual estimated CO fatalities categorized by month of death for the eight years covered by this report. In 2006, 95 of the 180 estimated CO fatalities (53%) occurred during the colder months of November, December, January, and February. In the transition months of March, April, September, and October, an estimated 56 fatalities occurred (31%); and in the warmer months of May, June, July, and August, an estimated 30 fatalities occurred (17%).

15
Table 6 Estimated Non-Fire Carbon Monoxide Poisoning Deaths by
Month of Year of the Fatality, 1999-2006.
Location of Death
2004-2006+ Annual Estimate
Average Estimate
Average Percent
1999 2000 2001 2002 2003 2004 2005+ 2006+
Total 181 100% 109 137 122 181 154 167 197 180 Cold Months 99 55% 60 88 87 93 95 105 97 95 November 21 12% 7 28 14 27 32 24 17 23 December 33 18% 16 32 23 26 29 28 34 38 January 28 15% 28 17 28 20 22 34 38 12 February 16 9% 9 11 22 20 12 19 9 21 Transition Months 55 31% 31 31 30 69 37 41 69 56 March 17 9% 17 9 5 30 8 11 20 19 April 11 6% 2 3 13 9 12 8 10 16 September 15 8% 6 7 5 4 8 14 23 7 October 13 7% 6 12 7 26 9 9 15 14 Warm Months 27 15% 18 18 7 19 20 20 31 30 May 5 3% 3 7 5 4 3 3 4 9 June 7 4% 5 3 * 5 7 8 9 3 July 7 4% 5 5 * 2 6 5 11 4 August 8 4% 5 3 2 8 4 4 7 13 + Data collection for 2005 and 2006 is nearly complete. Italicized estimates may change in the future if more reports of fatalities are received. * No reports received by CPSC staff. Source: U.S. Consumer Product Safety Commission / EPHA. CPSC Death Certificate File, CPSC In-Depth Investigation File, CPSC Injury or Potential Injury Incident File, National Center for Health Statistics Mortality File, 1999 - 2006. Note: Reported annual estimates and estimated averages and percentages may not add to subtotals or totals due to rounding.
Demographics of Fatalities from Non-Fire Carbon Monoxide Poisoning Associated with the Use of Consumer Products
Table 7 shows the estimated number of CO poisoning fatalities categorized by victim age
for the eight most recent years of data (1999-2006). From the summary, it appears that consumer product-related CO fatalities are skewed toward older individuals. For the three most recent years (2004-2006), children less than 15 years of age accounted for an annual average of six percent (an estimated 10 of 181) of the yearly CO poisoning deaths while this age group makes up about 20 percent of the U.S. population. The annual average percentage of deaths represented by adults 45 years and older was 58 percent in 2004-2006 while only about 37 percent of the U.S. population is over 45 year old. In 2004-2006, adults aged 65 years and older accounted for an annual average percentage of 20 percent of CO poisoning fatalities though this age group is about 12 percent of the U.S. population3.
3 U.S. Census Bureau, Statistical Abstract of the United States: 2009.

16
Table 7 Estimated Non-Fire Carbon Monoxide Poisoning Deaths by Age of Victim,
1999-2006.
Age
2004-2006+ Estimated Percentage of
US Population#
Annual Estimate
Average Estimate
Average Percent
1999 2000 2001 2002 2003 2004 2005+ 2006+
Total 181 100% 100% 109 137 122 181 154 167 197 180 Under 5 2 1% 7% * 3 3 2 6 4 * 2 5 – 14 8 4% 13% 7 3 6 9 9 11 10 3 15 – 24 14 8% 14% 8 10 16 11 17 4 17 21 25 – 44 51 28% 28% 32 42 23 57 47 44 49 61 45 – 64 69 38% 25% 45 56 40 51 55 64 86 58 65 and over 36 20% 12% 16 23 33 51 20 39 35 34 + Data collection for 2005 and 2006 is nearly complete. Italicized estimates may change in the future if more reports of fatalities are received. * No reports received by CPSC staff. # Based on estimated 2006 U.S. population statistics. Source: U.S. Consumer Product Safety Commission / EPHA. CPSC Death Certificate File, CPSC In-Depth Investigation File, CPSC Injury or Potential Injury Incident File, National Center for Health Statistics Mortality File, 1999 - 2006. U.S. Census Bureau, Statistical Abstract of the United States: 2009. Note: Reported annual estimates and estimated averages and percentages may not add to subtotals or totals due to rounding.
In 2006, 79 percent of CO poisoning victims were males and 21 percent were females.
This percentage has varied slightly from year to year but was relatively consistent in recent years. Over the 1999-2006 time span, the average percentage of male CO victims was 74 percent and the average percentage of female victims was 26 percent. By contrast, about 49 percent of the U.S. population are male and 51 percent are female4.
Information regarding the CO poisoning victim’s fluency with spoken or written English
was seldom represented in reports available to CPSC staff. Often, product manuals and warning labels of products sold in the United States are provided only in English. And, although country of origin does not necessarily indicate the victim’s fluency in English, it may provide some insight into other cultural differences that may influence the usage patterns of carbon monoxide producing products. For example, individuals who originate from warmer climates where homes are less airtight may be less cognizant of the dangers of using fuel burning products indoors. Table 8 provides a summary of the country of origin for CO fatalities for the three most recent years, 2004 through 2006. As can be seen in the table, there does not appear to be any evidence that country of origin has any effect on fatality rates with the observed proportion of CO fatalities in each major grouping mirroring that of the proportion of that group in the U.S. population.
Based on information contained on the death certificates, an estimated 86 percent of CO
poisoning victims were born in the United States (including Puerto Rico) compared to the U.S. born population4 of 87 percent. Eight percent were born in Latin American and Caribbean countries with five percent from Mexico alone. Victims born in Asian countries comprised another three percent of CO poisoning victims. Additionally, CO poisoning victims born in European and African countries, or where the country of origin could not be determined, accounted for another three percent, combined. 4 Ibid.

17
Table 8 Estimated Non-Fire Carbon Monoxide Poisoning Deaths
by Country of Origin, 2004-2006.
Country of Origin
2004-2006+ Estimated Percentage of
US Population#
Annual Estimate Average Estimate
Average Percent
2004 2005+ 2006+
Total 181 100% 100% 167 197 180 U.S. Born (including Puerto Rico) 156 86% 87% 147 173 147 Latin America (including Caribbean) 14 8% 7% 10 13 18 Jamaica 0 0% * * 1 Virgin Islands 0 0% * 1 * Mexico 8 5% 9 6 11 Brazil 1 1% * 1 1 Columbia 0 0% * 1 * Cuba 0 0% * 1 * Dominican Republic 0 0% * * 1 El Salvador 0 0% * 1 * Haiti 0 0% * 1 * Honduras 2 1% 1 1 3 Asia 6 3% 3% 2 2 13 Vietnam 4 2% * 2 9 Cambodia 0 0% 1 * * Korea 0 0% * * 1 Philipines 0 0% 1 * * Afganistan 0 0% * * 1 Thailand 1 1% * * 2 Other / Unknown 6 3% 3% 8 8 2 Albania 1 1% 2 * * Congo 0 0% 1 * * Poland 0 0% * * 1 Canada 1 1% * 4 * Slovenia 0 0% 1 * * Unknown 3 2% 3 3 1 + Data collection for 2005 and 2006 is nearly complete. Italicized estimates may change in the future if more reports of fatalities are received. * No reports received by CPSC staff. # Based on estimated 2006 U.S. population statistics. Source: U.S. Consumer Product Safety Commission / EPHA. CPSC Death Certificate File, CPSC In-Depth Investigation File, CPSC Injury or Potential Injury Incident File, National Center for Health Statistics Mortality File, 1999 - 2006. U.S. Census Bureau, Statistical Abstract of the United States: 2009. Note: Reported annual estimates and estimated averages and percentages may not add to subtotals or totals due to rounding.
Table 9 provides a summary of CO fatality victims characterized by race/ethnicity for the three most recent years of the report, 2004 through 2006. Because of the growing proportion of the U.S. population of Hispanic descent, Hispanic victims were categorized separately, irrespective of their race. It should be noted that estimates of the percentage of the U.S. population categorized into the various race/ethnicity groupings were based on single-race characterizations as represented in the U.S. Census Bureau reports. Multi-race population counts were omitted from the calculations. The reason for this modification is because death certificates, the primary source of race/ethnicity designations, only list a single race/ethnicity designation.

18
The estimated percentage of the non-Hispanic white CO fatalities closely mirrors the percentage of the U.S. population at 66 percent and 68 percent, respectively. However, there appears to be a disproportionate number of Black or African American victims of CO poisoning comprising 18 percent of all CO poisoning fatalities even though the Blacks or African Americans represent only about 12 percent of the U.S. population. By contrast, the proportion of the CO poisoning fatality victims who were of Hispanic ethnicity (10%) is well below the percentage of Hispanics in the U.S. population (15%).
Table 9 Estimated Non-Fire Carbon Monoxide Poisoning Deaths
by Race/Ethnicity, 2004-2006.
Race / Ethnicity 2004-2006+ Estimated
Percentage of US Population*
Annual Estimate
Average Estimate
Average Percent
2004 2005+ 2006+
Total 181 100% 100% 167 197 180 White (non-Hispanic) 119 66% 68% 112 136 108 Black or African American 33 18% 12% 27 38 34 Hispanic (All races) 19 10% 15% 19 17 21 Asian Pacific 6 3% 4% 2 2 13 American Indian 1 1% 1% * * 3 Unknown 3 2% 0% 6 4 * + Data collection for 2005 and 2006 is nearly complete. Italicized estimates may change in the future if more reports of fatalities are received. * Estimated percentage of 2006 US population calculated from single race/ethnicity totals only. Multi-race population counts were omitted. Source: U.S. Consumer Product Safety Commission / EPHA. CPSC Death Certificate File, CPSC In-Depth Investigation File, CPSC Injury or Potential Injury Incident File, National Center for Health Statistics Mortality File, 1999 - 2006. U.S. Census Bureau, Statistical Abstract of the United States: 2009. Note: Reported annual estimates and estimated averages and percentages may not add to subtotals or totals due to rounding.
Table 10 provides a breakout of the CO poisoning fatalities characterized by population density of the incident location. The table is presented as three sections: 1) incidents occurring at all incident locations; 2) incidents occurring in locations identified as a permanent home (e.g., house, apartment, mobile home); and 3) incidents occurring only in non-home locations (e.g., camper trailer, tent, motel room). Please note that “Home Locations” and “Non-Home Locations” sum to “All Locations”.
All fatal incidents were designated as occurring in one of four rural/urban categories based on the Rural-Urban Commuting Area (RUCA) codes developed by the Economic Research Service (ERS) of the United States Department of Agriculture (USDA) based on theoretical concepts used by the Office of Management and Budget (OMB) to define county-level metropolitan and micropolitan areas. This 33 category classification system is based on measures of population density, urbanization, and daily commuting. The OMB methodology is based on county-level delineation. ERS refined the methodology by applying it to smaller census tracts. The WWAMI Rural Health Research Center at the University of Washington5 further delineated the characterization by cross-referencing each zip code in the United States to its RUCA code classification. The zip code cross-reference was used to characterize each of the CO fatalities into one of four broad categories: Urban, Large Rural, Small Rural, and Isolated.
5 The WWAMI name is derived from the first letter of each of the five cooperating states in a partnership between the University of Washington School of Medicine and the states of Wyoming, Alaska, Montana, and Idaho.

19
Table 10 also includes the estimated percentage of the U.S. population per population density designation category. As can be seen in the All Locations section, the estimated average percentage of CO fatalities during the three-year period in urban locations (67%) is smaller than the percentage of the U.S. population living in urban locations (81%). The difference is offset by the larger percentages in small rural locations (8% versus 5% of the U.S. population) and, especially, isolated locations (13% versus 4%). A look at the Non-Home Locations section helps to identify some of the disparity. An average of 25 percent of all non-home CO fatalities occurred in isolated locations even though the U.S. population in isolated locations is only four percent. In fact, in 2006, 20 of 28 CO poisoning fatalities in isolated locations occurred in non-home locations. Two factors may help to explain the relatively high proportion of isolated location CO fatalities. Many non-home locations where CO fatalities occurred were tents, camper trailers, or cabins in isolated locations used during hunting or camping activities where no local power utility is available. In these cases, individuals often resort to generators for power and to portable LP heaters, lanterns, and stoves. Generators and portable LP heaters, in particular, are associated with large percentages of CO fatalities in isolated temporary shelters (31 of 39, or 79%) in the 2004 to 2006 period.
Another possible factor in the elevated percentage of isolated location CO fatalities is the isolated nature itself. Being isolated from friends, family, and neighbors, victims often have little day-to-day interaction with others so discovery is often days later instead of, perhaps, hours, which could make the difference between life and death. Isolation may also be a factor when it comes to rescue and hospital services which may be very far away.
Table 10
Estimated Non-Fire Carbon Monoxide Poisoning Deaths by Population Density of Place of Death, 2004-2006.
RUCA Population Density Designation
2004-2006+ Estimated Percentage of US
Population*
Annual Estimate Average Estimate
Average Percent
2004 2005+ 2006+
All Locations 181 100% 100% 167 197 180 Urban 122 67% 81% 115 127 122 Large Rural 22 12% 10% 26 21 19 Small Rural 14 8% 5% 13 19 11 Isolated 24 13% 4% 14 30 28 Home Locations 129 100% - - 125 136 128 Urban 93 72% - - 89 87 104 Large Rural 16 12% - - 20 17 10 Small Rural 10 8% - - 6 17 7 Isolated 11 9% - - 9 15 8 Non-Home Locations 52 100% - - 43 61 52 Urban 28 54% - - 26 40 19 Large Rural 6 12% - - 5 4 9 Small Rural 4 8% - - 6 2 4 Isolated 13 25% - - 5 14 20 + Data collection for 2005 and 2006 is nearly complete. Italicized estimates may change in the future if more reports of fatalities are received. * Estimated 2006 US population categorized by RUCA designation Source: U.S. Consumer Product Safety Commission / EPHA. CPSC Death Certificate File, CPSC In-Depth Investigation File, CPSC Injury or Potential Injury Incident File, National Center for Health Statistics Mortality File, 1999 - 2006. WWAMI Rural Research Center at the University of Washington. Economic Research Group, USDA. Note: Reported annual estimates and estimated averages and percentages may not add to subtotals or totals due to rounding.
20
Appendix A: Methodology This appendix describes the data sources and methodology used to compute the national estimate of non-fire carbon monoxide (CO) poisoning deaths associated with the use of consumer products and the estimates by product, victim age, and incident location.
All death certificates filed in the United States are compiled by the National Center for Health Statistics (NCHS) into a multiple cause of mortality data file. The NCHS Mortality File contains demographic and geographic information, as well as the International Statistical Classification of Diseases and Related Health Problems codes for the underlying cause of death. Data are compiled in accordance with the World Health Organization instructions, which request that member nations classify causes of death by the current Manual of the International Statistical Classification of Diseases and Related Health Problems. The International Classification of Diseases, Tenth Revision (ICD-10) was implemented in 1999. Although the NCHS data contain cause of death codes that are helpful in identifying deaths due to CO poisoning, the records do not contain any narrative information that might indicate the involvement of a consumer product. To complement the NCHS mortality data, the CPSC staff purchases death certificates from the 50 states, the District of Columbia, and New York City. Specifically, the CPSC staff purchases death certificates with certain cause of death codes for which there is a high probability that consumer products are involved. In addition to the cause of death codes and demographic and geographic information, the death certificate contains information about the incident location and a brief narrative describing the incident. Any references to consumer products are usually found in these narratives. The CPSC staff conducts follow-up in-depth investigations on selected deaths to confirm and expand upon the involvement of consumer products, as resources allow.
ICD-10 classifies deaths associated with CO poisoning with the codes listed below. The focus of this report is unintentional CO poisoning deaths and concentrates on those deaths coded as X47 and Y17. That is, code X67 records of intentional CO poisonings are excluded from this analysis.
ICD-10 Code Definition
X47 Accidental Poisoning by and exposure to other gases and vapors. Includes: carbon monoxide, lacrimogenic gas, motor (vehicle) exhaust gas, nitrogen oxides, sulfur dioxide, utility gas
X67 Intentional Poisoning by and exposure to other gases and vapors. Includes: carbon monoxide, lacrimogenic gas, motor (vehicle) exhaust gas, nitrogen oxides, sulfur dioxide, utility gas
Y17 Undetermined intent Poisoning by and exposure to other gases and vapors. Includes: carbon monoxide, lacrimogenic gas, motor (vehicle) exhaust gas, nitrogen oxides, sulfur dioxide, utility gas
The first step in compiling the annual estimates is computing the total estimates of CO poisoning deaths associated with consumer products. The CPSC’s Death Certificate (DTHS)

21
File and the CPSC’s Abbreviated Death Certificate (ABDT) File were both searched for cases associated with ICD-10 codes X47 and Y17.
Each death found in the CPSC’s DTHS File and coded as X47 or Y17 was reviewed by an analyst and categorized as in-scope, out of scope, or whether the source of the CO was unknown or questionable. In-scope cases are unintentional non-fire CO poisoning deaths associated with a consumer product under the jurisdiction of the CPSC. Out-of-scope cases are cases that involve CO sources that are not under the jurisdiction of the CPSC (including motor vehicle exhaust cases), fire or smoke-related exposures, or intentional CO poisonings. Examples of out-of-scope cases include poisonings due to gases other than CO (i.e., natural gas, ammonia, butane), motor vehicle exhaust- or boat exhaust-related poisonings, and work-related exposures. The source of CO was classified as unknown or questionable in cases where a consumer product was possibly associated with the incident but the exact source of CO was unknown.
Deaths found in the CPSC’s ABDT File are categorized as out-of-scope cases. The
ABDT File contains death certificates for CO poisonings (X47 and Y17) that involve motor vehicle exhaust, cases where the source of the CO is unknown, or where the death certificate does not mention a consumer product. Other examples of out-of-scope cases that may appear in the abbreviated file are cases associated with farm accidents, smoke inhalation from a structural fire, or other gas poisonings. Occasionally, newer information from CPSC In-Depth Investigations (IDIs) may be matched with ABDT cases which were classified as having no known source or did not mention a consumer product. In the cases where the CPSC IDIs indicate the CO source was from a consumer product and should be considered in scope, it was assumed that the death certificate was misclassified and the subject cases in the ABDT File were included with the DTHS database files.
In previous years, a small number of cases in the ABDT File were identified as in scope
based on further information collected during in-depth investigations. The method used to identify three deaths in 1999 and two deaths in 2000 is found in Appendix A of the 1999 and 2000 Annual Estimate Report (Vagts, 2001). For 2001 data, no ABDT File cases were reclassified as in scope based on additional information. For the 2002 data, additional information on one incident in the ABDT File resulted in the incident being reclassified as in scope. This fatality was not included in the NCHS file. Since the incident was not included in the NCHS data, it was also removed from the ABDT File and thus not used in calculations for the weights. For the 2003 data, there were seven reclassified in-scope cases in the ABDT File and five in 2004. For the 2005 data, one case from the ABDT File was reclassified as an in-scope case. And for the 2006 data, three cases from the ABDT were reclassified. The results of the initial categorization for 2006 data are found in Table A.1.

22
Table A.1 Initial Categorization for 2006 Data
ICD-10 Code
NCHS Total
DTHS File Total in
ABDT File
Total in CPSC
Databases1
Number of Cases to be Imputed2 In-Scope Unknown
Scope Out-of-Scope Total
X47 585 161 13 222 396 144 540 58
Y17 74 1 1 25 27 27 54 21
Total 659 162 14 247 423 171 594 79
1 “Total in ABDT File” cases plus “Total” from DTHS File. 2 “NCHS Total” cases minus “Total in CPSC Database” plus “Unknown Scope” from DTHS. Source: U.S. Consumer Product Safety Commission / EPHA.
CPSC Death Certificate File, CPSC In-Depth Investigation File, Abbreviated Death Certificate File, National Center for Health Statistics Mortality File, 2006.
The proportion of death certificates found in the CPSC database associated with non-fire
unintentional X47 or Y17 deaths and associated with consumer products was applied to the NCHS totals to calculate the total estimated number of non-fire CO poisoning deaths associated with consumer products. In theory, the NCHS totals comprise all death certificates in the U.S. and the same proportion of in-scope cases should exist in the death certificates that are missing from the combined CPSC Death Certificate and Abbreviated Death Certificate files or are from an unknown source. Applying the proportion of in-scope cases to the NCHS database totals should, therefore, provide an estimate on in-scope cases nationwide. This was done in the following way and was done for ICD-10 codes X47 and Y17 separately. 1. The number of in-scope deaths in the CPSC’s Death Certificate File coded as X47 or Y17 separately that were associated with an accidental non-fire CO poisoning and a consumer product were identified (n1).
2. The total number of deaths in the CPSC’s Death Certificate File and the Abbreviated Death Certificate File coded as X47 or Y17 were summed separately excluding cases with an unknown or highly questionable source (n2). 3. The total number of deaths in the NCHS data associated with X47 and Y17 was counted (n3). 4. The estimate of the number of non-fire CO poisoning deaths associated with consumer products in codes X47 and Y17 was calculated separately using the formula:
N= (n1 / n2) * n3
The proportion (n1 /n2) represents the number of in-scope cases found in the CPSC’s files divided by the total of in-scope and out-of-scope cases.

23
5. The estimates of the number of non-fire CO poisoning deaths associated with consumer products in codes X47 and Y17 were summed to calculate the total estimate of non-fire CO poisoning deaths.
Total Estimate = NX47 + NY17
The ratio (n3 / n2) represents the weighting factor used to calculate the annual estimates. The CPSC’s Death Certificate File does not contain death certificates for all deaths listed in the NCHS file; therefore a weighting factor was calculated to account for those death certificates that are missing. The weighting factor allows the computation of national estimates of CO deaths by consumer products and by other characteristics collected by CPSC about each death.
Table A.2 contains the values for the variables used in the calculation as well as the final computed 2006 estimate of CO poisoning deaths.
Table A.2 Calculation Detail of the Final Computed 2006 Estimate of Non-Fire
CO Poisoning Deaths Associated with Consumer Products
Variable ICD-10 Code
X47 Y17 n1 161 1 n2 540-13 = 527 54-1 = 53 n3 585 74 Weighting Factor (n3 / n2) 1.1101 1.3962 N 178.7192 1.3962 Total Estimate 178.7192 + 1.3962 = 180.1154 ~ 180
Source: U.S. Consumer Product Safety Commission / EPHA. CPSC Death Certificate File, CPSC In-Depth Investigation File, Abbreviated Death Certificate File, National Center for Health Statistics Mortality File, 2006.
Table A.3 shows the weighting factors used to calculate the estimates for the years 1999-2006. It should be noted that the 2005 data and weighting factor have been updated to reflect additional cases that have become available to CPSC staff since the publication of last year’s CO fatalities report.

24
Table A.3 CO Fatality Cases and Weighting Factors Used to Calculate the Estimates
for the Years 1999-2006
Year NCHS Total Total in CPSC Databases* In-Scope Cases Weighting Factor
1999 X47 542 469 93 1.1557 Y17 80 66 1 1.2121
2000 X47 600 551 125 1.0889 Y17 76 70 1 1.0857
2001 X47 596 520 103 1.1462 Y17 79 62 3 1.2742
2002 X47 642 599 169 1.0718 Y17 71 61 0 1.1639
2003 X47 633 625 152 1.0128 Y17 89 75 0 1.1867
2004 X47 566 527 155 1.0740 Y17 86 72 1 1.1944
2005 X47 650 590 177 1.1036 Y17 92 70 1 1.3143
2006 X47 585 527 161 1.1101 Y17 74 53 1 1.3962
* This is the total number of deaths in the Death Certificate File and Abbreviated Death Certificate File, excluding deaths associated
with an unknown or questionable source of CO. Totals for 2005 have been updated. Source: U.S. Consumer Product Safety Commission / EPHA.
CPSC Death Certificate File, CPSC In-Depth Investigation File, Abbreviated Death Certificate File, National Center for Health Statistics Mortality File, 1999-2006.
Incidents with unknown or highly questionable CO sources were excluded from the
denominator of the weighting factor. The group of cases with unknown or highly questionable sources was assumed to contain the same proportion of cases associated with a consumer product as the group of cases within the CPSC database with known CO sources (this is the same assumption that is made for those cases where the death certificate is missing). To include these cases within the denominator assumes that these cases can be classified as in scope or out of scope when actually their scope status is unknown. Therefore, for weighting purposes, cases

25
where the source was unknown or highly questionable were treated in the same way as missing cases were treated.
In-scope cases were further examined to determine which product was associated with the incident. Further information on the CO deaths was obtained from review of the CPSC’s In-Depth Investigation File.
Reports of non-fire CO poisoning deaths were retrieved from the DTHS and ABDT files
based on the following criteria: date of death between 1/1/1999 and 12/31/2006 and ICD-10 code of X47 or Y17. Death certificates entered into CPSC’s database prior to April 27, 2009 were included in this analysis. Each CO death was reviewed and coded by the author according to the consumer product and type of fuel involved, incident location, and whether multiple deaths resulted in the same incident, whenever possible. If information about the product’s condition, venting system, or installation environment was provided in the in-depth investigation report, this information was coded for informational purposes.
In Table 1 of this report, the Heating Systems category combined CO poisoning fatalities
from furnaces, boilers, vented floor and wall heaters, unvented space heaters, camping heaters, and other miscellaneous heating systems. Deaths associated with charcoal being burned alone and in the absence of an appliance (e.g., in a pail or in the sink) were presented with Charcoal Grills, even though this practice was usually done for heating purposes. Examples of products historically included in the Other Appliances category include LP gas refrigerators and gas pool heaters. LP gas grill, LP fish cooker, and other LP gas portable cooking appliance incidents are classified in the Gas Grills, Camp Stove, Lanterns category from 1999 to 2006. Deaths where multiple fuel-burning products were used simultaneously such that a single source of the fatal CO could not be determined were classified under Multiple Appliances. Engine-Driven Tools included generators and power gardening equipment, such as power lawn mowers, garden tractors, concrete cutters, gasoline-powered water pumps, and snowblowers. Generators that were original equipment installed on a recreational vehicle (RV), trailer, camper, or boat were considered out of scope, as they are outside the jurisdiction of the CPSC.
26
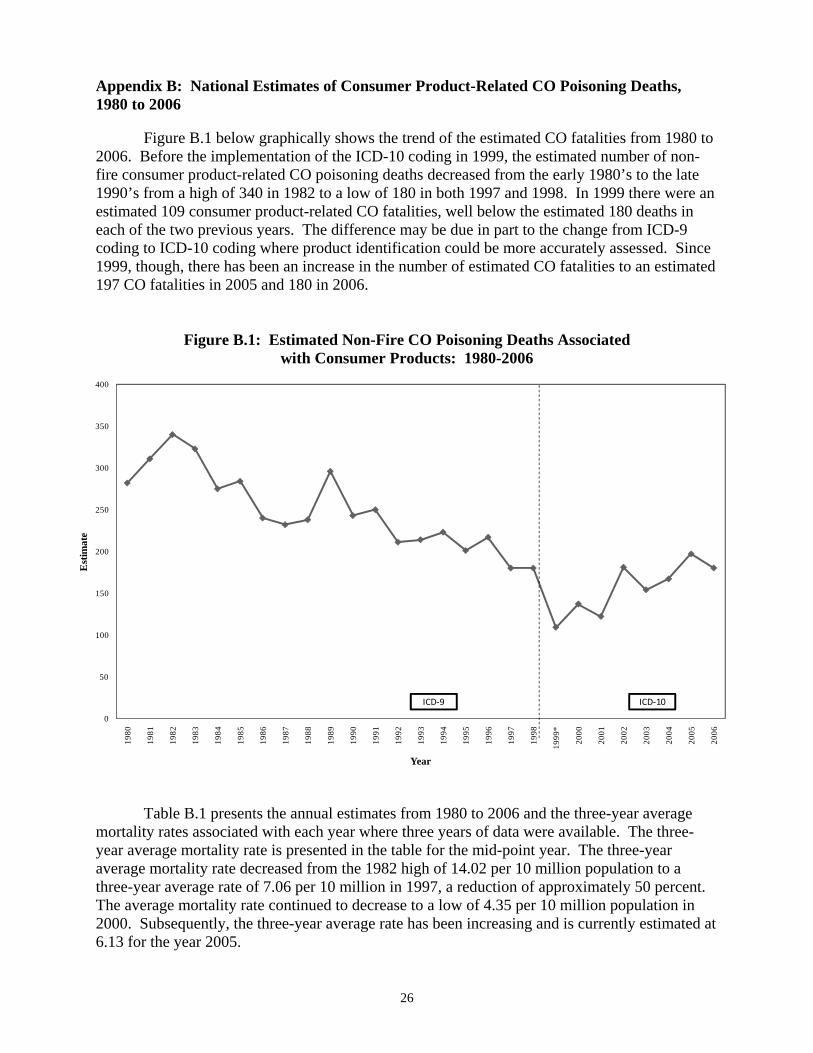
Appendix B: National Estimates of Consumer Product-Related CO Poisoning Deaths, 1980 to 2006 Figure B.1 below graphically shows the trend of the estimated CO fatalities from 1980 to 2006. Before the implementation of the ICD-10 coding in 1999, the estimated number of non-fire consumer product-related CO poisoning deaths decreased from the early 1980’s to the late 1990’s from a high of 340 in 1982 to a low of 180 in both 1997 and 1998. In 1999 there were an estimated 109 consumer product-related CO fatalities, well below the estimated 180 deaths in each of the two previous years. The difference may be due in part to the change from ICD-9 coding to ICD-10 coding where product identification could be more accurately assessed. Since 1999, though, there has been an increase in the number of estimated CO fatalities to an estimated 197 CO fatalities in 2005 and 180 in 2006.
Figure B.1: Estimated Non-Fire CO Poisoning Deaths Associated with Consumer Products: 1980-2006
0
50
100
150
200
250
300
350
400
1980
1981
1982
1983
1984
1985
1986
1987
1988
1989
1990
1991
1992
1993
1994
1995
1996
1997
1998
1999
*
2000
2001
2002
2003
2004
2005
2006
Est
imat
e
Year
ICD‐10ICD‐9
Table B.1 presents the annual estimates from 1980 to 2006 and the three-year average mortality rates associated with each year where three years of data were available. The three-year average mortality rate is presented in the table for the mid-point year. The three-year average mortality rate decreased from the 1982 high of 14.02 per 10 million population to a three-year average rate of 7.06 per 10 million in 1997, a reduction of approximately 50 percent. The average mortality rate continued to decrease to a low of 4.35 per 10 million population in 2000. Subsequently, the three-year average rate has been increasing and is currently estimated at 6.13 for the year 2005.

27
The Consumer Product Safety Commission established a strategic goal to reduce the CO poisoning mortality rate associated with the use of consumer products by 20 percent from the 1999/2000 average rate6. The 1999/2000 average CO fatality mortality rate was 4.38 per 10 million population. The 2005 average mortality rate was 6.13, an increase of approximately 40 percent.
Table B.1: Estimated Non-Fire Carbon Monoxide Poisoning
Deaths Associated with Consumer Products, 1980-2006
Year EstimateU.S. Population
Estimates (thousands)
3-Year Average Mortality Rate per 10
Million Population1980 282 227,2251981 311 229,466 13.551982 340 231,664 14.021983 323 233,792 13.381984 275 235,825 12.471985 284 237,924 11.201986 240 240,133 10.501987 232 242,289 9.771988 238 244,499 10.431989 296 246,819 10.491990 243 249,623 10.541991 250 252,981 9.281992 211 256,514 8.781993 214 259,919 8.311994 223 263,126 8.091995 201 266,278 8.031996 217 269,394 7.401997 180 272,647 7.061998 180 275,854 5.68
1999* 109 279,040 5.102000 137 282,194 4.352001 122 285,112 5.142002 181 287,888 5.292003 154 290,448 5.762004 167 293,192 5.892005 197 295,896 6.132006 180 298,755
Note: The three-year average mortality rate is reported at the mid year. * The Tenth Revision of the International Statistical Classification of Diseases and Related Health Problems (ICD-10) was
implemented. Source: U.S. Consumer Product Safety Commission / EPHA.
U.S. Census Bureau, Statistical Abstract of the United States: 2009 (excluding Armed Forces overseas).
6 U.S. Consumer Product Safety Commission – Strategic Plan, September 2003.

28
Prior to 1999 with the implementation of ICD-10, it was not possible to generate estimates for an important category of products: generators and other engine-driven tools7. With the advent of ICD-10 coding, it is now possible to generate estimates of fatalities associated with generators and other engine-driven tools. This category has been observed to have a statistically significant upward trend in the estimated number of associated CO poisoning fatalities since 1999. This increasing trend appears to be having an impact on the mortality rate of consumer product-related CO poisoning fatalities. Table B.2 shows that the 2005 three-year average mortality rate (2.52) for generators alone was more than five times greater than for the 1999/2000 average rate (0.46), and the estimated three-year average rate has increased each year in that time span. In fact, the two most recent years presented in this report, 2005 and 2006, are the only years since the implementation of ICD-10 that there were more CO fatalities associated with engine-driven tools than with heating systems.
Table B.2: Estimated Non-Fire Carbon Monoxide Poisoning Deaths Associated with Generators, 1999-2006
Year Estimate U.S. Population (thousands)
3-Year Average Mortality Rate per 10
Million Population
1999 7 279,040 0.46*
2000 19 282,194 2001 21 285,112 0.94 2002 41 287,888 1.29 2003 50 290,448 1.53 2004 42 293,192 2.14 2005 97 295,896 2.52 2006 85 298,755
* Two-year average of 1999 and 2000. The 1999/2000 average mortality rate calculation is consistent with the method used to determine the baseline for the strategic goal for the reduction of the CO poisoning mortality rate from all consumer products. Note: The three-year average mortality rate is reported at the mid year.
Table B.3 shows the CO poisoning mortality rates associated with all consumer products excluding generators. The data indicate that, with the exclusion of generators, there does not appear to be an upward trend in the mortality rate for consumer products. The 1999/2000 annual average mortality rate was 3.92. The 2005 three-year average mortality rate was 3.61, a decrease of eight percent. With generators included, the mortality rate increased from 4.35 per 10 million to 6.13 in the same time span, an increase of 40 percent.
7 See Appendix B of Mah (2001) for details.

29
Table B.3: Estimated Non-Fire Carbon Monoxide Poisoning Deaths Associated with Consumer Products, 1999-2006 (Excluding Generator-Related Deaths)
Year Estimate U.S. Population (thousands)
3-Year Average Mortality Rate per 10
Million Population
1999 102 279,040 3.92*
2000 118 282,194 2001 101 285,112 4.20 2002 140 287,888 4.00 2003 104 290,448 4.24 2004 125 293,192 3.74 2005 100 295,896 3.61 2006 95 298,755
* Two-year average of 1999 and 2000. The 1999/2000 average mortality rate calculation is consistent with the method used to determine the baseline for the strategic goal for the reduction of the CO poisoning mortality rate from all consumer products. Note: The three-year average mortality rate is reported at the mid year.
The data presented in the body of the report (see Table 3) also indicate that there appears to be an increase in the number of CO poisoning fatalities associated with other engine-driven tools like lawn tractors and power washers. Table B.4 shows the increase in mortality rates of all engine-driven tools, including generators. It can be seen in the table that the average mortality rate has more than quadrupled from the 1999/2000 average rate (0.71) to the three-year average for 2005 (3.06).
Table B.4: Estimated Non-Fire Carbon Monoxide Poisoning Deaths Associated with Generators and Other Engine-Driven Tools, 1999-2006
Year Estimate U.S. Population (thousands)
3-Year Average Mortality Rate per
10 Million Population
1999 13 279,040 0.71*
2000 27 282,194 2001 22 285,112 1.17 2002 51 287,888 1.50 2003 57 290,448 1.89 2004 57 293,192 2.55 2005 111 295,896 3.06 2006 104 298,755
* Two-year average of 1999 and 2000. The 1999/2000 average mortality rate calculation is consistent with the method used to determine the baseline for the strategic goal for the reduction of the CO poisoning mortality rate from all consumer products. Note: The three-year average mortality rate is reported at the mid year.
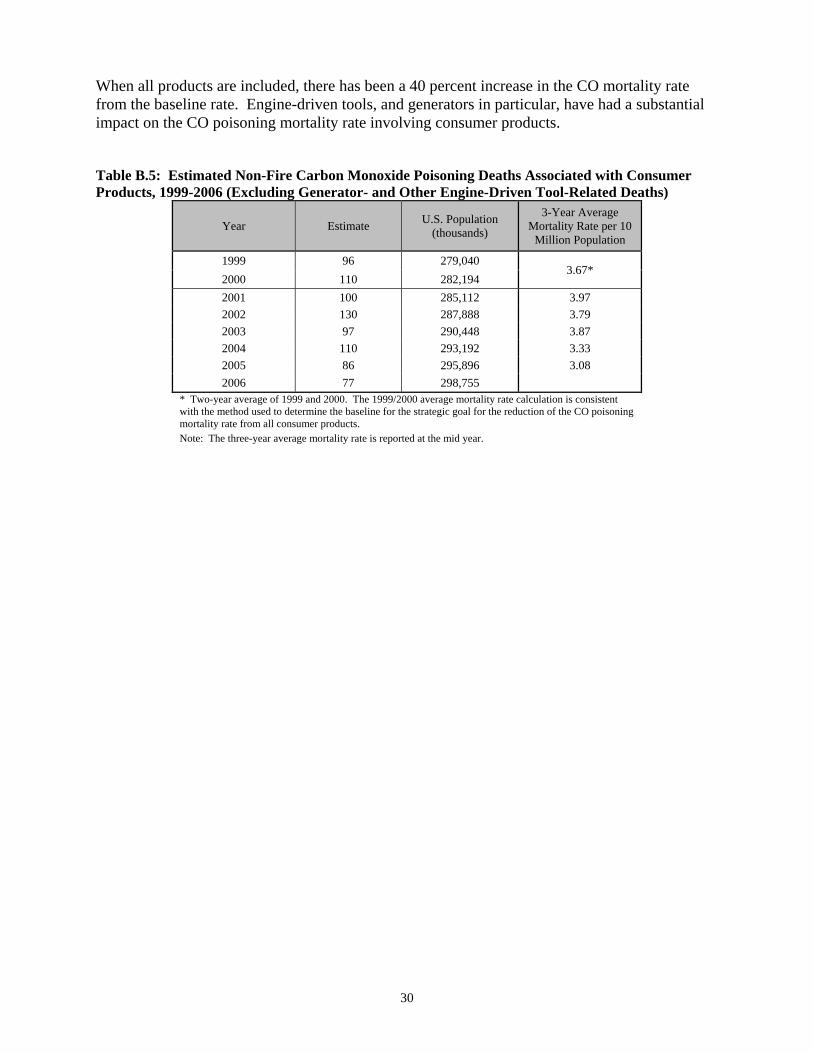
Table B.5 shows the CO mortality rates associated with all consumer products excluding generators and other engine-driven tools. The data indicate that the annual average mortality rate decreased by 16 percent, with the exclusion of all engine-driven tools, with the 1999/2000 average mortality rate of 3.67 and 3.08 in 2005. The 1999/2000 average mortality rate calculation used here is consistent with the method used to determine the baseline for the strategic goal for the reduction of the CO poisoning mortality rate from all consumer products.
30
When all products are included, there has been a 40 percent increase in the CO mortality rate from the baseline rate. Engine-driven tools, and generators in particular, have had a substantial impact on the CO poisoning mortality rate involving consumer products. Table B.5: Estimated Non-Fire Carbon Monoxide Poisoning Deaths Associated with Consumer Products, 1999-2006 (Excluding Generator- and Other Engine-Driven Tool-Related Deaths)
Year Estimate U.S. Population (thousands)
3-Year Average Mortality Rate per 10
Million Population
1999 96 279,040 3.67*
2000 110 282,194 2001 100 285,112 3.97 2002 130 287,888 3.79 2003 97 290,448 3.87 2004 110 293,192 3.33 2005 86 295,896 3.08 2006 77 298,755
* Two-year average of 1999 and 2000. The 1999/2000 average mortality rate calculation is consistent with the method used to determine the baseline for the strategic goal for the reduction of the CO poisoning mortality rate from all consumer products. Note: The three-year average mortality rate is reported at the mid year.
31
References Hnatov, Matthew V., Non-Fire Carbon Monoxide Deaths Associated with the Use of Consumer Products 2005 Annual Estimates. Washington, D.C.: U.S. Consumer Product Safety Commission. 2008. Long, K., Saltzman, L. (1995). Non-fire Carbon Monoxide Incidents: Morbidity and Mortality Related to the Use of Household Appliances. Washington, D.C.: U.S. Consumer Product Safety Commission. Mah, J., Non-Fire Carbon Monoxide Deaths Associated with the Use of Consumer Products 1998 Annual Estimates. Washington, D.C.: U.S. Consumer Product Safety Commission. 2001. Vagts, S., Non-Fire Carbon Monoxide Deaths Associated with the Use of Consumer Products 1999 and 2000 Annual Estimates. Washington, D.C.: U.S. Consumer Product Safety Commission. 2003. Vagts, S., Non-Fire Carbon Monoxide Deaths Associated with the Use of Consumer Products 2001 Annual Estimates. Washington, D.C.: U.S. Consumer Product Safety Commission. 2004. U.S. Census Bureau. Statistical Abstract of the United States: 2009. U.S. Census Bureau. American Factfinder. <http://factfinder.census.gov> U.S. Department of Agriculture. Briefing Rooms: Measuring Rurality. 7 Nov. 2008 <http://www.ers.usda.gov/briefing/Rurality/> University of Washington, WWAMI Rural Health Research Center. Rural-Urban Commuting Area Codes (version 2.0). 5 Jan. 2009 <http://depts.washington.edu/uwruca/>


![Detecting Carbon Monoxide Poisoning Detecting Carbon ...2].pdf · Detecting Carbon Monoxide Poisoning Detecting Carbon Monoxide Poisoning. Detecting Carbon Monoxide Poisoning C arbon](https://img.pdfslide.us/doc/110x75/5f551747b859172cd56bb119/detecting-carbon-monoxide-poisoning-detecting-carbon-2pdf-detecting-carbon.jpg)