Embed Size (px)
Citation preview
Non Experimental Research Design
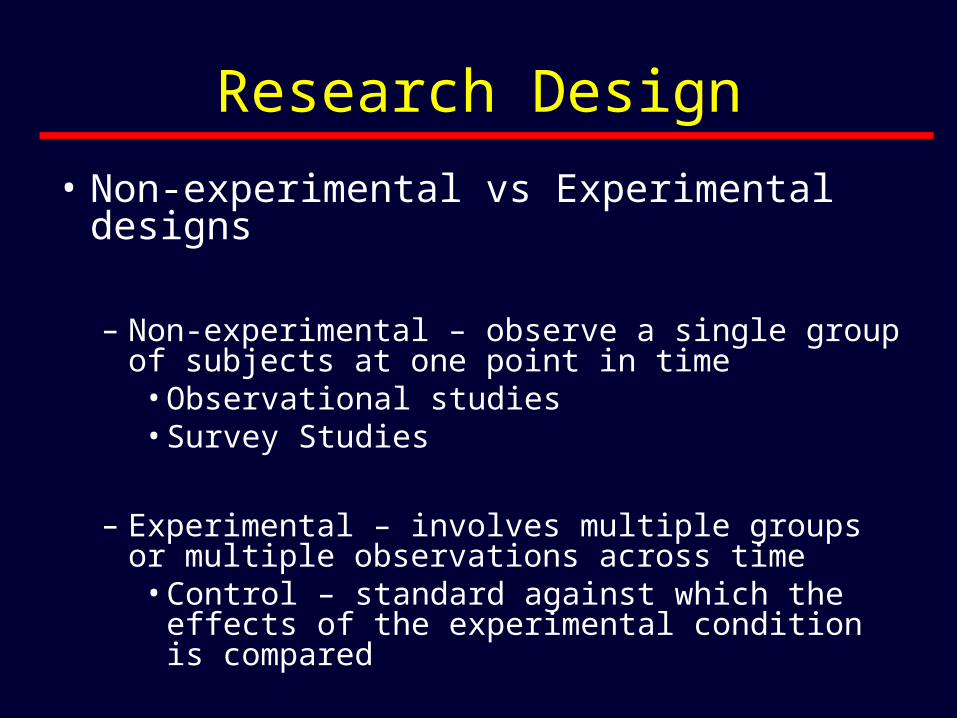
Research Design
• Non-experimental vs Experimental designs
– Non-experimental – observe a single group of subjects at one point in time• Observational studies• Survey Studies
– Experimental – involves multiple groups or multiple observations across time• Control – standard against which the effects of
the experimental condition is compared
Non Experimental Research Design
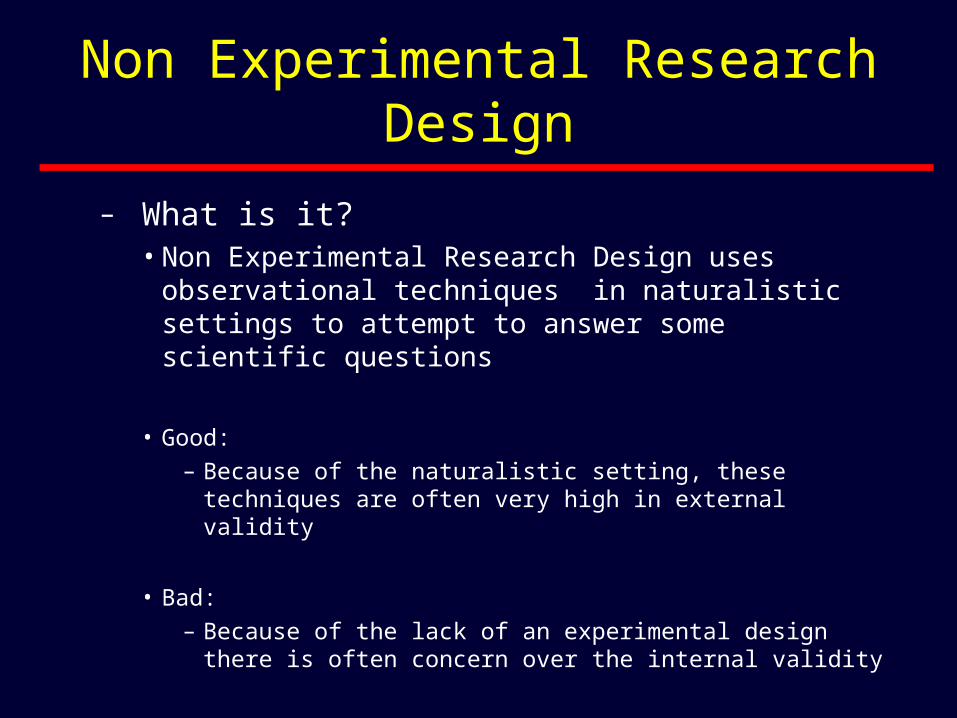
– What is it?• Non Experimental Research Design uses
observational techniques in naturalistic settings to attempt to answer some scientific questions
• Good:– Because of the naturalistic setting, these techniques are
often very high in external validity
• Bad:– Because of the lack of an experimental design there is
often concern over the internal validity
Non Experimental Research Design
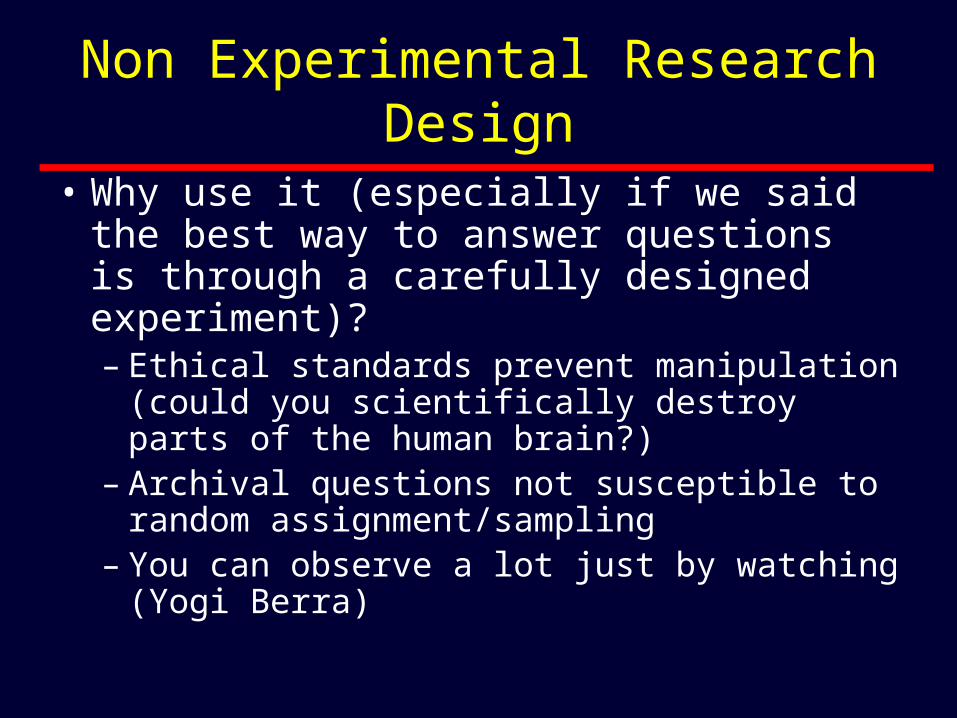
• Why use it (especially if we said the best way to answer questions is through a carefully designed experiment)?– Ethical standards prevent manipulation (could
you scientifically destroy parts of the human brain?)
– Archival questions not susceptible to random assignment/sampling
– You can observe a lot just by watching (Yogi Berra)
Types of Non Experimental Research– Case Studies
• A single person or group is examined
– Single Variable Research• A property of a large group or population is
examined - Surveys, Census, etc.
– Multiple Variable Research• Correlations are sought between several variables
within a group or population
Case Studies
• Focus on a single person or a small group
• Difficult or impossible to recreate in a laboratory– Severe head trauma– Effects of 9-11 terrorist attack on people’s
anxiety level– Near death experiences– MPTP
• Not the same as “anecdotal” evidence
Single Variable Research
• Designed to describe a specific property of a large group of people– How do people in the south view gun control
laws– How many women are pro-choice– How many seniors understand the new drug
benefits
Types of Single Variable Research
• Population Surveys – Providing a clear view of an entire population
of interest– US census attempts to do so
• Epidemiological Studies– Focus on the prevalence of a particular
disease (psychological or otherwise) in a population
• Public opinion and marketing research
Population Surveys
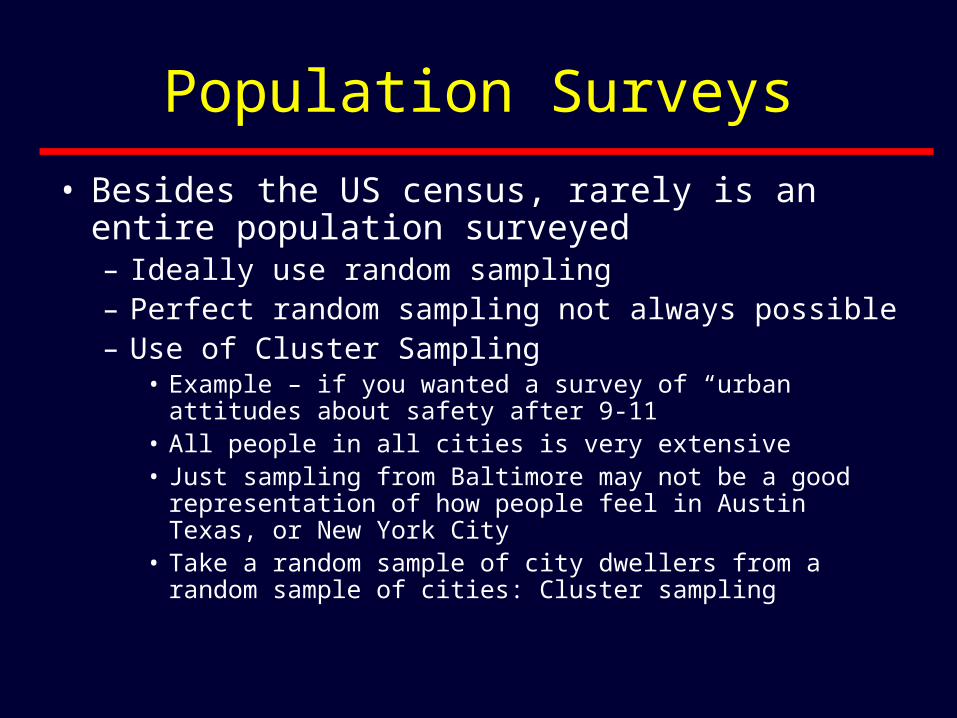
• Besides the US census, rarely is an entire population surveyed– Ideally use random sampling– Perfect random sampling not always possible– Use of Cluster Sampling
• Example – if you wanted a survey of “urban attitudes about safety after 9-11
• All people in all cities is very extensive• Just sampling from Baltimore may not be a good
representation of how people feel in Austin Texas, or New York City
• Take a random sample of city dwellers from a random sample of cities: Cluster sampling
Population Surveys
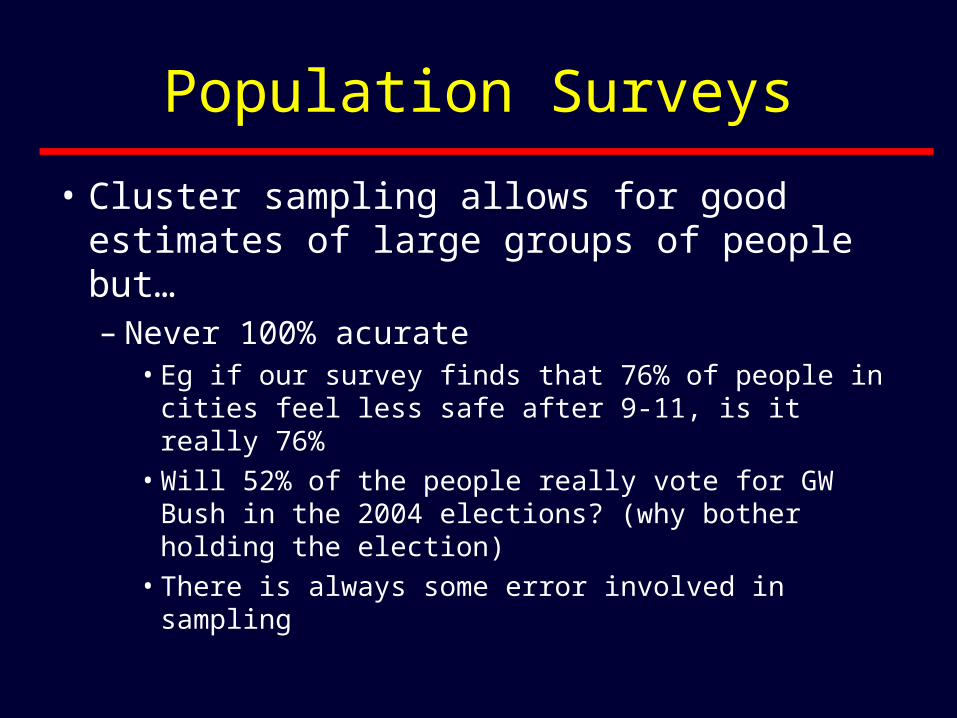
• Cluster sampling allows for good estimates of large groups of people but…– Never 100% acurate
• Eg if our survey finds that 76% of people in cities feel less safe after 9-11, is it really 76%
• Will 52% of the people really vote for GW Bush in the 2004 elections? (why bother holding the election)
• There is always some error involved in sampling
Population Surveys
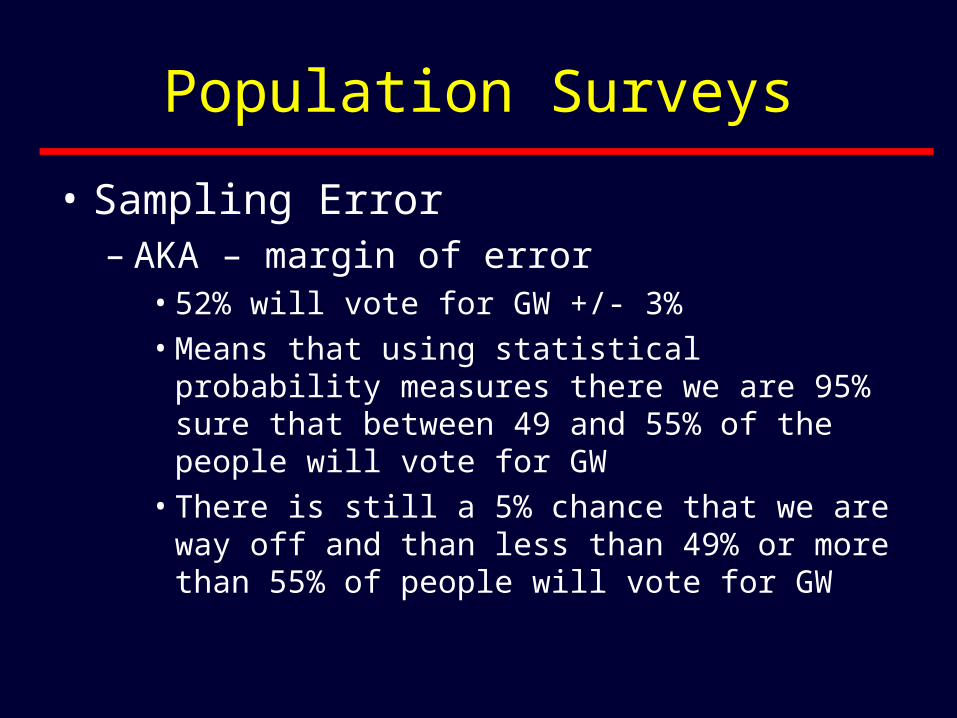
• Sampling Error– AKA – margin of error
• 52% will vote for GW +/- 3% • Means that using statistical probability measures
there we are 95% sure that between 49 and 55% of the people will vote for GW
• There is still a 5% chance that we are way off and than less than 49% or more than 55% of people will vote for GW
Epidemiological Research
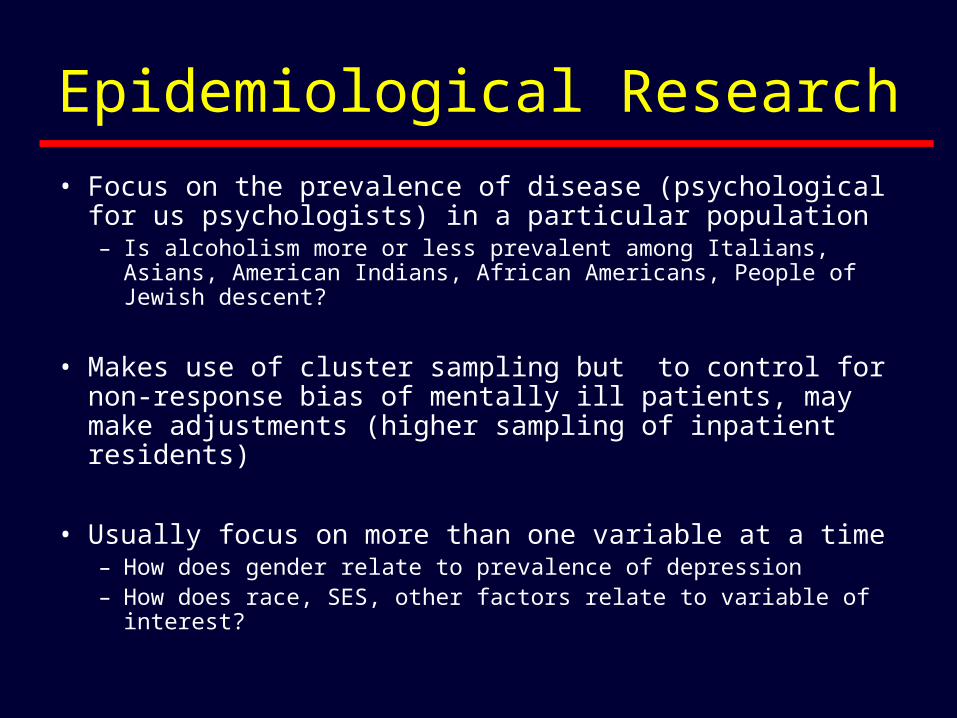
• Focus on the prevalence of disease (psychological for us psychologists) in a particular population– Is alcoholism more or less prevalent among Italians, Asians,
American Indians, African Americans, People of Jewish descent?
• Makes use of cluster sampling but to control for non-response bias of mentally ill patients, may make adjustments (higher sampling of inpatient residents)
• Usually focus on more than one variable at a time– How does gender relate to prevalence of depression– How does race, SES, other factors relate to variable of interest?
Public Opinion Research
• Assessing consumer attitudes about products– May be designed for specific populations
• How do women perceive this type of advertisement• How do homosexuals respond to this type of ad?• How do Conservative Christians respond to this
platform
– Why – intuition suffers from bias
Public Opinion Research
• False Consensus effect:• Table 5.1 (p129)
– What % of UCLA students reported that…• They typically carry over $1.50 in change in their pocket or
purse?• They have ever been camping?• They have ever been to Disneyland?• They preferred ice cream over apple pie as a dessert?• They would want a $40,000 Mercedes $30,000 in cash
• You test to think higher if you have done it or prefer it and lower if not.
• AKA regression to the midpoint
Limitations of Population Samples
• Language Barriers• Non response bias
– Skepticism– Reluctance– Irritation
• Under sampling of difficult to get populations• Education and cultural background
considerations• Lack of control over distracting variables
Convenience Samples
• Use of an available population– College students– Drug users who are seeking treatment (what about
the non- treatment seekers)
• May be ok if..– State limitations– Results are surprising enough even in a convenience
sample to generate new theories and hypotheses• Milgram• Judgment and decision making
Example
• Linda is 31 years old, single, outspoken, and very bright. As a college student she majored in philosophy and was deeply concerned with issues of discrimination and social justice. She also participated actively in anti nuclear demonstrations. Please choose the most likely alternative:– Linda is a bank teller– Linda is a bank teller and is active in the
feminist movement
Correlation and Multivariable Research
• Want to determine the relationship between two variable– Does level of drinking (high amounts per week
v. low amounts per week) have any relation to the amount of risk taking people take while driving
• Define levels (independent variables)• Define risk taking (dependent variable)
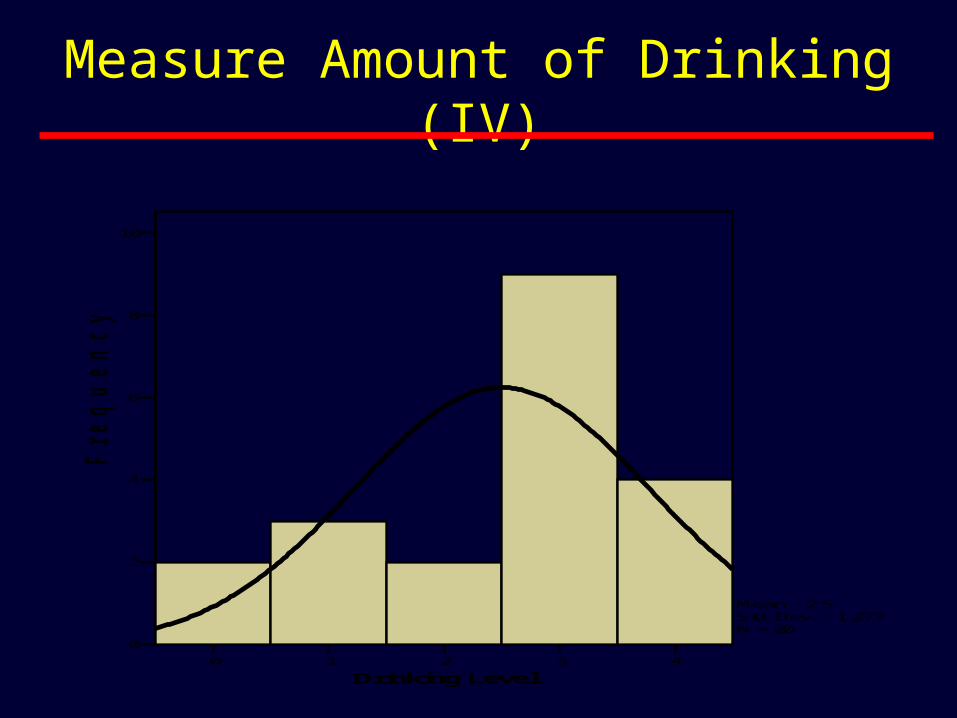
Measure Amount of Drinking (IV)
0 1 2 3 4
Drinking Level
0
2
4
6
8
10
Freq
ue
nc
y
Mean = 2.5Std. Dev. = 1.277N = 20
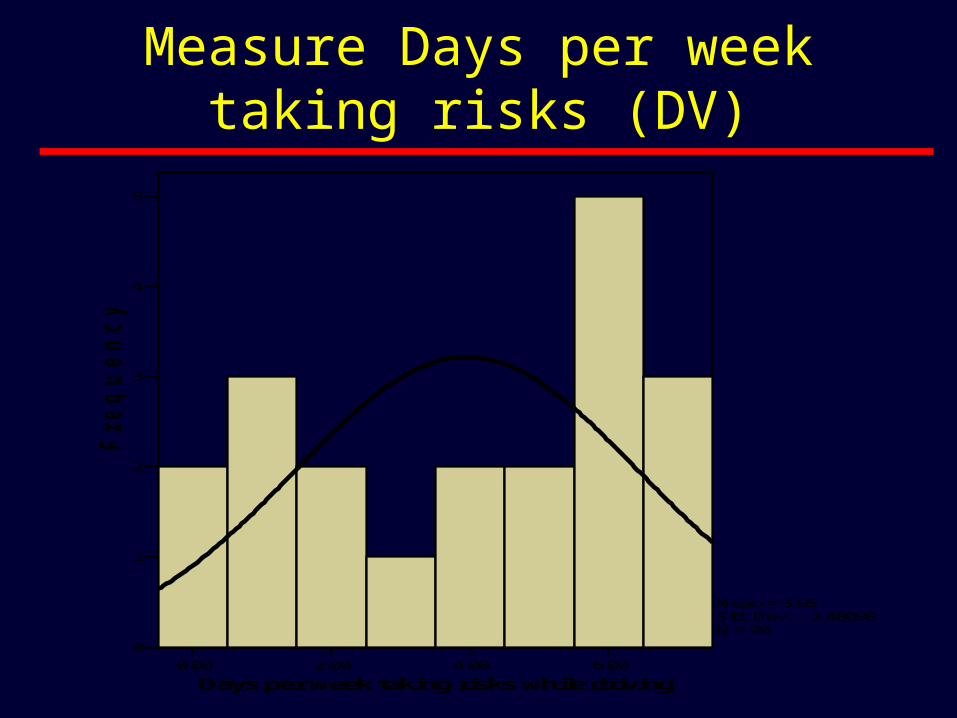
Measure Days per week taking risks (DV)
0.00 2.00 4.00 6.00
Days per week taking risks while driving
0
1
2
3
4
5
Fre
qu
en
cy
Mean = 3.95Std. Dev. = 2.48098N = 20
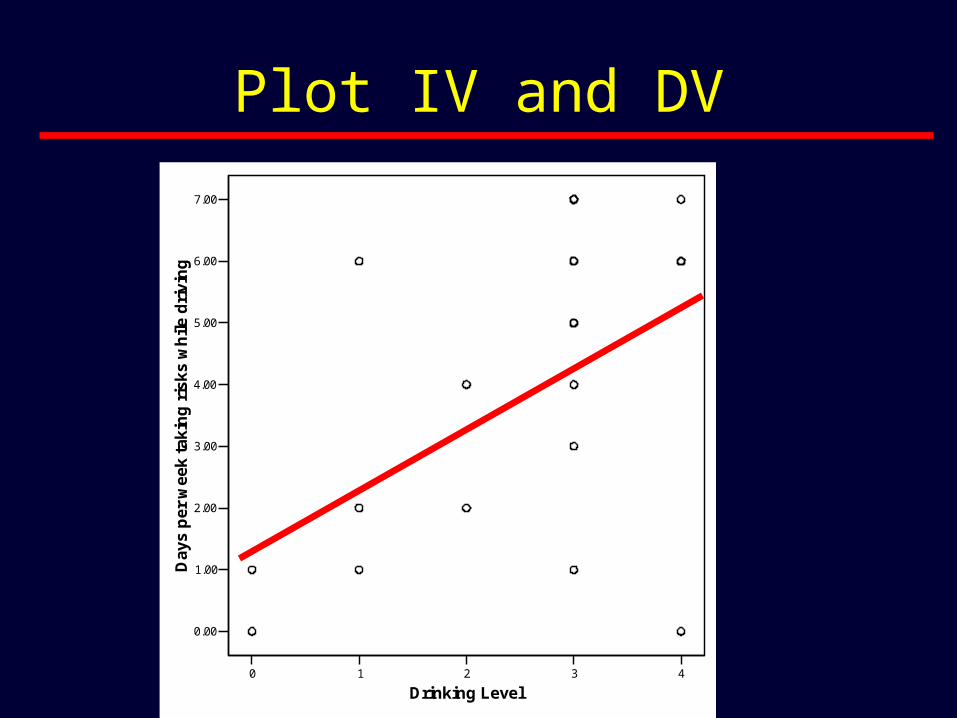
Plot IV and DV
0 1 2 3 4
Drinking Level
0.00
1.00
2.00
3.00
4.00
5.00
6.00
7.00
Day
s p
er w
eek
taki
ng
ris
ks w
hile
dri
vin
g
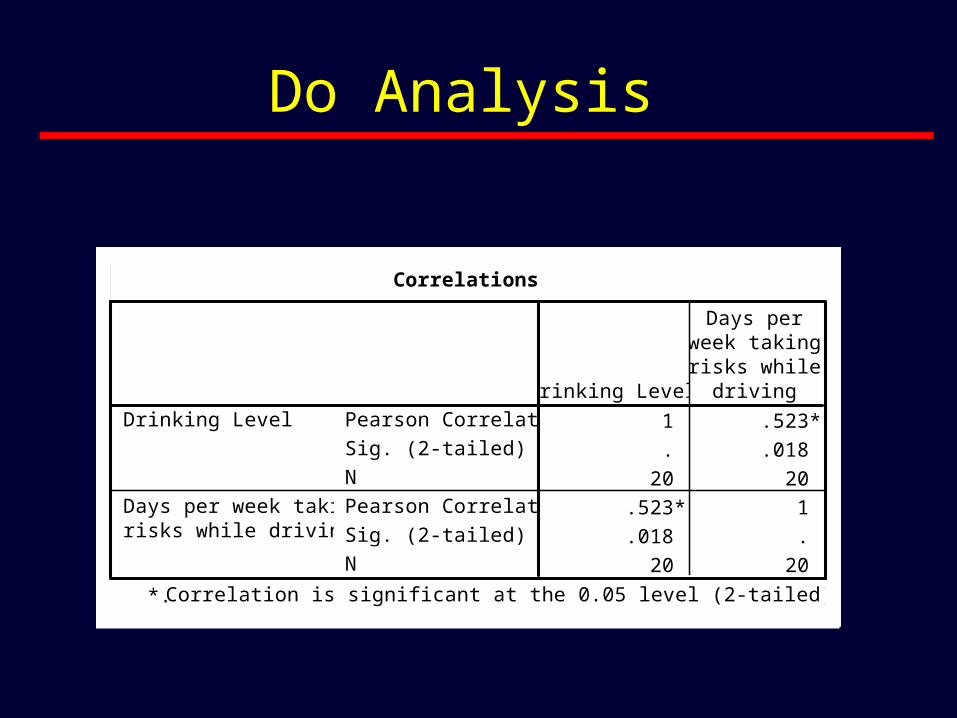
Do Analysis
Correlations
1 .523*
. .018
20 20
.523* 1
.018 .
20 20
Pearson Correlation
Sig. (2-tailed)
N
Pearson Correlation
Sig. (2-tailed)
N
Drinking Level
Days per week takingrisks while driving
Drinking Level
Days perweek takingrisks while
driving
Correlation is significant at the 0.05 level (2-tailed).*.
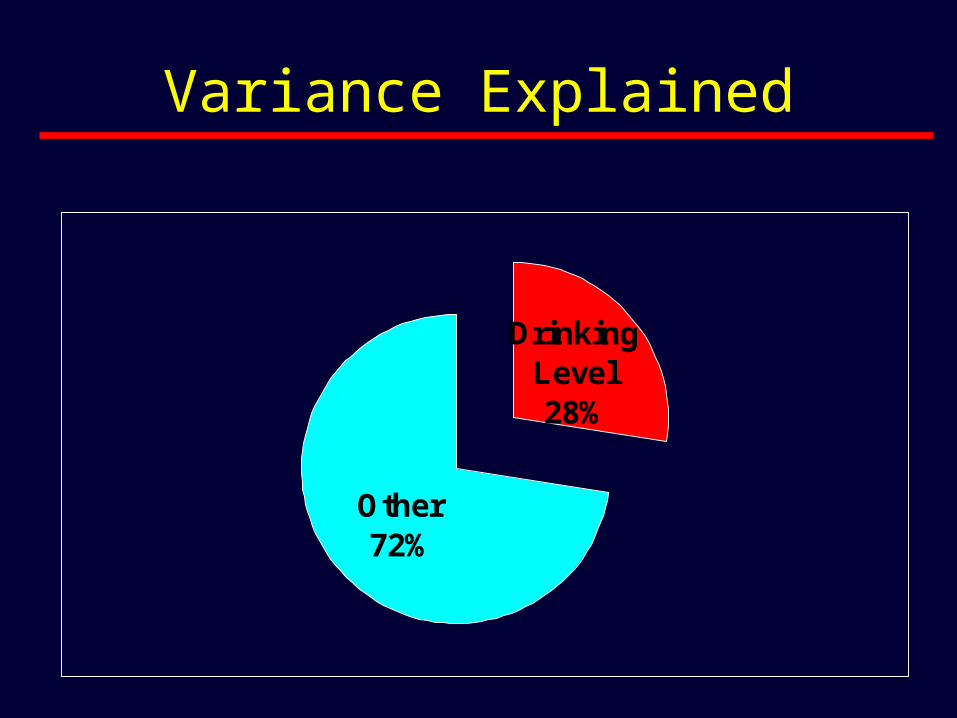
Variance Explained
Drinking Level28%
Other72%
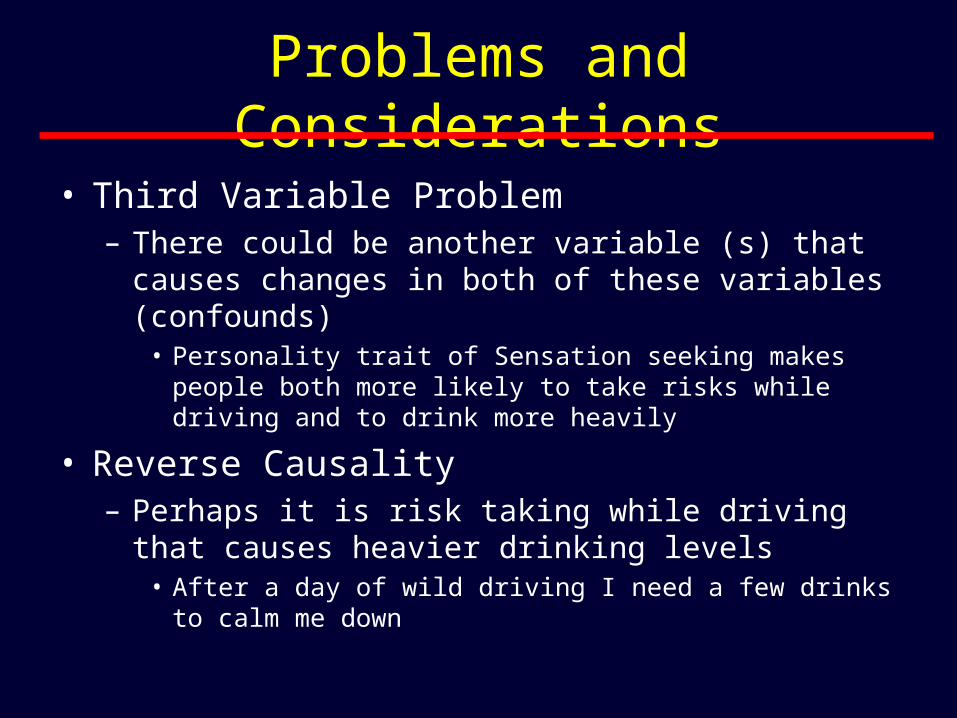
Problems and Considerations
• Third Variable Problem– There could be another variable (s) that causes
changes in both of these variables (confounds) • Personality trait of Sensation seeking makes people both
more likely to take risks while driving and to drink more heavily
• Reverse Causality– Perhaps it is risk taking while driving that causes
heavier drinking levels • After a day of wild driving I need a few drinks to calm me
down

Third Variable Confounds
• Personal Confounds– Sensation seeking example – a personality trait
causes both of these variables (risk taking and drinking to co-vary)
• Environmental Confounds– A situational variable causes changes in the other
variables• Heavy traffic causes more risk taking and heavier drinking
• Operational Confounds– Your operational definition did not measure only what
you were expecting it to measure but something else.
Reverse Causality
• Because of the potential for reverse causality, researchers use longitudinal and prospective designs
• Some factors are logically unlikely to be possible in both directions (increases in school performance over 3 years co-vary with increases in parent income)
• Multiple research methods make reverse causality less likely and control vore various other confounds
Archival Research
• Examination of existing public research to test a theory or hypothesis– Jail reports– Hospital reports– Newspaper articles– Police reports
Observational Research
• Investigations of real behaviors in their natural environments– Unobtrusive
• Researchers do not interfere• Subjects don’t know they are being watched
Questionnaires and Interviews
• If you want to know what someone thinks – ask them
• Contrary to all the worrying (somewhat justified) – participant reaction bias (personal confounds) may occur, but people generally are willing to talk to you– Especially disenfranchised individuals (must
be careful they do not see you as trying to help them – ethics problem)
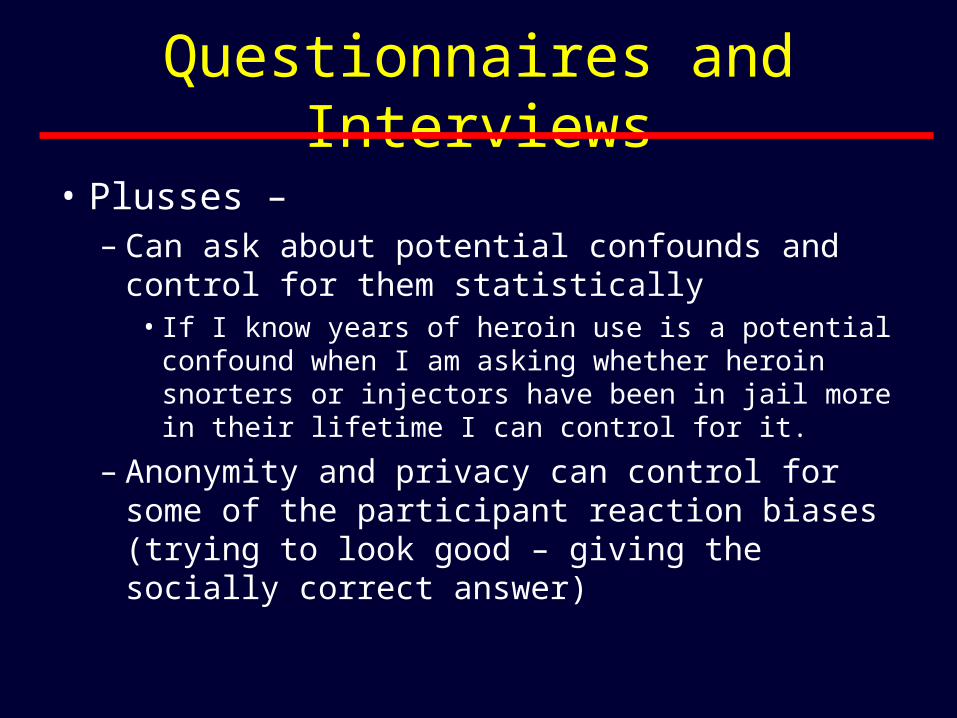
Questionnaires and Interviews
• Plusses –– Can ask about potential confounds and
control for them statistically• If I know years of heroin use is a potential
confound when I am asking whether heroin snorters or injectors have been in jail more in their lifetime I can control for it.
– Anonymity and privacy can control for some of the participant reaction biases (trying to look good – giving the socially correct answer)
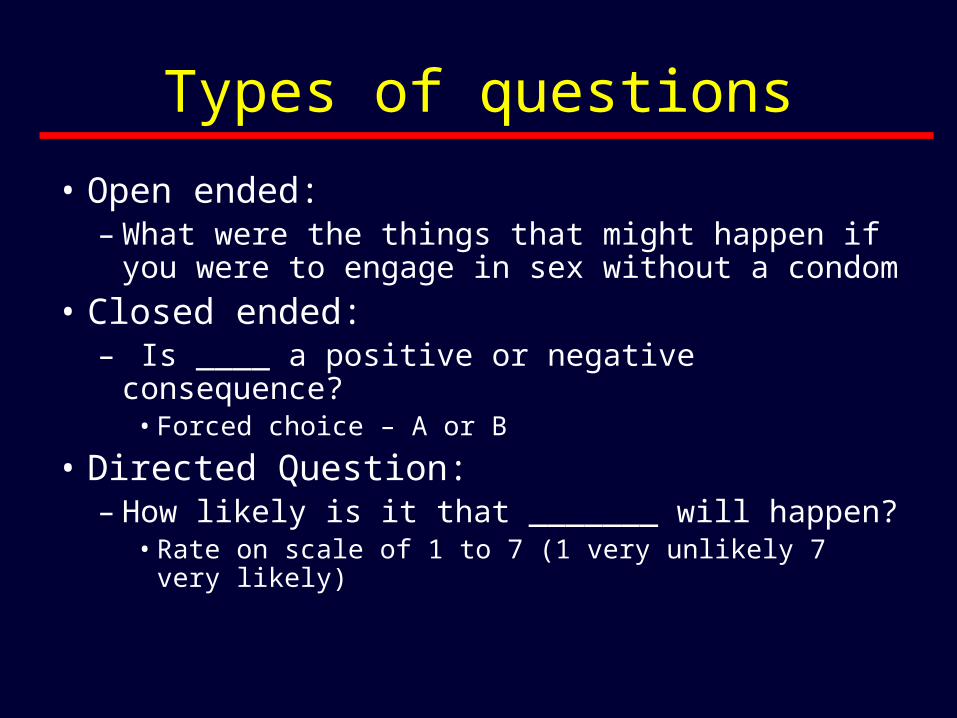
Types of questions
• Open ended:– What were the things that might happen if you
were to engage in sex without a condom
• Closed ended:– Is ____ a positive or negative consequence?
• Forced choice – A or B
• Directed Question:– How likely is it that _______ will happen?
• Rate on scale of 1 to 7 (1 very unlikely 7 very likely)