Embed Size (px)
Citation preview

ORI GIN AL
Non-destructive evaluation of checking in thermallymodified timber
Laura Tomppo • Markku Tiitta • Reijo Lappalainen
Received: 19 February 2013 / Published online: 23 November 2013
� Springer-Verlag Berlin Heidelberg 2013
Abstract Non-destructive measurement techniques were used to study the char-
acteristics of thermally modified timber (TMT), especially checking. Two non-
destructive measurement techniques were evaluated: air-coupled ultrasound (ACU)
and electrical impedance spectroscopy (EIS). In the studied TMT (N = 38), density
and pith location in the cross-section were positively correlated with the number of
checks in the cross-section. Several ultrasound signal features correlated with TMT
characteristics, most strongly with number of checks. Severely checked samples and
other samples were considered as two different classes of checking, and the
potential of ultrasound for differentiating between the two classes was tested by
using Bayesian classification method. The correct classification rate was 97 %. EIS
parameters correlated with density and latewood content of TMT more strongly than
the ACU parameters. Thus, for determination of checking and density or earlywood/
latewood content, both EIS and ACU measurements are recommended.
Introduction
In thermal modification, wood is kept at 170–230 �C for several hours in an
atmosphere that prevents it from burning. Thermal modification affects both the
physical and chemical properties of wood. For example, it improves the dimensional
stability and increases decay resistance and the thermal insulating capacity of wood.
On the other hand, the bending, tensile and compression strength of wood tend to
decrease. The extent of the changes is affected by treatment temperature and the
wood species. Internal checking in TMT is mainly caused by drying, although to
some extent it can be caused by the stress attributable to thermal degradation
L. Tomppo (&) � M. Tiitta � R. Lappalainen
Department of Applied Physics, University of Eastern Finland (Kuopio Campus),
PO Box 1627, 70211 Kuopio, Finland
e-mail: [email protected]
123
Wood Sci Technol (2014) 48:227–238
DOI 10.1007/s00226-013-0603-2
(Johansson 2008). Checking of wood during drying or thermal modification is an
undesirable phenomenon. Surface checks can be detected from wood visually, but in
practice, internal checks are usually detected in a destructive manner by cutting a
test set of samples and imaging them visually. Thus, there is a need for a non-
destructive testing (NDT) technique to detect the internal checks of TMT.
Ultrasound has been conventionally used as a non-destructive measurement
technique for detecting internal defects (e.g. Pellerin Roy and Ross 2002; Bucur
2003). Different types of defects exert various effects on the ultrasound propagation.
Honeycombs, i.e. internal checking and surface checks increase the ultrasound
transmission time in a perpendicular direction to the grain (Fuller et al. 1994). In
addition, bacterially infected sections of wetwood increase the stress wave travel
time (Verkasalo et al. 1993). Presumably the honeycombs in wood cause scattering
of the ultrasound, whereas wetwood increases viscoelastic damping, both resulting
in attenuated sound signals (Schafer 1999, 2000). The recent development of ACU
techniques (Bhardwaj 2004a, b) makes the method more feasible for online
industrial applications. For example, the use of an online meter for wood moisture
content (MC) based on ACU has been proposed (Vun et al. 2008), and density and
defects in wood samples have been studied by ACU (Marchetti et al. 2004). In
addition, through transmission, ACU has been utilised in the detection of checks in
timber (Gan et al. 2005), delamination in wood (Bucur 2010, 2011) and in glulam
beams up to 500 mm thickness (Sanabria 2012; Sanabria et al. 2013). In wood-
based panels, both density and particle type affect the ACU response (Hilbers et al.
2012a). In addition, the interference of the through transmitted ultrasound signals
has an effect, although blister detection in panels is not affected by the interference
(Hilbers et al. 2012b).
Moisture content (MC) and the mechanical properties of wood such as strength
and density can influence the propagation of the ultrasound signal. The effect of
wood density on ultrasound velocity is ambiguous; it has been concluded in earlier
studies that it has no influence (Ilic 2003; Baar et al. 2012), or it has a positive
correlation (de Oliveira and Sales 2006) or a negative correlation (Bucur and
Chivers 1991). Ilic (2003) attributed the variance to microfibril angle and other
anatomical characteristics of wood. The results of de Oliveira and Sales (2006) are
in accordance with the hypothesis; there were clearer relationships between
ultrasound velocity and the density of wood when each species was analysed
separately rather than trying to analyse all species together. On the other hand, the
dielectric properties of wood are mostly affected by the MC of wood, although also
density has an impact (Lin 1967; Hasted 1973; James 1975; Torgovnikov 1993).
Promising results have been obtained by combining different NDT techniques, for
example, in strength grading (Hanhijarvi and Ranta-Maunus 2008; Brannstrom
2009), monitoring the wood drying process (Tiitta et al. 2010) or to determine the
MC and density of timber (Tiuri et al. 1980) or the MC of TMT (van der Beek et al.
2011).
In addition to ultrasound and other acoustic techniques, rather few methods are
suitable for detection of internal checks. These include computed tomography (e.g.
Bhandarkar et al. 2005) and microwave imaging (e.g. Pastorino et al. 2007).
However, the X-rays or microwaves are related to the density of the sample,
228 Wood Sci Technol (2014) 48:227–238
123
whereas acoustic methods evaluate its mechanical and structural properties, and in
most applications, this is a real advantage. Furthermore, the imaging techniques
tend to be costly and time-consuming.
In the current study, the TMT was studied under laboratory conditions. The
macroscopic characteristics of thermally modified pine were surveyed with respect
to the severity of the checking. The main goal was to determine whether air-coupled
ultrasound could potentially detect internal checks in thermally modified pine and
whether electrical impedance spectroscopy could be used to improve the possible
check or density prediction capability of ultrasound.
Materials and methods
Thermowood D timber planks of Scots pine (Pinus sylvestris, 50 9 150 9
1,500 mm3, treatment temperature 212 ± 3 �C, N = 38) were measured in
laboratory with ACU and EIS from the middle of the plank. The samples were
collected from a sawmill warehouse and measured after at least 2 weeks of storage
under normal laboratory conditions. Oven dry density (q), moisture content (MC),
average width of a year ring (wYR), latewood content (LW) and pith content
(pith %), distance of pith from the surface of the plank (dp) and checking of the
samples were determined with destructive techniques from cross-cuts sawn from the
planks. Latewood and pith % were determined from a straight line drawn on the
cross-section radially normal to the flat side surface. Pith % was the length of
the line including pith in relation to total length. Checks were detected with the
naked eye, which is the standard procedure in TMT quality control. The numbers of
checks in four categories were determined: length \5 mm, 5–10 mm, 10–20 mm
and [20 mm. In addition, the total number of checks (NC) in a cross-section was
determined.
ACU measurements were made with two through transmission setups across the
grain. The measurements with 100 kHz (nominal) transducers were taken from
three points close to each other and with 380 kHz transducers from three locations,
from the middle and from the edges of the plank (Fig. 1). The measurement system
consisted of Olympus 5058PR high-voltage pulser-receiver (Olympus Corporation,
Tokyo, Japan) and a PC with Compuscope 8380 digitiser (Gage Applied
Technologies Inc. Lachine, Quebec, Canada). GMP transducers (Gas Matrix
Piezoelectric) were used for the measurements: NCG100-D50-P150 (transmitter,
focused), NCG100-S25 (receiver) and NCG500-D13 (The Ultran Group, State
College, PA, USA). Several parameters describing the shape and the amplitude of
the signal were determined: centroid time (Ct), centroid frequency (Cf), time to
maximum amplitude (T_max), maximum amplitude in time domain (Maxamp),
frequency of the maximum peak in frequency domain (Fmax), maximum amplitude
in the frequency domain (Fmaxamp) and area of the signal in frequency domain
(AF). The signals in frequency domain had two peaks, which were also analysed
separately. Thus, the frequency of the maximum peak at lower/higher frequencies
was determined (Fmax1/Fmax2) with the maximum amplitudes in frequency
domain at lower/higher frequencies (Fmaxamp1/Fmaxamp2).
Wood Sci Technol (2014) 48:227–238 229
123
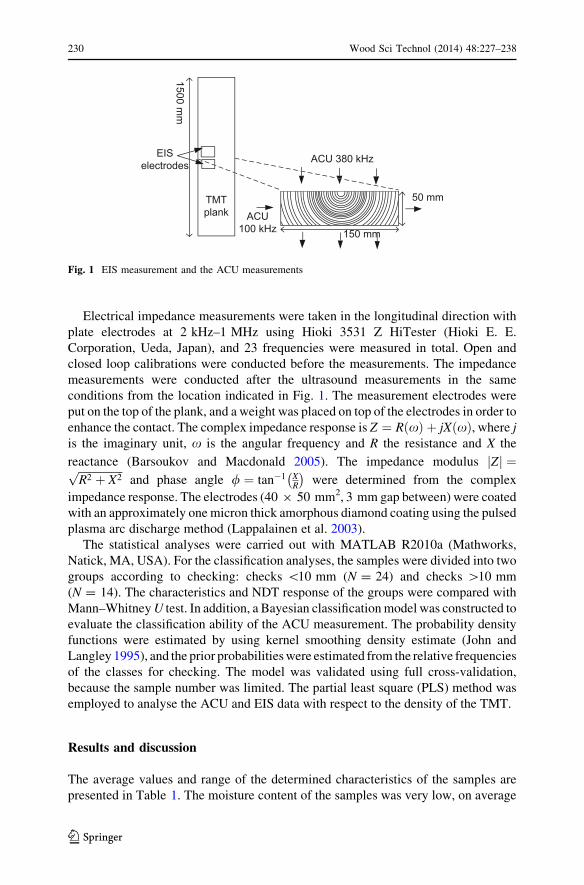
Electrical impedance measurements were taken in the longitudinal direction with
plate electrodes at 2 kHz–1 MHz using Hioki 3531 Z HiTester (Hioki E. E.
Corporation, Ueda, Japan), and 23 frequencies were measured in total. Open and
closed loop calibrations were conducted before the measurements. The impedance
measurements were conducted after the ultrasound measurements in the same
conditions from the location indicated in Fig. 1. The measurement electrodes were
put on the top of the plank, and a weight was placed on top of the electrodes in order to
enhance the contact. The complex impedance response is Z ¼ R xð Þ þ jX xð Þ, where j
is the imaginary unit, x is the angular frequency and R the resistance and X the
reactance (Barsoukov and Macdonald 2005). The impedance modulus Zj j ¼ffiffiffiffiffiffiffiffiffiffiffiffiffiffiffiffi
R2 þ X2p
and phase angle / ¼ tan�1 XR
� �
were determined from the complex
impedance response. The electrodes (40 9 50 mm2, 3 mm gap between) were coated
with an approximately one micron thick amorphous diamond coating using the pulsed
plasma arc discharge method (Lappalainen et al. 2003).
The statistical analyses were carried out with MATLAB R2010a (Mathworks,
Natick, MA, USA). For the classification analyses, the samples were divided into two
groups according to checking: checks \10 mm (N = 24) and checks [10 mm
(N = 14). The characteristics and NDT response of the groups were compared with
Mann–Whitney U test. In addition, a Bayesian classification model was constructed to
evaluate the classification ability of the ACU measurement. The probability density
functions were estimated by using kernel smoothing density estimate (John and
Langley 1995), and the prior probabilities were estimated from the relative frequencies
of the classes for checking. The model was validated using full cross-validation,
because the sample number was limited. The partial least square (PLS) method was
employed to analyse the ACU and EIS data with respect to the density of the TMT.
Results and discussion
The average values and range of the determined characteristics of the samples are
presented in Table 1. The moisture content of the samples was very low, on average
Fig. 1 EIS measurement and the ACU measurements
230 Wood Sci Technol (2014) 48:227–238
123

2.5 %. Most of the samples included pith, but there were 14 samples without pith in
the cross-sectional cut of the measured section. The correlations between the
determined characteristics are shown in Table 2. For example, the following
correlations were significant: NC/density, NC/pith and density/MC. Examples of
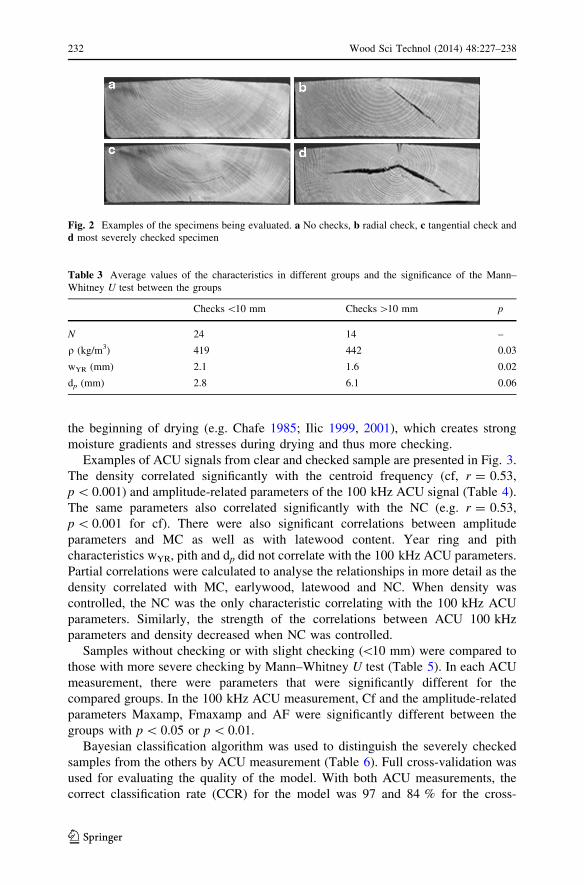
plank cross-cuts are presented in Fig. 2. Most of the checks visible in the tested
TMT were radial, but also tangential or mixed checks were present.
The slightly checked samples were compared to the severely checked counter-
parts. According to Mann–Whitney U test, there were significant differences
between the groups in terms of density and wYR (Table 3). A nearly statistically
significant difference was observed for the dp. In fact, if the cutoff of the two groups
was changed towards lower checking, i.e. group with checks\5 mm was compared
to others (N = 17/21), the difference between percentage of pith in the groups
(Pith = 1.5/4.0 %, p = 0.007) and pith location (dp = 1.4/6.1 mm, p = 0.004)
became highly significant. Pith in the cross-section of a timber has been previously
identified as a factor for increased checking with both normal drying (Sandberg
2005) and thermal modification (Johansson 2006). The relation between density and
checking can be explained by MC; MC of high-density timber is usually higher at
Table 1 Characteristics of the determined properties of TMT, N = 38
Mean Std Min Max
q (kg/m3) 428 31 366 499
MC (%) 2.5 0.3 1.8 3.1
wyr (mm) 2.0 0.7 0.7 3.8
LW (%) 17 4 9 28
Pith (%) 3 3 0 10
dp (mm) 4 5 0 18
NC 2 2 0 9
Number of checks
\5 mm 1 1 0 4
5–10 mm 1 1 0 5
10–20 mm 0 0 0 2
[20 mm 0 1 0 2
Table 2 Correlations for the sample characteristics, N = 38
q MC WYR LW Pith dp
MC -0.42** – – – – –
wYR -0.31 0.24 – – – –
LW 0.48** -0.12 -0.42** – – –
Pith 0.02 -0.06 0.10 -0.46** – –
dp 0.18 -0.20 -0.01 -0.20 0.64*** –
NC 0.37* -0.08 -0.11 -0.16 0.47** 0.68***
* p \ 0.05, ** p \ 0.01, *** p \ 0.001
Wood Sci Technol (2014) 48:227–238 231
123
the beginning of drying (e.g. Chafe 1985; Ilic 1999, 2001), which creates strong
moisture gradients and stresses during drying and thus more checking.
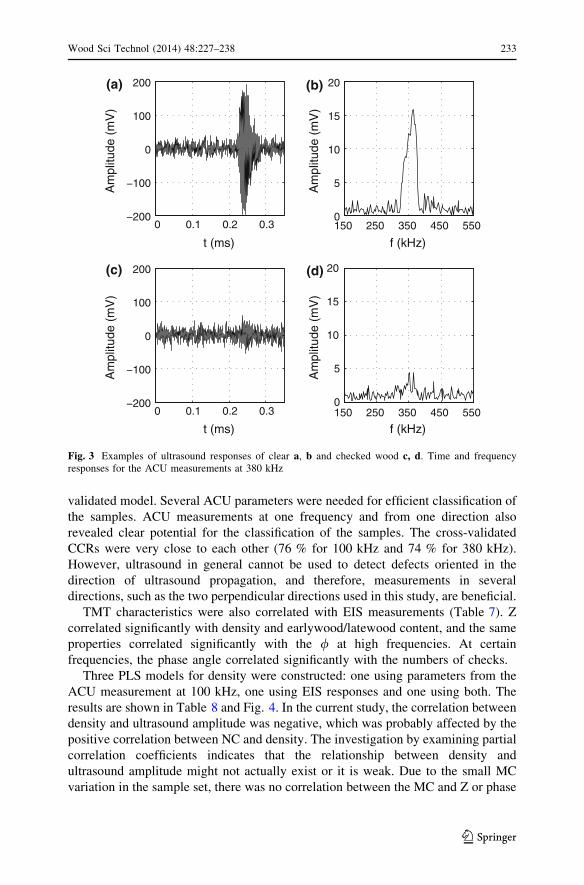
Examples of ACU signals from clear and checked sample are presented in Fig. 3.
The density correlated significantly with the centroid frequency (cf, r = 0.53,
p \ 0.001) and amplitude-related parameters of the 100 kHz ACU signal (Table 4).
The same parameters also correlated significantly with the NC (e.g. r = 0.53,
p \ 0.001 for cf). There were also significant correlations between amplitude
parameters and MC as well as with latewood content. Year ring and pith
characteristics wYR, pith and dp did not correlate with the 100 kHz ACU parameters.
Partial correlations were calculated to analyse the relationships in more detail as the
density correlated with MC, earlywood, latewood and NC. When density was
controlled, the NC was the only characteristic correlating with the 100 kHz ACU
parameters. Similarly, the strength of the correlations between ACU 100 kHz
parameters and density decreased when NC was controlled.
Samples without checking or with slight checking (\10 mm) were compared to
those with more severe checking by Mann–Whitney U test (Table 5). In each ACU
measurement, there were parameters that were significantly different for the
compared groups. In the 100 kHz ACU measurement, Cf and the amplitude-related
parameters Maxamp, Fmaxamp and AF were significantly different between the
groups with p \ 0.05 or p \ 0.01.
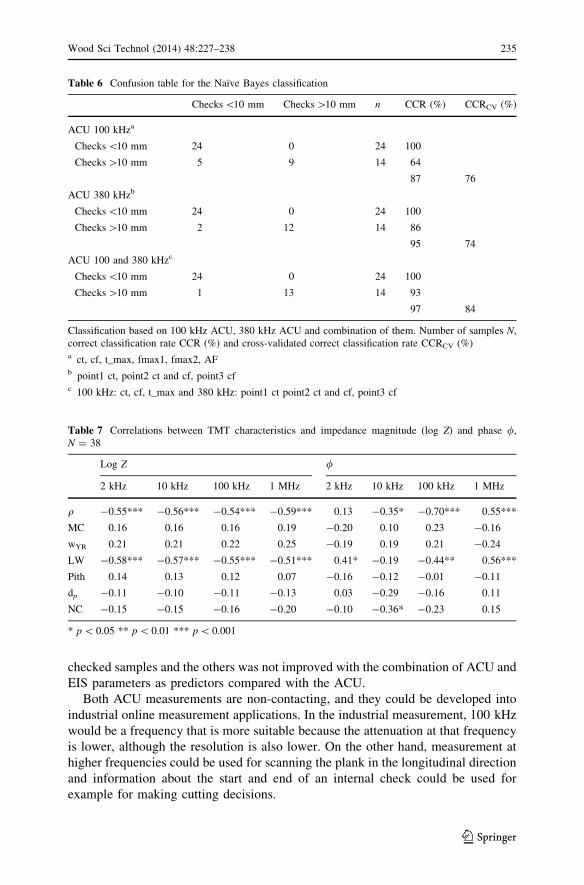
Bayesian classification algorithm was used to distinguish the severely checked
samples from the others by ACU measurement (Table 6). Full cross-validation was
used for evaluating the quality of the model. With both ACU measurements, the
correct classification rate (CCR) for the model was 97 and 84 % for the cross-
Fig. 2 Examples of the specimens being evaluated. a No checks, b radial check, c tangential check andd most severely checked specimen
Table 3 Average values of the characteristics in different groups and the significance of the Mann–
Whitney U test between the groups
Checks \10 mm Checks [10 mm p
N 24 14 –
q (kg/m3) 419 442 0.03
wYR (mm) 2.1 1.6 0.02
dp (mm) 2.8 6.1 0.06
232 Wood Sci Technol (2014) 48:227–238
123
validated model. Several ACU parameters were needed for efficient classification of
the samples. ACU measurements at one frequency and from one direction also
revealed clear potential for the classification of the samples. The cross-validated
CCRs were very close to each other (76 % for 100 kHz and 74 % for 380 kHz).
However, ultrasound in general cannot be used to detect defects oriented in the
direction of ultrasound propagation, and therefore, measurements in several
directions, such as the two perpendicular directions used in this study, are beneficial.
TMT characteristics were also correlated with EIS measurements (Table 7). Z
correlated significantly with density and earlywood/latewood content, and the same
properties correlated significantly with the / at high frequencies. At certain
frequencies, the phase angle correlated significantly with the numbers of checks.
Three PLS models for density were constructed: one using parameters from the
ACU measurement at 100 kHz, one using EIS responses and one using both. The
results are shown in Table 8 and Fig. 4. In the current study, the correlation between
density and ultrasound amplitude was negative, which was probably affected by the
positive correlation between NC and density. The investigation by examining partial
correlation coefficients indicates that the relationship between density and
ultrasound amplitude might not actually exist or it is weak. Due to the small MC
variation in the sample set, there was no correlation between the MC and Z or phase
0 0.1 0.2 0.3−200
−100
0
100
200
Am
plitu
de (
mV
)
t (ms)
(a)
150 250 350 450 5500
5
10
15
20
Am
plitu
de (
mV
)
f (kHz)
(b)
0 0.1 0.2 0.3−200
−100
0
100
200
Am
plitu
de (
mV
)
t (ms)
(c)
150 250 350 450 5500
5
10
15
20
Am
plitu
de (
mV
)
f (kHz)
(d)
Fig. 3 Examples of ultrasound responses of clear a, b and checked wood c, d. Time and frequencyresponses for the ACU measurements at 380 kHz
Wood Sci Technol (2014) 48:227–238 233
123

angle, but the correlation between density and Z was significant throughout the
frequency range. The r2 (0.38) of the PLS model constructed with only EIS was
higher than that of ACU PLS model. Wood properties have different effects on EIS
and ACU, and thus, the methods were combined in the third PLS model. This
approach increased the r2 slightly to 0.43 with RMSEP 23 kg/m3. This result
demonstrates the supplementary characteristics of EIS and ACU. It should be
emphasised that in the current study, the original goal was not to determine the
density, but to study the density as a cofactor in the ACU determination of checking.
Measurement in the longitudinal rather than in the transverse direction would be
advisable in the density determination. The classification result between severely
Table 4 Correlations between TMT characteristics and ACU parameters at 100 kHz, N = 38
Correlation Partial correlation
q MC Latewood NC q, NC controlled NC, q controlled
Ct 0.28 -0.13 0.01 0.52*** 0.06 0.47**
Cf 0.53*** -0.33* 0.23 0.53*** 0.34* 0.42**
T_max 0.26 -0.07 -0.08 0.48** 0.06 0.43**
Maxamp -0.46** 0.38* -0.30 -0.45** -0.29 -0.34*
Fmax 0.00 0.05 0.06 -0.19 0.09 -0.20
Fmaxamp -0.41* 0.34* -0.38* -0.38* -0.25 -0.27
Fmax1 0.03 -0.12 0.09 -0.06 0.11 -0.08
Fmaxamp1 -0.41* 0.34* -0.38* -0.38* -0.25 -0.27
Fmax2 -0.02 0.13 0.16 -0.16 0.07 -0.17
Fmaxamp2 -0.29 0.25 -0.09 -0.44** -0.07 -0.38*
AF -0.45** 0.37* -0.32 -0.42** -0.27 -0.31
* p \ 0.05, ** p \ 0.01, *** p \ 0.001
Table 5 Average values for ACU parameters in two checking groups (slightly checked/severely
checked) and the statistical significance of Mann–Whitney U test between the groups
100 kHz 380 kHz
Point 1 Point 2 Point 3
Ct 1,550/1,570 610/600** 593/601* 610/610
Cf 53/60** 82/83 81/84* 82/79*
T_max 1,370/1,450 630/600 590/640* 620/610
Maxamp 0.78/0.47** 0.10/0.09 0.10/0.06* 0.08/0.11
Fmax 30/29 58/59 57/49 56/57
Fmaxamp 80/52* 3.3/2.8 3.33/1.79 2.85/3.72
AF 540/390** 63/6 63/52** 59/66*
* p \ 0.05, ** p \ 0.01
234 Wood Sci Technol (2014) 48:227–238
123
checked samples and the others was not improved with the combination of ACU and
EIS parameters as predictors compared with the ACU.
Both ACU measurements are non-contacting, and they could be developed into
industrial online measurement applications. In the industrial measurement, 100 kHz
would be a frequency that is more suitable because the attenuation at that frequency
is lower, although the resolution is also lower. On the other hand, measurement at
higher frequencies could be used for scanning the plank in the longitudinal direction
and information about the start and end of an internal check could be used for
example for making cutting decisions.
Table 6 Confusion table for the Naıve Bayes classification
Checks \10 mm Checks [10 mm n CCR (%) CCRCV (%)
ACU 100 kHza
Checks \10 mm 24 0 24 100
Checks [10 mm 5 9 14 64
87 76
ACU 380 kHzb
Checks \10 mm 24 0 24 100
Checks [10 mm 2 12 14 86
95 74
ACU 100 and 380 kHzc
Checks \10 mm 24 0 24 100
Checks [10 mm 1 13 14 93
97 84
Classification based on 100 kHz ACU, 380 kHz ACU and combination of them. Number of samples N,
correct classification rate CCR (%) and cross-validated correct classification rate CCRCV (%)a ct, cf, t_max, fmax1, fmax2, AFb point1 ct, point2 ct and cf, point3 cfc 100 kHz: ct, cf, t_max and 380 kHz: point1 ct point2 ct and cf, point3 cf
Table 7 Correlations between TMT characteristics and impedance magnitude (log Z) and phase /,
N = 38
Log Z /
2 kHz 10 kHz 100 kHz 1 MHz 2 kHz 10 kHz 100 kHz 1 MHz
q -0.55*** -0.56*** -0.54*** -0.59*** 0.13 -0.35* -0.70*** 0.55***
MC 0.16 0.16 0.16 0.19 -0.20 0.10 0.23 -0.16
wYR 0.21 0.21 0.22 0.25 -0.19 0.19 0.21 -0.24
LW -0.58*** -0.57*** -0.55*** -0.51*** 0.41* -0.19 -0.44** 0.56***
Pith 0.14 0.13 0.12 0.07 -0.16 -0.12 -0.01 -0.11
dp -0.11 -0.10 -0.11 -0.13 0.03 -0.29 -0.16 0.11
NC -0.15 -0.15 -0.16 -0.20 -0.10 -0.36* -0.23 0.15
* p \ 0.05 ** p \ 0.01 *** p \ 0.001
Wood Sci Technol (2014) 48:227–238 235
123

Conclusion
An effective detection method for internal checks in TMT was developed based on
the ACU technique. The method requires measurements in two directions, and
several parameters are determined from the ultrasound signals which are then
subjected to statistical analyses. The method also holds potential for determination
of internal checking in normally dried timber, and since it is a non-contacting
technique, it is a feasible method for the use in quality control.
The ACU was primarily studied for classifying TMT according to the severity of
checks. The checks included both surface and internal checks. The correct
classification rates of 87 % and above were very promising, and the current study
represents the basis for a large-scale study. Furthermore, it seems that EIS is not
needed if the goal is to classify severely checked samples from the others. However,
Table 8 Summary of the PLS models for density in TMT
r2ð Þ r2cv
� �
RMSEP
(kg/m3)
RMSEPcv
(kg/m3)
ACU 100 kHz 0.22 0.08 27 30
EIS 0.38 0.28 26 24
ACU 100 kHz and EIS 0.43 0.32 23 25
The applied measurement method, the coefficient of determination r2ð Þ the cross-validated coefficient of
determination r2cv
� �
, root mean square error of prediction without and with cross-validation (RMSEP/
RMSEPcv). N was 38 and the number of latent variables was one for each model
360 380 400 420 440 460 480 500360
380
400
420
440
460
480
500
Observed ρ (kg/m3)
Pre
dict
ed ρ
(kg
/m3 )
Fig. 4 Density predicted by PLS model. ACU 100 kHz and EIS included in the model, r2 = 0.43
236 Wood Sci Technol (2014) 48:227–238
123
for the determination of checking and the density or earlywood/latewood content, a
combination of EIS and ACU measurements is recommended.
Acknowledgments We would like to thank Mr. Jelle van der Beek and Mr. Sauli Vesamo for their help
in the experimental part of the study. We also thank Mr. Mauno Multamaki for preparing the samples for
destructive analysis. The study was funded by the European Regional Development Fund (ERDF) and the
Finnish Funding Agency for Technology and Innovation (TEKES).
References
Baar J, Tippner J, Gryc V (2012) The influence of wood density on longitudinal wave velocity determined
by the ultrasound method in comparison to the resonance longitudinal method. Eur J Wood Prod
70:767–769
Barsoukov E, Macdonald JR (2005) Impedance spectroscopy—theory, experiment, and applications.
Wiley, Hoboken
Bhandarkar SM, Luo X, Daniels R, Tollner EW (2005) Detection of cracks in computer tomography
images of logs. Pattern Recognit Lett 26:2282–2294
Bhardwaj MC (2004a) High efficiency non-contact transducers and a very high coupling piezoelectric
composite, 16th world conference on nondestructive testing, Aug 30th–Sept 3rd, Montreal, Canada
Bhardwaj MC (2004b) Evolution of piezoelectric transducers to full scale non-contact ultrasonic analysis
mode, 16th world conference on nondestructive testing, Aug 30th–Sept 3rd, Montreal, Canada
Brannstrom M (2009) Integrated strength grading. Dissertation, Lulea University of Technology, LTU
Skelleftea, Division of Wood Physics
Bucur V (2003) Nondestructive characterization and imaging of wood. Springer Verlag, Berlin
Bucur V (2010) Delamination detection in wood–based composites, a methodological review.
Proceedings of 20th international congress on acoustics, ICA, Aug 23–27, Sydney, Australia, pp 1–8
Bucur V (2011) Delamination in wood, wood products and wood-based composites. Springer, Dordrecht
Bucur V, Chivers RC (1991) Acoustic properties and anisotropy of some Australian wood species. Acta
Acustica 75:69–74
Chafe S (1985) The distribution and interrelationship of collapse, volumetric shrinkage, moisture content
and density in trees of Eucalyptus regnans F Muell. Wood Sci Technol 19:329–345
de Oliveira FGR, Sales A (2006) Relationship between density and ultrasonic velocity in Brazilian
tropical woods. Bioresour Technol 97:2443–2446
Fuller JJ, Ross RJ, Dramm JR (1994) Honeycomb and surface check detection using ultrasonic
nondestructive evaluation FPL-RN–0261. Forest Products Laboratory, Madison
Gan TH, Hutchins DA, Green RJ, Andrews MK, Harris PD (2005) Noncontact, high-resolution ultrasonic
imaging of wood samples using coded chirp waveforms. IEEE Int Ultrason Ferr 52:280–288
Hanhijarvi A, Ranta-Maunus A (2008) Development of strength grading of timber using combined
measurement techniques. Report of the Combigrade project-phase 686, Espoo
Hasted JB (1973) Aqueous dielectrics. Chapman and Hall, London
Hilbers U, Neuenschwander J, Hasener J, Sanabria S, Niemz P, Thoemen H (2012a) Observation of
interference effects in air-coupled ultrasonic inspection of wood-based panels. Wood Sci Technol
46:979–990
Hilbers U, Thoemen H, Hasener J, Fruehwald A (2012b) Effects of panel density and particle type on the
ultrasonic transmission through wood-based panels. Wood Sci Technol 46:685–698
Ilic J (1999) Shrinkage-related degrade and its association with some physical properties in Eucalyptus
regnans F Muell. Wood Sci Technol 33:425–437
Ilic J (2001) Variation of the dynamic elastic modulus and wave velocity in the fibre direction with other
properties during the drying of Eucalyptus regnans F Muell. Wood Sci Technol 35:157–166
Ilic J (2003) Dynamic MOE of 55 species using small wood beams. Eur J Wood Prod 61:167–172
James WL (1975) Dielectric properties of wood and hardboard: variation with temperature, frequency,
moisture content, and grain orientation. USDA For Serv Res Pap FPl USDA FPL-245. Forest
products laboratory, Madison
Johansson D (2006) Influences of drying on internal checking of spruce (Picea abies L.) heat-treated at
212 �C. Holzforschung 60:558–560
Wood Sci Technol (2014) 48:227–238 237
123
Johansson D (2008) Heat treatment of solid wood - effects of absorption, strength and colour.
Dissertation, Lulea University of Technology, LTU Skelleftea, Division of Wood Physics
John GH, Langley P (1995) Estimating continuous distributions in Bayesian classifiers, UAI’95
Proceedings of the eleventh conference on uncertainty in artificial intelligence, 338–345. Morgan
Kaufmann Publishers Inc., San Francisco
Lappalainen R, Selenius M, Anttila A, Konttinen YT, Santavirta SS (2003) Reduction of wear in total hip
replacement prostheses by amorphous diamond coatings. J Biomed Mater Res B Appl Biomater
66:410–413
Lin RT (1967) Review of the electrical properties of wood and cellulose. For Prod J 17:54–61
Marchetti B, Munaretto R, Revel G, Tomasini EP, Bianche VB (2004) Non-contact ultrasonic sensor for
density measurement and defect detection on wood, 16th world conference on nondestructive
testing, Aug 30–Sept 3, Montreal, Canada
Pastorino M, Salvade A, Monleone R, Bartesaghi T, Bozza G, Randazzo A (2007) Detection of defects in
wood slabs by using a microwave imaging technique, instrumentation and measurement technology
conference proceedings, 2007, IMTC 2007. IEEE, May 1–3, Warsaw, Poland, pp 1–6
Pellerin Roy F, Ross RJ (eds) (2002) Nondestructive evaluation of wood. Forest Products Society,
Madison
Sanabria S (2012) Air-coupled ultrasound propagation and novel non-destructive bonding quality
assessment of timber composites. Dissertation, Swiss Federal Institute of Technology Zurich,
Institute for Building Materials
Sanabria SJ, Furrer R, Neuenschwander J, Niemz P, Sennhauser U (2013) Novel slanted incidence air-
coupled ultrasound method for delamination assessment in individual bonding planes of structural
multi-layered glued timber laminates. Ultrasonics 53:1309–1324
Sandberg D (2005) Distortion and visible crack formation in green and seasoned timber: influence of
annual ring orientation in the cross section. Holz Roh Werkst 63:11–18
Schafer ME (1999) Development of ultrasound-based scanning for wetwood and honeycomb detection in
hardwood lumber. In: Szymani R (ed) Scanning technology and process optimization—advances in
wood industry, 1st edn. Miller Freeman Books, San Francisco, pp 160–167
Schafer ME (2000) Ultrasound for defect detection and grading in wood and lumber, ultrasonics
symposium, 2000 IEEE, October 22–25. San Juan, Puerto Rico, pp 771–778
Tiitta M, Tomppo L, Lappalainen R (2010) Combined acoustic and electric method for monitoring wood
drying process: a review. Wood Mater Sci Eng 5:78–83
Tiuri M, Jokela K, Heikkila S (1980) Microwave instrument for accurate moisture and density
measurement of timber. J Microw Power Electromagn Energy 15:251–254
Torgovnikov GI (1993) Dielectric properties of wood and wood-based materials. Springer-Verlag, Berlin
van der Beek J, Tiitta M, Tomppo L, Lappalainen R (2011) Moisture content determination of thermally
modified timber by electrical and ultrasound methods. Int Wood Prod J 2:60–66
Verkasalo E, Ross RJ, TenWolde A, Youngs RL (1993) Properties related to drying defects in red oak
wetwood Res. Pap. FPL-RP-516. Forest products laboratory, Madison
Vun RY, Hoover K, Janowiak J, Bhardwaj M (2008) Calibration of non-contact ultrasound as an online
sensor for wood characterization: effects of temperature, moisture, and scanning direction. Appl
Phys A 90:191–196
238 Wood Sci Technol (2014) 48:227–238
123