Embed Size (px)
Citation preview
Nokia in 2004


Annual Accounts 2004
Key data 2004 4
Review by the Board of Directors 5
Consolidated profit and loss accounts, IFRS 8
Consolidated balance sheets, IFRS 9
Consolidated cash flow statements, IFRS 10
Statements of changes in shareholders’ equity, IFRS 12
Notes to the consolidated financial statements 13
Profit and loss accounts, parent company, FAS 36
Cash flow statements, parent company, FAS 36
Balance sheets, parent company, FAS 37
Notes to the financial statements of the parent company 38
Nokia shares and shareholders 42
Nokia 2000– 2004, IFRS 49
Calculation of key ratios 51
Proposal by the Board of Directors
to the Annual General Meeting 52
Auditors’ report 53
Additional information
U.S. GAAP 56
Critical accounting policies 59
Group Executive Board 62
Board of Directors 64
Risk factors 66
Corporate governance 68
Investor information 77
General contact information 78

4 Nokia in 2004
Based on financial statements
according to International
Financial Reporting Standards,
IFRS
Key data 2004
Main currencies,
rates at year end 2004
1 EUR = USD 1.3345
GBP 0.6885
SEK 8.9768
JPY 139.21
Nokia 2004 2003 Change, %
EURmNet sales 29 267 29 455 –1Operating profit 4 330 5 011 –14Profit before taxes 4 709 5 345 –12Net profit 3 207 3 592 –11Research and development 3 733 3 760 –1
Return on capital employed, % 31.6 34.7Net debt to equity (gearing), % –78 –71
EUREarnings per share, basic 0.70 0.75 –7Dividend per share 0.33 * 0.30 10Average number of shares (1 000 shares) 4 593 196 4 761 121
* Board’s proposal
Business Groups 2004 2003 Change, %
EURmMobile Phones
Net sales 18 507 20 951 –12Operating profit 3 768 5 927 –36
MultimediaNet sales 3 659 2 504 46Operating profit/loss 179 –186
Enterprise SolutionsNet sales 830 529 57Operating loss –199 –141
NetworksNet sales 6 367 5 620 13Operating profit/loss 878 –219
Personnel, Dec. 31Mobile Phones 2 558 2 764 –7Multimedia 2 738 2 777 –1Enterprise Solutions 2 234 1 986 12Networks 16 595 15 301 8Common Group Functions 31 380 28 531 10
Nokia Group 55 505 51 359 8
10 major markets 2004 2003
Net sales, EURmUSA 3 416 4 475China 2 660 2 013UK 2 261 2 693Germany 1 730 2 297India 1 364 1 062Brazil 1 091 805Russia 938 570United Arab Emirates 909 1 886Italy 884 1 003Spain 768 748
10 major countries 2004 2003
Personnel, Dec. 31Finland 23 069 22 274United States 6 706 6 636China 4 788 4 595Hungary 3 778 2 571Germany 3 522 3 486Brazil 2 640 1 497UK 1 903 1 947Denmark 1 296 1 270Mexico 1 160 1 290Singapore 713 717

Nokia in 2004 5
Nokia’s net sales decreased by 1% to EUR 29 267 million (EUR 29 455 mil-
lion). Sales of Mobile Phones decreased by 12% to EUR 18 507 million (EUR
20 951 million). Sales of Multimedia increased by 46% to EUR 3 659 million
(EUR 2 504 million). Sales of Enterprise Solutions increased by 57% and to-
taled EUR 830 million (EUR 529 million). Sales of Networks increased by 13%
to EUR 6 367 million (EUR 5 620 million).
Operating profit decreased by 14% to EUR 4 330 million (EUR 5 011 mil-
lion), representing an operating margin of 14.8% (17.0%). Operating profit
in Mobile Phones decreased by 36% to EUR 3 768 million (EUR 5 927 mil-
lion), representing an operating margin of 20.4% (28.3%). Operating profit
in Multimedia was EUR 179 million (operating loss EUR 186 million), repre-
senting an operating margin of 4.9% (–7.4%). Enterprise Solutions reported
an operating loss of EUR 199 million (operating loss of EUR 141 million).
Operating profit in Networks increased to EUR 878 million including a neg-
ative impact from research and development impairments totaling EUR
115 million; representing an operating margin of 13.8% (–3.9%). In 2003,
operating profit included a positive adjustment of EUR 226 million related
to customer financing impairment charges (MobilCom) and charges of EUR
550 million related to restructuring costs and impairments and write-offs
of capitalized R&D expenses, as well as a goodwill impairment of EUR 151
million, with a total net impact of EUR 475 million.
Common Group expenses totaled EUR 296 million (EUR 370 million, in-
cluding the gain of EUR 56 million on the sale of the remaining shares of
Nokian Tyres Ltd) and included a one-time positive item of EUR 160 million
representing the premium return under our multi-line, multi-year insur-
ance program, which expired during 2004. The return was due to our low
claims experience during the policy period. It also included a EUR 12 mil-
lion negative impact from the divestiture of Nextrom.
In January – December, net financial income was EUR 405 million (EUR
352 million), including a one-time positive item of EUR 106 million. During
the year, Nokia sold approximately 69% of its original holdings in the
subordinated convertible perpetual bonds issued by France Telecom. As a
result, the company booked a total net gain of EUR 106 million. The bonds
had been classified as available-for-sale investments and fair valued through
shareholders’ equity.
Profit before tax and minority interests was EUR 4 709 million (EUR
5 345 million). Net profit totaled EUR 3 207 million (EUR 3 592 million). Earnings
per share decreased to EUR 0.70 (basic) and EUR 0.70 (diluted), compared
with EUR 0.75 (basic) and EUR 0.75 (diluted) in 2003.
At December 31, 2004, net debt-to-equity ratio (gearing) was –78% (–71%
at December 31, 2003). During the January – December 2004, capital expend-
iture amounted to EUR 548 million (EUR 432 million).
Global reachIn 2004, Europe/Middle East/Africa accounted for 55% of Nokia’s net sales
(56% in 2003), North America 12% (16%), Latin America 8% (6%), China 10%
(8%), and Asia-Pacific 15% (14%). The 10 largest markets were the US, China,
UK, Germany, India, Brazil, Russia, United Arab Emirates, Italy and Spain,
together representing 54% of total sales.
Research and developmentAs of December 31, 2004, we employed 20 722 people in research and devel-
opment in 12 countries, representing approximately 37% of Nokia’s total
workforce. R&D expenses totaled EUR 3 733 million in 2004, a decrease of
1% from 2003 (EUR 3 760 million). R&D expenses represented 12.8% of Nokia
net sales in 2004, compared with 12.8% of net sales in 2003.
If R&D impairments, write-offs and personnel-related restructuring
costs in Networks were excluded from both the 2004 (impairments of EUR
115 million) and 2003 (personnel-related restructuring costs, impairments
and write-offs totaling EUR 470 million) R&D expenses, the increase in R&D
expenses would have been 10%, and would have represented 12.4% of
Nokia net sales in 2004, compared with 11.2% of net sales in 2003.
Technology developmentsDuring the year, Nokia continued to make advances in new technologies
for mobile devices, software platforms and developer operations. Nokia
added compelling features to its mobile devices with technologies such as
Push to Talk over Cellular, megapixel cameras and multiradio capability,
including wireless LAN and near field communications.
Nokia entered several technology development agreements with oper-
ators to jointly bring innovations to market. These included agreements
with France Telecom for rich media solutions and with T-Mobile for the de-
velopment of Series 60 Platform applications. A mobile service architec-
ture initiative led by Nokia and Vodafone was launched to simplify mobile
Java standards. Nokia also continued its work with in numerous industry
associations and initiatives to support interoperable, high-quality prod-
ucts and solutions.
Nokia strengthened its commitment to Symbian’s long-term success in
the mobile operating system market by increasing its shareholding in
Symbian from 32.2% to 47.9%. Nokia also extended its Symbian OS application
technology development abilities through an agreement with Metrowerks.
In June, Nokia introduced the Series 60 2nd Edition with support for
scalable user interfaces, high-resolution displays and multi-radio. The exter-
nal licensee base of Series 60 continued to grow during the year. Nokia
outlined plans to expand the Series 60 Platform for smartphones to a variety
of segments, such as enterprise, multimedia and consumer.
In 2004, to support advanced mobile software developers, Nokia opened
Forum Nokia PRO, a developer community, and launched the Preminet service.
PeopleThe average number of personnel for 2004 was 53 511 (51 605 for 2003). At
the end of 2004, Nokia employed 55 505 people worldwide (51 359 at year-
end 2003). In 2004, Nokia’s personnel increased by a total of 4 146 employees
(decrease of 389 in 2003).
Corporate reorganizationOn January 1, 2004, Nokia reorganized to further align the company’s over-
all structure with its strategy, to better position each business group to
meet the specific needs of diverse market segments, and to increase Nokia’s
operational efficiency and maintain the economies of scale. The structure
includes four business groups: Mobile Phones, Multimedia, Enterprise Solu-
tions and Networks. In addition, there are two horizontal groups that sup-
port the mobile device business groups: Customer and Market Operations
and Technology Platforms.
Review by the Board of Directors 2004

6 Nokia in 2004
R e v i e w b y t h e B o a rd of D i re c to rs
Net sales by business group
2004 % 2003 % ChangeJan. 1 – Dec. 31 EURm EURm %
Mobile Phones 18 507 63 20 951 71 –12
Multimedia 3 659 12 2 504 8 46
Enterprise Solutions 830 3 529 2 57
Networks 6 367 22 5 620 19 13
Inter-business
group eliminations –96 – –149 – –
Nokia Group 29 267 100 29 455 100 –1
Operating profit by business group, IFRS
2004 % of 2003 % ofJan. 1 – Dec. 31 EURm net sales EURm net sales
Mobile Phones 3 768 20.4 5 927 28.3
Multimedia 179 4.9 –186 –7.4
Enterprise Solutions –199 –24.0 –141 –26.7
Networks 878 13.8 –219 –3.9
Common Group Functions –296 – –370 –
Nokia Group 4 330 14.8 5 011 17.0
Nokia in mobile devices in 2004In 2004, the total mobile device sales volume achieved by our Mobile Phones,
Multimedia and Enterprise Solutions business groups reached a record of
207.7 million units, representing growth of 16% compared with 2003. Accord-
ing to Nokia’s preliminary estimates, the overall market for mobile devices
grew by 31% to reach 643 million units.
Of the 36 devices we announced in 2004, the majority had cameras and
nearly all had color screens. We also introduced additional designs with
ten new clamshell models, in addition to flip-open messenger devices and
the Nokia 9300 smartphone for enterprises.
We also expanded our 3G offering with shipments of two mobile devices,
the Nokia 7600 and Nokia 6630. In the smartphone segment, where we are
a clear market leader, Nokia delivered approximately 12 million Symbian
operating system-based mobile devices during 2004.
Mobile Phones in 2004During 2004, the Mobile Phones business group continued to support the
company’s long-term strategy of expanding mobile voice in growth mar-
kets as well as identifying further opportunities in the more developed
markets. In line with this, we announced a range of competitive voice-op-
timized phones and camera phones as well as a number of new mobile
entry models.
Highlights for 2004 in Mobile Phones’ portfolio included the Nokia 6230,
a business camera phone, with a balanced feature set that sold well
throughout the year. In the fourth quarter it became the top-selling phone
in Western Europe – a first for a camera phone. Sales of the Nokia 6230 camera
phone were followed closely by the Nokia 6610i. The Nokia 3230 camera phone,
targeting younger audiences, was also strategically important.
During the year, we announced more than 10 new CDMA products. Of
these, the Nokia 6255, a high-end CDMA camera phone for business users,
began shipping in December, and strengthened our overall CDMA offering.
In design, the company announced an art-deco inspired Fashion Collec-
tion, presenting three distinct form factors and a sample of bold new fea-
tures: the Nokia 7260, a monoblock design; the Nokia 7270, a clamshell;
and the Nokia 7280, a slide phone with no keypad.
In our entry-level offering, initial shipments of the Nokia 2600, a color-
screen monoblock phone and the Nokia 2650, a color-screen clamshell
model, both met with a positive response from consumers.
Multimedia in 2004Nokia continued to take advantage of digital convergence by announcing
six new smartphones and numerous products in the areas of imaging,
games and new enhancement products.
The Nokia 7610 imaging smartphone, Nokia’s first megapixel imaging
device, started sales in May and quickly became the best selling megapixel
GSM imaging smartphone globally. By the end of 2004, Nokia had four differ-
ent megapixel models in the market, making Nokia the market leader in
megapixel mobile imaging in GSM. Nokia continued to collaborate with
operators, retailers and printing partners to enable ease-of-use when
sharing, printing or storing images.
The Nokia 6630, our latest 3G WCDMA smartphone, was offered by more
than 30 operators worldwide, including in Japan, and initial market feed-
back has been very positive. Sales of Nokia’s first EDGE-enabled Series 60
smartphone, the Nokia 6620, started in the Americas in July.
Sales of the imaging devices unit were robust, while the games busi-
ness in 2004 was a disappointment.
Enterprise Solutions in 2004Nokia began shipments of the Nokia 6820 and Nokia 6810 messaging devices
and the Nokia 9500 Communicator in 2004. These business-optimized devices
drove Enterprise Solutions’ 2004 full-year sales. During the third quarter
2004, Nokia launched the Nokia 9300 high-end, enterprise smartphone,
which is expected to ship during the first quarter 2005.
Nokia announced or reaffirmed alliances with leading IT companies that
support our new Communicator family for enterprises. The most signifi-
cant alliances were with those supporting our mobile e-mail efforts, in-
cluding Good Technology, Smartner and Visto. These provide a broad
range of e-mail options for Nokia business-optimized devices such as, the
Nokia 9500 and Nokia 9300.
Two new network security gateways, the Nokia IP2250 and Nokia
IP1220, were announced during 2004. Designed for medium-to-large enter-
prises, service providers and data sites, Nokia’s network security gateways
are designed to bring improved total cost of ownership and higher return
on investment. These new products place Nokia at the top end of perform-
ance in the firewall marketplace. The new Nokia IPSO Operating System
was also announced and is intended to lengthen the life of Nokia custom-
ers’ firewall and VPN investments.
The Nokia Secure Access System, an SSL-based remote access solution
with clientless virtual private network functionality, also had good success
in the market during 2004.

Nokia in 2004 7
R e v i e w b y t h e B o a rd o f D i re c to r s
Networks in 2004During 2004, Nokia announced 13 WCDMA 3G contracts, seven of which
were with new 3G customers underscoring Nokia’s strong ability to win
new business in this technology as the industry moves towards full com-
mercialization of WCDMA. By end of the year, 63 operators had launched
commercial WCDMA 3G networks, and Nokia was supplier to 28 of these.
Nokia also signed over 30 GSM, EDGE or GPRS contracts covering all mar-
kets, including contracts with 10 new GSM customers. Nokia made impor-
tant new market entries to several emerging growth markets.
Operators increasing focus on operating expenses, combined with the
increasing complexity of mobile networks, further opened the market for
services. Nokia rapidly built its position in the managed services market
and signed seven significant contracts. The multi-vendor, multi-technology
Nokia NetAct(tm) service and network management system was included
in most of the infrastructure deals during the year. Systems integration
and efficiently run deployments played a key role in the rollout of new
technology, and the year saw a rising trend in the volume of consultative
service sales to operators. Nokia strengthened its strategic focus on the
services business by creating a dedicated Services Business Unit.
Significant progress was also made in the new core networks business.
Nokia won its first commercial contracts for the IP Multimedia Subsystem
(IMS) for richer multimedia communications. Nokia also started a service
trial with Telecom Italia to explore the opportunities this offers for opera-
tors. Nokia is the number one in the market for push to talk, winning 26
commercial Push to talk over Cellular contracts with operators during
2004. Nokia was the first vendor to start delivering 3GPP Release 4 archi-
tecture to operators, winning 25 deals for the Nokia MSC Server System,
which enables significant cost savings in the delivery of voice minutes.
Shares and share capitalIn 2004, Nokia’s share capital increased by EUR 302.40 as a result of the issue
of 5 040 new shares upon exercise of stock options issued to key personnel
in 1999. Effective April 14, 2004, a total of 132 536 200 shares held by the
company were cancelled pursuant to the shareholders’ resolution taken at
the Annual General Meeting on March 25, 2004. As a result of the cancella-
tion, the share capital was reduced by the aggregate par value of the
shares cancelled, EUR 7 952 172, corresponding to less than 2.8% of the
share capital of the company and the total voting rights. The cancellation
did not reduce the shareholders’ equity. Neither the aforementioned issu-
ances nor the cancellation of shares had any significant effect on the rela-
tive holdings of the other shareholders of the company nor on their voting
power.
Nokia repurchased through its share repurchase plans a total of
214 057 700 shares on the Helsinki Exchanges at an aggregate price of ap-
proximately EUR 2.659 billion during the period from January 23, 2004 to
November 26, 2004. The price paid was based on the market price at the
time of repurchase. The shares were repurchased to be used for the purposes
specified in the authorizations given by the Annual General Meetings of
2003 and 2004 to the Board. The aggregate par value of the shares pur-
chased was EUR 12 843 462, representing approximately 4.59% of the share
capital of the company and the total voting rights. These new holdings did
not have any significant effect on the relative holdings of the other share-
holders of the company nor on their voting power.
On December 31, 2004, Nokia and its subsidiary companies owned
176 819 877 Nokia shares. The shares had an aggregate par value of EUR
10 609 192.62, representing approximately 3.79% of the share capital of
the company and the total voting rights.
The total number of shares at December 31, 2004 was 4 663 761 300. As
a result of the new share issues, Nokia received a total of EUR 84 810.60 in
additional shareholders’ equity in 2004. On December 31, 2004, Nokia’s
share capital was EUR 279 825 678.
Corporate responsibilityAs market leader and a leading global brand, our impact on society comes
with responsibilities that go beyond providing products. Listening to
stakeholders is one key element in developing corporate responsibility
programs. Following are some developments made in this area during 2004.
The European Community invited Nokia, as one of two companies, to
participate in a multi-stakeholder consultation pilot, called the Integrated
Product Policy, that examines how environmental awareness works in
practice and aims to improve knowledge of the environmental perform-
ance and the sustainable use of products throughout their life-cycle.
We gained positive results from our Philippines pilot of Bridgeit, a pro-
gram using mobile technology to bring interactive, multimedia learning
materials to teachers and students who would otherwise have no access
to them. Launched by Nokia, the International Youth Foundation (IYF), the
United Nations Development Programme (UNDP) and Pearson, Bridgeit isnow being expanded to double the number of schools and will be repli-
cated in other countries.
In recognition of this work, we gained first place for the second year
running in the Dow Jones Sustainability Index European Technology and
Global Communications Technology categories.
OutlookThe year 2004 was demanding for Nokia. In response, the company set five
top priorities in the areas of customer relations, product offering, R&D ef-
ficiency, demand-supply management and the company’s ability to offer
end-to-end solutions. Nokia is making good progress in these areas, and is
now better positioned to meet future challenges.
Nokia continues to expect the overall mobile device market in 2005 to
grow by approximately 10% in volume and to a lesser extent in value.
Growth is expected to continue to be driven by replacement and upgrade
sales in more developed markets and by new subscriber growth in devel-
oping mobile markets, as well as the wide-spread commercialization of 3G
devices in the second half of 2005.
In infrastructure, Nokia expects the overall market in 2005 to be up
slightly in euro terms as operators continue building coverage and expand-
ing capacity in growth markets, as well as optimizing and expanding existing
2G networks and rolling-out 3G networks in more developed markets.
Competition in both the mobile device and infrastructure markets is
expected to further intensify in 2005 as a result of anticipated slower
growth, compared with 2004. However, by upholding a clear competitive
focus, particularly in the priority areas outlined above, Nokia’s goal is to
further build on its industry-leading position.
DividendNokia’s Board of Directors will propose a dividend of EUR 0.33 per share for
2004.

8 Nokia in 2004
Consolidated profit and loss accounts, IFRS
C o n s o l i d a te d f i n a n c i a l s t a te m e n t s a cco rd i n g to I F R S
2004 2003 2002Financial year ended Dec. 31 Notes EURm EURm EURm
Net sales 29 267 29 455 30 016Cost of sales –18 133 –17 237 –18 278Research and development expenses –3 733 –3 760 –3 052Selling, general and administrative
expenses 7, 8 –2 975 –3 363 –3 239Customer finance impairment charges,
net of reversals 8 – 226 –279Impairment of goodwill 8 – –151 –182Amortization of goodwill 10 –96 –159 –206
Operating profit 3, 4, 5, 6, 7, 8, 10 4 330 5 011 4 780Share of results of associated companies 33 –26 –18 –19Financial income and expenses 11 405 352 156
Profit before tax and minority interests 4 709 5 345 4 917Tax 12 –1 435 –1 699 –1 484
Minority interests –67 –54 –52
Net profit 3 207 3 592 3 381
2004 2003 2002
Earnings per share 29 EUR EUR EUR
Basic 0.70 0.75 0.71Diluted 0.70 0.75 0.71
Average number of shares(1 000 shares) 29 2004 2003 2002
Basic 4 593 196 4 761 121 4 751 110Diluted 4 600 337 4 761 160 4 788 042
See Notes to Consolidated Financial Statements.

Nokia in 2004 9
Consolidated balance sheets, IFRS
C o n s o l i d a te d f i n a n c i a l s t a te m e n t s a cco rd i n g to I F R S
2004 2003Dec. 31 Notes EURm EURm
ASSETSFixed assets and other non-current assetsCapitalized development costs 13 278 537Goodwill 13 90 186Other intangible assets 13 209 185Property, plant and equipment 14 1 534 1 566Investments in associated companies 15 200 76Available-for-sale investments 16 169 121Deferred tax assets 25 623 743Long-term loans receivable 17 – 354Other non-current assets 58 69
3 161 3 837
Current assetsInventories 18, 20 1 305 1 169Accounts receivable, net of allowances for doubtful
accounts (2004: EUR 361 million, 2003: EUR 367 million) 19, 20 4 382 5 231Prepaid expenses and accrued income 19 1 429 1 106Other financial assets 595 465Available-for-sale investments 16 255 816Available-for-sale investments, liquid assets 16 9 085 8 512Available-for-sale investments, cash equivalents 16, 35 1 367 1 639Bank and cash 35 1 090 1 145
19 508 20 083Total assets 22 669 23 920
2004 2003Dec. 31 Notes EURm EURm
SHAREHOLDERS’ EQUITY AND LIABILITIESShareholders’ equityShare capital 22 280 288Share issue premium 2 272 2 272Treasury shares, at cost –2 022 –1 373Translation differences –126 -85Fair value and other reserves 21 69 93Retained earnings 23 13 765 13 953
14 238 15 148
Minority interests 168 164
Long-term liabilities 24Long-term interest-bearing liabilities 19 20Deferred tax liabilities 25 179 241Other long-term liabilities 96 67
294 328Current liabilitiesShort-term borrowings 26 215 387Current portion of long-term debt – 84Accounts payable 2 669 2 919Accrued expenses 27 2 606 2 468Provisions 28 2 479 2 422
7 969 8 280Total shareholders’ equity and liabilities 22 669 23 920
See Notes to Consolidated Financial Statements.

10 Nokia in 2004
C o n s o l i d a te d f i n a n c i a l s t a te m e n t s a cco rd i n g to I F R S
Consolidated cash flow statements, IFRS
2004 2003 2002Financial year ended Dec. 31 Notes EURm EURm EURm
Cash flow from operating activitiesNet profit 3 207 3 592 3 381
Adjustments, total 34 1 986 2 953 3 151
Net profit before change in net working capital 5 193 6 545 6 532Change in net working capital 34 299 –194 914
Cash generated from operations 5 492 6 351 7 446Interest received 204 256 229Interest paid –26 –33 –94Other financial income and expenses, net received 41 118 67Income taxes paid –1 368 –1 440 –1 947
Net cash from operating activities 4 343 5 252 5 701
Cash flow from investing activitiesAcquisition of Group companies, net of acquired cash(2004: EUR 0 million, 2003: EUR 0 million, 2002: EUR 6 million) – –7 –10Purchase of current available-for-sale investments,
liquid assets –10 318 –11 695 –7 392Purchase of non-current available-for-sale investments –388 –282 –99Purchase of shares in associated companies –109 –61 –Additions to capitalized development costs –101 –218 –418Long-term loans made to customers – –97 –563Proceeds from repayment and sale of long-term
loans receivable 368 315 314Proceeds from (+) / payment of (–)
other long-term receivables 2 –18 –32Proceeds from (+) / payment of (–)
short-term loans receivable 66 63 –85Capital expenditures –548 –432 –432Proceeds from disposal of shares in Group companies,
net of disposed cash 1 – 93Proceeds from maturities and sale of current
available-for-sale investments, liquid assets 9 737 8 793 4 390Proceeds from sale of current available-for-sale
investments 587 – –Proceeds from sale of non-current available-for-sale
investments 346 381 162Proceeds from sale of fixed assets 6 19 177Dividends received 22 24 25
Net cash used in investing activities –329 –3 215 –3 870
Cash flow from financing activitiesProceeds from stock option exercises – 23 163Purchase of treasury shares –2 648 –1 355 –17Capital investment by minority shareholders – – 26Proceeds from long-term borrowings 1 8 100Repayment of long-term borrowings –3 –56 –98Repayment of short-term borrowings –255 –22 –406Dividends paid –1 413 –1 378 –1 348
Net cash used in financing activities –4 318 –2 780 –1 580
Foreign exchange adjustment –23 –146 –135

Nokia in 2004 11
C o n s o li d a te d f i n a n c i a l st a te m e n t s a cco rd i n g to I F R S ( co n t i n u e d )
2004 2003 2002Financial year ended Dec. 31 Notes EURm EURm EURm
Net increase (+) / decrease (–)in cash and cash equivalents –327 –889 116
Cash and cash equivalents at beginning of period 2 784 3 673 3 557
Cash and cash equivalents at end of period 2 457 2 784 3 673
Cash and cash equivalents comprise of:Bank and cash 1 090 1 145 1 496Current available-for-sale investments,
cash equivalents 16, 35 1 367 1 639 2 177
2 457 2 784 3 673
See Notes to Consolidated Financial Statements.
The figures in the consolidated cash flow statement cannot be directly traced from thebalance sheet without additional information as a result of acquisitions and disposalsof subsidiaries and net foreign exchange differences arising on consolidation.

12 Nokia in 2004
C o n s o l i d a te d f i n a n c i a l st a te m e n t s a cco rd i n g to I F R S
Consolidated statements of changes in shareholders’ equity, IFRS
Fair valueNumber of Share Share issue Treasury Translation and other Retained
Group, EURm shares (1 000) capital premium shares differences 1 reserves 1 earnings Total
Balance at December 31, 2001 4 736 302 284 2 060 –21 326 20 9 536 12 205
Stock options exercised 50 377 3 160 163Stock options exercised related to
acquisitions –17 –17Tax benefit on stock options exercised 22 22Acquisition of treasury shares –900 –17 –17Reissuance of treasury shares 983 18 18Dividend –1 279 –1 279Translation differences –285 –285Net investment hedge gains 94 94Cash flow hedges, net of tax 60 60Available-for-sale investments, net of tax –87 –87Other increase, net 23 23Net profit 3 381 3 381
Balance at December 31, 2002 4 786 762 287 2 225 –20 135 –7 11 661 14 281
Share issue related to acquisitions 1 225 18 18Stock options exercised 7 160 1 22 23Stock options exercised related to
acquisitions –6 –6Tax benefit on stock options exercised 13 13Acquisition of treasury shares –95 339 –1 363 –1 363Reissuance of treasury shares 460 10 10Dividend –1 340 –1 340Translation differences –375 –375Net investment hedge gains 155 155Cash flow hedges, net of tax 2 2Available-for-sale investments, net of tax 98 98Other increase, net 40 40Net profit 3 592 3 592
Balance at December 31, 2003 4 700 268 288 2 272 –1 373 –85 93 13 953 15 148
Stock options exercised 5 0 0 0Stock options exercised related to
acquisitions –8 –8Acquisition of treasury shares –214 120 –2 661 –2 661Reissuance of treasury shares 788 14 14Cancellation of treasury shares –8 8 1 998 –1 998 –Dividend –1 398 –1 398Translation differences –119 –119Net investment hedge gains 78 78Cash flow hedges, net of tax 42 42Available-for-sale investments, net of tax –66 –66Other increase, net 1 1Net profit 3 207 3 207
Balance at December 31, 2004 4 486 941 280 2 272 –2 022 –126 69 13 765 14 238
1 Accumulated other comprehensive income comprises translation differences and fair value and other reserves.
Dividends declared per share were EUR 0.33 for 2004 (EUR 0.30 for 2003 and EUR 0.28 for 2002), subject to shareholders’ approval.
See Notes to Consolidated Financial Statements.

Nokia in 2004 13
N ote s to t h e co n s o l i d a te d f i n a n c i a l st a te m e n t s
1. Accounting principles
Basis of presentationThe consolidated financial statements of Nokia Corporation (“Nokia” or
“the Group”), a Finnish limited liability company with domicile in Helsinki,
are prepared in accordance with International Financial Reporting Stand-
ards (IFRS). The consolidated financial statements are presented in mil-
lions of euros (EURm), except as noted, and are prepared under the histor-
ical cost convention except as disclosed in the accounting policies below.
The notes to the consolidated financial statements also conform with
Finnish Accounting legislation.
Use of estimatesThe preparation of financial statements in conformity with IFRS requires
management to make estimates and assumptions that affect the reported
amounts of assets and liabilities and disclosure of contingent assets and
liabilities at the date of the financial statements and the reported
amounts of revenues and expenses during the reporting period. Actual re-
sults could differ from those estimates.
Principles of consolidationThe consolidated financial statements include the accounts of Nokia’s par-
ent company (“Parent Company”), and each of those companies in which it
either owns, directly or indirectly through subsidiaries, over 50% of the
voting rights, or over which it has control of their operating and financial
policies. The Group’s share of profits and losses of associated companies
(generally 20% to 50% voting rights or over which the Group has signifi-
cant influence) is included in the consolidated profit and loss account in
accordance with the equity method of accounting.
All inter-company transactions are eliminated as part of the consolida-
tion process. Minority interests are presented separately in arriving at the
net profit. They are also shown separately from shareholders’ equity and
liabilities in the consolidated balance sheet.
Profits realized in connection with the sale of fixed assets between the
Group and associated companies are eliminated in proportion to share
ownership. Such profits are deducted from the Group’s equity and fixed
assets and released in the Group accounts over the same period as depre-
ciation is charged.
The companies acquired during the financial periods presented have
been consolidated from the date on which control of the net assets and
operations was transferred to the Group. Similarly the result of a Group
company divested during an accounting period is included in the Group
accounts only to the date of disposal.
GoodwillAcquisitions of companies are accounted for using the purchase method of
accounting. Goodwill represents the excess of the purchase cost over the
fair value of assets less liabilities of acquired companies. Goodwill is amor-
tized on a straight-line basis over its expected useful life. Useful lives vary
between two and five years depending upon the nature of the acquisition.
Expected useful lives are reviewed at each balance sheet date and, where
these differ significantly from previous estimates, amortization periods
are changed accordingly.
The Group adopted the transition provisions of IFRS 3, Business Combi-
nations, with effect from April 1, 2004. As a result, goodwill relating to pur-
chase acquisitions and acquisitions of associated companies for which the
agreement date was on or after March 31, 2004, is no longer subject to
amortization. Goodwill arising in business combinations completed be-
fore March 31, 2004 will continue to be amortized until the standard is fully
adopted as of January 1, 2005.
The Group assesses the carrying value of goodwill annually or, more
frequently, if events or changes in circumstances indicate that such carry-
ing value may not be recoverable. If such indication exists the recoverable
amount is determined for the cash-generating unit, to which goodwill be-
longs. This amount is then compared to the carrying amount of the cash-
generating unit and an impairment loss is recognized if the recoverable
amount is less than the carrying amount. Impairment losses are recog-
nized immediately in the profit and loss account.
Transactions in foreign currenciesTransactions in foreign currencies are recorded at the rates of exchange
prevailing at the dates of the individual transactions. For practical reasons,
a rate that approximates the actual rate at the date of the transaction is
often used. At the end of the accounting period, the unsettled balances on
foreign currency receivables and liabilities are valued at the rates of ex-
change prevailing at the year-end. Foreign exchange gains and losses relat-
ed to normal business operations are treated as adjustments to sales or to
cost of sales. Foreign exchange gains and losses associated with financing
are included as a net amount under financial income and expenses.
Foreign Group companiesIn the consolidated accounts all items in the profit and loss accounts of for-
eign subsidiaries are translated into euro at the average foreign exchange
rates for the accounting period. The balance sheets of foreign Group compa-
nies are translated into euro at the year-end foreign exchange rates with
the exception of goodwill arising on the acquisition of a foreign company,
which is translated to euro at historical rates. Differences resulting from the
translation of profit and loss account items at the average rate and the bal-
ance sheet items at the closing rate are also treated as an adjustment affect-
ing consolidated shareholders’ equity. On the disposal of all or part of a for-
eign Group company by sale, liquidation, repayment of share capital or
abandonment, the cumulative amount or proportionate share of the trans-
lation difference is recognized as income or as expense in the same period
in which the gain or loss on disposal is recognized.
Fair valuing principlesFinancial assets and liabilities
Under IAS 39, the Group classifies its investments in marketable debt and
equity securities and investments in unlisted equity securities into the fol-
lowing categories: held-to-maturity, trading, or available-for-sale depend-
ing on the purpose for acquiring the investments. All investments of the
Group are currently classified as available-for-sale. Available-for-sale in-
vestments are fair valued by using quoted market rates, discounted cash
flow analyses and other appropriate valuation models at the balance
sheet date. Certain unlisted equities for which fair values cannot be meas-
ured reliably are reported at cost less impairment. All purchases and sales
of investments are recorded on the trade date, which is the date that the
Group commits to purchase or sell the asset.
The fair value changes of available-for-sale investments are recognized
in shareholders’ equity. When the investment is disposed of, the related
accumulated fair value changes are released from shareholders’ equity
and recognized in the profit and loss account. The accumulated fair value

14 Nokia in 2004
N o te s to t h e co n s o l i d ate d f i n a n c i a l st a te m e n t s
changes are calculated using a weighted average purchase price method.
An impairment is recorded when the carrying amount of an available-for-
sale investment is greater than the estimated fair value and there is objec-
tive evidence that the asset is impaired. The cumulative net loss relating
to that investment is removed from equity and recognized in the profit
and loss account for the period. If, in a subsequent period, the fair value of
the investment increases and the increase can be objectively related to an
event occurring after the loss was recognized, the loss is reversed, with
the amount of the reversal included in the profit and loss account.
The fair values of other financial assets and financial liabilities are as-
sumed to approximate their carrying values, either because of their short
maturities, or where their fair values cannot be measured reliably.
Derivatives
Fair values of forward rate agreements, interest rate options and futures
contracts are calculated based on quoted market rates at the balance
sheet date. Interest rate and currency swaps are valued by using discounted
cash flow analyses. The changes in the fair values of these contracts are
reported in the profit and loss account.
Fair values of cash settled equity derivatives are calculated by revalu-
ing the contract at year-end quoted market rates. Changes in the fair value
are reported in the profit and loss account.
Forward foreign exchange contracts are valued with the forward ex-
change rate. Changes in fair value are calculated by comparing this with the
original amount calculated by using the contract forward rate prevailing at
the beginning of the contract. Currency options are valued at the balance
sheet date by using the Garman & Kohlhagen option valuation model.
Changes in the fair value on these instruments are reported in the profit and
loss account except to the extent they qualify for hedge accounting.
Embedded derivatives are identified and monitored in the Group and
fair valued at the balance sheet date. In assessing the fair value of embed-
ded derivatives the Group uses a variety of methods, such as option pric-
ing models and discounted cash flow analysis, and makes assumptions
that are based on market conditions existing at each balance sheet date.
The fair value changes are reported in the profit and loss account.
Hedge accountingHedging of anticipated foreign currency
denominated sales and purchases
The Group applies hedge accounting for ‘Qualifying hedges’. Qualifying
hedges are those properly documented cash flow hedges of the foreign
exchange rate risk of future anticipated foreign currency denominated
sales and purchases that meet the requirements set out in IAS 39. The cash
flow being hedged must be ‘highly probable’ and must ultimately impact
the profit and loss account. The hedge must be highly effective both pro-
spectively and retrospectively.
The Group claims hedge accounting in respect of certain forward for-
eign exchange contracts and options, or option strategies, which have
zero net premium or a net premium paid, and where the critical terms of
the bought and sold options within a collar or zero premium structure are
the same and where the nominal amount of the sold option component is
no greater than that of the bought option.
For qualifying foreign exchange forwards the change in fair value is
deferred in shareholders’ equity to the extent that the hedge is effective.
For qualifying foreign exchange options the change in intrinsic value is
deferred in shareholders’ equity to the extent that the hedge is effective.
Changes in the time value are at all times taken directly as adjustments to
sales or to cost of sales in the profit and loss account.
Accumulated fair value changes from qualifying hedges are released
from shareholders’ equity into the profit and loss account as adjustments
to sales and cost of sales, in the period when the hedged cash flow affects
the profit and loss account. If the hedged cash flow is no longer expected
to take place, all deferred gains or losses are released into the profit and
loss account as adjustments to sales and cost of sales, immediately. If the
hedged cash flow ceases to be highly probable, but is still expected to take
place, accumulated gains and losses remain in equity until the hedged
cash flow affects the profit and loss account.
Changes in the fair value of any derivative instruments that do not qual-
ify for hedge accounting under IAS 39 are recognized immediately in the
profit and loss account. The fair value changes of derivative instruments
that directly relate to normal business operations are recognized as adjust-
ments to sales or cost of sales or treated as other operating income and
expense. The fair value changes from all other derivative instruments are
recognized in financial income and expenses.
Foreign currency hedging of net investments
The Group also applies hedge accounting for its foreign currency hedging
on net investments. Qualifying hedges are those properly documented
hedges of the foreign exchange rate risk of foreign currency-denominated
net investments that meet the requirements set out in IAS 39. The hedge
must be effective both prospectively and retrospectively.
The Group claims hedge accounting in respect of forward foreign ex-
change contracts, foreign currency-denominated loans, and options, or
option strategies, which have zero net premium or a net premium paid,
and where the terms of the bought and sold options within a collar or zero
premium structure are the same.
For qualifying foreign exchange forwards the change in fair value that
reflects the change in spot exchange rates is deferred in shareholders’ eq-
uity. The change in fair value that reflects the change in forward exchange
rates less the change in spot exchange rates is recognized in the profit and
loss account. For qualifying foreign exchange options the change in intrin-
sic value is deferred in shareholders’ equity. Changes in the time value are
at all times taken directly to the profit and loss account. If a foreign curren-
cy-denominated loan is used as a hedge, all foreign exchange gains and
losses arising from the transaction are recognized in shareholders’ equity.
Accumulated fair value changes from qualifying hedges are released
from shareholders’ equity into the profit and loss account only if the legal
entity in the given country is sold or liquidated.
Revenue recognitionSales from the majority of the Group are recognized when persuasive evi-
dence of an arrangement exists, delivery has occurred, the fee is fixed and
determinable and collectibility is probable. An immaterial part of the revenue
from products sold through distribution channels is recognized when the
reseller or distributor sells the products to the end users.
In addition, sales and cost of sales from contracts involving solutions
achieved through modification of complex telecommunications equipment
are recognized on the percentage of completion method when the outcome
of the contract can be estimated reliably. A contract’s outcome can be esti-
mated reliably when total contract revenue and the costs to complete the

Nokia in 2004 15
N ote s to t h e co n s o l i d ate d f i n a n c i a l st a te m e n t s
contract can be estimated reliably, it is probable that the economic bene-
fits associated with the contract will flow to the Group and the stage of
contract completion can be measured reliably. When the Group is not able
to meet those conditions, the policy is to recognize revenues only equal to
costs incurred to date, to the extent that such costs are expected to be re-
covered.
Completion is measured by reference to cost incurred to date as a per-
centage of estimated total project costs, the cost-to-cost method.
The percentage of completion method relies on estimates of total ex-
pected contract revenue and costs, as well as dependable measurement of
the progress made towards completing a particular project. Recognized
revenues and profits are subject to revisions during the project in the
event that the assumptions regarding the overall project outcome are re-
vised. The cumulative impact of a revision in estimates is recorded in the
period such revisions become likely and estimable. Losses on projects in
progress are recognized in the period they become likely and estimable.
All the Group’s material revenue streams are recorded according to the
above policies.
Shipping and handling costsThe costs of shipping and distributing products are included in cost of sales.
Research and developmentResearch and development costs are expensed as they are incurred, except
for certain development costs, which are capitalized when it is probable
that a development project will be a success, and certain criteria, including
commercial and technological feasibility, have been met. Capitalized de-
velopment costs, comprising direct labor and related overhead, are amor-
tized on a systematic basis over their expected useful lives between two
and five years.
Capitalized development costs are subject to regular assessments of
recoverability based on anticipated future revenues, including the impact
of changes in technology. Unamortized capitalized development costs de-
termined to be in excess of their recoverable amounts are expensed imme-
diately.
Other intangible assetsExpenditures on acquired patents, trademarks and licenses are capitalized
and amortized using the straight-line method over their useful lives, but not
exceeding 20 years. Where an indication of impairment exists, the carrying
amount of any intangible asset is assessed and written down to its recover-
able amount. Costs of software licenses associated with internal-use soft-
ware are capitalized. These costs are included within other intangible assets
and are amortized over a period not to exceed three years.
PensionsThe Group companies have various pension schemes in accordance with the lo-
cal conditions and practices in the countries in which they operate. The
schemes are generally funded through payments to insurance companies or to
trustee-administered funds as determined by periodic actuarial calculations.
The Group’s contributions to defined contribution plans and to multi-
employer and insured plans are charged to the profit and loss account in
the period to which the contributions relate.
For defined benefit plans, principally the reserved portion of the Finnish
TEL system, pension costs are assessed using the projected unit credit
method: the cost of providing pensions is charged to the profit and loss
account so as to spread the service cost over the service lives of employ-
ees. The pension obligation is measured as the present value of the esti-
mated future cash outflows using interest rates on government securities
that have terms to maturity approximating the terms of the related liabil-
ities. Actuarial gains and losses outside the corridor are recognized over
the average remaining service lives of employees.
Property, plant and equipmentProperty, plant and equipment are stated at cost less accumulated depre-
ciation. Depreciation is recorded on a straight-line basis over the expected
useful lives of the assets as follows:
Buildings and constructions 20–33 years
Production machinery, measuring and test equipment 3 years
Other machinery and equipment 3–10 years
Land and water areas are not depreciated.
Maintenance, repairs and renewals are generally charged to expense
during the financial period in which they are incurred. However, major
renovations are capitalized and included in the carrying amount of the
asset when it is probable that future economic benefits in excess of the
originally assessed standard of performance of the existing asset will flow
to the Group. Major renovations are depreciated over the remaining useful
life of the related asset.
Gains and losses on the disposal of fixed assets are included in operat-
ing profit/loss.
LeasesThe Group has entered into various operating leases, the payments under
which are treated as rentals and charged to the profit and loss account on
a straight-line basis over the lease terms.
InventoriesInventories are stated at the lower of cost or net realizable value. Cost is
determined using standard cost, which approximates actual cost, on a first
in first out (FIFO) basis. Net realizable value is the amount that can be real-
ized from the sale of the inventory in the normal course of business after
allowing for the costs of realization.
In addition to the cost of materials and direct labor, an appropriate
proportion of production overheads are included in the inventory values.
An allowance is recorded for excess inventory and obsolescence.
Cash and cash equivalentsBank and cash consist of cash at bank and in hand. Cash equivalents con-
sist of highly liquid available-for-sale investments purchased with remain-
ing maturities at the date of acquisition of three months or less.
Short-term investmentsThe Group considers all highly liquid marketable securities purchased with
maturity at acquisition of more than three months as short-term invest-
ments. They are included in current available-for-sale investments, liquid
assets, in the balance sheet.

16 Nokia in 2004
N ote s to t h e co n s o l i d ate d f i n a n c i a l st a te m e n t s
Accounts receivableAccounts receivable are carried at the original invoice amount to customers
less an estimate made for doubtful receivables based on a periodic review
of all outstanding amounts, which includes an analysis of historical bad
debt, customer concentrations, customer creditworthiness, current eco-
nomic trends and changes in our customer payment terms. Bad debts are
written off when identified.
BorrowingsBorrowings are classified as originated loans and are recognized initially
at an amount equal to the proceeds received, net of transaction costs in-
curred. In subsequent periods, they are stated at amortized cost using the
effective yield method; any difference between proceeds (net of transac-
tion costs) and the redemption value is recognized in the profit and loss
account over the period of the borrowings.
Loans to customersLoans to customers are recorded at amortized cost. Loans are subject to
regular and thorough review as to their collectibility and as to available
collateral; in the event that any loan is deemed not fully recoverable, pro-
vision is made to reflect the shortfall between the carrying amount and
the present value of the expected cash flows. Interest income on loans to
customers is accrued monthly on the principal outstanding at the market
rate on the date of financing and is included within other operating in-
come within selling, general and administrative expenses.
Income taxesCurrent taxes are based on the results of the Group companies and are cal-
culated according to local tax rules.
Deferred tax assets and liabilities are determined, using the liability
method, for all temporary differences arising between the tax basis of assets
and liabilities and their carrying values for financial reporting purposes.
Currently enacted tax rates are used in the determination of deferred in-
come tax.
Under this method the Group is required, in relation to an acquisition,
to make provision for deferred taxes on the difference between the fair
values of the net assets acquired and their tax bases.
The principal temporary differences arise from intercompany profit in
inventory, warranty and other provisions, untaxed reserves and tax losses
carried forward. Deferred tax assets relating to the carry forward of un-
used tax losses are recognized to the extent that it is probable that future
taxable profit will be available against which the unused tax losses can be
utilized.
Stock compensationNo compensation cost is recognized in respect of stock options, restricted
shares and performance shares granted to employees. The options are
granted with a fixed exercise price set on a date outlined in the plan. When
the options are exercised, the proceeds received, net of any transaction
costs, are credited to share capital (nominal value) and share premium.
Treasury shares are acquired by the Group to meet its obligations under
employee stock compensation plans in the United States. When treasury
shares are issued on exercise of stock options any gain or loss is recog-
nized in share issue premium. Tax benefits on options exercised in the
United States are credited to share issue premium.
Under the restricted share and performance share programs, Nokia
shares are delivered to employees at a future point in time. Performance
shares vest subject to the Group’s performance reaching the threshold
performance levels measured by pre-defined performance criteria. The
method by which the shares are obtained for delivery, as determined by
the Group, include the use of one or more of the following: treasury
shares, newly issued shares and shares purchased on the open market.
ProvisionsProvisions are recognized when the Group has a present legal or construc-
tive obligation as a result of past events, it is probable that an outflow of
resources will be required to settle the obligation and a reliable estimate
of the amount can be made. Where the Group expects a provision to be
reimbursed, the reimbursement would be recognized as an asset but only
when the reimbursement is virtually certain.
The Group recognizes the estimated liability to repair or replace products
still under warranty at the balance sheet date. The provision is calculated
based on historical experience of the level of repairs and replacements.
The Group recognizes the estimated liability for non-cancellable pur-
chase commitments for inventory in excess of forecasted requirements at
each balance sheet date.
The Group recognizes a provision for the estimated future settlements
related to asserted and unasserted Intellectual Property Rights (IPR) in-
fringements, based on the probable outcome of each case as of each bal-
ance sheet date.
The Group recognizes a provision for social security costs on unexer-
cised stock options granted to employees at the date options are granted.
The provision is measured based on the fair value of the options, and the
amount of the provision is adjusted to reflect the changes in the Nokia
share price.
The Group recognizes a provision for prior year tax contingencies
based upon the estimated future settlement amount at each balance
sheet date.
DividendsDividends proposed by the Board of Directors are not recorded in the fi-
nancial statements until they have been approved by the shareholders at
the Annual General Meeting.
Earnings per shareThe Group calculates both basic and diluted earnings per share in accord-
ance with IAS 33, Earnings per share, (IAS 33). Under IAS 33, basic earnings
per share is computed using the weighted average number of shares out-
standing during the period. Diluted earnings per share is computed using
the weighted average number of shares outstanding during the period
plus the dilutive effect of stock options, restricted shares and performance
shares outstanding during the period.
New IFRS standards and revised IAS standardsIn December 2003, International Accounting Standards (IAS) were amended
as the IASB released revised IAS 32, Financial Instruments: Disclosure and
Presentation and IAS 39, Financial Instruments: Recognition and Measure-
ment. These standards replace IAS 32 (revised 2000), and supersedes IAS 39
(revised 2000), and must be applied for annual periods beginning on or
after January 1, 2005. Under IAS 39 (revised) no cash flow hedge accounting

Nokia in 2004 17
is available on forecast intragroup transactions. Any deferral of hedging
gains or losses that were included in the 2004 and 2003 consolidated finan-
cial statements needs to be reversed. The final form of the standards is still
open and given the uncertainty the Group is currently not able to estimate
the impact of adopting the revised standards on the financial statements.
The revised IAS 21, The Effects of Changes in Foreign Exchange Rates,
issued by the IASB in December 2003, requires the goodwill arising on the
acquisition of a foreign operation to be expressed in the functional currency
of the foreign operation and translated at the closing rate. Currently the
Group records goodwill arising on the acquisition of a foreign entity using
the exchange rate at the date of the transaction. The revised standard is ef-
fective for fiscal years beginning on or after January 1, 2005. The Group does
not expect the adoption of the revised standard will have a material impact
on the Group’s financial position, results of operations or cash flows.
In February 2004, the IASB issued IFRS 2, Share-based Payment. The
standard requires the recognition of share-based payment transactions in
financial statements, including transactions with employees or other par-
ties to be settled in cash, other assets, or equity instruments of the Compa-
ny. Currently the Group has only share-based payment transactions with
employees to be settled in equity instruments of the Company. The servic-
es received, and the corresponding increase in equity, are measured by
reference to the fair value of the equity instruments granted. The com-
pensation is recognized as an expense in the profit and loss account over
the service period. IFRS 2 is effective for fiscal years beginning on or after
January 1, 2005 and applies to grants of shares, share options or other eq-
uity instruments that were granted after November 7, 2002 and had not yet
vested at the effective date of the standard. The Group is currently esti-
mating the impact of adopting IFRS 2 on the financial statements.
In March 2004, the IASB issued IFRS 3, Business Combinations, and the
revised standards IAS 36, Impairment of Assets, and IAS 38, Intangible Assets.
IFRS 3 is required to be applied to all business combinations for which the
agreement date is on or after March 31, 2004. The standard requires that
all business combinations be accounted for by the purchase method, pro-
vides specific criteria for recognizing intangible assets acquired in a busi-
ness combination and also prohibits the amortization of goodwill and in-
stead requires it to be tested for impairment annually, in accordance with
the revised IAS 36. Any excess of acquirer’s interest in the net fair value of
acquiree’s identifiable assets, liabilities and contingent liabilities over
cost is recognized immediately as a gain.
Goodwill related to acquisitions prior to March 31, 2004 continued to be
amortized through December 31, 2004 as required in the transition guid-
ance. Goodwill related to acquisitions subsequent to March 31, 2004 is not
amortized. Intangible assets with definite useful lives will continue to be
amortized over their respective estimated useful lives. Intangible assets
with indefinite useful lives are not amortized. Currently the Group does not
have indefinitely lived intangible assets. The revised standards IAS 36 and
IAS 38 are effective for fiscal years beginning on or after January 1, 2005. The
Group does not expect the adoption of these standards to have a material
impact on the Group’s financial position, results of operations or cash flows.
In March 2004, the IASB issued IFRS 5, Non-current Assets Held for Sale
and Discontinued Operations, which addresses financial accounting and
reporting for the disposal of non-current assets. The standard supersedes
IAS 35, Discontinuing Operations. IFRS 5 introduces the concept of a disposal
group and adopts the classification “held for sale”. IFRS 5 retains the re-
quirement to report separately discontinued operations. An asset classi-
2. Change in comparative figures– cash equivalentsIn 2003 and earlier, the Group maintained its excess cash in a single pool of
highly liquid, low risk instruments with varying maturity dates. These
pooled instruments were originally presented as cash equivalents irre-
spective of the instruments’ maturities. During 2004, cash management
practices were revised, such that this single pool was divided into two –
one of instruments with maturities of 90 days or less at the date of acqui-
sition and the other of instruments with maturities of more than 90 days
at the date of acquisition.
This change was made in order for the Group to better manage its excess
liquidity by enabling the use of longer dated instruments where appropriate
and by facilitating a wider range of benchmarks for performance measure-
ment and interest risk management purposes. Both pools remain availa-
ble to meet the Group’s cash commitments, and initially, both have similar
highly liquid and low risk profiles, with the pool of 90 day and under instru-
ments treated as cash equivalents and the pool of over 90 day instruments
treated as available-for-sale investments, liquid assets.
In the future the risk profile of the two pools may be different in line
with the revised cash management practices.
Prior year amounts in the balance sheet and the statement of cash
flows have been changed to reflect the current composition of cash equiv-
alents and available-for-sale investments, liquid assets.
Further details of the Group’s risk management principles in relation to
its excess liquidity are provided in Note 35.
N ote s to t h e co n s o l i d a te d f i n a n c i a l st a te m e n t s
fied as held for sale, or included within a disposal group that is classified
as held for sale, is not depreciated. IFRS 5 is effective for fiscal years begin-
ning on or after January 1, 2005. The Group does not expect the adoption
of this standard will have a material impact on the Group’s financial posi-
tion, results of operations or cash flows.

18 Nokia in 2004
3. Segment informationUntil January 1, 2004, Nokia’s organizational and reporting structure con-
sisted of three primary business segments: Nokia Mobile Phones, Nokia
Networks, and Nokia Ventures Organization. Effective January 1, 2004, Nokia’s
structure was reorganized in a move to further align the Group’s overall
structure with its strategy. Nokia’s revised structure includes four business
segments, which form the main reporting structure: Mobile Phones; Multi-
media; Enterprise Solutions; and Networks. Nokia’s reportable segments
represent the strategic business units that offer different products and
services for which monthly financial information is provided to the Board.
The comparative figures have been regrouped accordingly.
Mobile Phones currently offers mobile phones and devices based on
the three global cellular technologies: GSM/EDGE, CDMA and TDMA.
The Multimedia business group focuses on bringing connected and
mobile multimedia to consumers in the form of advanced mobile devices
and solutions.
Enterprise Solutions offers businesses solutions ranging from business-
optimized mobile devices for end users to a broad portfolio of IP network
perimeter security gateways and mobile connectivity offerings.
Networks is a leading provider of network infrastructure, communications
and networks service platforms and professional services to operators and
service providers.
N o te s to t h e co n s o l i d a te d f i n a n c i a l s t a te m e n t s
In addition to the four business groups, the Group’s organization has
two horizontal units to support the mobile device business groups, in-
crease operational efficiency and competitiveness, and to take advantage
of economies of scale: Customer and Market Operations and Technology
Platforms. The horizontal groups are not separate reporting entities, but
their costs are carried mainly by the mobile device business groups, which
comprises of Mobile Phones, Multimedia and Enterprise Solutions, with
the balance included in Common Group Expenses. The costs and revenues
as well as assets and liabilities of the horizontal groups are allocated to
the mobile device business groups on a symmetrical basis; with any
amounts not so allocated included in Common Group Functions. Common
Group Functions consists of common research and general Group functions.
The accounting policies of the segments are the same as those de-
scribed in Note 1. Nokia accounts for intersegment revenues and transfers
as if the revenues or transfers were to third parties, that is, at current market
prices. Nokia evaluates the performance of its segments and allocates re-
sources to them based on operating profit.
No single customer represents 10% or more of Group revenues.

Nokia in 2004 19
Common TotalMobile Multi- Enterprise Group reportable Elimina–
2004, EURm Phones media Solutions Networks Functions segments tions Group
Profit and loss informationNet sales to external customers 18 429 3 636 806 6 367 29 29 267 29 267Net sales to other segments 78 23 24 – –29 96 –96 –Depreciation and amortization 306 77 23 314 148 868 868Impairment and customer finance charges – – – 115 11 126 126Operating profit 3 768 179 –199 878 –296 4 330 4 330Share of results of associated
companies – – – – –26 –26 –26Balance sheet information
Capital expenditures 1 279 67 18 91 93 548 548Segment assets 2 3 758 787 210 3 055 1 142 8 952 –12 8 940
of which: Investments inassociated companies – – – – 200 200 200
Unallocated assets 3 13 729
Total assets 22 669
Segment liabilities 4 4 114 934 271 1 574 170 7 063 –12 7 051Unallocated liabilities 5 1 212
Total liabilities 8 263
2003, EURm
Profit and loss informationNet sales to external customers 20 826 2 496 502 5 620 11 29 455 29 455Net sales to other segments 125 8 27 – –11 149 –149 –Depreciation and amortization 378 55 10 520 175 1 138 1 138Impairment and customer finance charges – – – 200 40 240 240Operating profit 5 927 –186 –141 –219 –370 5 011 5 011Share of results of associated
companies – – – – –18 –18 –18Balance sheet information
Capital expenditures 1 298 33 3 44 54 432 432Segment assets 2 4 169 604 135 4 108 1 101 10 117 –22 10 095
of which: Investments inassociated companies – – – – 76 76 76
Unallocated assets 3 13 825
Total assets 23 920
Segment liabilities 4 4 532 689 180 1 628 178 7 207 –22 7 185Unallocated liabilities 5 1 423
Total liabilities 8 608
2002, EURm
Profit and loss informationNet sales to external customers 21 417 1 552 469 6 538 40 30 016 30 016Net sales to other segments 211 3 18 1 –40 193 –193 –Depreciation and amortization 501 46 28 542 194 1 311 1 311Impairment and customer finance charges – – 61 400 77 538 538Operating profit 5 718 –365 –102 -49 –422 4 780 4 780Share of results of associated
companies – – – – –19 –19 –19
1 Including goodwill and capitalized development costs, capital expenditures in 2004 amount toEUR 649 million (EUR 670 million in 2003). The goodwill and capitalized development costs consistof EUR 11 million in 2004 (EUR 17 million in 2003) for Mobile Phones, EUR 3 million in 2004 (12
million in 2003) for Multimedia, EUR 1 million in 2004 (EUR 22 million in 2003) for EnterpriseSolutions, EUR 83 million in 2004 (182 million in 2003) for Networks and EUR 3 million in 2004
(EUR 5 million in 2003) for Common Group Functions.
2 Comprises intangible assets, property, plant and equipment, investments, inventories andaccounts receivable as well as prepaid expenses and accrued income except those relatedto interest and taxes.
3 Unallocated assets include cash and other liquid assets, available-for-sale investments, long-term loans receivable and other financial assets as well as interest and tax related prepaidexpenses and accrued income. Tax related prepaid expenses and accrued income, and deferredtax assets amount to EUR 826 million in 2004 (EUR 834 million in 2003).
4 Comprises accounts payable, prepaid income, accrued expenses and provisions except thoserelated to interest and taxes.
5 Unallocated liabilities include long-term liabilities, short-term borrowings and current portionof long-term debt, as well as interest and tax related prepaid income, accrued expenses andprovisions. Tax related prepaid income and accrued expenses, and deferred tax liabilitiesamount to EUR 246 million in 2004 (EUR 394 million in 2003).
N ote s to t h e co n s o l i d a te d f i n a n c i a l st a te m e n t s

20 Nokia in 2004
4. Percentage of completionContract sales recognized under the cost-to-cost method of percentage of
completion accounting were approximately EUR 5.2 billion in 2004 (EUR 4.8
billion in 2003 and EUR 5.9 billion in 2002). Billings in advance of contract
revenues, included in prepaid income, were EUR 185 million at December
31, 2004 (EUR 195 million in 2003 and 108 million in 2002). Contract revenues
recorded prior to billings, included in receivables, were EUR 80 million at
December 31, 2004 (EUR 665 million in 2003 and EUR 573 million in 2002).
Revenue recognition on initial 3G network contracts started in 2002
when Nokia Networks achieved 3G functionality for its single-mode and
dual-mode WCDMA 3G systems. Until the time 3GPP specifications required
by our customers were met, the application of the cost-to-cost input mod-
el was deferred. Upon achieving 3G functionality for WCDMA network
projects, the Group began recognizing revenue under the cost-to-cost in-
put method of percentage of completion accounting and have continued
to apply the method in 2003 and in 2004.
N o te s to t h e co n s o l i d a te d f i n a n c i a l s t a te m e n t s
Net sales to external customers 2004 2003 2002
by geographic area EURm EURm EURm
by location of customer
Finland 351 347 353
USA 3 416 4 475 4 665
China 2 660 2 013 2 802
Great Britain 2 261 2 693 3 111
German 1 730 2 297 1 849
Other 18 849 17 630 17 236
Total 29 267 29 455 30 016
Segment assets by 2004 2003geographic area EURm EURm
Finland 3 429 4 215
USA 1 025 1 563
China 880 1 011
Great Britain 502 344
Germany 353 387
Other 2 751 2 575
Total 8 940 10 095
Capital expenditures 2004 2003 2002by market area EURm EURm EURm
Finland 216 160 188
USA 80 49 71
China 57 53 47
Great Britain 5 9 27
Germany 20 17 21
Other 170 144 78
Total 1 548 432 432
1 Including goodwill and capitalized development costs, capital expendituresamount to EUR 649 million in 2004 (EUR 670 million in 2003 and EUR 860 millionin 2002). The goodwill and capitalized development costs in 2004 consist of EUR 0million in USA (EUR 20 million in USA in 2003 and 1 million in USA in 2002) and EUR101 million in other areas (EUR 218 million in 2003 and EUR 427 million in 2002).
5. Personnel expenses2004 2003 2002
EURm EURm EURm
Wages and salaries 2 805 2 501 2 531
Pension expenses, net 253 184 224
Other social expenses 372 341 385
Personnel expenses as per
profit and loss account 3 430 3 026 3 140
Pension expenses, comprised of multi-employer, insured and defined con-
tribution plans were EUR 192 million in 2004 (EUR 146 million in 2003 and
EUR 167 million in 2002).
Remuneration of the Chairman and the
other members of the Board of Directors,
Group Executive Board and Presidents
and Managing Directors * 25 22 19
* Incentives included in remuneration 8 5 4
Pension commitments for the management:
The retirement age of the management of the Group companies is between
60–65 years.
For the Chief Executive Officer and the President of the Parent Company
the retirement age is 60 years. There were also three other Group Executive
Board Members whose retirement age is 60 years as of December 31, 2004.
There is also one other Member, following his arragement from a previous
employer, who has a retirement benefit of 65% of his pensionable salary
beginning at age 62 with early retirement possible at age 55 with reduc-
tion in benefits. Nokia does not offer any similar benefits to any other
members of the 2004 Group Executive Board.
Average personnel 2004 2003 2002
Mobile Phones 2 853
Multimedia 2 851
Enterprise Solutions 2 167
Networks 15 463
Common Group Functions 30 177
Nokia Group 53 511 51 605 52 714
6. PensionsThe most significant pension plans are in Finland and are comprised of the
Finnish state TEL system with benefits directly linked to employee earnings.
These benefits are financed in two distinct portions. The majority of benefits
are financed by contributions to a central pool with the majority of the
contributions being used to pay current benefits. The other part comprises
reserved benefits which are pre-funded through the trustee-administered
Nokia Pension Foundation. The pooled portion of the TEL system is accounted
for as a defined contribution plan and the reserved portion as a defined
benefit plan. The foreign plans include both defined contribution and de-
fined benefit plans.

Nokia in 2004 21
The principal actuarial weighted average assumptions used were as
follows:
% Domestic Foreign Domestic Foreign
Discount rate for determining
present values 4.75 5.00 5.25 5.30
Expected long-term rate of
return on plan assets 5.00 5.31 6.00 6.87
Annual rate of increase in future
compensation levels 3.50 3.82 3.50 3.49
Pension increases 2.00 2.38 2.30 2.27
The prepaid pension cost above is made up of a prepayment of EUR 202
million (EUR 164 million in 2003) and an accrual of EUR 76 million (EUR 85
million in 2003).
The domestic pension plans’ assets include Nokia securities with fair values
of EUR 4 million in 2004 (EUR 19 million in 2003).
The foreign pension plan assets include a self investment through a loan
provided to Nokia by the Group’s German pension fund of EUR 62 million
(EUR 64 million in 2003). See Note 32.
The actual return on plan assets was EUR 83 million in 2004 (EUR 41 million
in 2003).
7. Selling and marketing expenses,administration expenses and other operatingincome and expenses
EURm 2004 2003 2002
Selling and marketing expenses –2 552 –2 649 –2 579
Administration expenses –604 –630 –701
Other operating expenses –162 –384 –292
Other operating income 343 300 333
Total –2 975 –3 363 –3 239
Other operating income for 2004 includes a gain of EUR 160 million repre-
senting the premium return under a multi-line, multi-year insurance pro-
gram, which expired during 2004. The return was due to our low claims
experience during the policy period.
Other operating income for 2003 includes a gain of EUR 56 million on the
sale of the remaining shares of Nokian Tyres Ltd. In 2003, Nokia Networks
recorded a charge of EUR 80 million for personnel expenses and other costs
in connection with the restructuring taken in light of general downturn in
market conditions, of which EUR 15 million was paid during 2003.
Other operating income for 2002 includes a gain of EUR 106 million relat-
ing to the sale of Nokia’s investment in PayPal. Other operating expenses for
2002 are composed of various items which are individually insignificant.
The Group expenses advertising and promotion costs as incurred. Adver-
tising and promotional expenses were EUR 1 144 million in 2004 (1 414 mil-
lion in 2003 and EUR 1 174 million in 2002).
2004 2003
N ote s to t h e co n s o l i d ate d f i n a n c i a l st a te m e n t s
Effective on January 1, 2005, the Finnish TEL system will undergo a reform.
The most significant change that will have an impact on Nokia’s future finan-
cial statements is that pensions accumulated after 2005 are calculated on
the earnings during the entire working career, not only on the basis of the
last few years of employment as provided by the old rules. An increase to
the rate at which pensions accrue has led to a past service cost of EUR 5
million, which will be recognized over employees’ future working life.
The amounts recognized in the balance sheet relating to single employer
defined benefit schemes are as follows:
Domestic Foreign Domestic ForeignEURm Plans Plans Plans Plans
Fair value of plan assets 768 303 683 204
Present value of funded
obligations –727 –398 –666 –343
Surplus/(Deficit) 41 –95 17 –139
Unrecognized net actuarial
(gains)/losses 93 82 140 61
Unrecognized past service cost 5 – – –
Prepaid/(Accrued) pension
cost in balance sheet 139 –13 157 –78
The amounts recognized in the profit and loss account are as follows:
EURm 2004 2003 2002
Current service cost 62 54 58
Interest cost 56 46 47
Expected return on plan assets –56 –55 –61
Net actuarial losses (gains)
recognized in year – 3 2
Past service cost gain (–) loss (+) –1 – 11
Curtailment – –10 –
Total, included in personnel expenses 61 38 57
Movements in prepaid pension costs recognized in the balance sheet are
as follows:
EURm 2004 2003
Prepaid pension costs at beginning of year 79 70
Net income (expense) recognized in
the profit and loss account –61 –38
Contributions paid 108 47
Prepaid pension costs at end of year 126 * 79 *
* included within prepaid expenses and accrued income
2004 2003

22 Nokia in 2004
N o te s to t h e co n s o l i d a te d f i n a n c i a l s t a te m e n t s
8. ImpairmentMobile Enterprise Common
2004, EURm Phones Multimedia Solutions Networks Group Functions Group
Impairment of available-for-sale investments – – – – 11 11
Impairment of capitalized development costs – – – 115 – 115
Total, net – – – 115 11 126
2003, EURmCustomer finance impairment charges,
net of reversals – – – –226 – –226
Impairment of goodwill – – – 151 – 151
Impairment of available-for-sale investments – – – – 27 27
Impairment of capitalized development costs – – – 275 – 275
Total, net – – – 200 27 227
2002, EURmCustomer finance impairment charges, net – – – 279 – 279
Impairment of goodwill – – 61 121 – 182
Impairment of available-for-sale investments – – – – 77 77
Total, net – – 61 400 77 538
During 2004, Nokia recorded an impairment charge of EUR 65 million of
capitalized development costs due to the abandonment of FlexiGateway
and Horizontal Technology modules. In addition, an impairment charge of
EUR 50 million was recorded on WCDMA radio access network program due
to changes in market outlook. The impairment loss was determined as the
difference between the carrying amount of the asset and its recoverable
amount. The recoverable amount for WCDMA radio access network was de-
rived from the discounted cash flow projections, which covers the estimat-
ed life of the WCDMA radio access network current technology, using a dis-
count rate of 15%. The impaired technologies were part of Networks busi-
ness group.
Relating to restructuring at Networks, Nokia recorded in 2003 EUR 206
million impairment of capitalized development costs relating to the WCDMA
3G systems. In 2003 Nokia also recorded a EUR 26 million and EUR 43 million
impairment of capitalized development costs relating to FlexiGateway and
Metrosite systems, respectively. The impairment losses were determined
as the difference between the carrying amount of the asset and its recover-
able amount. In determining the recoverable amount, the Group calculated
the present value of estimated discounted future cash flows, using a 15%
discount rate for WCDMA and FlexiGateway and 12% discount rate for Metrosite,
expected to arise from the continuing use of the asset and from its disposal
at the end of its useful life.
During 2002, Nokia recorded a net customer financing impairment
charge of EUR 279 million. Of this amount, EUR 292 million was an impairment
charge to write down the loans receivable to their estimated recoverable
amount related to MobilCom and EUR 13 million was a partial recovery re-
ceived relating to amounts written off in 2001 related to Dophin. The im-
pairment charge recorded in 2002 relating to Mobilcom was substantially
reversed in 2003 by EUR 226 million as a result of the company receiving
repayment of the MobilCom loans receivables in the form of subordinated
convertible perpetual bonds of France Telecom. See Notes 11, 16 and 21.
In 2003 and 2002 Nokia has evaluated the carrying value of goodwill
arising from certain acquisitions by determining if the carrying values of
the net assets of the cash generating unit to which the goodwill belongs
exceeds the recoverable amounts of that unit. In 2003 and 2002, in the
Nokia Networks business, Nokia recorded an impairment charge of EUR
151 million and EUR 104 million, respectively, on goodwill related to the
acquisition of Amber Networks. The recoverable amount for Amber Networks
was derived from the value in use discounted cash flow projections, which
covers the estimated life of the Amber platform technology, using a dis-
count rate of 15%. At December 31, 2004, there is EUR 0 million of Amber
goodwill (EUR 0 million in 2003). The impairment is a result of significant
declines in the market outlook for products under development.
In 2002, Nokia recognized impairment loss of EUR 36 million on goodwill
related to the acquisition of Ramp Networks. In 2002, Nokia recognized an
impairment loss of EUR 25 million, respectively, on goodwill related to the
acquisition of Network Alchemy. Both of these entities are part of Enter-
prise Solutions business segment. The remaining goodwill balances were
written off as a result of decisions to discontinue the related product devel-
opment.
Nokia recognized various minor goodwill impairment charges totaling
EUR 0 million in 2004 and 2003 and EUR 17 million in 2002.
During 2004 the Group’s investment in certain equity securities suffered
a permanent decline in fair value resulting in an impairment charge of EUR
11 million relating to non-current available-for-sale investments (EUR 27
million in 2003 and EUR 77 million in 2002).

Nokia in 2004 23
N ote s to t h e co n s o l i d a te d f i n a n c i a l st a te m e n t s
11. Financial income and expenses
2004 2003 2002
EURm EURm EURm
Income from available-for-sale investments
Dividend income 22 24 25
Interest income 299 323 230
Other financial income 178 38 27
Exchange gains and losses 8 32 –29
Interest expense –22 –25 –43
Other financial expenses –80 –40 –54
Total 405 352 156
During 2004, Nokia sold approximately 69% of its original holdings in the
subordinated convertible perpetual bonds issued by France Telecom. As a
result, the Group booked a total net gain of EUR 106 million in other financial
income, of which EUR 104 million was recycled from Fair Value and Other
Reserves. See Notes 16 and 21.
12. Income taxes
2004 2003 2002EURm EURm EURm
Income tax expense
Current tax –1 392 –1 686 –1 423
Deferred tax –43 –13 –61
Total –1 435 –1 699 –1 484
Finland –1 117 –1 118 –1 102
Other countries –318 –581 –382
Total –1 435 –1 699 –1 484
The differences between income tax expense computed at statutory rates
(29% in Finland in 2004, 2003 and 2002) and income tax expense provided
on earnings are as follows at December 31:
2004 2003 2002
EURm EURm EURm
Income tax expense at statutory rate 1 372 1 555 1 431
Amortization of goodwill 28 46 59
Impairment of goodwill – 58 70
Provisions without income
tax benefit/expense – – –10
Taxes for prior years –34 56 8
Taxes on foreign subsidiaries’ profits
in excess of (lower than) income
taxes at statutory rates –130 –77 –59
Operating losses with no current
tax benefit – 8 6
Net increase in provisions 67 14 –39
Change in deferred tax rate 26 – –
Deferred tax liability on undistributed
earnings 60 – –
Other 46 39 18
Income tax expense 1 435 1 699 1 484
At December 31, 2004, the Group had loss carry forwards, primarily attributable
to foreign subsidiaries of EUR 105 million (EUR 186 million in 2003 and EUR
425 million in 2002), most of which will expire between 2005 and 2024.
In 2005, the corporate tax rate in Finland will be reduced from 29% to
26%. The change had no impact on the current tax expense in 2004. The
impact of the change on the Profit and loss account through change in
deferred taxes in 2004 was EUR 26 million.
Certain of the Group companies’ income tax returns for periods ranging
from 1998 through 2002 are under examination by tax authorities. The
Group does not believe that any significant additional taxes in excess of
those already provided for will arise as a result of the examinations.
During 2004, the Group analyzed its future foreign investment plans
with respect to certain foreign investments. As a result of this analysis, the
Group concluded that it could no longer represent that all foreign earnings
may be permanently reinvested. Accordingly, the Group recorded the recog-
nition of a EUR 60 million deferred tax liability during the year.
9. AcquisitionsIn 2003, Nokia made three minor purchase acquisitions for a total consid-
eration of EUR 38 million, of which EUR 20 million was in cash and EUR 18
million in non-cash consideration.
In 2002, Nokia increased its voting percentage of 39.97% and holding
percentage of 59.97% in Nextrom Holding S.A. to a voting percentage of
86.21% and a holding percentage of 79.33%. These increases resulted from
a rights offering by Nextrom in June 2002 and by acquiring new registered
and bearer shares in an offering by Nextrom in December 2002 both total-
ling EUR 13 million. The fair value of net assets acquired was EUR 4 million
giving rise to goodwill of EUR 9 million.
10. Depreciation and amortization
Depreciation and 2004 2003 2002amortization by asset category EURm EURm EURm
Intangible assets
Capitalized development costs 244 327 233
Intangible rights 38 51 65
Goodwill 96 159 206
Other intangible assets 30 21 28
Property, plant and equipment
Buildings and constructions 32 34 37
Machinery and equipment 426 545 737
Other tangible assets 2 1 5
Total 868 1 138 1 311
Depreciation and amortization by functionCost of sales 196 214 314
R&D 431 537 473
Selling, marketing and administration 137 185 211
Other operating expenses 8 43 107
Goodwill 96 159 206
Total 868 1 138 1 311

24 Nokia in 2004
N o te s to t h e co n s o l i d a te d f i n a n c i a l s t a te m e n t s
13. Intangible assets
2004 2003EURm EURm
Capitalized development costs
Acquisition cost Jan. 1 1 470 1 707
Additions 101 218
Impairment and write-offs –115 –455
Accumulated amortization Dec. 31 –1 178 –933
Net carrying amount Dec. 31 278 537
Goodwill
Acquisition cost Jan. 1 1 298 1 429
Additions – 20
Impairment charges (Note 8) – –151
Accumulated amortization Dec. 31 –1 208 –1 112
Net carrying amount Dec. 31 90 186
Other intangible assets
Acquisition cost Jan. 1 554 524
Additions 86 87
Disposals –7 –44
Translation differences –4 –13
Accumulated amortization Dec. 31 –420 –369
Net carrying amount Dec. 31 209 185
The amount of capitalized development cost impairment and write-offs in
2004 include an EUR 50 million impairment charge based on IFRS impairment
review and EUR 65 million of other impairments (EUR 275 million and EUR
180 million in 2003, respectively).
14. Property, plant and equipment
2004 2003EURm EURm
Land and water areas
Acquisition cost Jan. 1 108 112
Additions 1 –
Disposals –5 –
Translation differences – –4
Net carrying amount Dec. 31 104 108
Buildings and constructions
Acquisition cost Jan. 1 887 911
Additions 38 5
Disposals –10 –1
Translation differences –5 –28
Accumulated depreciation Dec. 31 –220 –196
Net carrying amount Dec. 31 690 691
2004 2003
EURm EURm
Machinery and equipment
Acquisition cost Jan. 1 3 223 3 249
Additions 438 336
Disposals –277 –313
Translation differences –13 –49
Accumulated depreciation Dec. 31 –2 681 –2 521
Net carrying amount Dec. 31 690 702
Other tangible assets
Acquisition cost Jan. 1 18 22
Additions 1 –
Disposals – –1
Translation differences 2 –3
Accumulated depreciation Dec. 31 –11 –6
Net carrying amount Dec. 31 10 12
Advance payments and fixed assets under construction
Acquisition cost Jan. 1 53 60
Additions 25 44
Disposals – –10
Transfers to:
Other intangible assets –1 –4
Buildings and constructions –8 –
Machinery and equipment –30 –35
Translation differences 1 –2
Net carrying amount Dec. 31 40 53
Total property, plant and equipment 1 534 1 566
15. Investments in associated companies
2004 2003EURm EURm
Net carrying amount Jan. 1 76 49
Additions 150 59
Share of results –26 –18
Translation differences 1 –2
Other movements –1 –12
Net carrying amount Dec. 31 200 76
In 2004, Nokia increased its ownership in Symbian from 32.2% to 47.9% by
acquiring part of the shares of Symbian owned by Psion for EUR 102 million
(GBP 70 million). EUR 68 million (GBP 47 million) of the total acquisition cost
was paid in cash and the remaining purchase price is considered as contin-
gent consideration to be paid in 2005 and 2006 . Nokia also participated in
a rights issue to raise EUR 73 million (GBP 50 million) additional funding to
Symbian. The issue was pro rata to existing shareholders.

Nokia in 2004 25
N ote s to t h e co n s o l i d a te d f i n a n c i a l st a te m e n t s
In 2003, Nokia increased its ownership in Symbian from 19.0% to 32.2%
by acquiring part of the shares of Symbian owned by Motorola representing
13.2% of all the shares in Symbian, for EUR 57 million (GBP 39.6 million) in
cash.
Shareholdings in associated companies are comprised of investments
in unlisted companies in all periods presented.
16. Available-for-sale investments
2004 2003
EURm EURm
Fair value at Jan. 1 11 088 8 093
Additions (deductions), net –221 2 911
Fair value gains/losses 20 111
Impairment charges (Note 8) –11 –27
Fair value at Dec. 31 10 876 11 088
Non-current 169 121
Current 255 816
Current, liquid assets 9 085 8 512
Current, cash equivalents 1 367 1 639
Available-for-sale investments, comprising marketable debt and equity
securities and investments in unlisted equity shares, are fair valued, except
in the case of certain unlisted equities, where the fair value cannot be
measured reliably. Such unlisted equities are carried at cost, less impair-
ment (EUR 54 million in 2004 and EUR 45 million in 2003). Fair value for equity
investments traded in active markets and for unlisted equities, where the
fair value can be measured reliably, was EUR 115 million in 2004 and EUR 77
million in 2003. Fair value for equity investments traded in active markets
is determined by using exchange quoted bid prices. For other investments,
fair value is estimated by using the current market value of similar instru-
ments or by reference to the discounted cash flows of the underlying net
assets. Gains and losses arising from the change in the fair value of available-
for-sale investments are recognized directly in fair value and other reserves.
Available-for-sale investments comprise: (1) the subordinated convertible
perpetual bonds of France Telecom (convertible at any time to ordinary
shares of France Telecom at a price of EUR 40 and with a fixed coupon of
5.75% until the end of 2009, thereafter floating rate plus a spread of 300bp,
both being subject to a maximum 50bp step down linked to France Telecom’s
long-term credit ratings), which are regarded as current available-for-sale
investments, (2) highly liquid, interest-bearing investments with maturities
at acquisition of longer than 3 months, which are regarded as current
available-for-sale investments, liquid assets and (3) similar types of invest-
ments as in category (2), but with maturities at acquisition of less than 3
months, which are regarded as current available-for-sale investments,
cash equivalents. The remaining part of the available-for-sale investments
portfolio is classified as non-current. See Note 35 for details of these in-
vestments.
17. Long-term loans receivableLong-term loans receivable, consisting of loans made to customers princi-
pally to support their financing of network infrastructure and services or
working capital, net of allowances and write-offs amounts (Note 8), are
repayable as follows:
2004 2003EURm EURm
Under 1 year – –
Between 1 and 2 years – 354
Between 2 and 5 years – –
Over 5 years – –
– 354
18. Inventories2004 2003
EURm EURm
Raw materials, supplies and other 326 346
Work in progress 477 435
Finished goods 502 388
Total 1 305 1 169
19. ReceivablesPrepaid expenses and accrued income consists of VAT and other tax receiv-
ables, prepaid pension costs, accrued interest income and other accrued
income, but no amounts which are individually significant.
Accounts receivable include EUR 118 million (EUR 40 million in 2003) due
more than 12 months after the balance sheet date.

26 Nokia in 2004
N ote s to t h e co n s o l i d a te d f i n a n c i a l st a te m e n t s
20. Valuation and qualifying accounts
Balance at Charged to cost Charged to Balance atAllowances on beginning of year and expenses other accounts Deductions 1 end of yearassets to which they apply: EURm EURm EURm EURm EURm
2004
Doubtful accounts receivable 367 155 – –161 361
Excess and obsolete inventory 188 308 – –324 172
2003
Doubtful accounts receivable 300 228 – –161 367
Excess and obsolete inventory 290 229 – –331 188
2002
Doubtful accounts receivable 217 186 – –103 300
Long-term loans receivable 13 – – –13 –
Excess and obsolete inventory 314 318 – –342 290
1 Deductions include utilization and releases of the allowances.
21. Fair value and other reserves
Gross Tax Net Gross Tax Net Gross Tax Net
Balance at Dec. 31, 2002 31 –9 22 –13 –16 –29 18 –25 –7
Cash flow hedges:
Fair value gains/(losses) in period 1 1 2 – – – 1 1 2
Available-for-sale investments:
Net fair value gains/(losses) – – – 110 –12 98 110 –12 98
Transfer to profit and loss account on impairment – – – 27 – 27 27 – 27
Transfer of fair value gains to profit and loss
account on disposal – – – –84 20 –64 –84 20 –64
Transfer of fair value losses to profit and loss
account on disposal – – – 43 –6 37 43 –6 37
Balance at Dec. 31, 2003 32 –8 24 83 –14 69 115 –22 93
Cash flow hedges:
Fair value gains/(losses) in period 59 –16 43 – – – 59 –16 43
Available-for-sale investments:
Net fair value gains/(losses) – – – 18 –1 17 18 –1 17
Transfer to profit and loss account on impairment – – – 11 – 11 11 – 11
Transfer of fair value gains to profit and loss
account on disposal – – – –105 10 –95 –105 10 –95
Transfer of fair value losses to profit and loss
account on disposal – – – – – – – – –
Balance at Dec. 31, 2004 91 –24 67 7 –5 2 98 –29 69
In order to ensure that amounts deferred in the cash flow hedging reserve
represent only the effective portion of gains and losses on properly desig-
nated hedges of future transactions that remain highly probable at the
balance sheet date, Nokia has adopted a process under which all derivative
gains and losses are initially recognized in the profit and loss account. The
appropriate reserve balance is calculated at the end of each period and
posted to equity.
Nokia continuously reviews the underlying cash flows and the hedges
allocated thereto, to ensure that the amounts transferred to the Hedging
Reserve during the year ended December 31, 2004 and 2003 do not include
gains/losses on forward exchange contracts that have been designated to
hedge forecasted sales or purchases that are no longer expected to occur.
Because of the number of transactions undertaken during each period and
Hedging reserve, EURmAvailable-for-sale
investments, EURm Total, EURm

Nokia in 2004 27
N ote s to t h e co n s o l i d a te d f i n a n c i a l st a te m e n t s
the process used to calculate the reserve balance, separate disclosure of the
transfers of gains and losses to and from the reserve would be impractical.
All of the net fair value gains or losses recorded in the Fair value and
other reserve at December 31, 2004 on open forward foreign exchange
contracts which hedge anticipated future foreign currency sales or pur-
chases are transferred from the Hedging Reserve to the profit and loss account
when the forecasted foreign currency cash flows occur, at various dates up
to 1 year from the balance sheet date.
22. The shares of the Parent CompanySee Note 15 to the financial statements of the Parent Company.
23. Distributable earnings2004
EURm
Retained earnings 13 765
Translation differences (distributable earnings) –432
Treasury shares –2 022
Other non-distributable items
Portion of untaxed reserves 12
Distributable earnings Dec. 31 11 323
Retained earnings under IFRS and Finnish Accounting Standards (FAS) are
substantially the same. Distributable earnings are calculated based on
Finnish legislation.
24. Long-term liabilitiesOutstanding Repayment date Outstanding
EURm Dec. 31, 2004 beyond 5 years Dec. 31, 2003
Long-term loans are repayable as follows:
Loans from financial institutions – – 1
Loans from pension insurance companies 19 19 18
Other long-term finance loans – – 1
Other long-term liabilities 96 96 67
115 115 87
Deferred tax liabilities 179 241
Total long-term liabilities 294 328
The long-term liabilities, excluding deferred tax liabilities as of
December 31, 2004, mature as follows:
PercentEURm of total
2005 – –
2006 – –
2007 – –
2008 – –
2009 – –
Thereafter 115 100.0%
115 100.0%
The currency mix of the Group long-term liabilities as at
December 31, 2004 was as follows:
EUR USD
97.24% 2.76%
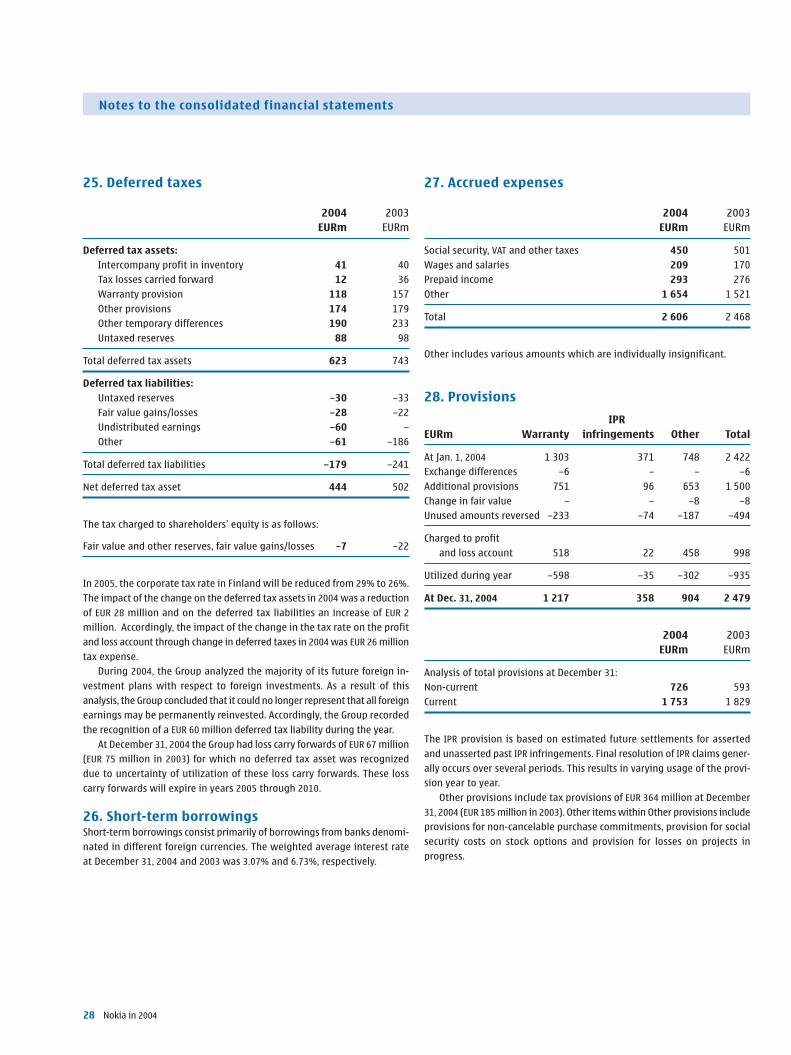
28 Nokia in 2004
N ote s to t h e co n s o l i d a te d f i n a n c i a l st a te m e n t s
25. Deferred taxes
2004 2003EURm EURm
Deferred tax assets:
Intercompany profit in inventory 41 40
Tax losses carried forward 12 36
Warranty provision 118 157
Other provisions 174 179
Other temporary differences 190 233
Untaxed reserves 88 98
Total deferred tax assets 623 743
Deferred tax liabilities:
Untaxed reserves –30 –33
Fair value gains/losses –28 –22
Undistributed earnings –60 –
Other –61 –186
Total deferred tax liabilities –179 –241
Net deferred tax asset 444 502
The tax charged to shareholders’ equity is as follows:
Fair value and other reserves, fair value gains/losses –7 –22
In 2005, the corporate tax rate in Finland will be reduced from 29% to 26%.
The impact of the change on the deferred tax assets in 2004 was a reduction
of EUR 28 million and on the deferred tax liabilities an increase of EUR 2
million. Accordingly, the impact of the change in the tax rate on the profit
and loss account through change in deferred taxes in 2004 was EUR 26 million
tax expense.
During 2004, the Group analyzed the majority of its future foreign in-
vestment plans with respect to foreign investments. As a result of this
analysis, the Group concluded that it could no longer represent that all foreign
earnings may be permanently reinvested. Accordingly, the Group recorded
the recognition of a EUR 60 million deferred tax liability during the year.
At December 31, 2004 the Group had loss carry forwards of EUR 67 million
(EUR 75 million in 2003) for which no deferred tax asset was recognized
due to uncertainty of utilization of these loss carry forwards. These loss
carry forwards will expire in years 2005 through 2010.
26. Short-term borrowingsShort-term borrowings consist primarily of borrowings from banks denomi-
nated in different foreign currencies. The weighted average interest rate
at December 31, 2004 and 2003 was 3.07% and 6.73%, respectively.
27. Accrued expenses
2004 2003EURm EURm
Social security, VAT and other taxes 450 501
Wages and salaries 209 170
Prepaid income 293 276
Other 1 654 1 521
Total 2 606 2 468
Other includes various amounts which are individually insignificant.
28. Provisions
EURm Warranty infringements Other Total
At Jan. 1, 2004 1 303 371 748 2 422
Exchange differences –6 – – –6
Additional provisions 751 96 653 1 500
Change in fair value – – –8 –8
Unused amounts reversed –233 –74 –187 –494
Charged to profit
and loss account 518 22 458 998
Utilized during year –598 –35 –302 –935
At Dec. 31, 2004 1 217 358 904 2 479
2004 2003
EURm EURm
Analysis of total provisions at December 31:
Non-current 726 593
Current 1 753 1 829
The IPR provision is based on estimated future settlements for asserted
and unasserted past IPR infringements. Final resolution of IPR claims gener-
ally occurs over several periods. This results in varying usage of the provi-
sion year to year.
Other provisions include tax provisions of EUR 364 million at December
31, 2004 (EUR 185 million in 2003). Other items within Other provisions include
provisions for non-cancelable purchase commitments, provision for social
security costs on stock options and provision for losses on projects in
progress.
IPR

Nokia in 2004 29
N ote s to t h e co n s o l i d a te d f i n a n c i a l st a te m e n t s
29. Earnings per share
2004 2003 2002
Numerator/EURm
Basic/Diluted:
Net profit 3 207 3 592 3 381
Denominator/1 000 shares
Basic:
Weighted average shares 4 593 196 4 761 121 4 751 110
Effect of dilutive securities:
stock options, restricted shares
and performance shares 7 141 40 36 932
Diluted:
Adjusted weighted average shares
and assumed conversions 4 600 337 4 761 161 4 788 042
Under IAS 33, basic earnings per share is computed using the weighted
average number of shares outstanding during the period. Diluted earnings
per share is computed using the weighted average number of shares out-
standing during the period plus the dilutive effect of stock options, restricted
shares and performance shares outstanding during the period.
30. Commitments and contingencies
2004 2003
EURm EURm
Collateral for our own commitments
Property under mortgages 18 18
Assets pledged 11 13
Contingent liabilities on behalf of Group companies
Other guarantees 275 184
Collateral given on behalf of other companies
Securities pledged 1 – 28
Contingent liabilities on behalf of other companies
Guarantees for loans 1 3 5
Other guarantees 2 –
Financing commitments
Customer finance commitments 1 56 490
1 See also Note 35 b
The amounts above represent the maximum principal amount of commit-
ments and contingencies.
Property under mortgages given as collateral for our own commitments
include mortgages given to the Finnish National Board of Customs as a
general indemnity of EUR 18 million in 2004 (EUR 18 million in 2003).
Assets pledged for the Group’s own commitments include available-
for-sale investments of EUR 11 million in 2004 (EUR 3 million of inventories
and EUR 10 million available-for-sale investments in 2003).
Other guarantees include guarantees of Nokia’s performance of EUR
223 million in 2004 (EUR 171 million in 2003). However, EUR 175 million of
these guarantees are provided to certain Networks’ customers in the form
of bank guarantees, standby letters of credit and other similar instru-
ments. These instruments entitle the customer to claim payment as com-
pensation for non-performance by Nokia of its obligations under network
infrastructure supply agreements. Depending on the nature of the instru-
ment, compensation is payable either immediately upon request, or subject
to independent verification of nonperformance by Nokia.
Securities pledged and guarantees for loans on behalf of other compa-
nies of EUR 3 million in 2004 (EUR 33 million in 2003) represent guarantees
relating to payment by certain Networks’ customers under specified loan
facilities between such customers and their creditors. Nokia’s obligations
under such guarantees are released upon the earlier of expiration of the
guarantee or early payment by the customer.
Financing commitments of EUR 56 million in 2004 (EUR 490 million in
2003) are available under loan facilities negotiated with customers of Net-
works. Availability of the amounts is dependent upon the borrower’s con-
tinuing compliance with stated financial and operational covenants and
compliance with other administrative terms of the facility. The loan facilities
are primarily available to fund capital expenditure relating to purchases of
network infrastructure equipment and services and to fund working capital.
The Group has been named as defendant along with certain of its senior
executives in a class action complaint in the United States relating to certain
public statements about its product portfolio and related financial projec-
tions. The Group does not believe that the claim has merit and intends to
vigorously defend itself.
The Group is party to routine litigation incidental to the normal conduct
of business. In the opinion of management the outcome of and liabilities
in excess of what has been provided for related to these or other proceedings,
in the aggregate, are not likely to be material to the financial condition or
results of operations.
As of December 31, 2004, the Group had purchase commitments of EUR
1 236 million (EUR 1 051 million in 2003) relating to inventory purchase
obligations, primarily for purchases in 2005.

30 Nokia in 2004
N ote s to t h e co n s o l i d a te d f i n a n c i a l st a te m e n t s
31. Leasing contractsThe Group leases office, manufacturing and warehouse space under various
non-cancellable operating leases. Certain contracts contain renewal options
for various periods of time.
The future costs for non-cancellable leasing contracts are as follows:
Operatingleases
Leasing payments, EURm
2005 175
2006 137
2007 94
2008 78
2009 70
Thereafter 57
Total 611
Rental expense amounted to EUR 236 million in 2004 (285 million in 2003
and EUR 384 million in 2002).
32. Related party transactionsNokia Pension Foundation is a separate legal entity that manages and
holds in trust the assets for the Group’s Finnish employee benefit plans;
these assets include 0.008% of Nokia’s shares.
At December 31, 2004, the Group had borrowings amounting to EUR 62
million (EUR 64 million in 2003) from Nokia Unterstützungskasse GmbH,
the Group’s German pension fund, which is a separate legal entity.
The Group recorded net rental expense of EUR 2 million in 2004 (EUR 2
million in 2003 and EUR 2 million in 2002) pertaining to a sale-leaseback
transaction with the Nokia Pension Foundation involving certain buildings
and a lease of the underlying land.
There were no loans granted to top management at December 31, 2004
or 2003. See Note 5, Personnel expenses, for officers and directors remu-
nerations.
33. Associated companies
2004 2003 2002EURm EURm EURm
Share of results of associated companies –26 –18 –19
Dividend income 2 3 1
Share of shareholders’ equity
of associated companies 37 18 30
Liabilities to associated companies 3 3 7
34. Notes to cash flow statement
2004 2003 2002
EURm EURm EURm
Adjustments for:
Depreciation and amortization (Note 10) 868 1 138 1 311
(Profit)/loss on sale of property,
plant and equipment and
available-for-sale investments 26 170 –92
Income taxes (Note 12) 1 435 1 699 1 484
Share of results of associated
companies (Note 33) 26 18 19
Minority interest 67 54 52
Financial income and expenses (Note 11) –405 –352 –156
Impairment charges (Note 8) 129 453 245
Premium return –160 – –
Customer financing impairment
charges and reversals – –226 279
Other – –1 9
Adjustments, total 1 986 2 953 3 151
Change in net working capital
(Increase) Decrease in
short-term receivables 385 –207 –16
(Increase) Decrease in inventories –193 –41 243
Increase in interest-free
short-term liabilities 107 54 687
Change in net working capital 299 –194 914
Non–cash investing activities
Acquisition of:
Current available-for-sale investments
in settlement of customer loan – 676 –
Company acquisitions – 18 –
Total – 694 –

Nokia in 2004 31
N ote s to t h e co n s o l i d a te d f i n a n c i a l st a te m e n t s
35. Risk management
General risk management principlesNokia’s overall risk management concept is based on visibility of the key
risks preventing Nokia from reaching its business objectives. This covers
all risk areas; strategic, operational, financial and hazard risks. Risk man-
agement at Nokia is a systematic and pro-active way to analyze, review
and manage all opportunities, threats and risks related to Nokia’s objec-
tives rather than to solely eliminate risks.
The principles documented in Nokia’s Risk Policy and accepted by the
Audit Committee of the Board of Directors require risk management and
its elements to be integrated into business processes. One of the main
principles is that the business or function owner is also the risk owner,
however, it is everyone’s responsibility at Nokia to identify risks preventing
us from reaching our objectives.
Key risks are reported to the business and Group level management to
create assurance on business risks and to enable prioritization of risk
management implementation at Nokia. In addition to general principles
there are specific risk management policies covering, for example, treasury
and customer finance risks.
Financial risksThe key financial targets for Nokia are growth, profitability, operational
efficiency and a strong balance sheet. The objective for the Treasury function
is twofold: to guarantee cost-efficient funding for the Group at all times,
and to identify, evaluate and hedge financial risks in close co-operation
with the business groups. There is a strong focus in Nokia on creating
shareholder value. The Treasury function supports this aim by minimizing
the adverse effects caused by fluctuations in the financial markets on the
profitability of the underlying businesses and by managing the balance
sheet structure of the Group.
Nokia has Treasury Centers in Geneva, Singapore/Beijing and New York/
Sao Paolo, and a Corporate Treasury unit in Espoo. This international organ-
ization enables Nokia to provide the Group companies with financial services
according to local needs and requirements.
The Treasury function is governed by policies approved by top manage-
ment. Treasury Policy provides principles for overall financial risk management
and determines the allocation of responsibilities for financial risk man-
agement in Nokia. Operating Policies cover specific areas such as foreign
exchange risk, interest rate risk, use of derivative financial instruments, as
well as liquidity and credit risk. Nokia is risk averse in its Treasury activities.
Business Groups have detailed Standard Operating Procedures supple-
menting the Treasury Policy in financial risk management related issues.
Market riskForeign exchange risk
Nokia operates globally and is thus exposed to foreign exchange risk arising
from various currency combinations. Foreign currency denominated assets
and liabilities together with expected cash flows from highly probable
purchases and sales give rise to foreign exchange exposures. These trans-
action exposures are managed against various local currencies because of
Nokia’s substantial production and sales outside the Eurozone.
Due to the changes in the business environment, currency combina-
tions may also change within the financial year. The most significant non-
euro sales currencies during the year were US dollar (USD), UK pound sterling
(GBP) and Australian dollar (AUD). In general, depreciation of another currency
relative to the euro has an adverse effect on Nokia’s sales and operating
profit, while appreciation of another currency has a positive effect, with
the exception of Japanese yen (JPY), being the only significant foreign cur-
rency in which Nokia has more purchases than sales.
The following chart shows the break-down by currency of the underlying
net foreign exchange transaction exposure as of December 31, 2004 (in
some of the currencies, especially the US dollar, Nokia has both substantial
sales as well as costs, which have been netted in the chart).
According to the foreign exchange policy guidelines of the Group, mate-
rial transaction foreign exchange exposures are hedged. Exposures are
mainly hedged with derivative financial instruments such as forward foreign
exchange contracts and foreign exchange options. The majority of finan-
cial instruments hedging foreign exchange risk have a duration of less
than a year. The Group does not hedge forecasted foreign currency cash
flows beyond two years.
Nokia uses the Value-at-Risk (‘’VaR’’) methodology to assess the foreign
exchange risk related to the Treasury management of the Group expo-
sures. The VaR figure represents the potential fair value losses for a portfolio
resulting from adverse changes in market factors using a specified time
period and confidence level based on historical data. To correctly take into
account the non-linear price function of certain derivative instruments,
Nokia uses Monte Carlo simulation. Volatilities and correlations are calcu-
lated from a one-year set of daily data. The VaR figures assume that the
forecasted cash flows materialize as expected. The VaR figures for the
Group transaction foreign exchange exposure, including hedging transac-
tions and Treasury exposures for netting and risk management purposes,
with a one-week horizon and 95% confidence level, are shown in table
below.
Transaction foreign exchange position Value-at-Risk (EURm)
VaR 2004 2003
At Dec. 31 12.7 16.7
Average for the year 14 9.3
Range for the year 1.6 –26.9 5.8–16.7
THB 4%
AUD 5%
GBP 17%
Others 17%
JPY 26%
USD 31%

32 Nokia in 2004
N ote s to t h e co n s o l i d ate d f i n a n c i a l st a te m e n t s
Since Nokia has subsidiaries outside the Euro zone, the euro-denomi-
nated value of the shareholders’ equity of Nokia is also exposed to fluctu-
ations in exchange rates. Equity changes caused by movements in foreign
exchange rates are shown as a translation difference in the Group consolida-
tion. Nokia uses, from time to time, foreign exchange contracts and foreign
currency denominated loans to hedge its equity exposure arising from for-
eign net investments.
Interest rate riskThe Group is exposed to interest rate risk either through market value fluctua-
tions of balance sheet items (i.e. price risk) or through changes in interest
income or expenses (i.e. re-investment risk). Interest rate risk mainly arises
through interest-bearing liabilities and assets. Estimated future changes
in cash flows and balance sheet structure also expose the Group to interest
rate risk.
Treasury is responsible for monitoring and managing the interest rate
exposure of the Group. Due to the current balance sheet structure of Nokia,
emphasis is placed on managing the interest rate risk of investments.
Nokia uses the VaR methodology to assess and measure the interest
rate risk in the investment portfolio, which is benchmarked against a one-
year investment horizon. The VaR figure represents the potential fair value
losses for a portfolio resulting from adverse changes in market factors using
a specified time period and confidence level based on historical data. For
interest rate risk VaR, Nokia uses variance-covariance methodology. Vola-
tilities and correlations are calculated from a one-year set of daily data.
The VaR-based interest rate risk figures for an investment portfolio with a
one-week horizon and 95% confidence level are shown in table below.
Treasury investment portfolio Value-at-Risk (EURm)
VaR 2004 2003
At Dec. 31 10.4 9.8
Average for the year 6.3 6.7
Range for the year 3.6–10.8 4.7–11.9
Equity price riskNokia has certain strategic minority investments in publicly traded compa-
nies. These investments are classified as available-for-sale. The fair value
of the equity investments at December 31, 2004 was EUR 7 million (EUR 8
million in 2003).
There are currently no outstanding derivative financial instruments
designated as hedges of these equity investments. The VaR figures for equity
investments, shown in table, have been calculated using the same principles
as for interest rate risk.
Equity investments Value at Risk (EURm)
VaR 2004 2003
At Dec. 31 0.1 0.2
Average for the year 0.2 3.5
Range for the year 0.1–0.3 0.2–9.4
In addition to the listed equity holdings, Nokia invests in private equity
through Nokia Venture Funds. The fair value of these available-for-sale
equity investments at December 31, 2004 was USD 142 million (USD 85 million
in 2003). Nokia is exposed to equity price risk on social security costs relating
to stock compensation plans. Nokia hedges this risk by entering into cash
settled equity swap and option contracts.
Credit riskCustomer Finance Credit Risk
Network operators in some markets sometimes require their suppliers to
arrange or provide term financing in relation to infrastructure projects.
Nokia has maintained a financing policy aimed at close cooperation with
banks, financial institutions and Export Credit Agencies to support selected
customers in their financing of infrastructure investments. Nokia actively
mitigates, market conditions permitting, this exposure by arrangements
with these institutions and investors.
Credit risks related to customer financing are systematically analyzed,
monitored and managed by Nokia’s Customer Finance organization, report-
ing to the Chief Financial Officer. Credit risks are approved and monitored
by Nokia’s Credit Committee along principles defined in the Company’s
credit policy and according to the credit approval process. The Credit Com-
mittee consists of the CFO, Group Controller, Head of Group Treasury and
Head of Nokia Customer Finance.
There were no outstanding loans to customers (EUR 354 million in 2003,
net of allowances and write-offs), while financial guarantees given on behalf
of third parties totaled EUR 3 million (EUR 33 million in 2003). In addition,
we had financing commitments totaling EUR 56 million (EUR 490 million in
2003). Total customer financing (outstanding and committed) stood at EUR
59 million (EUR 877 million in 2003).
The term customer financing portfolio at December 31, 2004 was:
Financing
Outstanding Commitments Totals
Total Portfolio EURm 3 56 59
The term customer financing portfolio at December 31, 2004 mainly
consists of committed customer financing to wireless operator Astelit LLC
in Ukraine, of which none was outstanding.

Nokia in 2004 33
N ote s to t h e co n s o l i d ate d f i n a n c i a l st a te m e n t s
Current available-for-sale investments 1, 2, 3
Fair Unrealized Unrealized
Maturity date less than 12 months value losses gains
2004, EURmGovernments 1 820 – 1Banks 3 927 – 1Corporates 166 – –Asset backed securities – – –
5 913 – 2
Maturity date 12 months or more
2004, EURmGovernments 3 999 –14 4Banks 428 –1 2Corporates 302 – 10Asset backed securities 65 – –
4 794 –15 16
Total
2004, EURmGovernments 5 819 –14 5Banks 4 355 –1 3Corporates 468 – 10Asset backed securities 65 – –
10 707 –15 18
Fair Unrealized Unrealized
Maturity date less than 12 months value losses gains
2003, EURmGovernments 1 058 – 1Banks 5 206 –1 2Corporates 2 165 – 1Asset backed securities – – –
8 430 –2 4
Maturity date 12 months or more
2003 EURmGovernments 1 109 –3 6Banks 264 – 4Corporates 1 115 – 128Asset backed securities 50 – –
2 538 –3 137
Total
2003 EURmGovernments 2 167 –3 7Banks 5 470 –1 6Corporates 3 280 –1 128Asset backed securities 50 – –
10 967 –5 141
EURm 2004 2003
Fixed rate investments 10 429 10 541
Floating rate investments 278 426
Total 10 707 10 967
Financial credit riskFinancial instruments contain an element of risk of the counterparties being
unable to meet their obligations. This risk is measured and monitored by
the Treasury function. The Group minimizes financial credit risk by limiting
its counterparties to a sufficient number of major banks and financial insti-
tutions, as well as through entering into netting arrangements, which
gives the Company the right to offset in the case that the counterparty
would not be able to fulfill the obligations.
Direct credit risk represents the risk of loss resulting from counterparty
default in relation to on-balance sheet products. The fixed income and
money market investment decisions are based on strict creditworthiness
criteria. The outstanding investments are also constantly monitored by
the Treasury. Nokia does not expect the counterparties to default given
their high credit quality.
1 Available-for-sale investments are carried at fair value in 2004 and 2003.
2 Weighted average interest rate for current available-for-sale investments was 3.63%in 2004 and 3.08% in 2003.
3 Included within current available-for-sale investments is EUR 11 million and EUR 31million of restricted cash at December 31, 2004 and 2003, respectively.
34 Nokia in 2004
N ote s to t h e co n s o l i d ate d f i n a n c i a l st a te m e n t s
Notional amounts of derivative financial instruments 1
2004 2003EURm EURm
Foreign exchange forward contracts 2 10 745 10 271
Currency options bought 2 715 2 924
Currency options sold 2 499 2 478
Interest rate swaps – 1 500
Cash settled equity options 3 237 228
Credit default swaps 4 200 –
1 Includes the gross amount of all notional values for contracts that have notyet been settled or cancelled. The amount of notional value outstanding is notnecessarily a measure or indication of market risk, as the exposure of certaincontracts may be offset by that of other contracts.
2 As at December 31, 2004, notional amounts include contracts amounting to EUR 1.6billion used to hedge the shareholders’ equity of foreign subsidiaries (December31, 2003, EUR 3.3 billion).
3 Cash settled equity options can be used to hedge risk relating to incentiveprograms and investment activities.
4 Credit default swaps are used to selectively hedge counterparty risks involved ininvestment activities.
Fair values of derivativesThe net fair values of derivative financial instruments at the balance
sheet date were:
2004 2003
EURm EURm
Derivatives with positive fair value 1:
Forward foreign exchange contracts 2 278 358
Currency options bought 14 59
Cash settled equity options 5 13
Interest rate swaps – 1
Embedded derivatives 3 – 25
Derivatives with negative fair value 1:
Forward foreign exchange contracts 2 –89 –108
Currency options written –11 –35
Credit default swaps –2 –
Embedded derivatives 3 – –8
1 Out of the forward foreign exchange contracts and currency options, fair valueEUR 43 million was designated for hedges of net investment in foreign subsidiariesas at December 31, 2004 (EUR 90 million at December 31, 2003) and reported withintranslation differences.
2 Out of the foreign exchange forward contracts, fair value EUR 91 million wasdesignated for cash flow hedges as at December 31, 2004 (EUR 33 million atDecember 31, 2003) and reported in fair value and other reserves.
3 Embedded derivatives are components of contracts having the characteristics ofderivatives, and thus requiring fair valuing of such components. The change in thefair value is reported in other financial income and expenses.
Liquidity riskNokia guarantees a sufficient liquidity at all times by efficient cash man-
agement and by investing in liquid interest-bearing securities. Due to the
dynamic nature of the underlying business Treasury also aims at main-
taining flexibility in funding by keeping committed and uncommitted
credit lines available. At the end of December 31, 2004, the committed fa-
cility totaled USD 2.0 billion. The committed credit facility is intended to
be used for U.S. and Euro Commercial Paper Programs back up purposes.
The commitment fee on the facility is 0.10% per annum.
The most significant existing funding programs include:
Revolving Credit Facility of USD 2,000 million, maturing in 2008
Local commercial paper program in Finland, totaling EUR 750 million
Euro Commercial Paper (ECP) program, totaling USD 500 million
US Commercial Paper (USCP) program, totaling USD 500 million
None of the above programs have been used to a significant degree in 2004.
Nokia’s international creditworthiness facilitates the efficient use of inter-
national capital and loan markets. The ratings of Nokia from credit rating
agencies have not changed during the year. The ratings as at December 31,
2004 were:
Short-term Standard & Poor’s A-1
Moody’s P-1
Long-term Standard & Poor’s A
Moody’s A1
Hazard riskNokia strives to ensure that all financial, reputation and other losses to
the Group and our customers are minimized through preventive risk man-
agement measures or purchase of insurance. Insurance is purchased for
risks, which cannot be internally managed. Nokia’s Insurance & Risk Fi-
nance function’s objective is to ensure that Group’s hazard risks, whether
related to physical assets (e.g. buildings) or intellectual assets (e.g. Nokia
brand) or potential liabilities (e.g. product liability) are optimally insured.
Nokia purchases both annual insurance policies for specific risks as
well as multi-line and/or multi-year insurance policies, where available.

Nokia in 2004 35
36. Principal Nokia Group companiesat December 31, 2004
Parent Groupholding % majority %
US Nokia Inc. – 100.00
DE Nokia GmbH 100.00 100.00
GB Nokia UK Limited – 100.00
KR Nokia TMC Limited 100.00 100.00
CN Nokia Capitel Telecommunications Ltd – 52.90
NL Nokia Finance International B.V. 100.00 100.00
HU Nokia Komárom Kft 100.00 100.00
BR Nokia do Brazil Technologia Ltda 99.99 100.00
IT Nokia Italia Spa 100.00 100.00
IN Nokia India Ltd 100.00 100.00
CN Dongguan Nokia Mobile Phones Company Ltd – 70.00
CN Beijing Nokia Hang Xing
Telecommunications Systems Co. Ltd – 69.00
Shares in listed companies
Group holding more than 5% Group holding % Group voting %
Nextrom Holding S.A. 79.33 86.21
Under a binding sale agreement signed on December 31, 2004, Nokia will
sell its entire holding in Nextrom Holding S.A. and the remaining loan
agreement to Knill Group. The transaction is expected to be completed
during the first quarter of 2005. The negative impact of EUR 12 million from
the divestiture was recognized in other operating expenses in 2004.
Associated companies
Symbian Limited 47.90 47.90
A complete list of subsidiaries and associated companies is included in
Nokia’s Statutory Accounts.
N ote s to t h e co n s o l i d a te d f i n a n c i a l st a te m e n t s

36 Nokia in 2004
P a re nt co m p a ny
Cash flow statements, FASProfit and loss accounts, FAS
2004 2003Financial year ended Dec. 31 Notes EURm EURm
Net sales 22 888 22 402
Cost of sales –15 162 –13 704
Gross margin 7 726 8 698
Selling and marketing expenses –982 –1 058
Research and development expenses –3 587 –3 496
Administrative expenses –666 –762
Other operating expenses –63 –79
Other operating income 124 392
Operating profit 2, 3 2 552 3 695
Financial income and expenses
Income from long-term investments
Dividend income from Group companies 418 106
Dividend income from other companies 23 23
Interest income from Group companies 6 15
Interest income from other companies – 21
Other interest and financial income
Interest income from Group companies 169 145
Interest income from other companies – 1
Other financial income from other companies 21 42
Exchange gains and losses 117 144
Interest expenses and other financial expenses
Interest expenses to Group companies –65 –26
Interest expenses to other companies –2 –9
Other financial expenses –10 –19
Financial income and expenses, total 677 443
Profit before extraordinary items and taxes 3 229 4 138
Extraordinary items
Group contributions 12 93
Extraordinary items, total 12 93
Profit before taxes 3 241 4 231
Income taxes
for the year –826 –1 132
from previous years 19 –29
Net profit 2 434 3 070
See Notes to the financial statements of the parent company.
2004 2003Financial year ended Dec. 31 Notes EURm EURm
Cash flow from operating activities
Net profit 2 434 3 070
Adjustments, total 13 539 1 041
Net profit before change in net working capital 2 973 4 111
Change in net working capital 13 679 –660
Cash generated from operations 3 652 3 451
Interest received 175 167
Interest paid –70 –37
Other financial income and expenses 133 127
Income taxes paid –928 –1 095
Cash flow before extraordinary items 2 962 2 613
Extraordinary income and expenses 93 119
Net cash from operating activities 3 055 2 732
Cash flow from investing activities
Investments in shares –398 –235
Additions to capitalized development costs –101 –218
Capital expenditures –39 –36
Proceeds from sale of shares 346 1 024
Long-term loans made to customers –1 –97
Proceeds from repayment and sale
of long term loans receivable 365 315
Proceeds from other long-term receivables 13 163
Payments of short-term receivables –2 880 –1 420
Dividends received 366 123
Net cash used in investing activities –2 329 –381
Cash flow from financing activities
Proceeds from share issue – 23
Proceeds from borrowings 3 333 247
Repayment of borrowings –23 –64
Purchase of treasury shares –2 660 –1 351
Dividends paid –1 399 –1 340
Support to the Foundation of Nokia Corporation –5 –
Net cash used in financing activities –754 –2 485
Net decrease in cash and cash equivalents –28 –134
Cash and cash equivalents at beginning of period 103 237
Cash and cash equivalents at end of period 75 103

Nokia in 2004 37
P a re nt co m p a ny
Balance sheets, FAS
20 234 18 583
2004 2003Dec. 31 Notes EURm EURm
ASSETS
Fixed assets and other non-current assets
Intangible assets 4
Capitalized development costs 328 619
Intangible rights 59 52
387 671
Tangible assets 5 – –
Investments
Investments in subsidiaries 6 3 597 3 540
Investments in associated companies 6 5 4
Long-term loan receivables from Group companies 140 152
Long-term loan receivables from other companies 38 394
Other non-current assets 7 7 17
3 787 4 107
Current assets
Inventories and work in progress
Raw materials and supplies 102 81
Work in progress 84 80
Finished goods 284 237
Prepaid inventories 2 7
472 405
Receivables
Trade debtors from Group companies 633 1 895
Trade debtors from other companies 1 523 1 046
Short-term loan receivables from Group companies 12 704 9 886
Short-term loan receivables from other companies 6 13
Prepaid expenses and accrued income from Group companies 71 3
Prepaid expenses and accrued income from other companies 576 454
15 513 13 297
Short-term investments – 31
Bank and cash 75 72
20 234 18 583
See Notes to the financial statements of the parent company.
2004 2 003Dec. 31 Notes EURm EURm
SHAREHOLDERS’ EQUITY AND LIABILITIES
Shareholders’ equity 8
Share capital 280 288
Share issue premium 2 230 2 222
Treasury shares 8 –2 012 –1 351
Retained earnings 9 7 729 8 062
Net profit for the year 8, 9 2 434 3 070
10 661 12 291
Liabilities
Short-term liabilities
Current finance liabilities from Group companies 6 436 3 100
Current finance liabilities from other companies 2 65
Advance payments from other companies 133 4
Trade creditors to Group companies 634 767
Trade creditors to other companies 902 923
Accrued expenses and prepaid income to Group companies 76 16
Accrued expenses and prepaid income to other companies 1 390 1 417
9 573 6 292

38 Nokia in 2004
N o te s to t h e f i n a n c i a l s t a te m e nt s o f t h e p a re nt co m p a n y
1. Accounting principles
The Parent company Financial Statements are prepared according to Finnish
Accounting Standards (FAS).
See Note 1 to Notes to the consolidated financial statements.
2. Personnel expenses
2004 2003EURm EURm
Wages and salaries 1 172 1 050
Pension expenses 162 149
Other social expenses 80 117
Personnel expenses as per profit and loss account 1 414 1 316
Remuneration of the members of the Board of Directors,
the Chief Executive Officer and the President * 6 5
* Salaries include incentives 3 2
Pension commitments for the management:
For the Chief Executive Officer and the President of the Parent Company
the retirement age is 60 years. There were also three other Group Executive
Board Members whose retirement age is 60 years as of December 31, 2004.
There is also one other Member, following his arragement from a previous
employer, who has a retirement benefit of 65% of his pensionable salary
beginning at age 62 with early retirement possible at age 55 with reduc-
tion in benefits. Nokia does not offer any similar benefits to any other
members of the 2004 Group Executive Board.
Personnel average 2004 2003
Production 5 029 4 839
Marketing 1 609 1 577
R&D 12 861 12 553
Administration 3 292 3 481
22 791 22 450
Personnel, Dec. 31 2004 2003
22 990 22 132
3. Depreciation and amortization
2004 2003EURm EURm
Depreciation and amortization by asset class category
Intangible assets
Capitalized development costs 290 327
Intangible rights 31 42
Tangible assets – –
Total 321 369
Depreciation and amortization by function
R&D 298 332
Production – –
Selling, marketing and administration 23 37
Total 321 369
4. Intangible assets
2004 2003
EURm EURm
Capitalized development costs
Acquisition cost Jan. 1 1 416 1 706
Additions 101 201
Disposals –123 –491
Accumulated amortization Dec. 31 –1 066 –797
Net carrying amount Dec. 31 328 619
Intangible rights
Acquisition cost Jan. 1 256 225
Additions 40 36
Disposals –4 –5
Accumulated amortization Dec. 31 –233 –204
Net carrying amount Dec. 31 59 52
Other intangible assets
Acquisition cost Jan. 1 3 50
Additions – –
Disposals – –47
Accumulated amortization Dec. 31 –3 –3
Net carrying amount Dec. 31 – –

Nokia in 2004 39
N o te s to t h e f i n a n c i a l s t a te m e nt s o f t h e p a re nt co m p a n y
5. Tangible assetsAt the end of 2004 and 2003 the parent company had no tangible assets.
These assets were leased from Nokia Asset Management Oy, a company
wholly owned by Nokia Oyj.
6. Investments
2004 2003
EURm EURm
Investments in subsidiaries
Acquisition cost Jan. 1 3 540 3 519
Additions 68 41
Disposals –11 –20
Net carrying amount Dec. 31 3 597 3 540
Investments in associated companies
Acquisition cost Jan. 1 4 5
Additions 1 –
Disposals – –1
Net carrying amount Dec. 31 5 4
7. Other non-current assets
2004 2003EURm EURm
Investments in other shares
Acquisition cost Jan. 1 17 17
Additions 334 231
Disposals –344 –238
Net carrying amount Dec. 31 7 10
Other investments – 7
7 17
At the balance sheet date, the fair value of investments in listed companies
was EUR 0 million (EUR 1 million in 2003).

40 Nokia in 2004
N ote s to t h e f i n a n c i a l st a te m e n t s of t h e p a re n t co m p a ny
8. Shareholders’ equity
Share Share issue Treasury RetainedParent Company, EURm capital premium shares earnings Total
Balance at Dec. 31, 2002 287 2 182 – 9 401 11 870
Share issue 1 40 41
Acquisitions of treasury shares –1 351 –1 351
Dividend –1 339 –1 339
Net profit 3 070 3 070
Balance at Dec. 31, 2003 288 2 222 –1 351 11 132 12 291
Share issue –
Cancellation of treasury shares –8 8 1 999 –1 999 –
Acquisitions of treasury shares –2 660 –2 660
Dividend –1 399 –1 399
Support to the Foundation of Nokia Corporation –5 –5
Net profit 2 434 2 434
Balance at Dec. 31, 2004 280 2 230 –2 012 10 163 10 661
9. Distributable earnings
2004 2003
EURm EURm
Retained earnings from previous years 7 729 8 062
Net profit for the year 2 434 3 070
Retained earnings, total 10 163 11 132
Treasury shares –2 012 –1 351
Distributable earnings, Dec. 31 8 151 9 781
10. Commitments and contingencies
2004 2003
EURm EURm
Collateral for own commitments
Mortgages – –
Collateral given on behalf of other companies
Assets pledged – 28
Contingent liabilities on behalf of Group companies
Guarantees for loans 173 112
Leasing guarantees 246 350
Other guarantees 244 186
Contingent liabilities on behalf of other companies
Guarantees for loans 3 5
Other guarentees 1 –
11. Leasing contractsAt December 31, 2004 the leasing contracts of the Parent Company amounted
to EUR 491 million (EUR 936 million in 2003), of which EUR 454 million in
2004 relate to Group internal agreements. EUR 473 million will expire in
2005 (EUR 472 million in 2004).
12. Loans granted to top managementThere were no loans granted to top management at December 31, 2004.

Nokia in 2004 41
N ote s to t h e f i n a n c i a l st a te m e n t s of t h e p a re n t co m p a ny
13. Notes to cash flow statements
2004 2003EURm EURm
Adjustments for:
Depreciation 321 339
Income taxes 807 1 161
Financial income and expenses –677 –443
Impairment charge 102 374
Other operating income and expenses –14 –390
Adjustments, total 539 1 041
Change in net working capital
Short-term trade receivables,
increase (–), decrease (+) 682 –564
Inventories, increase (–), decrease (+) –67 181
Interest-free short-term liabilities,
increase (+), decrease (–) 64 –277
Change in net working capital 679 –660
Non-cash investing activities
Acquisition of:
Current available-for-sale investments
in settlement of customer loan – 676
14. Principal Nokia Group companieson December 31, 2004See Note 36 to Notes to the consolidated financial statements.
15. Nokia shares and shareholdersSee Nokia shares and shareholders p. 42–48.

42 Nokia in 2004
Share capital and shares, Dec. 31, 2004 1 2004 2003 2002 2001 2000
Share capital, EURm 280 288 287 284 282
Shares (1 000, par value EUR 0.06) 4 663 761 4 796 292 4 787 907 4 737 530 4 696 213
Shares owned by the Group (1 000) 176 820 96 024 1 145 1 228 4 080
Number of shares excluding shares owned
by the Group (1 000) 4 486 941 4 700 268 4 786 762 4 736 302 4 692 133
Average number of shares excluding shares owned
by the Group during the year (1 000), basic 4 593 196 4 761 121 4 751 110 4 702 852 4 673 162
Average number of shares excluding shares owned
by the Group during the year (1 000), diluted 4 600 337 4 761 160 4 788 042 4 787 219 4 792 980
Number of registered shareholders 2 142 095 133 991 129 508 116 352 94 500
1 Figures have been recalculated to reflect the par value of EUR 0.06 of the share.
2 Each account operator is included in the figure as only one registered shareholder.
N o k i a s h a re s a n d s h a re h o l d e r s
Shares and share capitalNokia has one class of shares. Each Nokia share entitles the holder to one
(1) vote at General Meetings of Nokia. With effect from April 10, 2000, the
par value of the share is EUR 0.06.
The minimum share capital stipulated in the articles of association is
EUR 170 million and the maximum share capital EUR 680 million. The share
capital may be increased or reduced within these limits without amending
the articles of association.
On December 31, 2004, the share capital of Nokia Corporation was EUR
279 825 678.00 and the total number of shares was 4 663 761 300.
On December 31, 2004, the total number of shares included 176 819 877
shares owned by the Group companies with an aggregate par value of EUR
10 609 192.62 representing approximately 3.79% of the total number of
shares and votes.
Key Ratios, Dec. 31, 2004, IFRS (calculation see page 51) 2004 2003 2002 2001 2000
Earnings per share from net profit, EUR
Earnings per share, basic 0.70 0.75 0.71 0.47 0.84
Earnings per share, diluted 0.70 0.75 0.71 0.46 0.82
P/E ratio 16.60 18.28 21.34 61.60 56.50
(Nominal) dividend per share, EUR 0.33 * 0.30 0.28 0.27 0.28
Total dividends paid, EURm 1 1 539 * 1 439 1 341 1 279 1 315
Payout ratio 0.47 0.40 0.39 0.57 0.33
Dividend yield, % 2.8 2.2 1.8 0.9 0.6
Shareholders’ equity per share, EUR 3.17 3.22 2.98 2.58 2.30
Market capitalization, EURm 2 52 138 65 757 72 537 137 163 222 876
* Board’s proposal.
1 Calculated for all the shares of the company as of the applicable year-end.
2 Shares owned by the Group companies are not included.
Splits of the par value of the Nokia share Par value before Split ratio Par value after Effective date
1986 FIM 100 (EUR 16.82) 5:1 FIM 20 (EUR 3.36) December 31, 1986
1995 FIM 20 (EUR 3.36) 4:1 FIM 5 (EUR 0.84) April 24, 1995
1998 FIM 5 (EUR 0.84) 2:1 FIM 2.5 (EUR 0.42) April 16, 1998
1999 FIM 2.5 (EUR 0.42) 2:1 EUR 0.24 1 April 12, 1999
2000 EUR 0.24 4:1 EUR 0.06 April 10, 2000
1 At the same time with a bonus issue of EUR 0.03 per each share of a par value of EUR 0.24.

Nokia in 2004 43
AuthorizationsAuthorization to increase the share capital
The Board of Directors had been authorized by Nokia shareholders at the
Annual General Meeting held on March 27, 2003, to decide on an increase of
the share capital by a maximum of EUR 57 000 000 offering a maximum of
950 000 000 new shares. In 2004, the Board of Directors did not increase
the share capital on the basis of this authorization. The authorization expired
on March 27, 2004.
At the Annual General Meeting held on March 25, 2004, Nokia shareholders
authorized the Board of Directors to decide on an increase of the share
capital by a maximum of EUR 55 500 000, of which a maximum of EUR 3 000 000
may result from incentive plans, within one year from the resolution of the
Annual General Meeting. The increase of the share capital may consist of
one or more issues offering a maximum of 925 000 000 new shares with a
par value of EUR 0.06. The share capital may be increased in deviation from
the shareholders’ pre-emptive rights for share subscription provided that
from the company’s perspective important financial grounds exist such as
financing or carrying out of an acquisition or another arrangement and
granting incentives to selected members of the personnel. In 2004, the
Board of Directors did not increase the share capital on the basis of this
authorization. The authorization is effective until March 25, 2005.
At the end of 2004, the Board of Directors had no other authorizations
to issue shares, convertible bonds, warrants or stock options.
Other authorizations
The Board of Directors had been authorized by Nokia shareholders at the
Annual General Meeting held on March 27, 2003 to decide to repurchase a
maximum of 225 million Nokia shares. In 2004 Nokia repurchased 38 057 700
Nokia shares on the basis of this authorization.
At the Annual General Meeting held on March 25, 2004 Nokia shareholders
authorized the Board of Directors to repurchase a maximum of 230 million
Nokia shares, representing less than 5% of total shares outstanding, and to
resolve on the disposal of a maximum of 230 million Nokia shares. In 2004,
a total of 176 000 000 Nokia shares were repurchased under the buy-back
authorization, as a result of which the unused authorization amounted to
54 000 000 shares on December 31, 2004. No shares were disposed of in
2004 under the respective authorization. The shares may be repurchased
under the buy-back authorization in order to carry out the company’s
stock repurchase plan as a means to develop the capital structure of the
company, to finance or carry out acquisitions or other arrangements, to
grant incentives to selected members of the personnel or in connection
with these, to be transferred in other ways, or to be cancelled. The authoriza-
tion to dispose of the shares may be carried out pursuant to terms deter-
mined by the Board in connection with acquisitions or other arrangements
or for incentive purposes to selected members of the personnel. The Board
may resolve to dispose the shares in another proportion than that of the
shareholders’ pre-emptive rights to the company’s shares, provided that
from the company’s perspective important financial grounds exist for such
disposal. These authorizations are effective until March 25, 2005.
Nokia’s equity based incentive plansStock option plans
The table “Outstanding stock option plans, Dec. 31, 2004” depicts the main
features of outstanding stock option plans, which may result in an in-
crease of our share capital. The increase in share capital resulted by these
stock options is the number of shares to be issued times the par value of
each share. The plans have been approved by the Annual General Meetings in
the year of the launch of the plan. Shares subscribed for pursuant to the
stock options will entitle to dividend for the financial year in which the
subscription occurs. Other shareholder rights will commence on the date
on which the shares subscribed for are registered with the Finnish Trade
Register.
Pursuant to the stock options issued, an aggregate maximum number of
140 379 459 new shares may be subscribed for representing EUR 8 422 767.54
of the share capital and approximately 3.0% of the total number of votes
on December 31, 2004. During 2004 the exercise of 1 260 options resulted
in the issuance of 5 040 new shares and the increase of the share capital of
Nokia Corporation with EUR 302.40.
There were no other stock options and no convertible bonds outstanding
as of December 31, 2004, the exercise of which would result in an increase
of the share capital of the parent company.
In addition to above, Nokia has minor stock option plans for Nokia
employees in the U.S. and Canada which do not result in an increase of the
share capital of Nokia Corporation and in which holders receive Nokia ADSs
(American Depositary Shares). On the basis of these stock option plans
Nokia had granted 2 577 857 stock options on December 31, 2004. Each stock
option entitles the holder to receive one Nokia ADS. The average exercise
price of stock options under these plans is USD 22.95. These stock options
are included in the table “Options outstanding by range of exercise price,
Dec. 31, 2004”.
Performance shares
In 2004, we introduced performance shares as the main element to our
broad-based equity compensation program, as approved by the Board of
Directors, to further emphasize the performance element in employees’
long-term incentives. As part of this change, the number of stock options
to be granted was significantly reduced as compared to 2003.
A total number of 3.9 million Performance Share Units were granted to
a wide number of selected employees on many levels of the organization
in 2004. Performance Share Units represent a commitment by the company
to deliver Nokia shares to employees at a future point in time, subject to
the company’s fulfillment of pre-defined performance criteria. No Perform-
ance Share Units will vest unless the company performance reaches at
least one of the threshold levels measured by two pre-defined perform-
ance criteria: the company’s Average Annual Net Sales Growth and EPS
Growth (basic) for 2004 to 2007. If the required performance level is achieved,
the first payout will take place in 2006. The second and final payout, if any,
will be in 2008.
Both the EPS and Average Annual Net Sales Growth criteria have an
equal weight of 50%. The initial threshold for the Average Annual Net
Sales Growth criteria is 4% resulting in the vesting of up to 1.95 million
performance shares. Similarly, the first threshold for the annual EPS
Growth criteria is EUR 0.84 in 2007 resulting in the vesting of up to 1.95
million performance shares. The maximum performance threshold for Aver-
age Annual Net Sales Growth criteria is 16% resulting in the vesting of up
to 7.8 million performance shares. Similarly, the maximum performance
for the annual EPS Growth criteria is EUR 1.18 in 2007 resulting in the vest-
ing of up to 7.8 million performance shares.
The maximum performance level for both criteria will result in the vest-
ing of the maximum of 15.6 million performance shares. For performance
N o k i a s h a re s a n d s h a re h o l d e r s

44 Nokia in 2004
between the threshold and maximum performance levels the payout follows a line-
ar scale. Performance exceeding the maximum criteria does not increase the
number of shares vesting.
The company will determine later the method by which the shares are ob-
tained for delivery, which may also include cash settlement. Until the shares are
transferred and delivered, the recipients will not have any shareholder rights,
such as voting or dividend rights associated with respect to the Performance
Share Units.
Restricted shares
In 2004, we granted a total of 1.9 million restricted shares to recruit,
retain, reward and motivate selected high potential employees,
who are critical to the future success of Nokia. The restricted shares
granted during 2004 will vest in October 2007, after which time the
shares will be transferred and delivered to the recipients. Until the
shares are transferred and delivered, the recipients will not have any
shareholder rights, such as voting or dividend rights associated with
these restricted shares.
Vesting status (asPlan Total Number of % of total number Exercise Exercise
(Year of plan participants (Sub) of stock options Exercise periods price price Splitlaunch) size (approx.) category outstanding) Starting Ending /option /share ratio
1999 1 1999A Expired Apr. 1, 2001 Dec. 31, 2004 67.55 EUR 16.89 EUR 4:1
1999B Expired Apr. 1, 2002 Dec. 31, 2004 225.12 EUR 56.28 EUR 4:1
1999C Expired Apr. 1, 2003 Dec. 31, 2004 116.48 EUR 29.12 EUR 4:1
97 693 000 16 000
2001 2, 3 2001A+B 81.25 Jul. 1, 2002 Dec. 31, 2006 36.75 EUR 36.75 EUR 1:1
2001C3Q/01 75.00 Oct. 1, 2002 Dec. 31, 2006 20.61 EUR 20.61 EUR 1:1
2001C4Q/01 68.75 Jan. 1, 2003 Dec. 31, 2006 26.67 EUR 26.67 EUR 1:1
2001C1Q/02 62.50 Apr. 1, 2003 Dec. 31, 2007 26.06 EUR 26.06 EUR 1:1
2001C3Q/02 50.00 Oct. 1, 2003 Dec. 31, 2007 12.99 EUR 12.99 EUR 1:1
2001C4Q/02 43.75 Jan. 1, 2004 Dec. 31, 2007 16.86 EUR 16.86 EUR 1:1
2002A+B 56.25 Jul. 1, 2003 Dec. 31, 2007 17.89 EUR 17.89 EUR 1:1
104 326 000 31 000
2003 3 2003 2Q 31.25 Jul. 1, 2004 Dec. 31, 2008 14.95 EUR 14.95 EUR 1:1
2003 3Q 25.00 Oct. 1, 2004 Dec. 31, 2008 12.71 EUR 12.71 EUR 1:1
2003 4Q 0.00 Jan. 3, 2005 Dec. 31, 2008 15.05 EUR 15.05 EUR 1:1
2004 2Q 0.00 Apr. 1, 2005 Dec. 31, 2009 11.79 EUR 11.79 EUR 1:1
2004 3Q 0.00 Oct. 3, 2005 Dec. 31, 2009 9.44 EUR 9.44 EUR 1:1
36 053 000 22 000
Outstanding stock option plans, Dec. 31, 2004
1 Figures have been recalculated to reflect the par value of EUR 0.06 of the shares.
2 The stock options under the 2001 plan are listed on the Helsinki Exchanges.
3 Our 2001 and 2003 stock option plans have a vesting schedule with a 25%vesting 1 year after grant, and quarterly vesting thereafter, each representing6.25% of the total grant. The grants vest fully in 4 years.
N o k i a s h a re s a n d s h a re h o l d e r s

Nokia in 2004 45
Weightedaverageexercise
Number priceof shares EUR
Shares under option at Dec. 31, 2001 227 999 753 25.71
Granted 1 51 127 314 17.96
Exercised 51 586 807 3.61
Forfeited 6 097 025 33.51
Shares under option at Dec. 31, 2002 221 443 235 28.81
Granted 1 31 098 505 14.94
Exercised 7 700 791 3.97
Forfeited 5 847 332 25.23
Shares under option at Dec. 31, 2003 238 993 617 27.90
Granted 7 172 424 11.88
Exercised 781 338 12.85
Forfeited 4 733 995 19.55
Expired 97 693 392 33.99
Shares under option at Dec. 31, 2004 142 957 316 23.29Options exercisable at Dec. 31, 2002 (shares) 107 721 842 27.92
Options exercisable at Dec. 31, 2003 (shares) 148 150 370 31.88
Options exercisable at Dec. 31, 2004 (shares) 83 667 122 26.18
1 Includes options converted in acquisitions.
Options outstanding by range of exercise price, Dec. 31, 2004
Options outstanding Vested options outstanding
Weighted Weighted Weightedaverage average average
Exercise remaining exercise exerciseprices Number of contractual price Number of price
EUR shares life in years EUR of shares EUR
0.28 – 14.72 8 566 058 3.50 11.26 1 524 533 8.72
14.95 28 912 535 2.30 14.95 9 027 050 14.95
14.97 – 17.29 323 635 2.40 15.70 98 242 16.58
17.89 46 657 996 1.57 17.89 26 387 016 17.89
18.18 – 26.67 19 171 279 1.46 27.61 14 181 913 26.49
28.87 – 36.15 139 708 5.08 33.87 139 613 33.87
36.75 38 980 544 1.46 36.75 32 103 194 36.75
38.09 – 56.28 205 561 3.95 39.54 205 561 39.54
142 957 316 83 667 122
N o k i a s h a re s a n d s h a re h o l d e r s
Information relating to stock options during 2004, 2003and 2002

46 Nokia in 2004
N o k i a s h a re s a n d s h a re h o l d e r s
Share and bonus issues 1999–2004Subscription Number of Net New share
price or amount new shares Date of proceeds capitalYear Type of Issue of bonus issue EUR (1 000) payment EURm EURm
1999 Nokia Stock Option Plan 1994 0.98 12 238 1999 12.03 0.73
Nokia Stock Option Plan 1995 1.77 18 602 1999 32.85 1.12
Nokia Stock Option Plan 1997 3.23 33 456 1999 107.97 2.01
Bonus Issue 0.01 1999 36.05
Share issue to stockholders
of Rooftop Communications Corporation 20.04 2 118 1999 42.45 0.13
Total 66 414 195.30 40.04
2000 Nokia Stock Option Plan 1995 1.77 22 011 2000 38.87 1.32
Nokia Stock Option Plan 1997 3.23 10 117 2000 32.65 0.61
Share issue to stockholders
of Network Alchemy, Inc. 49.91 6 112 2000 305.06 0.37
Share issue to stockholders
of DiscoveryCom, Inc. 45.98 3 909 2000 179.75 0.23
Total 42 149 556.33 2.53
2001 Nokia Stock Option Plan 1995 1.77 1 682 2001 2.97 0.10
Nokia Stock Option Plan 1997 3.23 20 993 2001 67.81 1.26
Nokia Stock Option Plan 1999 16.89 382 2001 6.46 0.02
Share issue to stockholders
of Amber Networks, Inc. 20.77 18 329 2001 380.72 1.10
Total 41 386 457.96 2.48
2002 Nokia Stock Option Plan 1997 3.23 50 357 2002 162.50 3.02
Nokia Stock Option Plan 1999 16.89 20 2002 0.33 0.00
Total 50 377 162.83 3.02
2003 Nokia Stock Option Plan 1997 3.23 7 160 2003 23.11 0.43
Share issue to stockholders
of Eizel Technologies Inc. 14.76 1 225 2003 18.08 0.07
Total 8 385 41.19 0.50
2004 Nokia Stock Option Plan 1999 16.89 5 2004 0.09 0.00
Total 5 0.09 0.00
Reductions of share capital Number Amount of Amount of Amount ofof affected reduction of the reduction of the reduction of the
(1 000, par value share capital restricted capital retained earningsType of reduction Year EUR 0.06) EURm EURm EURm
Cancellation of shares 2001 69 0.004 – –
Cancellation of shares 2004 132 536 7.95 – –

Nokia in 2004 47
N o k i a s h a re s a n d s h a re h o l d e r s
Largest shareholders registered in Finland, Dec. 31, 2004
(excluding nominee registered shares Total number of shares % of all the sharesand shares owned by Nokia Corporation 1) (1 000) and voting rights
Svenska Litteratursällskapet i Finland r f 20 611 0.44
Sigrid Jusélius Foundation 15 500 0.33
BNP Arbitrage 15 316 0.33
Ilmarinen Mutual Pension Insurance Company 10 787 0.23
Varma Mutual Pension Insurance Company 8 000 0.17
The State Pension Fund 7 900 0.17
The Local Government Pensions Institution 7 480 0.16
The Finnish Cultural Foundation 6 411 0.14
Nordea Bank Finland Plc 5 470 0.12
Finnish National Fund for Research an developement (SITRA) 4 885 0.10
1 Nokia Corporation owned 176 000 000 Nokia shares as of December 31, 2004.
Share turnover (all stock exchanges) 1
2004 2003 2002 2001 2000
Share turnover (1 000) 14 091 430 11 788 172 12 926 683 11 457 748 7 827 428
Total number of shares (1 000) 4 663 761 4 796 282 4 787 907 4 737 530 4 696 213
% of total number of shares 302 246 270 242 167
Share prices, EUR (Helsinki Exchanges) 1
2004 2003 2002 2001 2000
Low/high 8.97/18.79 11.44/16.16 11.10/29.45 14.35/46.50 35.81/64.88
Average 2 12.84 14.12 18.13 24.57 51.09
Year-end 11.62 13.71 15.15 28.96 47.50
Share prices, USD (New York Stock Exchange) 2
2004 2003 2002 2001 2000
ADS
Low/high 11.03/23.22 12.67/18.45 10.76/26.90 12.95/44.69 29.44/61.88
Average 2 15.96 15.99 16.88 24.84 47.36
Year-end 15.67 17.00 15.50 24.53 43.50
1 Figures have been recalculated to reflect the par value of EUR 0.06 of the share.
2 Calculated by weighing average price with daily volumes.
Shareholders, December 31, 2004Shareholders registered in Finland represent 13.37% and shareholders
registered in the name of a nominee represent 86.63% of the total number
of shares of Nokia Corporation. The number of registered shareholders
was 142 095 on December 31, 2004. Each account operator (23) is included
in this figure as only one registered shareholder.
Nominee registered shareholders include holders of American Deposi-
tary Receipts (ADR) and Svenska Depåbevis (SDB). As of December 31, 2004
ADRs represented 24.51% and SDBs 3.39% of the total number of shares in
Nokia.

48 Nokia in 2004
Shares and stock options owned by the membersof the Board of Directors and the Group Executive BoardMembers of the Board of Directors and the Group Executive Board owned on
December 31, 2004 an aggregate of 1 524 824 shares representing approxi-
mately 0.03% of the aggregate number of shares and voting rights, as well
as stock options, which, if exercised in full, would be exercisable for 7 652 500
shares representing approximately 0.16% of the total number of shares
and voting rights on December 31, 2004.
N o k i a s h a re s a n d s h a re h o l d e r s
1 Please note that the breakdown covers only shareholders registered in Finland,and each account operator (23) is included in the number of shareholders as onlyone registered shareholder. Due to this, the breakdown is not illustrative to theentire shareholder base of Nokia.
By nationality, % Shares
Non-Finnish shareholders 86.63
Finnish shareholders 13.37
Total 100.00
By shareholder category (Finnish shareholders), % Shares
Corporations 4.50
Households 4.47
Financial and insurance institutions 0.94
Non-profit organizations 2.20
General government 1.26
Total 13.37
Breakdown of share ownership, Dec. 31, 2004 1
Number of % of Total number % of AverageBy number of shares owned shareholders shareholders of shares share capital holding
1–100 46 652 32.83 2 863 238 0.06 0.06
101–1 000 66 122 46.53 26 865 209 0.57 0.57
1 001–10 000 24 629 17.33 76 491 591 1.64 1.64
10 001–100 000 4 282 3.01 111 238 749 2.39 2.39
100 001– 500 000 318 0.22 63 734 744 1.37 1.37
500 001–1 000 000 41 0.03 29 160 236 0.63 0.63
1 000 001–5 000 000 34 0.02 71 629 263 1.53 1.53
Over 5 000 000 17 0.01 4 281 778 270 91.81 91.81
Total 142 095 100.00 4 663 761 300 100.00 100.00

Nokia in 2004 49
N o k i a 2 0 0 0 – 2 0 0 4 , I F R S
2004 2003 2002 2001 2000
Profit and loss account, EURm
Net sales 29 267 29 455 30 016 31 191 30 376
Cost and expenses –24 937 –24 444 –25 236 –27 829 –24 600
Operating profit 4 330 5 011 4 780 3 362 5 776
Share of results of associated companies –26 –18 –19 –12 –16
Financial income and expenses 405 352 156 125 102
Profit before tax and minority interests 4 709 5 345 4 917 3 475 5 862
Tax –1 435 –1 699 –1 484 –1 192 –1 784
Minority interests –67 –54 –52 –83 –140
Net profit 3 207 3 592 3 381 2 200 3 938
Balance sheet items, EURm
Fixed assets and other non-current assets 3 161 3 837 5 742 6 912 6 388
Current assets 19 508 20 083 17 585 15 515 13 502
Inventories 1 305 1 169 1 277 1 788 2 263
Accounts receivable and prepaid expenses 6 406 6 802 6 957 7 602 7 056
Available-for-sale investments 255 816 – – –
Total cash and other liquid assets 11 542 11 296 9 351 6 125 4 183
Shareholders’ equity 14 238 15 148 14 281 12 205 10 808
Minority shareholders’ interests 168 164 173 196 177
Long-term liabilities 294 328 461 460 311
Long-term interest-bearing liabilities 19 20 187 207 173
Deferred tax liabilities 179 241 207 177 69
Other long-term liabilities 96 67 67 76 69
Current liabilities 7 969 8 280 8 412 9 566 8 594
Short-term borrowings 215 387 377 831 1 069
Current portion of long-term loans – 84 – – 47
Accounts payable 2 669 2 919 2 954 3 074 2 814
Accrued expenses and provisions 5 085 4 890 5 081 5 661 4 664
Total assets 22 669 23 920 23 327 22 427 19 890

50 Nokia in 2004
N o k i a 2 0 0 0 – 2 0 0 4 , I F R S
Key ratios and economic indicators 2004 2003 2002 2001 2000
Net sales, EURm 29 267 29 455 30 016 31 191 30 376
Change, % –0.6 –1.9 –3.8 2.7 53.6
Exports and foreign subsidiaries, EURm 28 916 29 108 29 663 30 738 29 882
Salaries and social expenses, EURm 3 430 3 026 3 140 3 235 2 888
Operating profit, EURm 4 330 5 011 4 780 3 362 5 776
% of net sales 14.8 17.0 15.9 10.8 19
Financial income and expenses, EURm 405 352 156 125 102
% of net sales 1.4 1.2 0.5 0.4 0.3
Profit before tax and minority interests, EURm 4 709 5 345 4 917 3 475 5 862
% of net sales 16.1 18.1 16.4 11.1 19.3
Profit from continuing operations, EURm 3 207 3 592 3 381 2 200 3 938
% of net sales 11.0 12.2 11.3 7.1 13.0
Taxes, EURm 1 435 1 699 1 484 1 192 1 784
Dividends, EURm 1 539 * 1 439 1 340 1 279 1 315
Capital expenditure, EURm 548 432 432 1 041 1 580
% of net sales 1.9 1.5 1.4 3.3 5.2
Gross investments * *, EURm 1 197 1 013 966 2 149 3 095
% of net sales 4.1 3.4 3.2 6.9 10.2
R&D expenditure, EURm 3 733 3 760 3 052 2 985 2 584
% of net sales 12.8 12.8 10.2 9.6 8.5
Average personnel 53 511 51 605 52 714 57 716 58 708
Non-interest bearing liabilities, EURm 8 029 8 117 8 309 8 988 7 616
Interest-bearing liabilities, EURm 234 491 564 1 038 1 289
Return on capital employed, % 31.6 34.7 35.3 27.9 58.0
Return on equity, % 21.8 24.4 25.5 19.1 43.3
Equity ratio, % 64.4 64.8 62.5 56.0 55.7
Net debt to equity, % –78 –71 –61 –41 –26
* Board’s proposal* * Includes acquisitions, investments in shares and capitalized development costs.
Calculation of Key Ratios, see page 51.

Nokia in 2004 51
C a l c u l at i o n o f ke y ra t i o s
Return on capital employed, %
Profit before taxes and minority interests
+ interest and other net financial expenses
Average shareholders’ equity + short-term borrowings
+ long-term interest-bearing liabilities (including the current portion thereof)
+ minority shareholders’ interests
Return on shareholders’ equity, %
Net profit
Average shareholders’ equity during the year
Equity ratio, %
Shareholders’ equity + minority shareholders’ interests
Total assets – advance payments received
Net debt to equity (gearing), %
Long-term interest-bearing liabilities (including the current portion thereof)
+ short-term borrowings – cash and other liquid assets
Shareholders’ equity + minority shareholders’ interests
Year-end currency rates 2004
1 EUR =
USD 1.3345
GBP 0.6885
SEK 8.9768
JPY 139.21
Operating profit
Profit after depreciation
Shareholders’ equity
Share capital + reserves
Earnings per share
Net profit
Average of adjusted number of shares during the year
P/E ratio
Adjusted share price, December 31
Earnings per share
Dividend per share
Nominal dividend per share
The adjustment coefficients of the share issues that have
taken place during or after the year in question
Payout ratio
Dividend per share
Earnings per share
Dividend yield, %
Nominal dividend per share
Share price
Shareholders’ equity per share
Shareholders’ equity
Adjusted number of shares at year end
Market capitalization
Number of shares x share price per share class
Adjusted average share price
Amount traded, in EUR, during the period
Adjusted number of shares traded during the period
Share turnover, %
Number of shares traded during the period
Average number of shares during the period
Key ratios under IFRS

52 Nokia in 2004
P ro p o s a l b y t h e B o a rd of D i re c to r s to t h e A n n u a l G e n e ra l M e e t i n g
The distributable earnings in the balance sheet of the Group amount to
EUR 11 323 million and those of the Company to EUR 8 151 million.
The Board proposes that from the funds at the disposal of the Annual
General Meeting, a dividend of EUR 0.33 per share is to be paid out on a
total of 4 663 761 300 shares, amounting to EUR 1 539 million.
Espoo, January 27, 2005
Jorma Ollila Paul J. Collins
Chairman and CEO
Georg Ehrnrooth Bengt Holmström Per Karlsson
Marjorie Scardino Vesa Vainio Arne Wessberg
Pekka Ala-Pietilä
President

Nokia in 2004 53
A u d i to r s ’ re p o r t
To the shareholders of Nokia CorporationWe have audited the accounting records, the financial statements and the
administration of Nokia Corporation for the year ended December 31,
2004. The financial statements prepared by the Board of Directors and the
President include the report of the Board of Directors, consolidated financial
statements prepared in accordance with International Financial Reporting
Standards (IFRS), and parent company financial statements prepared in
accordance with prevailing regulations in Finland. Based on our audit we
express an opinion on the consolidated financial statements and on the
parent company’s financial statements and administration.
We conducted our audit in accordance with Finnish Generally Accepted
Auditing Standards. Those standards require that we plan and perform the
audit in order to obtain reasonable assurance about whether the financial
statements are free of material misstatement. An audit includes examining,
on a test basis, evidence supporting the amounts and disclosures in the
financial statements, assessing the accounting principles used and significant
estimates made by the management, as well as evaluating the overall
financial statement presentation. The purpose of our audit of the adminis-
tration has been to examine that the Chairman and the other members of
the Board of Directors and the President have complied with the rules of
the Finnish Companies’ Act.
Consolidated financial statementsIn our opinion, the consolidated financial statements prepared in accord-
ance with International Financial Reporting Standards give a true and fair
view of the consolidated results of operations as well as of the financial
position. The financial statements are in accordance with prevailing regu-
lations in Finland and can be adopted.
Parent company’s financial statements and administrationThe financial statements have been prepared in accordance with the Finnish
Accounting Act and other rules and regulations governing the preparation
of financial statements in Finland. The financial statements give a true and
fair view, as defined in the Finnish Accounting Act, of the parent company’s
result of operations, as well as the financial position. The financial state-
ments can be adopted and the Chairman and the other members of the
Board of Directors and the President of the parent company can be dis-
charged from liability for the period audited by us. The proposal by the
Board of Directors concerning the disposition of the profit for the year is in
compliance with the Finnish Companies’ Act.
Espoo, January 27, 2005
PricewaterhouseCoopers Oy
Authorized Public Accountants
Eero Suomela
Authorized Public Accountant

54 Nokia in 2004

Nokia in 2004 55
Additional information
U.S. GAAP 56
Critical accounting policies 59
Group Executive Board 62
Board of Directors 64
Risk factors 66
Corporate governance 68
Investor information 77
General contact information 78

56 Nokia in 2004
U . S . G A A P
Differences between International Financial ReportingStandards and U.S. Generally Accepted Accounting PrinciplesThe Group’s consolidated financial statements are prepared in accordance
with International Financial Reporting Standards, which differ in certain
respects from accounting principles generally accepted in the United
States (U.S. GAAP). The principal differences between IFRS and U.S. GAAP are
presented below together with explanations of certain adjustments that
affect consolidated net income and total shareholders’ equity as of and for
the years ended December 31:
2004 2003 2002
EURm EURm EURm
Reconciliation of net income
Net income reported under IFRS 3 207 3 592 3 381
U.S. GAAP adjustments:
Pension expense – –12 –5
Development costs 42 322 –66
Provision for social security
cost on stock options –8 –21 –90
Stock compensation expense –21 –9 –35
Cash flow hedges 89 9 6
Net investment in foreign companies – – 48
Amortization of identifiable
intangible assets acquired –11 –22 –22
Impairment of identifiable intangible
assets acquired –47 – –
Amortization of goodwill 106 162 206
Impairment of goodwill – 151 104
Deferred tax effect of
U.S. GAAP adjustments –14 –75 76
Net income under U.S. GAAP 3 343 4 097 3 603
2004 2003
EURm EURm
Reconciliation of shareholders’ equity
Total shareholders’ equity reported under IFRS 14 238 15 148
U.S. GAAP adjustments:
Pension expense –49 –49
Additional minimum liability – –
Development costs –57 –99
Marketable securities and
unlisted investments 35 49
Provision for social security
cost on stock options 6 14
Deferred compensation –50 –10
Share issue premium 247 186
Stock compensation –197 –176
Acquisition purchase price 2 3
Amortization of identifiable
intangible assets acquired –62 –51
Impairment of identifiable
intangible assets acquired –47 –
Amortization of goodwill 502 396
Impairment of goodwill 255 255
Translation of goodwill –319 –293
Deferred tax effect of
U.S. GAAP adjustments 72 64
Total shareholders’ equity under U.S. GAAP 14 576 15 437
Pension expense and additional minimum liabilityUnder IFRS, pension assets, defined benefit pension liabilities and expense
are actuarially determined in a similar manner to U.S. GAAP. However, under
IFRS the prior service cost, transition adjustments and expense resulting
from plan amendments are generally recognized immediately. Under U.S.
GAAP, these expenses are generally recognized over a longer period. Also,
under U.S. GAAP the employer should recognize an additional minimum
pension liability charged to other comprehensive income when the accu-
mulated benefit obligation (ABO) exceeds the fair value of the plan assets
and this amount is not covered by the liability recognized in the balance
sheet. The calculation of the ABO is based on approach two as described in
EITF 88-1, Determination of Vested Benefit Obligation for a Defined Benefit
Pension Plan, under which the actuarial present value is based on the date
of separation from service.
The U.S. GAAP pension adjustment reflects the difference between the
prepaid pension asset and related pension expense as determined by apply-
ing IAS 19, Employee Benefits, and the pension asset and pension expense
determined by applying FAS 87, Employers’ Accounting for Pensions.
Nokia in 2004 57
U . S . G A A P
Development costsDevelopment costs have been capitalized under IFRS after the product in-
volved has reached a certain degree of technical feasibility. Capitalization
ceases and depreciation begins when the product becomes available to
customers. The depreciation period of these capitalized assets is between
two and five years.
Under U.S. GAAP, software development costs would similarly be capi-
talized after the product has reached a certain degree of technical feasibility.
However, certain non-software related development costs capitalized un-
der IFRS would not be capitalizable under U.S. GAAP and therefore would
have been expensed under U.S. GAAP.
Under IFRS, whenever there is an indication that capitalized develop-
ment costs may be impaired the recoverable amount of the asset is esti-
mated. An asset is impaired when the carrying amount of the asset exceeds
its recoverable amount. Recoverable amount is defined as the higher of an
asset’s net selling price and value in use. Value in use is the present value
of estimated discounted future cash flows expected to arise from the continu-
ing use of an asset and from its disposal at the end of its useful life.
Under US GAAP, the unamortized capitalized costs of a computer soft-
ware product is compared at each balance sheet date to the net realizable
value of that product with any excess written off. Net realizable value is
defined as the estimated future gross revenues from that product reduced
by the estimated future costs of completing and disposing of that product,
including the costs of performing maintenance and customer support re-
quired to satisfy the enterprise’s responsibility set forth at the time of sale.
The amount of unamortized capitalized computer software costs, under
U.S. GAAP, is EUR 210 million in 2004 (EUR 438 million in 2003).
Marketable securities and unlisted investmentsAll available-for-sale investments, which includes all publicly listed and
non-listed marketable securities, are measured at fair value and gains and
losses are recognized within shareholders’ equity until realized in the
profit and loss account upon sale or disposal.
Under U.S. GAAP, the Group’s listed marketable securities would be clas-
sified as available-for-sale and carried at aggregate fair value with gross
unrealized holding gains and losses reported as a separate component of
shareholders’ equity. Investments in equity securities that are not traded
on a public market are carried at historical cost, giving rise to an adjust-
ment between IFRS and U.S. GAAP.
Provision for social security cost on stock optionsUnder IFRS, the Group provides for social security costs on stock options on
the date of grant, based on the market value of the underlying stock at the
date of grant. The provision is adjusted for movements in the market value
of the underlying stock.
Under U.S. GAAP, no expense is recorded until the options are exercised.
Stock compensationUnder IFRS, no compensation expense is recorded on stock options, restricted
shares or performance shares granted. Under U.S. GAAP, the Group follows
the methodology in APB Opinion 25, Accounting for Stock Issued to Employ-
ees (APB 25), and related interpretations to measure employee stock com-
pensation. Under APB 25 intrinsic value from Nokia’s option programs arises
when the exercise price is less than the quoted market value of the under-
lying stock on the date of grant.
Restricted shares and performance shares are accounted for as variable
award plans under U.S. GAAP where compensation is measured each period
end as the difference between the exercise price and the quoted market
value of the underlying stock. For performance shares, the Group assesses
the probability of whether the performance criteria will be met in calculating
the compensation expense. Compensation arising from stock option pro-
grams, restricted shares and performance shares is recorded as deferred
compensation within shareholders’ equity and recognized in the profit
and loss account over the vesting period of the stock.
Cash flow hedgesAs a result of a specific difference in the rules under IAS 39 and FAS 133,
Accounting for Derivative Instruments and Hedging Activities, relating to
hedge accounting, certain foreign exchange gains and losses classified
within equity under IFRS are included in the income statement under U.S.
GAAP.
Net investment in foreign companiesUnder IFRS, on the disposal of a foreign entity, the cumulative amount of
the exchange differences which have been deferred and which relate to
that foreign entity should be recognized as income or as expenses in the
same period in which the disposal is recognized. An enterprise may dis-
pose of its interest in a foreign entity through sale, liquidation, repayment
of share capital and permanent loans, or abandonment of all, or part of,
that entity.
Under U.S. GAAP, the cumulative translation differences are reported in
the profit and loss account only upon the sale or upon complete or sub-
stantially complete liquidation of the investment in a foreign entity.
Acquisition purchase priceUnder IFRS, when the consideration paid in a business combination in-
cludes shares of the acquirer, the purchase price of the acquired business
is determined at the date on which the shares are exchanged.
Under U.S. GAAP, the measurement date for shares of the acquirer is the
date the acquisition is announced or, if the number of shares is uncertain
on such date, the first day on which both the number of acquirer shares
and the amount of other considerations become fixed. The average share
price for a few days before and a few days after the measurement date is
then used to value the shares.
Amortization and impairmentof identifiable intangible assets acquiredPrior to April 1, 2004, unpatented technology acquired was not separately
recognized on acquisition under IFRS but was included within goodwill.
Under U.S. GAAP, any unpatented technology acquired in a business
combination is recorded as an identifiable intangible asset with a related
deferred tax liability. The intangible asset is amortized over its estimated
useful life. The adjustment to U.S. GAAP net income and shareholders’ equity
relates to the amortization and accumulated amortization, respectively, of
Amber Networks’ intangible asset.
During 2004 the carrying value of Amber Network upatented technology
was impaired since Nokia no longer develops nor uses the technology ac-
quired and its carrying amount is not recoverable through estimated future
cash flows. The total impact on net income in 2004 amounted to EUR 58 mil-
lion of which the write-down recognized under U.S. GAAP was EUR 47 million.

58 Nokia in 2004
U . S . G A A P
The net carrying amount of other intangible assets under U.S. GAAP is
EUR 419 million in 2004 (EUR 623 million in 2003) and consists of capitalized
development costs of EUR 210 million (EUR 438 million in 2003) and acquired
patents, trademarks and licenses of EUR 209 million (EUR 185 million). The
Group does not have any indefinite lived intangible assets. The amortization
expense under U.S. GAAP of other intangible assets subject to amortization
as of December 31, 2004, is expected to be approximately EUR 172 million
for each of the next five years.
Amortization of goodwillThe Group adopted the transition provisions of IFRS 3, Business Combina-
tions, with effect from 1 April 2004. As a result, goodwill relating to purchase
acquisitions and acquisitions of associated companies for which the
agreement date was on or after March 31, 2004, is no longer subject to
amortization. Goodwill arising in business combinations completed be-
fore March 31, 2004 will continue to be amortized over its estimated useful
life until the standard is fully adopted as of January 1, 2005.
The Group adopted the provisions of FAS 142, Goodwill and Other Intan-
gible Assets (FAS 142), on January 1, 2002 and as a result, under U.S. GAAP
goodwill relating to purchase acquisitions and acquisitions of associated
companies is no longer subject to amortization subsequent to the date of
adoption.
The U.S. GAAP adjustment reverses the amortization expense recorded
under IFRS and also reverses the movement in accumulated amortization
under IFRS during the period subsequent to the adoption of FAS 142.
Impairment of goodwillAs of January 1, 2002, the Group performed the transitional impairment
test under FAS 142 and compared the carrying value for each reporting unit
to its fair value, which was determined based on discounted cash flows.
Upon completion of the transitional impairment test, the Group deter-
mined that there was no impairment as of January 1, 2002, as the carrying
value of each reporting unit did not exceed its fair value. The Group has
also completed the annual impairment test required by FAS 142 during the
fourth quarter of 2004, 2003 and 2002, which was also performed by com-
paring the carrying value of each reporting unit to its fair value based on
discounted cash flows.
Under IFRS, goodwill is allocated to “cash generating units”, which are
the smallest group of identifiable assets which includes the goodwill under
review for impairment, and that generates cash inflows from continuing
use that are largely independent of the cash inflows from other assets.
Under IFRS, the Group recorded in 2003 and 2002 an impairment of good-
will of EUR 151 million and EUR 104 million, respectively, related to Amber
Networks as the carrying amount of the cash generating unit exceeded
the recoverable amount of the unit. Upon completion of the annual im-
pairment test, the Group determined that the impairment recorded for
Amber Networks should be reversed for U.S. GAAP purposes because, at the
Core Networks reporting unit level in 2003 and IP Mobility Network reporting
unit level in 2002, where Amber Networks resides, the fair value of the re-
porting unit exceeded the book value of the reporting unit.
The Group recorded no goodwill impairments during 2004.
Below is a roll forward of U.S. GAAP goodwill during 2004 and 2003. The
comparative figures are regrouped according to the new organizational
structure:
Mobile Enterprise CommonEURm Phones Multimedia Solutions Networks Group Functions Group
Balance as of Jan. 1, 2003 125 21 26 323 9 504
Goodwill acquired – – 20 – – 20
Translation adjustment 4 1 –6 –52 – –53
Balance as of Dec. 31, 2003 129 22 40 271 9 471
Goodwill acquired – – – – – –
Translation adjustment –1 – –3 –22 – –26
Balance as of Dec. 31, 2004 128 22 37 249 9 445
Goodwill is not deductible for tax purposes.
Translation of goodwillUnder IFRS, the Group translates goodwill arising on the acquisition of for-
eign subsidiaries at historical rates.
Under U.S. GAAP, goodwill is translated at the closing rate on the bal-
ance sheet date with gains and losses recorded as a component of share-
holders’ equity.

Nokia in 2004 59
Our accounting policies affecting our financial condition and results of
operations are more fully described in Note 1 to our consolidated financial
statements. Certain of Nokia’s accounting policies require the application
of judgment by management in selecting appropriate assumptions for
calculating financial estimates, which inherently contain some degree of
uncertainty. Management bases its estimates on historical experience and
various other assumptions that are believed to be reasonable under the
circumstances, the results of which form the basis for making judgments
about the reported carrying values of assets and liabilities and the reported
amounts of revenues and expenses that may not be readily apparent from
other sources. Actual results may differ from these estimates under different
assumptions or conditions.
Nokia believes the following are the critical accounting policies and
related judgments and estimates used in the preparation of its consolidated
financial statements. We have discussed the application of these critical
accounting estimates with our Board of Directors and Audit Committee.
Revenue recognitionRevenue from the majority of the Group is recognized when persuasive
evidence of an arrangement exists, delivery has occurred, the fee is fixed
and determinable and collectibility is probable. The remainder of revenue
is recorded under the percentage of completion method.
For Mobile Phones, Multimedia and Enterprise Solutions, as well as certain
of Networks’ revenue is recognized when persuasive evidence of an arrange-
ment exists, delivery has occurred, the fee is fixed and determinable and
collectibility is probable. This requires us to assess at the point of delivery
whether these criteria have been met. When management determines
that such criteria have been met, revenue is recognized. Nokia records esti-
mated reductions to revenue for customer programs and incentive offerings,
including special pricing agreements, price protection and other volume
based discounts at the time of sale, mainly in the mobile device business.
Sales adjustments for volume based discount programs are estimated
based largely on historical activity under similar programs. Price protec-
tion adjustments are based on estimates of future price reductions and
certain agreed customer inventories at the date of the price adjustment.
An immaterial part of the revenue from products sold through distribution
channels is recognized when the reseller or distributor sells the product to
the end user.
Networks’ revenue from contracts involving solutions achieved through
modification of telecommunications equipment is recognized on the per-
centage of completion basis when the outcome of the contract can be esti-
mated reliably. A contract’s outcome can be estimated reliably when total
contract revenue can be estimated reliably, it is probable that economic
benefits associated with the contract will flow to the company, and the
stage of contract completion can be measured reliably. When we are not
able to meet those conditions, the policy is to recognize revenues only
equal to costs incurred to date, to the extent that such costs are expected
to be recovered. Completion is measured by reference to costs incurred to
date as a percentage of estimated total project costs.
The percentage of completion method relies on estimates of total ex-
pected contract revenue and costs, as well as the dependable measure-
ment of the progress made towards completing the particular project.
Recognized revenues and profit are subject to revisions during the project
in the event that the assumptions regarding the overall project outcome
are revised. The cumulative impact of a revision in estimates is recorded in
the period such revisions become likely and estimable. Losses on projects
in progress are recognized in the period they become likely and estimable.
Revenue recognition on initial 3G network contracts started in 2002
when Networks achieved 3G functionality for its single-mode and dual-
mode WCDMA 3G systems. Until the time the 3GPP specifications required
by our customers were met, we deferred the application of the cost-to-cost
input model. Upon achieving 3G functionality for WCDMA network projects,
we began recognizing revenue under the cost-to-cost input method of
percentage of completion accounting and have continued to apply the
method in 2003 and 2004.
Networks’ current sales and profit estimates for projects may change
due to the early stage of a long-term project, new technology, changes in
the project scope, changes in costs, changes in timing, changes in customers’
plans, realization of penalties, and other corresponding factors.
Customer financingWe have provided a limited amount of customer financing and agreed ex-
tended payment terms with selected customers in our Networks business.
In establishing credit arrangements, management must assess the credit-
worthiness of the customer and the timing of cash flows expected to be
received under the arrangement. However, should the actual financial posi-
tion of our customers or general economic conditions differ from our assump-
tions, we may be required to re-assess the ultimate collectibility of such
financings and trade credits, which could result in a write-off of these bal-
ances in future periods and thus negatively impact our profits in future
periods. Our assessment of the net recoverable value considers the collateral
and security arrangements of the receivable as well as the likelihood and
timing of estimated collections. See also Note 35(b) to our consolidated
financial statements for a further discussion of long-term customer loans.
Allowances for doubtful accountsWe maintain allowances for doubtful accounts for estimated losses resulting
from the subsequent inability of our customers to make required pay-
ments. If the financial conditions of our customers were to deteriorate,
resulting in an impairment of their ability to make payments, additional
allowances may be required in future periods. Management specifically
analyzes accounts receivables and analyzes historical bad debt, customer
concentrations, customer creditworthiness, current economic trends and
changes in our customer payment terms when evaluating the adequacy of
the allowance for doubtful accounts.
Inventory-related allowancesWe periodically review our inventory for excess inventory, obsolescence
and declines in market value below cost and record an allowance against
the inventory balance for any such declines. These reviews require man-
agement to estimate future demand for our products. Possible changes in
these estimates could result in revisions to the valuation of inventory.
Warranty provisionsWe provide for the estimated cost of product warranties at the time revenue
is recognized. Nokia’s products are covered by product warranty plans of
varying periods, depending on local practices and regulations. While we
engage in extensive product quality programs and processes, including
actively monitoring and evaluating the quality of our component suppli-
ers, our warranty obligations are affected by actual product failure rates
C r i t i c a l a cco u n t i n g p o l i c i e s
60 Nokia in 2004
C r i t i c a l a cco u n t i n g p o l i c i e s
(field failure rates) and by material usage and service delivery costs in-
curred in correcting a product failure. Our warranty provision is estab-
lished based upon our best estimates of the amounts necessary to settle
future and existing claims on products sold as of the balance sheet date.
As our new products incorporate complex technologies, as we continuously
introduce new products, and as local laws, regulations and practices may
change, it will be increasingly difficult to anticipate our failure rates, the
length of warranty periods and repair costs. While we believe that our
warranty provisions are adequate and that the judgments applied are appro-
priate, the ultimate cost of product warranty could differ materially from
our estimates. When the actual cost of quality of our products is lower
than we originally anticipated, we release an appropriate proportion of
the provision, and if the cost of quality is higher than anticipated, we in-
crease the provision.
Provision for intellectual property rights, or IPR, infringementsWe provide for the estimated future settlements related to asserted and
unasserted IPR infringements based on the probable outcome of each in-
fringement. The ultimate outcome or actual cost of settling an individual
infringement may vary from our estimates.
Our products and solutions include increasingly complex technologies
involving numerous patented and other proprietary technologies. Although
we proactively try to ensure that we are aware of any patents related to
our products and solutions under development and thereby avoid inadvert-
ent infringement of proprietary technologies, the nature of our business is
such that patent infringements may and do occur. Through contact with
parties claiming infringement of their patented technology, or through
our own monitoring of developments in patent cases involving our com-
petitors, we identify potential IPR infringements.
We estimate the outcome of all potential IPR infringements made
known to us through assertion by third parties, or through our own mon-
itoring of patent-related cases in the relevant legal systems. To the extent
that we determine that an identified potential infringement will more
likely than not result in an outflow of resources, we record a liability based
on our best estimate of the expenditure required to settle infringement
proceedings.
Our experience with claims of IPR infringement is that there is typically
a discussion period with the accusing party, which can last from several
months to years. In cases where a settlement is not reached, the discovery
and ensuing legal process typically lasts a minimum of one year. For this
reason, the ultimate outflow relating to IPR infringement claims can last
for varying periods of time, resulting in irregular movements in the IPR
infringement provision.
Capitalized development costsWe capitalize certain development costs when it is probable that a devel-
opment project will be a success and certain criteria, including commercial
and technological feasibility, have been met. These costs are then amor-
tized on a systematic basis over their expected useful lives, which due to
the constant development of new technologies is between two to five
years. During the development stage, management must estimate the
commercial and technological feasibility of these projects as well as their
expected useful lives. Should a product fail to substantiate its estimated
feasibility or life cycle, we may be required to write off excess develop-
ment costs in future periods.
Whenever there is an indicator that development costs capitalized for
a specific project may be impaired, the recoverable amount of the asset is
estimated. An asset is impaired when the carrying amount of the asset
exceeds its recoverable amount. The recoverable amount is defined as the
higher of an asset’s net selling price and value in use. Value in use is the
present value of discounted estimated future cash flows expected to arise
from the continuing use of an asset and from its disposal at the end of its
useful life. For projects still in development, these estimates include the
future cash out flows that are expected to occur before the asset is ready
for use. See Note 8 to our consolidated financial statements.
Impairment reviews are based upon our projections of anticipated future
cash flows. The most significant variables in determining cash flows are
discount rates, terminal values, the number of years on which to base the
cash flow projections, as well as the assumptions and estimates used to
determine the cash inflows and outflows. Management determines dis-
count rates to be used based on the risk inherent in the related activity’s
current business model and industry comparisons. Terminal values are
based on the expected life of products and forecasted life cycle and fore-
casted cash flows over that period. While we believe that our assumptions
are appropriate, such amounts estimated could differ materially from
what will actually occur in the future. For IFRS, discounted estimated cash
flows are used to identify the existence of an impairment while for U.S. GAAP
undiscounted future cash flows are used. Consequently, an impairment
could be required under IFRS but not under U.S. GAAP.
Valuation of long-lived and intangible assets and goodwillWe assess the carrying value of identifiable intangible assets, long-lived
assets and goodwill annually, or more frequently if events or changes in
circumstances indicate that such carrying value may not be recoverable.
Factors we consider important, which could trigger an impairment review,
include the following:
• significant underperformance relative to historical or projected future
results;
• significant changes in the manner of our use of the acquired assets or
the strategy for our overall business; and
• significant negative industry or economic trends.
When we determine that the carrying value of intangible assets, long-
lived assets or goodwill may not be recoverable based upon the existence
of one or more of the above indicators of impairment, we measure any
impairment based on discounted projected cash flows.
This review is based upon our projections of anticipated future cash
flows. The most significant variables in determining cash flows are discount
rates, terminal values, the number of years on which to base the cash flow
projections, as well as the assumptions and estimates used to determine
the cash inflows and outflows. Management determines discount rates to
be used based on the risk inherent in the related activity’s current business
model and industry comparisons. Terminal values are based on the expected
life of products and forecasted life cycle and forecasted cash flows over
that period. While we believe that our assumptions are appropriate, such
amounts estimated could differ materially from what will actually occur in
the future. For IFRS these discounted cash flows are prepared at a cash
generating unit level, and for U.S. GAAP these cash flows are prepared at a

Nokia in 2004 61
C r i t i c a l a cco u n t i n g p o l i c i e s
reporting unit level. Consequently, an impairment could be required under
IFRS and not U.S. GAAP or vice versa.
Deferred taxesManagement judgment is required in determining our provision for income
taxes, deferred tax assets and liabilities and the extent to which deferred
tax assets can be recognized. We recognize deferred tax assets if it is prob-
able that sufficient taxable income will be available in the future against
which the temporary differences and unused tax losses can be utilized. We
have considered future taxable income and tax planning strategies in as-
sessing whether deferred tax assets should be recognized.
PensionsThe determination of our pension benefit obligation and expense for defined
benefit pension plans is dependent on our selection of certain assump-
tions used by actuaries in calculating such amounts. Those assumptions
are described in Note 6 to our consolidated financial statements and include,
among others, the discount rate, expected long-term rate of return on
plan assets and annual rate of increase in future compensation levels. A
portion of our plan assets is invested in equity securities. The equity mar-
kets have experienced volatility, which has affected the value of our pen-
sion plan assets. This volatility may make it difficult to estimate the long-
term rate of return on plan assets. Actual results that differ from our as-
sumptions are accumulated and amortized over future periods and there-
fore generally affect our recognized expense and recorded obligation in
such future periods. Our assumptions are based on actual historical expe-
rience and external data regarding compensation and discount rate
trends. While we believe that our assumptions are appropriate, significant
differences in our actual experience or significant changes in our assump-
tions may materially affect our pension obligation and our future expense.

62 Nokia in 2004
G ro u p E xe c u t i v e B o a rd
March 8, 2005
Our articles of association provide for a Group Executive Board, which is responsible for managing the operations of Nokia. The Chairman and the
members of the Group Executive Board are elected by the Board of Directors. Only the Chairman of the Group Executive Board can be a member of
both the Board of Directors and the Group Executive Board. The current members of our Group Executive Board are set forth below.
Chairman Jorma Ollila, b. 1950Chairman and CEO of Nokia Corporation.
Group Executive Board member since 1986.
Chairman since 1992.
Joined Nokia 1985.
Master of Political Science (University of Helsinki),
Master of Science (Econ.) (London School of
Economics), Master of Science (Eng.) (Helsinki
University of Technology).
President and CEO, and Chairman of the Group
Executive Board of Nokia Corporation 1992–1999,
President of Nokia Mobile Phones 1990–1992,
Senior Vice President, Finance of Nokia 1986–1989.
Holder of various managerial positions at Citibank
within corporate banking 1978–1985.
Member of the Board of Directors of Ford Motor
Company and Vice Chairman of the Board of
Directors of UPM-Kymmene Corporation and Vice
Chairman of the Board of Directors of Otava
Books and Magazines Group Ltd. Chairman of the
Boards of Directors and the Supervisory Boards of
Finnish Business and Policy Forum EVA and The
Research Institute of the Finnish Economy ETLA.
Member of The European Round Table of
Industrialists.
Pekka Ala-Pietilä, b. 1957President of Nokia Corporation and
Head of Customer and Market Operations.
Group Executive Board member since 1992.
Joined Nokia 1984.
Master of Science (Econ.) (Helsinki School
of Economics and Business Administration).
President of Nokia Corporation and Head of Nokia
Ventures Organization 1999–2003, Executive Vice
President and Deputy to the CEO of Nokia Corpo-
ration and President of Nokia Communications
Products 1998–1999, President of Nokia Mobile
Phones 1992–1998, Vice President, Product
Marketing of Nokia Mobile Phones 1991–1992,
Vice President, Strategic Planning of Nokia
Mobile Phones 1990–1991.
Member of the Supervisory Board of SAP AG.
Member of the Science and Technology Policy
Council of Finland, member of the Board of the
Finnish-American Chamber of Commerce,
member of the Board of the Economic
Information Bureau.
Simon Beresford-Wylie, b. 1958Executive Vice President
and General Manager of Networks.
Group Executive Board member since
February 1, 2005.
Joined Nokia 1998.
Bachelor of Arts (Economic Geography and
History) (Australian National University).
Senior Vice President of Nokia Networks, Asia
Pacific 2003–2004, Senior Vice President, Customer
Operations of Nokia Networks 2002–2003, Vice
President, Customer Operations of Nokia Networks
2000–2002, Managing Director of Nokia Networks
in India and Area General Manager, South Asia
1999–2000, Regional Director of Business
Development, Project and Trade Finance of Nokia
Networks, Asia Pacific 1998–1999, Chief Executive
Officer of Modi Telstra, India 1995–1998, General
Manager, Banking and Finance, Corporate and
Government business unit of Telstra Corporation
1993–1995, holder of executive positions in the
Corporate and Government business units of
Telstra Corporation 1989–1993. Holder of executive,
managerial and clerical positions in the Australian
Commonwealth Public Service 1982–1989.
Olli-Pekka Kallasvuo, b. 1953Executive Vice President and
General Manager of Mobile Phones.
Group Executive Board member since 1990.
With Nokia 1980–81, rejoined 1982.
LL.M. (University of Helsinki).
Executive Vice President, CFO of Nokia 1999–2003,
Executive Vice President of Nokia Americas and
President of Nokia Inc. 1997–1998, Executive Vice
President, CFO of Nokia 1992–1996, Senior Vice
President, Finance of Nokia 1990–1991.
Chairman of the Board of Directors of Sampo plc
and Nextrom Holding S.A., Member of the Board
of Directors of EMC Corporation.
Pertti Korhonen, b. 1961Senior Vice President,
Chief Technology Officer.
Group Executive Board member since 2002.
Joined Nokia 1986.
Master of Science (Electronics Eng.) (University of
Oulu).
Executive Vice President of Nokia Mobile Software
2001–2003, Senior Vice President, Global Operations,
Logistics and Sourcing of Nokia Mobile Phones
1999–2001, Senior Vice President, Global Operations
and Logistics of Nokia Mobile Phones 1998–1999,
Vice President, Logistics of Nokia Mobile Phones
1996–1998, Vice President, Manufacturing Europe
of Nokia Mobile Phones 1993–1996, Project
Executive of Nokia Mobile Phones UK Ltd 1991–1993,
Vice President, R&D of Nokia Mobile Phones, Oulu
1990–1991.
Mary T. McDowell, b. 1964Senior Vice President
and General Manager of Enterprise Solutions.
Group Executive Board member since 2004.
Joined Nokia 2004.
Bachelor of Science (Computer Science) (College
of Engineering at the University of Illinois).
Senior Vice President, Strategy and Corporate
Development of Hewlett-Packard Company 2003,
Senior Vice President & General Manager, Industry-
Standard Servers of Hewlett-Packard Company
2002–2003, Senior Vice President & General
Manager, Industry-Standard Servers of Compaq
Computer Corporation 1998–2002, Vice President,
Marketing, Server Products Division of Compaq
Computer Corporation 1996–1998. Holder of
executive, managerial and other positions at
Compaq Computer Corporation 1986–1996.
Member of the Board of Visitors for the College
of Engineering at the University of Illinois.

Nokia in 2003 | 63Nokia in 2004 63
G ro u p E xe c u t i v e B o a rd
Hallstein Moerk, b. 1953Senior Vice President, Human Resources.
Group Executive Board member since 2004.
Joined Nokia 1999.
Diplomøkonom (Econ.) (Norwegian School of
Management).
Holder of various positions at Hewlett-Packard
Corporation 1977–1999.
Member of the Board of Directors of Flisekompaniet.
Member of the Board of Advisors for Center for HR
Strategy, Rutgers University.
Dr. Yrjö Neuvo, b. 1943Senior Vice President, Technology Advisor.
Group Executive Board member since 1993.
Joined Nokia 1993.
Master of Science (Eng.), Licentiate of Science
(Technology) (Helsinki University of Technology),
Ph.D. (EE) (Cornell University).
Executive Vice President, CTO of Nokia Mobile
Phones 1999–2003, Senior Vice President, Product
Creation of Nokia Mobile Phones 1994–1999, Senior
Vice President, Technology of Nokia 1993–1994,
National Research Professor of The Academy of
Finland 1984–1992, Professor of Tampere University
of Technology 1976–1992, Visiting Professor of
University of California, Santa Barbara 1981–1982.
Vice Chairman of the Board of Directors of Vaisala
Corporation. Member of Finnish Academy of
Technical Sciences, The Finnish Academy of Science
and Letters, and Academiae Europae, Foreign
member of Royal Swedish Academy of Engineering
Sciences, and Fellow of the Institute of Electrical
and Electronics Engineers.
Dr. Tero Ojanperä, b. 1966Senior Vice President, Chief Strategy Officer.
Group Executive Board member since
January 1, 2005.
Joined Nokia 1990.
Master of Science (University of Oulu), Ph.D.
(Delft University of Technology, The Netherlands).
Senior Vice President, Head of Nokia Research
Center 2002–2004, Vice President, Research,
Standardization and Technology of IP Mobility
Networks, Nokia Networks 1999–2001, Vice
President, Radio Access Systems Research and
General Manager of Nokia Networks in Korea,
1999, Head of Radio Access Systems Research,
Nokia Networks 1998–1999, Principal Engineer,
Nokia Research Center, 1997–1998.
Chairman of Nokia Foundation. Vice Chairman of
the Center for Wireless Communications, Oulu
University, Member of the Board of Technomedicum
Research Institute, Member of IST Advisory Group
(ISTAG) for the European Commission, Member of
the Board of the Foundation of Finnish Institute
in Japan, Member of the Industrial Advisory
Council of Center for TelelnFrastruktur (CTIF),
Aalborg University, Member of the Institute of
Electrical and Electronics Engineers, Inc. (IEEE).
Richard A. Simonson, b. 1958Senior Vice President, Chief Financial Officer.
Group Executive Board member since 2004.
Joined Nokia 2001.
Bachelor of Science (Mining Eng.) (Colorado
School of Mines), Master of Business Administration
(Finance) (Wharton School of Business at University
of Pennsylvania).
Vice President & Head of Customer Finance of
Nokia Corporation 2001–2003, Managing Director
of Telecom & Media Group of Barclays 2001, Head
of Global Project Finance and other various
positions at Bank of America Securities 1985–2001.
Member of the Board of Directors of Nextrom
Holding S.A.
Veli Sundbäck, b. 1946Senior Vice President, Corporate Relations
and Responsibility of Nokia Corporation.
Group Executive Board member since 1996.
Joined Nokia 1996.
LL.M. (University of Helsinki).
Executive Vice President, Corporate Relations
and Trade Policy of Nokia Corporation 1996–2003.
Secretary of State at the Ministry for Foreign Affairs
1993–1995, Under-Secretary of State for External
Economic Relations at the Ministry for Foreign
Affairs 1990–1993.
Member of the Board of Directors of Finnair Oyj.
Member of the Bureau of the United Nations
Information and Communication Technologies
Task Force (UN ICT TF), Vice Chairman of the Board
of the International Chamber of Commerce, Finnish
Section, Chairman of the Board of the Finland-
China Trade Association, Member of the Board of
Directors, Confederation of Finnish Industries
(EK), Vice Chairman of the Board of Directors and
its committee, Technology Industries of Finland.
Anssi Vanjoki, b. 1956Executive Vice President
and General Manager of Multimedia.
Group Executive Board member since 1998.
Joined Nokia 1991.
Master of Science (Econ.) (Helsinki School of
Economics and Business Administration).
Executive Vice President of Nokia Mobile Phones
1998–2003, Senior Vice President, Europe & Africa
of Nokia Mobile Phones 1994–1998, Vice President,
Sales of Nokia Mobile Phones 1991–1994, 3M
Corporation 1980–1991.
Member of the Board of Directors of Amer Group Plc.

64 Nokia in 2004
March 8, 2005
B o a rd of D i re c to rs
Jorma Ollila, b. 1950Chairman and CEO.
Chairman of the Group Executive Board of Nokia Corporation.
Board member since 1995. Chairman since 1999.
Master of Political Science (University of Helsinki), Master of Science (Econ.)
(London School of Economics), Master of Science (Eng.) (Helsinki University
of Technology).
President and CEO, Chairman of the Group Executive Board of Nokia Corporation
1992–1999, President of Nokia Mobile Phones 1990–1992, Senior Vice President,
Finance of Nokia 1986–1989. Holder of various managerial positions at Citibank
within corporate banking 1978–1985.
Member of the Board of Directors of Ford Motor Company and Vice Chairman
of the Board of Directors of UPM-Kymmene Corporation and Vice Chairman of
the Board of Directors of Otava Books and Magazines Group Ltd. Chairman
of the Boards of Directors and the Supervisory Boards of Finnish Business
and Policy Forum EVA and The Research Institute of the Finnish Economy
ETLA. Member of The European Round Table of Industrialists.
Paul J. Collins, b. 1936Board member since 1998. Vice Chairman since 2000
BBA (University of Wisconsin), MBA (Harvard Business School).
Vice Chairman of Citigroup Inc. 1998–2000, Vice Chairman and member
of the Board of Directors of Citicorp and Citibank N.A. 1988–2000. Holder
of various executive positions at Citibank within investment management,
investment banking, corporate planning as well as finance and administration
1961–1988.
Member of the Board of Directors of BG Group and The Enstar Group, Inc.
Member of the Supervisory Board of Actis Capital LLP.
Georg Ehrnrooth, b. 1940Board member since 2000.
Master of Science (Eng.) (Helsinki University of Technology).
President and CEO of Metra Corporation 1991–2000, President and CEO
of Lohja Corporation 1979–1991. Holder of various executive positions
at Wärtsilä Corporation within production and management 1965–1979.
Chairman of the Board of Directors of Assa Abloy AB (publ) and Vice Chairman
of the Board of Directors of Rautaruukki Corporation, member of the Board
of Directors of Oy Karl Fazer Ab, Sandvik AB (publ) and Sampo plc. Vice
Chairman of the Boards of Directors of The Research Institute of the Finnish
Economy ETLA and Finnish Business and Policy Forum EVA.
Dr. Bengt Holmström, b. 1949Paul A. Samuelson Professor of Economics at MIT, joint appointment
at the MIT Sloan School of Management.
Board member since 1999.
Bachelor of Science (Helsinki University), Master of Science (Stanford University),
Doctor of Philosophy (Stanford University).
Edwin J. Beinecke Professor of Management Studies at Yale University
1985–1994.
Member of the Board of Directors of Kuusakoski Oy. Member of the American
Academy of Arts and Sciences and Foreign Member of The Royal Swedish
Academy of Sciences.
Per Karlsson, b. 1955Independent Corporate Advisor.
Board member since 2002.
Degree in Economics and Business Administration (Stockholm School of
Economics).
Executive Director, with mergers and acquisitions advisory responsibilities,
at Enskilda M&A, Enskilda Securities (London) 1986–1992, Corporate strategy
consultant at the Boston Consulting Group (London) 1979–1986.
Board member of IKANO Holdings S.A.
Dame Marjorie Scardino, b. 1947Chief Executive and member of the Board of Directors of Pearson plc.
Board member since 2001.
BA (Baylor), JD (University of San Francisco).
Chief Executive of The Economist Group 1993–1997, President of the North
American Operations of The Economist Group 1985–1993, lawyer 1976–1985
and publisher of The Georgia Gazette newspaper 1978–1985.
Pursuant to the provisions of the Finnish Companies Act and our articles of association, the control and management of Nokia is divided among
the shareholders in a general meeting, the Board of Directors and the Group Executive Board. The current members of the Board of Directors were
elected at the Annual General Meeting on March 25, 2004, in accordance with the proposal of the Corporate Governance and Nomination Committee
of the Board. On the same date, the Chairman and Vice Chairman were elected by the Board members. Certain information with respect to these
individuals is set forth below.
Nokia in 2003 | 65Nokia in 2004 65
Vesa Vainio, b. 1942Board member since 1993.
LL.M. (University of Helsinki).
Chairman 1998–1999 and 2000–2002 and Vice Chairman 1999–2000 of the
Board of Directors of Nordea AB (publ), Chairman of the Executive Board
and CEO of Merita Bank Ltd and CEO of Merita Ltd 1992–1997, President of
Kymmene Corporation 1991–1992. Holder of various other executive positions
in Finnish industry 1972–1991.
Chairman of the Board of Directors of UPM-Kymmene Corporation.
Arne Wessberg, b. 1943Chairman of the Board of Directors and Chief Executive Officer
of Yleisradio Oy (Finnish Broadcasting Company).
Board member since 2001.
Studies in economics in the University of Tampere (1963–1966).
Chairman of the Board of Eurosport Consortium 1998–2000, member
1989–1997, Member of the Board of Trustees of IIC 1996–1998 and 1993–1995.
Holder of various positions at Yleisradio Oy (Finnish Broadcasting Company)
in different executive roles 1979–1994 and as a reporter and editor 1971–1976.
President of the European Broadcasting Union (EBU), member of the Board
of Directors of the International Academy of Television Arts & Sciences and
member of the Trilateral Commission (Europe).
B o a rd of D i re c to r s
On January 27, 2005, the Corporate Governance and Nomination Committee
announced its proposal to the Annual General Meeting convening on April
7, 2005 regarding the election of the members of the Board of Directors.
The Corporate Governance and Nomination Committee will propose to the
Annual General Meeting that the number of Board members be increased
from eight to ten and that all of the present members be re-elected for a
term of one year. In addition, the Committee will propose that Mr. Daniel R.
Hesse and Mr. Edouard Michelin be elected as new members of the Board of
Directors for the same one-year term. Mr. Hesse is a member of the Board of
Directors of Terabeam Wireless, a US based telecommunications technology
and services company. Mr. Michelin is the CEO of Michelin Group, the French
world-leading tire manufacturing company.
Drs Robert Van Oordt served as a member of the Board of Directors until
the Annual General Meeting on March 25, 2004, but did not stand for re-
election as he had reached the Board of Directors’ guideline retirement
age of 68 years.

66 Nokia in 2004
R i s k fa c to r s
March 8, 2005
Set forth below is a description of factors that may affect our business,
results of operations and share price from time to time.
• Our sales and profitability depend on the continued growth of the mobile
communications industry as well as the growth of the new market seg-
ments within that industry in which we have recently invested. If the
mobile communications industry does not grow as we expect, or if the
new market segments on which we have chosen to focus and in which
we have recently invested grow less than expected, or if new faster-
growing market segments emerge in which we have not invested, our
sales and profitability may be adversely affected.
• Our results of operations, particularly our profitability, may be adversely
affected if we do not successfully manage price erosion related to our
products.
• We must develop or otherwise acquire complex, evolving technologies
to use in our business. If we fail to develop these technologies or to
successfully commercialize them as new advanced products and solu-
tions that meet customer demand, or fail to do so on a timely basis, it
may have a material adverse effect on our business, our ability to meet
our targets and our results of operations.
• We need to understand the different markets in which we operate and
meet the needs of our customers, which include mobile network oper-
ators, distributors, independent retailers and enterprise customers.
We need to have a competitive product portfolio, and to work together
with our operator customers to address their needs. Our failure to iden-
tify key market trends and to respond timely and successfully to the
needs of our customers may have a material adverse impact on our
market share, business and results of operations.
• Competition in our industry is intense. Our failure to respond success-
fully to changes in the competitive landscape may have a material
adverse impact on our business and results of operations.
• Reaching our sales, profitability, volume and market share targets de-
pends on numerous factors. These include our ability to offer products
and solutions that meet the demands of the market and to manage the
prices and costs of our products and solutions, our operational efficiency,
the pace of development and acceptance of new technologies, our suc-
cess in the business areas that we have recently entered, and general
economic conditions. Depending on those factors, some of which we
may influence and others of which are beyond our control, we may fail
to reach our targets and we may fail to provide accurate forecasts of
our sales and results of operations.
• Our sales and results of operations could be adversely affected if we fail
to efficiently manage our manufacturing and logistics without inter-
ruption, or fail to ensure that our products and solutions meet our and
our customers’ quality, safety and other requirements and are deliv-
ered in time.
• We depend on our suppliers for the timely delivery of components and
for their compliance with our supplier requirements, such as, most nota-
bly, our and our customers’ product quality, safety and other standards.
Their failure to do so could adversely affect our ability to deliver our
products and solutions successfully and on time.
• We are developing a number of our new products and solutions to-
gether with other companies. If any of these companies were to fail to
perform, we may not be able to bring our products and solutions to
market successfully or in a timely way and this could have a material
adverse impact on our sales and profitability.
• Our operations rely on complex and highly centralized information
technology systems and networks. If any system or network disruption
occurs, this reliance could have a material adverse impact on our oper-
ations, sales and operating results.
• Our products and solutions include increasingly complex technology
involving numerous new Nokia patented and other proprietary tech-
nologies, as well as some developed or licensed to us by certain third
parties. As a consequence, evaluating the protection of the technologies
we intend to use is more and more challenging, and we expect increasing-
ly to face claims that we have infringed third parties’ intellectual prop-
erty rights. The use of increasingly complex technology may also result
in increased licensing costs for us, restrictions on our ability to use certain
technologies in our products and solution offerings, and/or costly and
time-consuming litigation. Third parties may also commence actions
seeking to establish the invalidity of intellectual property rights on
which we depend.
• If we are unable to recruit, retain and develop appropriately skilled
employees, we may not be able to implement our strategies and, con-
sequently, our results of operations may suffer.
• The global networks business relies on a limited number of customers
and large multi-year contracts. Unfavorable developments under such
a contract or in relation to a major customer may affect our sales, our
results of operations and cash flow adversely.
• Our sales derived from, and assets located in, emerging market countries
may be adversely affected by economic, regulatory and political devel-
opments in those countries. As sales from these countries represent an
increasing portion of our total sales, economic or political turmoil in
these countries could adversely affect our sales and results of operations.
Our investments in emerging market countries may also be subject to
other risks and uncertainties.
• Our sales, costs and results are affected by exchange rate fluctuations,
particularly between the euro, which is our reporting currency, and the
US dollar, the UK pound sterling and the Japanese yen as well as certain
other currencies.

Nokia in 2004 67
• Customer financing to network operators can be a competitive require-
ment and could affect our sales, results of operations, balance sheet
and cash flow adversely.
• Allegations of health risks from the electromagnetic fields generated
by base stations and mobile devices, and the lawsuits and publicity relat-
ing to them, regardless of merit, could affect our operations negatively
by leading consumers to reduce their use of mobile devices or by causing
us to allocate monetary and personnel resources to these issues.
• An unfavorable outcome of litigation could materially impact our busi-
ness, financial condition or results of operations.
• Changes in various types of regulation in countries around the world
could affect our business adversely.
• Our share price has been and may continue to be volatile in response to
conditions in the global securities markets generally and in the com-
munications and technology sectors in particular.
We file an annual report on Form 20-F with the US Securities and Exchange
Commission, which report also includes a description of risk factors that
may affect us. Nokia filed its Form 20-F annual report for the year ended
December 31, 2004 on March 8, 2005. For further information please refer
to our Form 20-F annual report.
R i s k fa c to r s

68 Nokia in 2004
C o r p o ra te g o ve r n a n ce
Pursuant to the provisions of the Finnish Companies Act and our articles of
association, the control and management of Nokia is divided among the
shareholders in a general meeting, the Board of Directors and the Group
Executive Board. Our articles of association provide for a Group Executive
Board, which is responsible for managing the operations of Nokia. The
Chairman and the members of the Group Executive Board are elected by
the Board of Directors. Only the Chairman of the Group Executive Board can
be a member of both the Board of Directors and the Group Executive Board.
The Board of DirectorsThe operations of the company are managed under the direction of the
Board of Directors, within the framework set by the Finnish Companies Act
and our articles of association and the complementary Corporate Governance
Guidelines and related charters as adopted by the Board.
The responsibilities of the Board of Directors
The Board of Directors represents and is accountable to the shareholders of
the company. The Board’s responsibilities are active and not passive and
include the responsibility to regularly evaluate the strategic direction of
the company, management policies and the effectiveness with which man-
agement implements its policies. The Board’s responsibilities further
include overseeing the structure and composition of the company’s top
management and monitoring legal compliance and the management of
risks related to the company’s operations. In doing so the Board may set
out annual ranges and/or individual limits for capital expenditures, invest-
ments and divestitures and financial commitments not to be exceeded with-
out Board approval.
The Board has the responsibility for appointing and discharging the
Chief Executive Officer and the President and the other members of the
Group Executive Board. Subject to the requirements of Finnish law, the inde-
pendent directors of the Board will confirm the compensation and the em-
ployment conditions of the Chief Executive Officer and the President upon
the recommendation of the Personnel Committee. The compensation and
employment conditions of the other members of the Group Executive
Board are approved by the Personnel Committee.
The basic responsibility of the members of the Board is to act in good
faith and with due care so as to exercise their business judgment on an
informed basis in what they reasonably and honestly believe to be the
best interests of the company and its shareholders. In discharging that
obligation, the directors must inform themselves of all relevant informa-
tion reasonably available to them.
Election, composition and meetings of the Board of Directors
Pursuant to the articles of association, Nokia Corporation has a Board of
Directors composed of a minimum of seven and a maximum of ten members.
The members of the Board are elected for a term of one year at each Annual
General Meeting, which convenes each March or April. Since the Annual
General Meeting held on March 25, 2004, the Board has consisted of eight
members. Nokia’s CEO, Mr. Jorma Ollila, also serves as the Chairman of the
Board. The other members of the Board are all non-executive and inde-
pendent as defined in the Finnish rules and regulations. The Board con-
vened nine times during 2004, three of the meetings were held in the form
of a conference call, and the average ratio of attendance at the meetings was
100%. The non-executive directors meet without executive directors twice
a year, or more often as they deem appropriate. Such sessions are presided
over by the Vice Chairman of the Board or, in his absence, the most senior
non-executive member of the Board. In addition, the independent direc-
tors meet separately at least annually. The Board and each committee also
has the power to hire independent legal, financial or other advisors as it
deems necessary.
The Board elects a Chairman and a Vice Chairman from among its mem-
bers for one term at a time. On March 25, 2004 the Board resolved that Mr.
Jorma Ollila should continue to act as Chairman and that Mr. Paul J. Collins
should continue to act as Vice Chairman. The Board also appoints the
members and the chairmen for its committees from among its non-executive,
independent members for one term at a time.
Under Finnish law, if the roles of the Chairman and the Chief Executive
Officer are combined, the company must have a President. The responsibil-
ities of the President are defined in the Finnish Companies Act and other
relevant legislation along with any additional guidance and instructions
given from time to time by the Board and the Chief Executive Officer. The
responsibilities of the Chief Executive Officer are determined by the Board.
The Board and each of its committees conducts annual performance self-
evaluations, the results of which are discussed in the committees, respec-
tively, and in the full Board. The Corporate Governance Guidelines concerning
the directors’ responsibilities, the composition and selection of the Board,
Board committees and certain other matters relating to corporate govern-
ance are available on our website, www.nokia.com.
Committees of the Board of Directors
The Audit Committee consists of a minimum of three members of the
Board, who meet all applicable independence, financial literacy and other
requirements of Finnish law and the rules of the stock exchanges where
Nokia shares are listed, including the Helsinki Exchanges and the New York
Stock Exchange. Since March 25, 2004, the Committee has consisted of the
following three members of the Board: Messrs. Per Karlsson (Chairman),
Georg Ehrnrooth and Arne Wessberg.
The Audit Committee is established by the Board primarily for the purpose
of overseeing the accounting and financial reporting processes of the
company and audits of the financial statements of the company. The Com-
mittee is responsible for assisting the Board’s oversight of (1) the quality
and integrity of the company’s financial statements and related disclosure,
(2) the external auditor’s qualifications and independence, (3) the perform-
ance of the external auditor subject to the requirements of Finnish law, (4)
the performance of the company’s internal controls and risk management
and assurance function, and (5) the company’s compliance with legal and
regulatory requirements. The Committee also maintains procedures for
the receipt, retention and treatment of complaints received by the company
regarding accounting, internal controls, or auditing matters and for the
confidential, anonymous submission by employees of the company of con-
cerns regarding accounting or auditing matters.
Under Finnish law, our external auditor is elected by our shareholders
at the Annual General Meeting. The Committee makes a recommendation
to the shareholders in respect of the appointment of the external auditor
based upon its evaluation of the qualifications and independence of the
auditor to be proposed for election or re-election. The Committee meets at
least four times per year based upon a schedule established at the first
meeting following the appointment of the Committee. The Committee
meets separately with the representatives of the management and the
external auditor at least twice a year. The Audit Committee convened

Nokia in 2004 69
C o r p o ra te G o ve r n a n ce
three regular meetings and one extended regular meeting in 2004.
The Personnel Committee consists of a minimum of three members
of the Board, who meet all applicable independence requirements of Finnish
law and the rules of the stock exchanges where Nokia shares are listed,
including the Helsinki Exchanges and the New York Stock Exchange. Since
March 25, 2004, the Personnel Committee has consisted of the following
three members of the Board: Mr. Paul J. Collins (Chairman), Dame Marjorie
Scardino and Mr. Vesa Vainio.
The primary purpose of the Personnel Committee is to oversee the per-
sonnel policies and practices of the company. It assists the Board in dis-
charging its responsibilities relating to all compensation, including equity
compensation, of the company’s executives and the terms of employment
of the same. The Committee has overall responsibility for evaluating, resolv-
ing and making recommendations to the Board regarding (1) compensation
of the company’s top executives and their employment conditions, (2) all
equity-based plans, (3) incentive compensation plans, policies and programs
of the company affecting executives, and (4) other significant incentive
plans. The Committee is responsible for ensuring that the above compen-
sation programs are performance-based, properly motivate management,
support overall corporate strategies and align with shareholders’ interests.
The Committee is responsible for the review of senior management develop-
ment and succession plans. The Personnel Committee convened three times
in 2004.
The Corporate Governance and Nomination Committee consists of
three to five members of the Board, who meet all applicable independence
requirements of Finnish law and the rules of the stock exchanges where
Nokia shares are listed, including the Helsinki Exchanges and the New York
Stock Exchange. Since March 25, 2004, the Corporate Governance and Nom-
ination Committee has consisted of the following three members of the
Board: Dame Marjorie Scardino (Chairman), Mr. Paul J. Collins and Mr. Vesa
Vainio.
The Corporate Governance and Nomination Committee’s purpose is (1)
to prepare the proposals for the general meetings in respect of the compo-
sition of the Board along with the director remuneration to be approved
by the shareholders, and (2) to monitor issues and practices related to corpo-
rate governance and to propose necessary actions in respect thereof.
The Committee fulfills its responsibilities by (i) actively identifying indi-
viduals qualified to become members of the Board, (ii) recommending to
the shareholders the director nominees for election at the Annual General
Meetings, (iii) monitoring significant developments in the law and practice
of corporate governance and of the duties and responsibilities of directors
of public companies, (iv) assisting the Board and each committee of the
Board in its annual performance self-evaluation, including establishing
criteria to be used in connection with such evaluation, and (v) developing
and recommending to the Board and administering the Corporate Govern-
ance Guidelines of the company. The Corporate Governance and Nomination
Committee convened five meetings in 2004.
The charters of each of the committees are available on our website,
www.nokia.com.
Proposal of the Corporate Governanceand Nomination Committee of the BoardOn January 27, 2005, we announced the proposal of the Corporate Govern-
ance and Nomination Committee to the Annual General Meeting convening
on April 7, 2005 regarding the election of the members of the Board of Direc-
tors. The Corporate Governance and Nomination Committee will propose
to the Annual General Meeting that the number of Board members be in-
creased from eight to ten and that all of the present members be re-elected
for a term of one year. In addition, the Committee will propose that Mr. Dan
Hesse and Mr. Edouard Michelin be elected as new members of the Board
of Directors for the same one-year term. Mr. Hesse is a member of the
Board of Directors of Terabeam Wireless, a US based telecommunications
technology and services company. Mr. Michelin is the CEO of Michelin Group,
the French world-leading tire manufacturing company.
Management and corporate governance practicesWe have a company Code of Conduct which is equally applicable to all of
our employees, directors and management and is accessible at our web-
site, www.nokia.com. As well, we have a Code of Ethics for the Principal
Executive Officers and the Senior Financial Officers. For more information
about our Code of Ethics, please see www.nokia.com.
Nokia’s corporate governance practices comply with the Corporate
Governance Recommendation for Listed Companies approved by the Hel-
sinki Exchanges in December 2003, effective as of July 1, 2004. The Recom-
mendation recommends a company to describe the manner in which the
internal audit function of the company is organized. As Nokia has compre-
hensive risk management and internal control processes in place, there is
no separate internal audit function at Nokia.
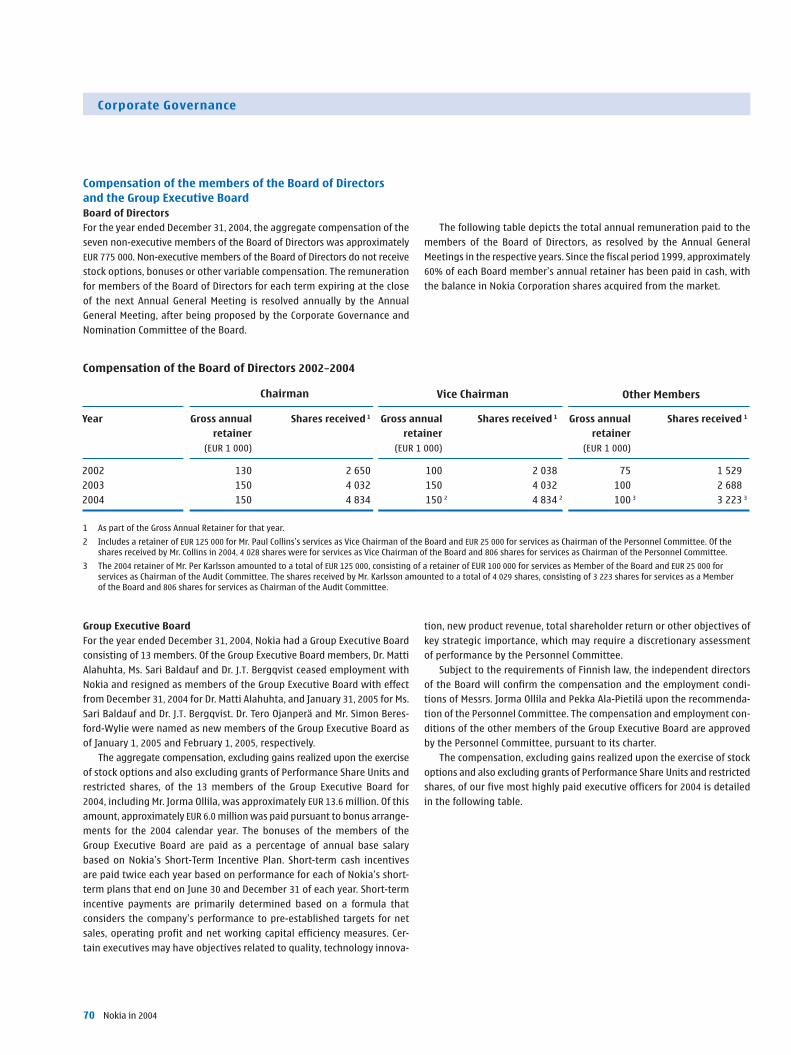
70 Nokia in 2004
C o r p o ra te G o ve r n a n ce
Compensation of the members of the Board of Directorsand the Group Executive BoardBoard of Directors
For the year ended December 31, 2004, the aggregate compensation of the
seven non-executive members of the Board of Directors was approximately
EUR 775 000. Non-executive members of the Board of Directors do not receive
stock options, bonuses or other variable compensation. The remuneration
for members of the Board of Directors for each term expiring at the close
of the next Annual General Meeting is resolved annually by the Annual
General Meeting, after being proposed by the Corporate Governance and
Nomination Committee of the Board.
Group Executive Board
For the year ended December 31, 2004, Nokia had a Group Executive Board
consisting of 13 members. Of the Group Executive Board members, Dr. Matti
Alahuhta, Ms. Sari Baldauf and Dr. J.T. Bergqvist ceased employment with
Nokia and resigned as members of the Group Executive Board with effect
from December 31, 2004 for Dr. Matti Alahuhta, and January 31, 2005 for Ms.
Sari Baldauf and Dr. J.T. Bergqvist. Dr. Tero Ojanperä and Mr. Simon Beres-
ford-Wylie were named as new members of the Group Executive Board as
of January 1, 2005 and February 1, 2005, respectively.
The aggregate compensation, excluding gains realized upon the exercise
of stock options and also excluding grants of Performance Share Units and
restricted shares, of the 13 members of the Group Executive Board for
2004, including Mr. Jorma Ollila, was approximately EUR 13.6 million. Of this
amount, approximately EUR 6.0 million was paid pursuant to bonus arrange-
ments for the 2004 calendar year. The bonuses of the members of the
Group Executive Board are paid as a percentage of annual base salary
based on Nokia’s Short-Term Incentive Plan. Short-term cash incentives
are paid twice each year based on performance for each of Nokia’s short-
term plans that end on June 30 and December 31 of each year. Short-term
incentive payments are primarily determined based on a formula that
considers the company’s performance to pre-established targets for net
sales, operating profit and net working capital efficiency measures. Cer-
tain executives may have objectives related to quality, technology innova-
Year Gross annual Shares received 1 Gross annual Shares received 1 Gross annual Shares received 1
retainer retainer retainer
(EUR 1 000) (EUR 1 000) (EUR 1 000)
2002 130 2 650 100 2 038 75 1 529
2003 150 4 032 150 4 032 100 2 688
2004 150 4 834 150 2 4 834 2 100 3 3 223 3
Other MembersChairman Vice Chairman
1 As part of the Gross Annual Retainer for that year.
2 Includes a retainer of EUR 125 000 for Mr. Paul Collins’s services as Vice Chairman of the Board and EUR 25 000 for services as Chairman of the Personnel Committee. Of theshares received by Mr. Collins in 2004, 4 028 shares were for services as Vice Chairman of the Board and 806 shares for services as Chairman of the Personnel Committee.
3 The 2004 retainer of Mr. Per Karlsson amounted to a total of EUR 125 000, consisting of a retainer of EUR 100 000 for services as Member of the Board and EUR 25 000 forservices as Chairman of the Audit Committee. The shares received by Mr. Karlsson amounted to a total of 4 029 shares, consisting of 3 223 shares for services as a Memberof the Board and 806 shares for services as Chairman of the Audit Committee.
Compensation of the Board of Directors 2002–2004
tion, new product revenue, total shareholder return or other objectives of
key strategic importance, which may require a discretionary assessment
of performance by the Personnel Committee.
Subject to the requirements of Finnish law, the independent directors
of the Board will confirm the compensation and the employment condi-
tions of Messrs. Jorma Ollila and Pekka Ala-Pietilä upon the recommenda-
tion of the Personnel Committee. The compensation and employment con-
ditions of the other members of the Group Executive Board are approved
by the Personnel Committee, pursuant to its charter.
The compensation, excluding gains realized upon the exercise of stock
options and also excluding grants of Performance Share Units and restricted
shares, of our five most highly paid executive officers for 2004 is detailed
in the following table.
The following table depicts the total annual remuneration paid to the
members of the Board of Directors, as resolved by the Annual General
Meetings in the respective years. Since the fiscal period 1999, approximately
60% of each Board member’s annual retainer has been paid in cash, with
the balance in Nokia Corporation shares acquired from the market.
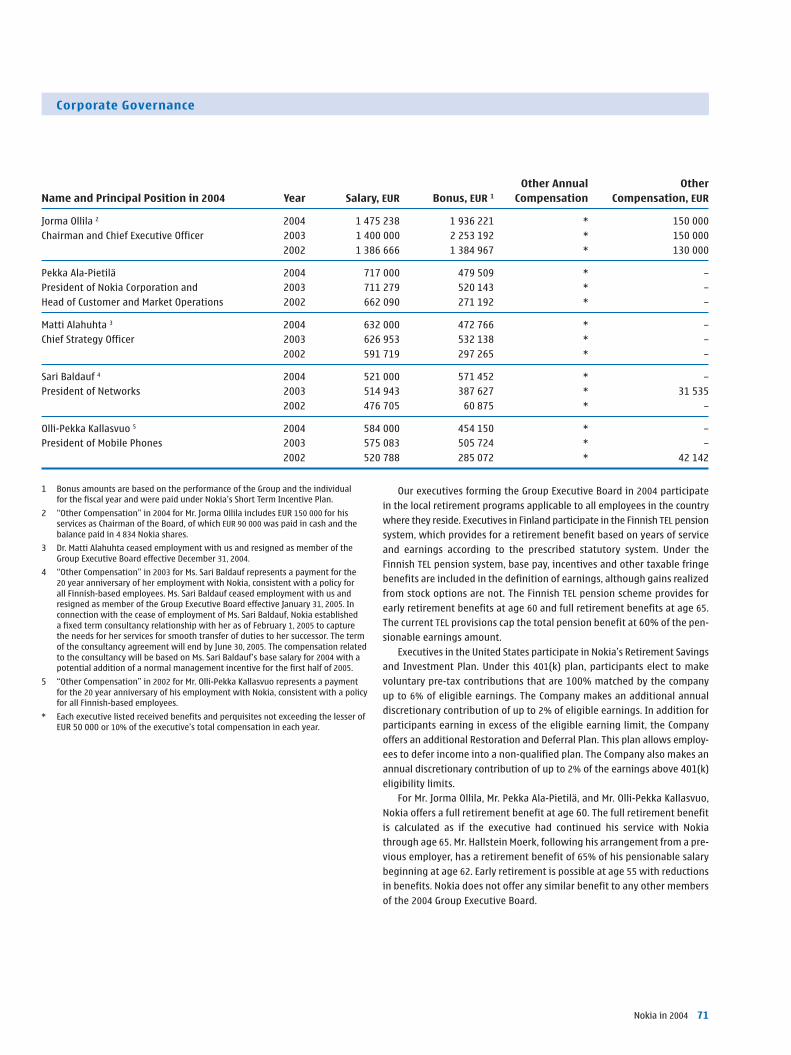
Nokia in 2004 71
Other Annual OtherName and Principal Position in 2004 Year Salary, EUR Bonus, EUR 1 Compensation Compensation, EUR
Jorma Ollila 2 2004 1 475 238 1 936 221 * 150 000
Chairman and Chief Executive Officer 2003 1 400 000 2 253 192 * 150 000
2002 1 386 666 1 384 967 * 130 000
Pekka Ala-Pietilä 2004 717 000 479 509 * –
President of Nokia Corporation and 2003 711 279 520 143 * –
Head of Customer and Market Operations 2002 662 090 271 192 * –
Matti Alahuhta 3 2004 632 000 472 766 * –
Chief Strategy Officer 2003 626 953 532 138 * –
2002 591 719 297 265 * –
Sari Baldauf 4 2004 521 000 571 452 * –
President of Networks 2003 514 943 387 627 * 31 535
2002 476 705 60 875 * –
Olli-Pekka Kallasvuo 5 2004 584 000 454 150 * –
President of Mobile Phones 2003 575 083 505 724 * –
2002 520 788 285 072 * 42 142
1 Bonus amounts are based on the performance of the Group and the individualfor the fiscal year and were paid under Nokia’s Short Term Incentive Plan.
2 “Other Compensation” in 2004 for Mr. Jorma Ollila includes EUR 150 000 for hisservices as Chairman of the Board, of which EUR 90 000 was paid in cash and thebalance paid in 4 834 Nokia shares.
3 Dr. Matti Alahuhta ceased employment with us and resigned as member of theGroup Executive Board effective December 31, 2004.
4 “Other Compensation” in 2003 for Ms. Sari Baldauf represents a payment for the20 year anniversary of her employment with Nokia, consistent with a policy forall Finnish-based employees. Ms. Sari Baldauf ceased employment with us andresigned as member of the Group Executive Board effective January 31, 2005. Inconnection with the cease of employment of Ms. Sari Baldauf, Nokia establisheda fixed term consultancy relationship with her as of February 1, 2005 to capturethe needs for her services for smooth transfer of duties to her successor. The termof the consultancy agreement will end by June 30, 2005. The compensation relatedto the consultancy will be based on Ms. Sari Baldauf’s base salary for 2004 with apotential addition of a normal management incentive for the first half of 2005.
5 “Other Compensation” in 2002 for Mr. Olli-Pekka Kallasvuo represents a paymentfor the 20 year anniversary of his employment with Nokia, consistent with a policyfor all Finnish-based employees.
* Each executive listed received benefits and perquisites not exceeding the lesser ofEUR 50 000 or 10% of the executive’s total compensation in each year.
Our executives forming the Group Executive Board in 2004 participate
in the local retirement programs applicable to all employees in the country
where they reside. Executives in Finland participate in the Finnish TEL pension
system, which provides for a retirement benefit based on years of service
and earnings according to the prescribed statutory system. Under the
Finnish TEL pension system, base pay, incentives and other taxable fringe
benefits are included in the definition of earnings, although gains realized
from stock options are not. The Finnish TEL pension scheme provides for
early retirement benefits at age 60 and full retirement benefits at age 65.
The current TEL provisions cap the total pension benefit at 60% of the pen-
sionable earnings amount.
Executives in the United States participate in Nokia’s Retirement Savings
and Investment Plan. Under this 401(k) plan, participants elect to make
voluntary pre-tax contributions that are 100% matched by the company
up to 6% of eligible earnings. The Company makes an additional annual
discretionary contribution of up to 2% of eligible earnings. In addition for
participants earning in excess of the eligible earning limit, the Company
offers an additional Restoration and Deferral Plan. This plan allows employ-
ees to defer income into a non-qualified plan. The Company also makes an
annual discretionary contribution of up to 2% of the earnings above 401(k)
eligibility limits.
For Mr. Jorma Ollila, Mr. Pekka Ala-Pietilä, and Mr. Olli-Pekka Kallasvuo,
Nokia offers a full retirement benefit at age 60. The full retirement benefit
is calculated as if the executive had continued his service with Nokia
through age 65. Mr. Hallstein Moerk, following his arrangement from a pre-
vious employer, has a retirement benefit of 65% of his pensionable salary
beginning at age 62. Early retirement is possible at age 55 with reductions
in benefits. Nokia does not offer any similar benefit to any other members
of the 2004 Group Executive Board.
C o r p o ra te G o ve r n a n ce

72 Nokia in 2004
Service contracts of the Chairman and CEO and of the PresidentWe have a service contract with each of Mr. Jorma Ollila and Mr. Pekka Ala-
Pietilä, each of an indefinite duration. The Board has also agreed with Mr. Jorma
Ollila on the continuation of his services as CEO of Nokia through 2006.
Mr. Jorma Ollila’s contract has provisions for severance payments for up
to 24 months of compensation (both base compensation and bonus) in the
event of his termination of employment for reasons other than cause, in-
cluding a change of control. As previously mentioned, Mr. Jorma Ollila is
further entitled to a full statutory pension from the date he turns 60 years
of age, instead of the statutory age of 65.
Mr. Pekka Ala-Pietilä’s contract has provisions for severance payments
for up to 18 months of compensation (both base compensation and bonus)
in the event of his termination of employment for reasons other than
cause, including a change of control. As previously mentioned, Mr. Pekka
Ala-Pietilä is entitled to a full statutory pension from the date he turns 60
years of age, instead of the statutory age of 65.
Share ownership of the members of the Board of Directorsand the Group Executive BoardThe following tables set forth the number of shares and ADSs beneficially
held by members of the Board of Directors and the Group Executive Board
as of December 31, 2004 (not including the new Group Executive Board
members whose service began on or after January 1, 2005). Of the Group
Executive Board members, Dr. Matti Alahuhta, Ms. Sari Baldauf and Dr. J.T.
Bergqvist ceased employment with Nokia and resigned as members of the
Group Executive Board with effect from December 31, 2004 for Dr. Matti
Alahuhta, and January 31, 2005 for Ms. Sari Baldauf and Dr. J.T. Bergqvist.
Board of Directors, Dec. 31, 2004 Shares 1 ADSs
Jorma Ollila 2 194 222 –
Paul J. Collins – 114 210
Georg Ehrnrooth 3 308 782 –
Bengt Holmström 10 910 –
Per Karlsson 3 12 546 –
Marjorie Scardino – 8 322
Vesa Vainio 21 570 –
Arne Wessberg 8 322 –
Total 556 352 122 532
1 The number of shares includes not only shares acquired as compensation forservices as member of the Board of Directors, but also shares acquired by anyother means.
2 For Mr. Jorma Ollila’s holdings of stock options, see the table under “Stock OptionOwnership of the Group Executive Board, Dec. 31, 2004” below.
3 Mr. Georg Ehrnrooth’s and Mr. Per Karlsson’s holdings include both shares heldpersonally and shares held through a company.
Group Executive Board, Dec. 31, 2004 Shares ADSs
Pekka Ala-Pietilä 49 600 –
Matti Alahuhta 144 200 –
Sari Baldauf 183 200 –
J.T. Bergqvist 60 000 –
Olli-Pekka Kallasvuo 54 000 –
Pertti Korhonen 15 300 –
Mary McDowell – –
Hallstein Moerk 14 100 –
Yrjö Neuvo 74 540 –
Richard Simonson – 20 000
Veli Sundbäck 125 000 –
Anssi Vanjoki 106 000 –
Total 825 940 20 000
On December 31, 2004, the aggregate interest of the members of the
Board of Directors and the Group Executive Board (not including the new
Group Executive Board members whose service began on or after January
1, 2005) in our outstanding share capital was 1 524 824 shares and ADSs,
representing less than 1% of the issued share capital and voting rights in
Nokia Corporation.
C o r p o ra te G o ve r n a n ce

Nokia in 2004 73
C o r p o ra te G o ve r n a n ce
Stock option ownership of the Group Executive Board, Dec. 31, 2004
Number of shares represented by exercisable options, Dec. 31, 2004 1
1999 2001 2001 C 2001 C 2002 2003 2QA, B and C 2 A and B 3Q/01 4Q/01 A and B
Exercise price per share, EUR See note 2 EUR 36.75 EUR 20.61 EUR 26.67 EUR 17.89 EUR 14.95
Jorma Ollila 1 600 000 812 500 – 343 750 562 500 250 000
Pekka Ala-Pietilä 720 000 203 125 – 85 934 140 625 53 125
Matti Alahuhta 900 000 81 250 – 34 375 98 435 37 500
Sari Baldauf 560 000 81 250 – 34 375 98 435 37 500
J.T. Bergqvist 140 000 32 500 – 13 750 39 375 15 625
Olli-Pekka Kallasvuo 560 000 81 250 – 34 375 98 435 37 500
Pertti Korhonen 140 000 24 375 – 10 309 39 375 15 625
Mary McDowell – – – – – –
Hallstein Moerk 144 000 24 375 – 10 309 16 875 6 250
Yrjö Neuvo 400 000 56 875 – 24 059 39 375 12 500
Richard Simonson – – 27 000 – 8 435 3 593
Veli Sundbäck 400 000 32 500 – 13 750 22 500 15 625
Anssi Vanjoki – 56 875 – 24 059 56 250 31 250
1 For information regarding the vesting and expiry of the stock option plans presented in this table, see the table “Outstanding stock option plans, Dec. 31, 2004” on page 44.
2 All of the 1999 stock options expired as of December 31, 2004. The column depicts the total number of allocated stock options 1999 A, B and C, the exercise prices of which wereEUR 16.89 (A), EUR 56.28 (B) and EUR 29.12 (C) per share, respectively.
Number of shares represented by unexercisable options, Dec. 31, 2004
2001 C 2001 C2001 B 3Q/01 4Q/01 2002 B 2003 2Q 2003 4Q 2004 2Q
Exercise price per share, EUR EUR 36.75 EUR 20.61 EUR 26.67 EUR 17.89 EUR 14.95 EUR 15.05 EUR 11.79
Jorma Ollila 187 500 – 156 250 437 500 550 000 – 400 000
Pekka Ala-Pietilä 46 875 – 39 066 109 375 116 875 – 80 000
Matti Alahuhta 18 750 – 15 625 76 565 82 500 – 60 000
Sari Baldauf 18 750 – 15 625 76 565 82 500 – 60 000
J.T. Bergqvist 7 500 – 6 250 30 625 34 375 – 30 000
Olli-Pekka Kallasvuo 18 750 – 15 625 76 565 82 500 – 60 000
Pertti Korhonen 5 625 – 4 691 30 625 34 375 – 50 000
Mary McDowell 0 – – – – 70 000 50 000
Hallstein Moerk 5 625 – 4 691 13 125 13 750 – 30 000
Yrjö Neuvo 13 125 – 10 941 30 625 27 500 – 20 000
Richard Simonson 0 9 000 – 6 565 7 907 – 50 000
Veli Sundbäck 7 500 – 6 250 17 500 34 375 – 30 000
Anssi Vanjoki 13 125 – 10 941 43 750 68 750 – 60 000
On December 31, 2004, the aggregate holdings of exercisable stock options
of members of the Group Executive Board (not including the new Group Ex-
ecutive Board members whose service began on or after January 1, 2005)
called for approximately 3.9 million shares, representing less than 1% of
the issued share capital and voting rights in Nokia Corporation.
Management stock option ownershipThe following tables provide certain information relating to stock options
held by members of the Group Executive Board as of December 31, 2004
(not including the new Group Executive Board members whose service
began on or after January 1, 2005). These stock options were issued pursu-
ant to our Nokia Stock Option Plans 1999, 2001 and 2003. For a description
of our stock option plans, please see the table “Outstanding stock option
plans, Dec. 31, 2004” on page 44.

74 Nokia in 2004
C o r p o ra te G o ve r n a n ce
Performance Share Unit and restricted share ownershipPerformance Share Units
The following table provides certain information relating to Performance
Share Units held by members of the Group Executive Board as of December
31, 2004 (not including the new Group Executive Board members whose
service began on or after January 1, 2005). These Performance Share Units
were issued under the 2004 Nokia Equity Program. For a description of our
performance share plan, please see “Nokia’s equity based incentive plans”
on pages 43–44.
Granted Amounts of MaximumPerformance Share Units 1, 3 number of shares 2, 3
Jorma Ollila 100 000 400 000
Pekka Ala-Pietilä 20 000 80 000
Matti Alahuhta 15 000 60 000
Sari Baldauf 15 000 60 000
J. T. Bergqvist 7 500 30 000
Olli-Pekka Kallasvuo 15 000 60 000
Pertti Korhonen 12 500 50 000
Mary McDowell 12 500 50 000
Hallstein Moerk 7 500 30 000
Yrjö Neuvo 5 000 20 000
Richard Simonson 12 500 50 000
Veli Sundbäck 7 500 30 000
Anssi Vanjoki 15 000 60 000
Total 245 000 980 000
1 The Grant Amount vests as Nokia shares, if threshold level performance ismet for both the EPS growth and Average Annual Net Sales growth criteria.No Performance Share Units shall vest as Nokia shares, if the threshold levelperformance is not met for any of the EPS or Average Annual Net Sales criterion.
2 The maximum number of Performance Share Units shall vest as Nokia sharesprovided that the maximun performance level is achieved for both of the EPSand Average Annual Net Sales growth criteria.
3 The closing market price of the Nokia share on the Helsinki Exchanges as ofDecember 31, 2004 was EUR 11.62.
Restricted shares
The following table provides certain information relating to restricted
shares held by members of the Group Executive Board as of December 31,
2004 (not including the new Group Executive Board member whose service
began on or after January 1, 2005). For a description of our restricted share
plans, please see “Nokia’s equity based incentive plans” on pages 43–44.
Number of restricted Number of restricted shares 2004 2, 3 shares 2003 1, 3
Jorma Ollila – 100 000
Pekka Ala-Pietilä – 35 000
Matti Alahuhta – 35 000
Sari Baldauf – 35 000
J. T. Bergqvist – 10 000
Olli-Pekka Kallasvuo – 35 000
Pertti Korhonen 35 000 25 000
Mary McDowell – 20 000
Hallstein Moerk 26 000 20 000
Richard Simonson 33 250 25 000
Veli Sundbäck – 20 000
Anssi Vanjoki – 35 000
Total 94 250 395 000
1 Restriction period end date (Vesting Date) October 1, 2006.
2 Restriction period end date (Vesting Date) April 1, 2007.
3 The closing market price of the Nokia share on the Helsinki Exchanges as ofDecember 31, 2004 was EUR 11.62.

Nokia in 2004 75
Nokia’s Equity Based Compensation ProgramsFor a description of Nokia’s equity based compensation programs as of
December 31, 2004 to which also members of the Group Executive Board
participate, please see pages 43–44. The stock option plans have been ap-
proved by the Annual General Meetings in the year of the launch of the
plan.
Nokia’s Equity Based Compensation Program 2005
The Board of Directors announced its proposed design for the 2005 Equity
Program on January 27, 2005. The Equity Program 2005 follows the design
of the 2004 Equity Program. The primary equity elements in 2005 will be
performance shares for the wide number of employees, stock options to a
more limited population, and a continued, very limited usage of restricted
shares for high potential and critical employees. The key elements of the
proposed Equity Program 2005 are:
• The performance criteria for the 2005 Performance Share Plan, running
for a performance period of 4 years, are:
1) Average Annual Net Sales Growth: 3% (threshold) and 12%
(maximum), and
2) Annual EPS Growth: EUR 0.82 (threshold) and EUR 1.33 in 2008
(maximum).
EPS growth is calculated based on the compounded annual growth rate
over the full performance period (2005–2008) compared to 2004 EPS of 0.70.
The maximum performance level for both criteria will result in the
vesting of the maximum of 18.8 million Nokia shares. If the threshold
levels of performance are not achieved, none of the Performance Share
Units will vest. For performance between the threshold and maximum
performance levels the payout follows a linear scale.
• It is our intent to grant Performance Share Units to a similar target
group and amounting to a similar number also in 2006. We have also
reserved a pool of units, to be used for grants within the anticipated
annual grant cycle in 2006 as well as for recruiting and special reten-
tion needs for 2005 and 2006 combined. This amount may result in a
maximum payout of 31.2 million Nokia shares.
• We intend to grant 8.5 million stock options in 2005, each entitling to a
subscription of one Nokia share. Our intent is to grant a similar amount
also in 2006. We have reserved an additional pool of stock options to
be used for grants within the anticipated annual grant cycle in 2006 as
well as for recruiting and special retention needs, for 2005 and 2006
combined. The Equity Program 2005 includes a proposal by the Board
of Directors to Nokia’s Annual General Meeting 2005 for the approval of
a new two-year stock option plan amounting to a maximum of 25 million
stock options, permitting these plans.
• The maximum number of restricted shares that we intend to grant during
2005 is 3.5 million. Our intent is to grant a similar amount in 2006. We
have also reserved a pool of restricted shares to be used for special
needs in 2005 and 2006. This amount may result in a maximum payout
of 9 million Nokia shares.
Stock ownership guidelines for executive managementThe goal of our long-term, equity-based incentive awards is to recognize
progress towards the achievement of our strategic objectives, and to focus
executives on building value for shareholders. In addition to stock option
grants, we encourage stock ownership by our top executives. In January
2001, we introduced a stock ownership commitment guideline with mini-
mum recommendations tied to annual fixed salaries. For the members of
the Group Executive Board, the recommended minimum investment in our
shares corresponds to two times the member’s annual base salary, to be
fulfilled by January 2006. In the case of the new Group Executive Board
members whose service began after the original 2001 guidelines were estab-
lished, this requirement is replaced by the requirement to retain after-tax
equity gains in shares until the same minimum investment level applicable
to the other Group Executive Board members is met.
Insiders’ trading in securitiesThe Board of Directors has established a policy in respect of insiders’ trading
in Nokia securities. Under the policy, the holdings of Nokia securities by
the primary insiders (as defined) are public information, which is available
in the Finnish Central Securities Depositary and on the company’s website.
As well, both primary insiders and secondary insiders (as defined) are subject
to a number of trading restrictions and rules, including among other
things, prohibitions on trading in Nokia securities during the three-week
“closed-window” period immediately preceding the disclosure of our
quarterly results and the four-week “closed-window” period immediately
preceding the disclosure of our annual results. In addition, the company may
set trading restrictions based on project participation. We update our in-
sider trading policy from time to time and monitor our insiders’ compli-
ance with the policy on a regular basis. Nokia’s Insider Policy is in line with
the Helsinki Exchanges Guidelines for Insiders and also sets out require-
ments beyond those guidelines.
C o r p o ra te G o ve r n a n ce

76 Nokia in 2004
Auditor fees and servicesPricewaterhouseCoopers Oy served as Nokia’s independent public auditor
for the fiscal year ended December 31, 2004. The auditor is elected annually
by the Annual General Meeting. The Audit Committee of the Board of Direc-
tors will propose to the Annual General Meeting convening on April 7, 2005
that PricewaterhouseCoopers Oy be elected as the auditor for 2005.
The following table presents the aggregate fees for professional services
and other services rendered by PricewaterhouseCoopers to Nokia in 2004
and 2003.
EURm 2004 2003
Audit Fees 1 4.2 4.8
Audit-related Fees 2 1.0 0.9
Tax Fees 3 5.0 6.0
All Other Fees 4 0.3 0.7
Total 10.5 12.4
1 Audit Fees consist of fees billed for the annual audit of the company’s consoli-dated financial statements and the statutory financial statements of thecompany’s subsidiaries. They also include fees billed for other audit services,which are those services that only the external auditor reasonably can provide,and include the provision of comfort letters and consents and the review ofdocuments filed with the SEC and other capital markets or local financial reportingregulatory bodies.
2 Audit-related Fees consist of fees billed for assurance and related services thatare reasonably related to the performance of the audit or review of the company’sfinancial statements or that are traditionally performed by the external auditor,and include consultations concerning financial accounting and reportingstandards; internal control reviews; advice and assistance in connection with localstatutory accounting requirements; due diligence related to acquisitions; andemployee benefit plan audits and reviews; and miscellaneous reports inconnection with grant applications.
3 Tax Fees include fees billed for tax compliance services, including the preparationof original and amended tax returns and claims for refund; tax consultations, suchas assistance and representation in connection with tax audits and appeals, taxadvice related to mergers and acquisitions, transfer pricing, and requests forrulings or technical advice from taxing authorities; tax planning services; andexpatriate tax compliance, consultation and planning services.
4 All Other Fees include fees billed for forensic accounting and occasional trainingservices and, in 2004 only, for advisory services in connection with the outsourcingof an operational process.
Audit Committee pre-approval policies and procedures
The Audit Committee of Nokia’s Board of Directors is responsible, among
other matters, for the oversight of the external auditor subject to the require-
ments of Finnish law. The Audit Committee has adopted a policy regarding
pre-approval of audit and permissible non-audit services provided by our
independent auditors (the “Policy”).
Under the Policy, proposed services either (i) may be pre-approved by
the Audit Committee without consideration of specific case-by-case services
(“general pre-approval”); or (ii) require the specific pre-approval of the Au-
dit Committee (“specific pre-approval”). The Audit Committee may dele-
gate either type of pre-approval authority to one or more of its members.
The appendices to the Policy set out the audit, audit-related, tax and other
services that have received the general pre-approval of the Audit Committee,
which services are subject to annual review by the Audit Committee. All
other services, including all internal control related services, must receive a
specific pre-approval from the Audit Committee.
The Audit Committee establishes budgeted fee levels annually for each
of the four categories of audit and non-audit services that are pre-approved
under the Policy, namely, audit, audit-related, tax and other services. Re-
quests or applications to provide services that require specific approval by
the Audit Committee are submitted to the Audit Committee by both the
external auditor and the Chief Financial Officer. At each regular meeting of
the Audit Committee, the external auditor provides a report in order for
the Audit Committee to review the services that the external auditor is
providing, as well as the status and cost of those services.
C o r p o ra te G o ve r n a n ce

Nokia in 2004 77
I nve s to r i n fo r m a t i o n
Annual General MeetingDate: Thursday April 7, 2005 at 3.00 pm
Address: Hartwall Areena, Veturitie 13, Helsinki, Finland
DividendDividend proposed by the Board of Directors for 2004 is EUR 0.33.
The dividend record date is proposed to be April 12, 2005 and pay date
April 22, 2005
Financial reportingNokia’s quarterly reports in 2005 are planned for April 21, July 21, and
October 20. The 2005 results will be published in January 2006 and the
financial statements in March 2006.
Stock exchangesThe shares of Nokia Corporation are quoted on the following stock exchanges:
Symbol Trading
currency
HEX, Helsinki (quoted since 1915) NOK1V EUR
Stockholmsbörsen (1983) NOKI SEK
Frankfurter Wertpapierbörse (1988) NOA3 EUR
New York Stock Exchange (1994) NOK USD
List of indices
NOK1V NOKI NOK
HEX HEX General Index OMX Stockholm NYA NYSE Composite
HEXTELE HEX Telecommunications GENX Swedish General NNA NYSE Utilities
HEX 25 HEX 25 Index GENX04 Swedish Engineer NN NYSE Utilities
BE500 Bloomberg Europe GENX16 Swedish SX 16 Index CTN CSFB Technology
BETECH BBG Europe Technology MLO Merrill Lynch Tech 10
SX5E DJ Euro STOCXX 50
SX5P DJ Europe STOXX
SX__ Various other DJ Indices
E300 FTSE Eurotop 300
Information on the Internetwww.nokia.com/investor
Investor relations [email protected]
Nokia Investor Relations Nokia Investor Relations
P.O. Box 226 709 Westchester Ave.
FIN-00045 NOKIA GROUP White Plains, NY 10604
Finland USA
Tel. + 358 7180 34927 Tel. +1 914 368 0555
Fax +358 7180 38787 Fax +1 914 368 0600
It should be noted that certain statements herein which are not historical facts, including, without limitation, those regarding: A) the timing of product and solution deliveries; B) our ability to develop, implement and
commercialize new products, solutions and technologies; C) expectations regarding market growth, developments and structural changes; D) expectations and targets for our results of operations; E) the outcome of
pending and threatened litigation; and F) statements preceded by ‘’believe,’’ ‘’expect,’’ ‘’anticipate,’’ ‘’foresee’’,‘’target” or similar expressions are forward-looking statements. Because these statements involve risks and
uncertainties, actual results may differ materially from the results that we currently expect. Factors that could cause these differences include, but are not limited to: 1) the extent of the growth of the mobile communi-
cations industry and the new market segments in which we have recently invested; 2) price erosion; 3) timing and success of the introduction and roll-out of new products and solutions; 4) competitiveness of our product
portfolio; 5) our failure to identify key market trends and to respond timely and successfully to the needs of our customers; 6) the impact of changes in technology and the success of our product and solution development;
7) the intensity of competition in the mobility industry and changes in the competitive landscape; 8) our ability to control the variety of factors affecting our ability to reach our targets and give accurate forecasts; 9) the
availability of new products and services by network operators and other market participants; 10) general economic conditions globally and in our most important markets; 11) our success in maintaining efficient man-
ufacturing and logistics as well as the high quality of our products and solutions; 12) inventory management risks resulting from shifts in market demand; 13) our ability to source quality components without
interruption and at acceptable prices; 14) our success in collaboration arrangements relating to technologies, software or new products and solutions; 15) the success, financial condition, and performance of our collab-
oration partners, suppliers and customers; 16) any disruption to information technology systems and networks that our operations rely on; 17) our ability to have access to the complex technology involving patents and
other intellectual property rights included in our products and solutions at commercially acceptable terms and without infringing any protected intellectual property rights; 18) our ability to recruit, retain and develop
appropriately skilled employees; 19) developments under large, multi-year contracts or in relation to major customers; 20) exchange rate fluctuations, including, in particular, fluctuations between the euro, which is our
reporting currency, and the US dollar, the UK pound sterling and the Japanese yen; 21) the management of our customer financing exposure; and 22) the impact of changes in government policies, laws or regulations; as
well as 23) the risk factors specified on pages 12–22 of the company’s Form 20-F for the year ended December 31, 2004 under “Item 3.D Risk Factors.”
Available on the Internet: financial reports, Nokia management’s
presentations, conference call and other investor related material,
press releases as well as environmental and social information.

78 Nokia in 2004
G e n e ra l co nt a c t i n fo r m a t i o n
Nokia Head Office
Keilalahdentie 2–4
FIN-02150 Espoo
P.O. Box 226
FIN-00045 Nokia Group
Finland
Tel. +358 (0) 7180 08000
Fax +358 (0) 7180 38226
Nokia Americas
6000 Connection Drive
Irving, Texas
75039
USA
Tel. +1 972 894 5000
Fax +1 972 894 5106
Nokia Asia-Pacific
438B Alexandra Road #07–00
Alexandra Technopark
Singapore 119968
Tel. +65 6723 2323
Fax +65 6723 2324

Nokia in 2004 79


© Nokia 2005. Nokia and Nokia Connecting People are registered trademarks of Nokia Corporation.
Paper: Galerie Art Silk 115 g/m2
Cover: Galerie Art Silk 300 g/m2
Printed matter
Design: Louise Boström Oy. Sävypaino ISO 9001, 2005.

Cop
yri
gh
t ©
20
05
. N
ok
ia C
orp
or a
tio
n.
Al l
rig
hts
re
serv
ed
.N
ok
ia a
nd
No
kia
Co
nn
ect
ing
Pe
op
l e a
re r
eg
iste
red
tra
de
ma
rks
of
No
kia
Co
rpo
rati
on
.