Embed Size (px)
Citation preview

2010 ZEECO, INC. ZEECO, INC.
Noise Testing and Prediction Methods for Multi-Point Ground Flares
Justin RobertsFlare Applications Engineer, Zeeco
American Flame Research Committee (AFRC)Industrial Combustion Symposium
September 14, 2016Koloa, Kauai, Hawaii

ZEECO, INC.
Overview of Multi-Point Ground Flares
Developed in the 1970’s, Multi-Point Ground Flares derive their name from
their physical layout.
Instead of the flare flame being on an elevated structure, the flame is spread
out in a grade mounted field of multiple pressure assisted flare tips.
The tips are then arranged in stages that open as the upstream pressure and
gas flow increases and close as pressure and flow decreases.

ZEECO, INC.
What is Noise?
Noise can be defined as excessive or unwanted sound. In
general, any sound that is annoying, interferes with speech,
damages the hearing, or reduces concentration or work
efficiency may be considered noise.
It is often characterized by its intensity which is measured in
decibels.
A decibel (dB) is a log base scale developed to quantify
sound.
There are two common uses of decibel levels. One is sound
power (PWL) and the other is sound pressure (SPL).

ZEECO, INC.
What is Noise?
Sound power (PWL) or acoustic power is the rate at
which sound energy is emitted, reflected, transmitted or
received, per unit time.
Sound pressure (SPL) or acoustic pressure is the local
pressure deviation from the ambient atmospheric
pressure, caused by a sound wave.
The sound pressure scale usually ranges from 0 to 140
dB. The 0 value of the scale occurs when sound
pressure equals the threshold of human hearing.

ZEECO, INC.
What is Noise?
Many times noise values are A-Weighted, which means
the noise level has been modified to de-emphasize the low
and very high frequencies which pose less of a risk to
hearing.
In this presentation, all noise values will be shown as
unweighted unless stated otherwise.
In addition, when a noise varies over time, the “Leq” is the
equivalent continuous sound which would contain the
same sound energy as the time varying sound. In
essence, this is the average measurement over a duration
of time.

2010 ZEECO, INC. ZEECO, INC.
Test Setup

ZEECO, INC.
Testing was conducted at Zeeco’s test facility in
Broken Arrow, Oklahoma on one MPGF flare tip.
Noise measurements were recorded at distances
of 100’-0” and 200’-0” to the East of the flare tip
using two Norsonics NOR140 Type I noise
meters.
One meter was placed at each distance to
measure simultaneously during the test points.
Each measurement point lasted 60 seconds.
In order to minimize the amount of background
noise, testing was conducted at night with all non-
essential equipment (compressors, forklifts, etc.)
shut off to avoid contamination of the noise
results.
Test Setup

ZEECO, INC.
The test fuels used were Tulsa Natural Gas
(TNG) and Propane.
Gas flow was measured using a 4-inch orifice run.
Tip pressure and gas temperature were also
recorded for secondary flow measurement
verification.
All data was recorded simultaneously using a
data acquisition system (DAQ).
A weather station was also connected to the DAQ
that measured wind speed, wind direction,
ambient temperature, barometric pressure, and
relative humidity throughout the entire test, which
allowed for accurate accounting of atmospheric
attenuation in the analysis.
Test Setup

2010 ZEECO, INC. ZEECO, INC.
Background Noise

ZEECO, INC.
Background Noise To ensure accuracy of the test data, background noise points were taken before
and after testing.
The average ambient sound pressure level was approximately 64 dB.
Ambient noise was dominated by low frequencies.
While every action was taken to reduce ambient noise, proximity to city streets and
highways were uncontrollable factors that likely led to the slightly elevated levels of
low frequency sound.
2010 ZEECO, INC. ZEECO, INC.
Sound Power Levels as a Function of Sonic and Subsonic Flows

ZEECO, INC.
Sound Power Levels as a Function of Sonic and Subsonic Flows All resulting noise data was analyzed on an unweighted basis as sound pressure
levels in 1/3 octave bands at 1-second intervals.
The data presented in this presentation are the computed 60-second Leq 1/3
octave band spectra or the overall (or total) level derived from these 1/3 octave
band spectra.
ZEECO, INC.
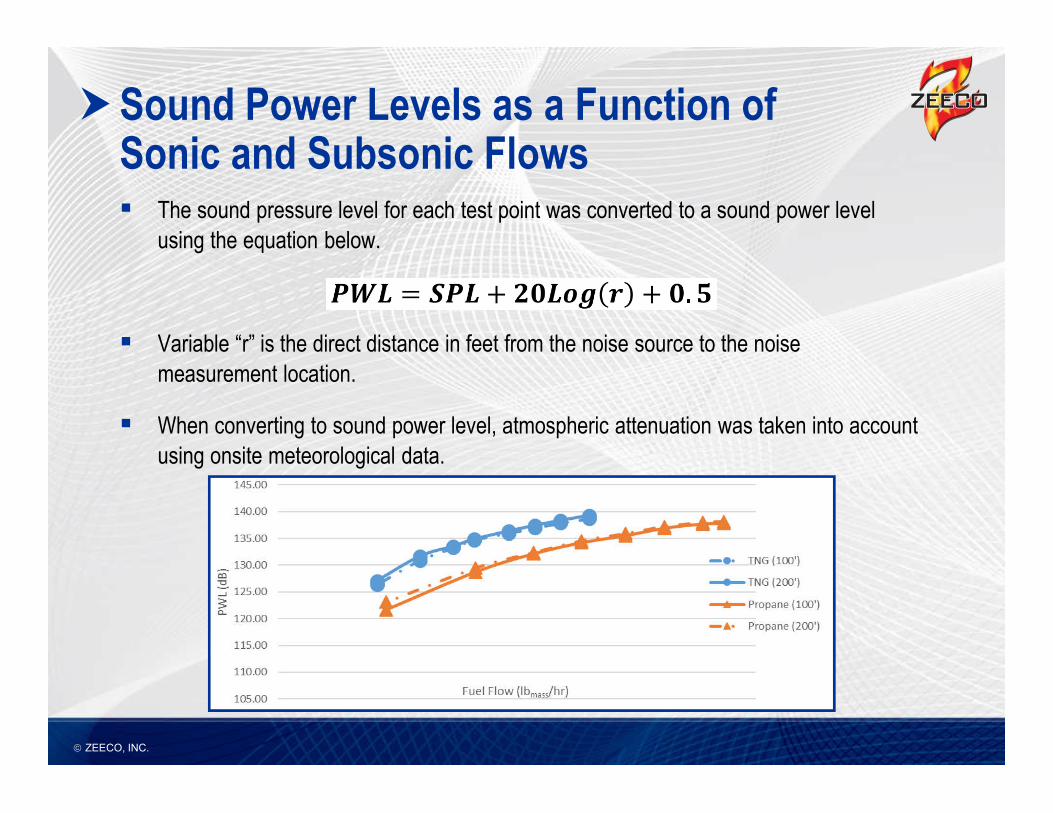
Sound Power Levels as a Function of Sonic and Subsonic Flows The sound pressure level for each test point was converted to a sound power level
using the equation below.
Variable “r” is the direct distance in feet from the noise source to the noise
measurement location.
When converting to sound power level, atmospheric attenuation was taken into account
using onsite meteorological data.

ZEECO, INC.
Sound Power Levels as a Function of Sonic and Subsonic Flows Computed Sound Power Level (PWL) – Tulsa Natural Gas
Computed Sound Power Level (PWL) – Propane
TP#PWL - 60 Second Log Average
100' 200' Δ dB % Diff
1 138.7 139.3 0.6 0.4
2 137.9 138.4 0.5 0.4
3 137.0 137.4 0.5 0.3
4 136.0 136.4 0.4 0.3
5 134.7 134.9 0.1 0.1
6 133.2 133.5 0.3 0.2
7 130.9 131.7 0.8 0.6
8 126.3 127.1 0.8 0.6
Average % Difference 0.5 0.4
TP#PWL - 60 Second Log Average
100' 200' Δ dB % Diff
9 137.8 138.2 0.4 0.3
10 137.7 138.0 0.3 0.2
11 136.9 137.2 0.3 0.2
12 135.5 135.9 0.4 0.3
13 134.2 134.6 0.4 0.3
14 132.1 132.4 0.3 0.2
15 128.7 129.5 0.8 0.6
16 121.7 123.1 1.5 1.2
Average % Difference 0.5 0.4

ZEECO, INC.
Sound Power Levels as a Function of Sonic and Subsonic Flows The graph below shows sound power levels versus tip static pressure. The critical pressures
were calculated from the specific heat ratio of the fuel gas at their respective flowing
temperatures per the equation below and correspond to the point at which the fuel gas
reaches sonic velocity.

2010 ZEECO, INC. ZEECO, INC.
10Log vs 20 Log Analysis

ZEECO, INC.
10Log vs 20Log Analysis Previous information debates using a 10Log versus 20Log relationship to calculate the
overall PWL.
For each case, a reference fuel mass flow rate and corresponding power level is used
to determine a sound power level over a range of fuel mass flow rates.

ZEECO, INC.
10Log vs 20Log Analysis10Log Trend Analysis – Tulsa Natural Gas
20Log Trend Analysis – Tulsa Natural Gas

ZEECO, INC.
10Log vs 20Log Analysis10Log Trend Analysis – Propane
20Log Trend Analysis – Propane

ZEECO, INC.
10Log vs 20Log Analysis – Further Testing
While the 10Log vs 20Log analysis shows a more
accurate trend correlation when analyzing by means of a
20Log function, testing including higher fuel flow rates
would provide a better understanding of the error
involved when extrapolating noise values outside of a
small range away from the referenced empirical data.
A larger range of fuel flow rates would also allow a
better understanding of optimal fuel flow rates to use as
an empirical reference.

2010 ZEECO, INC. ZEECO, INC.
Acoustical Efficiency

ZEECO, INC.
Acoustical Efficiency
Multiple reference articles include discussions about
acoustical efficiencies, but several discrepancies exist
between these articles.
Reference ArticleAcoustical Efficiency for a
Typical Hydrocarbon
“Predict Flare Noise and Spectrum”
(Cunha-Leite, 1988)5(10-8)
“Predict Flare Noise” (Narasimhan, 1986) 1(10-6)
“Noise Generation by Open Turbulent
Flames” (Smith, 1963)1.23(10-8) – 8.20(10-8)
“Ecological Aspects of Combustion
Devices (with Reference to Hydrocarbon
Flaring)” (Swithenbank, 1972)
1(10-7) – 1(10-9)

ZEECO, INC.
Acoustical Efficiency
Using the empirical sound power level, fuel flow rate, and fuel
composition, the acoustical efficiency was calculated for each test
point.
A trend was observed that shows as the fuel flow rate increases, the
acoustical efficiency increases for a constant exit area.

ZEECO, INC.
Acoustical Efficiency – Further Testing
With the observance of increasing acoustical efficiencies
associated with increasing fuel flow rate for a constant exit area,
further testing is required to determine actual causation.
Testing of the same format with a multitude of fuel gases would be
beneficial and would provide more evidence to analyze trends
present between fuel gases with different heating values and
molecular weights.
In addition, fuel blends and inert mixtures would add additional
understandings to the phenomena observed.
The aforementioned acoustical efficiency testing could potentially
yield a more accurate method of predicting multipoint ground flare
noise levels.

2010 ZEECO, INC. ZEECO, INC.
Combustion vs. Venting

ZEECO, INC.
Combustion vs. Venting
Two sets of data points were tested to compare venting jet
noise to combustion noise.
Venting without combustion produced an average 20 dB
decrease in sound power level of TNG and an average 23
dB decrease for propane.
Test PointPWL (Leq dB) at Respective Meter Locations
100' (dB) 200' (dB) Δ (dB)
TNG Sonic - Combustion 139 13920
TNG Sonic - Venting 119 119
TNG Subsonic - Combustion 136 13620
TNG Subsonic - Venting 116 116
Propane Sonic - Combustion 138 13823
Propane Sonic - Venting 114 117
Propane Subsonic - Combustion 136 13623
Propane Subsonic - Venting 112 114

ZEECO, INC.
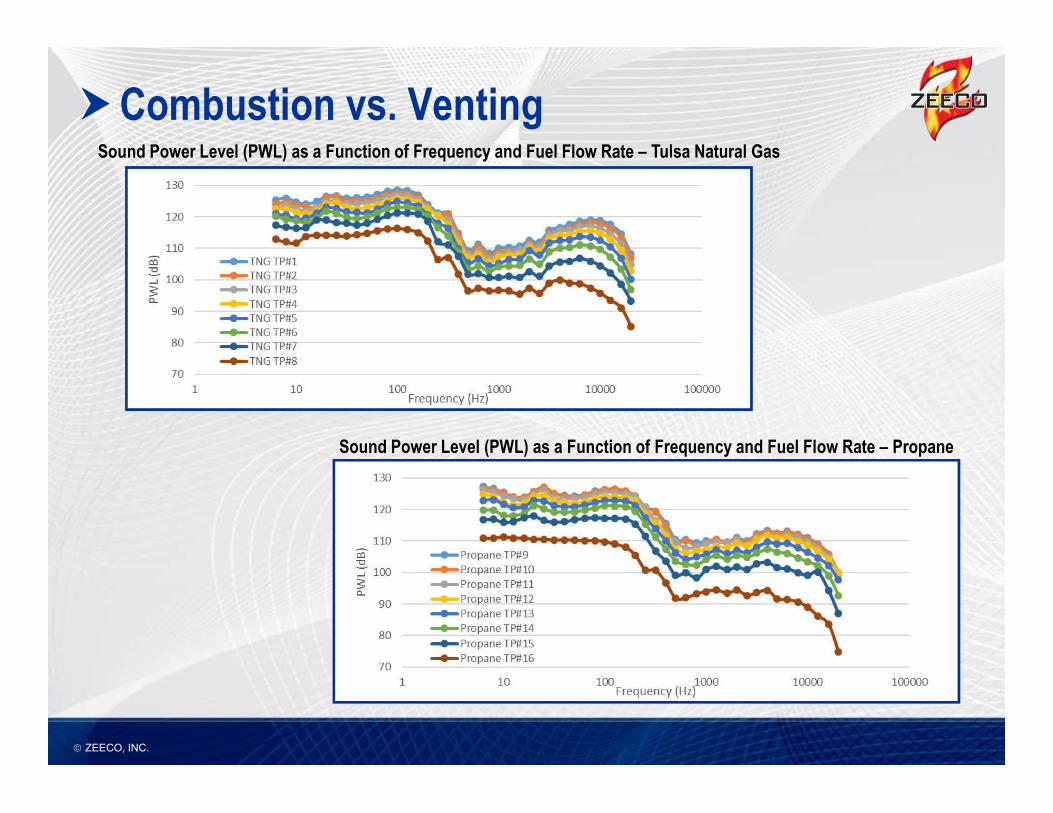
Combustion vs. Venting A further analysis of individual 1/3 octave bands indicates that combustion noise
predominantly occurs at frequencies below approximately 500 Hz and jet noise
predominantly occurs at frequencies above approximately 2500 Hz.
It is important to note that the venting test point low frequency noise could be
influenced by the proximity to city streets and highways.
The higher trends of the venting case for low frequencies less than 1000 Hz does
not appear to correlate to noise mechanisms of the flare, but when compared to
background noise frequency appears to be originating from test site
surroundings.
At these lower frequencies for the venting case, the ambient noise pressure level
is higher than that of the flare tip.
When analyzing the data as sound power level, the calculation is not applicable
to these lower frequencies due to the measured sound pressure level being from
ambient surroundings and not the venting point source.

ZEECO, INC.
Combustion vs. VentingSound Power Level (PWL) as a Function of Frequency – Tulsa Natural Gas
Sound Power Level (PWL) as a Function of Frequency – Propane
ZEECO, INC.
Combustion vs. VentingSound Power Level (PWL) as a Function of Frequency and Fuel Flow Rate – Tulsa Natural Gas
Sound Power Level (PWL) as a Function of Frequency and Fuel Flow Rate – Propane

ZEECO, INC.
Combustion vs. Venting – Further Testing
While the combustion versus venting tests provide insight into
which frequency ranges are dominated by respective noise
mechanisms, it would be beneficial to test a multitude of fuel
gases of differing molecular weights and sonic velocities.
Adjusting fuel exit areas while maintaining a constant fuel flow
rate would yield a better understanding of the driving noise
mechanisms of combustion versus venting and would allow a
better understanding of the magnitude of impact from
combustion noise.
This would be facilitated by incrementally decreasing the fuel
exit velocity and respective jet noise, while maintaining
constant combustion.

2010 ZEECO, INC. ZEECO, INC.
Questions?