Embed Size (px)
Citation preview
Noise Guide
The companies belonging to the Royal Dutch/Shell Group of companies are separate and distinct entities, but in this document the collective expressions "Shell" and "Group" are sometimes used for convenience in contexts where reference is made to the companies of the Royal Dutch/Shell Group in general. These expressions are also used where no useful purpose is served by identifying the particular company or companies. This document is prepared by Shell Internationale Petroleum Maatschappij B.V. (SIPM) as a service under arrangements in existence with companies of the Royal Dutch/Shell Group; it is issued for the guidance of these companies and they may wish to consider using it in their operations. Other interested parties may receive a copy of this document for their information. SIPM is not aware of any inaccuracy or omission from this document and no responsibility is accepted by SIPM or by any person or company concerned with furnishing information or data used in this document for the accuracy of any information or advice given in the document or for any omission from the document or for any consequences whatsoever resulting directly or indirectly from compliance with or adoption of guidance controlled in the document even if caused by a failure to exercise reasonable care.
December 1991 SHELL SAFETY AND HEALTH COMMITTEE
The copyright of this document is vested in Shell Internationale Petroleum Maatschappij B.V., The Hague, The Netherlands. All rights reserved.

AMENDMENT RECORD SHEET
Chapter No.
Section No.
Description Correction/ Update
Date Initials Reference Indicator
All All Original paper issue Dec 91
All All Standard template for CD-ROM issue
Conversion Feb 95 NPC SMAD/23
TABLE OF CONTENTS
A INTRODUCTION 1
B HEARING CONSERVATION PROGRAMME 2
1 RECOMMENDED STANDARDS 2
2 ASSESSMENT OF NOISE LEVELS AND NOISE DOSE 6
2.1 Measurement of Noise Levels 6 2.1.1 Instrumentation 6 2.1.1.1 Sound Level Meters 7 2.1.1.1.1 Sound Level Meters with Direct Read-Out 7 2.1.1.1.2 Sound Level Meters with Integrating Facility 8 2.1.1.2 Octave Band Analysis 8 2.1.1.3 Magnetic Tape Recorders 9 2.1.1.4 Accessories 9 2.1.2 Selection and Use of Measurement Equipment 9
2.2 Measurement Procedures 13 2.2.1 Noise Level Contour Map 13 2.2.2 Noise Exposure 16 2.2.3 Recording of Associated Information 17
2.3 Noise Level/Noise Exposure Calculations 19 2.3.1 Addition and Subtraction of Noise Levels 19 2.3.2 Calculation of Noise from a Specific Item 22 2.3.3 A- and C-Weighting Frequency Responses 22 2.3.4 Calculation of Equivalent Continuous Noise Level (Leq) 24
3 NOISE CONTROL 26
3.1 Introduction 26 3.2 Noise Sources 26
3.2.1 Rotating Equipment 27 3.2.1.1 Compressors 27 3.2.1.2 Drivers 27 3.2.1.3 Gears 27 3.2.1.4 Pumps 27 3.2.1.5 Fans 27 3.2.1.6 Air-Fin Coolers 27 3.2.2 Combustion Equipment 28 3.2.2.1 Boilers 28 3.2.2.2 Furnaces 28 3.2.2.3 Flares 28 3.2.3 Valves and Piping 28
HSE 053 i December 1991
3.2.4 Vents 28 3.2.5 Steam leakages 29 3.2.6 Vibrating equipment and structures 29 3.2.7 Drilling operations equipment 29 3.2.8 Helicopter travel 29
3.3 Noise Control 29 3.3.1 Noise Control at Source 30 3.3.2 Noise Control in the Transmission Path 31 3.3.2.1 Enclosures 31 3.3.2.2 Acoustic Control of Reverberation Time 31 3.3.2.3 Vibration Isolation 33
3.4 Maintenance 33
4 PERSONAL PROTECTION 34
4.1 Introduction 34 4.2 Types of Personal Hearing Protective Devices 34
4.2.1 Ear Plugs 36 4.2.1.1 Re-Usable Ear Plugs 36 4.2.1.2 Disposable Ear Plugs 36 4.2.2 Ear Muffs 37 4.2.3 Combination of Ear Plugs and Ear Muffs 38 4.2.4 Special Types of Hearing Protective Devices 38
4.3 Sound Attenuation of Hearing Protection 38 4.4 Calculation of Noise Level when Using Hearing Protective Devices 39 4.5 Individual Co-Operation 41
5 HEARING SURVEILLANCE 42
5.1 Introduction 42 5.2 Audiometry 42 5.3 Criteria for Reporting of Work Associated Noise Induced Hearing Loss (NIHL) 43
6 RECORDS 45
7 REPORTING 46
8 INFORMATION, INSTRUCTION AND TRAINING 47
9 REFERENCES 48
9.1 ISO Standards Noise (International Organization for Standardization) 48 9.2 ISO Standards Vibration and Shock 48 9.3 IEC Standards (International Electrotechnical Commission) 49
ii HSE 053 December 1991
9.4 EEMUA Specifications (The Engineering Equipment and Materials Users Association), previously issued by the Oil Companies Materials Association (OCMA) 49
9.5 Concawe 50
APPENDIX I AUDIOMETERS 51
1 General 51 2 Simple Audiometers 51 3 Special Feature Audiometers 51
3.1 Bone Conduction 51 3.2 Masking 51 3.3 Speech Audiometry 52
4 Test Procedures 52 4.1 The Octave Band Audiometer 52 4.2 The Continuous Frequency Audiometer 53 4.3 The Automatic Recording Audiometer 53
5 Accuracy and Calibration 56 6 Test Environment 56 7 The Audiogram 57
APPENDIX II PHYSICAL CHARACTERISTICS OF SOUND 59
1 Sound 59 2 Measurements and Units 59
2.1 Sound Power 59 2.2 Sound Pressure 59 2.3 The Decibel 60 2.4 Calculations with Decibels 60
3 Frequency 61 4 Loudness 63 5 Annoyance 63 6 Types of Sound 63 7 The Equivalent Sound Pressure Level 64 8 Noise Dose 64
APPENDIX III PHYSIOLOGICAL EFFECTS OF NOISE 65
1 Introduction 65 2 The Ear 65 3 Presbyacusis 66 4 Effects of Noise on Hearing 67 5 Effect of Noise on Work Performance 69
HSE 053 iii December 1991

APPENDIX IV VIBRATION 70
1 Introduction 70 2 Vibrating Hand-Held Tools 70 3 Vibrating Surfaces 70 4 Health Effects 71
APPENDIX V ULTRASOUND AND INFRASOUND 75
APPENDIX VI ENVIRONMENTAL NOISE 76
iv HSE 053 December 1991
HSE 053 1 December 1991
A INTRODUCTION
Noise induced hearing loss remains a major health risk associated with Shell operations.
Clear guidelines on the prevention of noise induced hearing loss have been in existence since the first publication of the Shell Safety Committee "Noise Guide" in 1972 (revised 1981). However, available data indicate that exposure to high noise levels still occurs and that the risk for noise induced hearing loss is still prevalent.
Reviews in Shell Companies confirm that while most of the essential features of a hearing conservation programme are often present, the effectiveness of programmes should be improved.
The Noise Guide has been reviewed to assist with the development, implementation and management of effective programmes. It gives standards for hearing conservation and contains all information necessary to implement a comprehensive hearing conservation programme.
Vibration, ultra-sound, infra-sound and environmental noise are also briefly discussed but for detailed information other sources should be consulted.
The information contained in this guide, including figures and tables, have been resourced from the Shell Safety Committee Noise Guide 1981 and from the Concawe publication report no 85/58 "Guidelines for hearing conservation programmes in the petroleum industry".
A separate short guide for briefing management on the prevention of noise induced hearing loss is available. (Management Guidelines for Hearing Conservation December, 1991).
B HEARING CONSERVATION PROGRAMME
1 RECOMMENDED STANDARDS
In those countries where matters dealt with in this Guide are governed by statutory regulations or national codes of practice, these must of course be observed. Subject to this proviso, it is recommended that, where the advice in the Guide and national regulations differ, the more stringent requirements should be adopted.
Legislation or guidelines to limit workplace noise exist in most countries. Noise limits are expressed in terms of noise level or noise dose. Noise level is measured as an A-weighted sound pressure level, expressed in decibels and abbreviated as dB(A). The A-weighting has been introduced so that the reading of the sound measuring device corresponds approximately to the response characteristics of the human ear. The term noise dose is a function of the noise level and exposure time. This is normally expressed as the "equivalent continuous noise level" to which a person is exposed over an 8 hour day, and is written as dB(A) Leq (8 hr.). Many of these criteria are accompanied by an overriding condition that the unprotected ear should not be exposed beyond a specified maximum noise level irrespective of duration, as such levels may cause immediate and irreparable damage to hearing.
In order to prevent hearing loss caused by exposure to noise at work, Group companies are recommended to adopt the following measures:
a) Absolute noise limit
Under foreseeable working conditions, NO PERSONS SHOULD BE EXPOSED TO STEADY NOISE LEVELS ABOVE 115 dB(A) irrespective of duration, OR TO IMPULSE NOISE LEVELS ABOVE 135 dB(A), with or without hearing protection. Such levels may cause irreparable damage to hearing and also may lead to panic reactions.
b) Personal equivalent continuous noise dose
THE PERSONAL EQUIVALENT CONTINUOUS NOISE DOSE SHOULD NOT EXCEED 85 dB(A) OVER A WORKING DAY.
The term "noise dose" refers to the equivalent continuous noise levels to which a person is exposed over a working day. No adaptation is needed for shift lengths in excess of 8 hours/day, 40 hours/week, or in case of occasional overtime work, provided the exposure time over one year does not exceed 2000 hours.
Personal noise doses may be controlled by limiting the noise at source or by limiting the duration of exposure. If this is impossible or impracticable, ear protectors should be worn. Note: Off-duty noise doses up to 70 dB(A) are considered to have no influence on hearing loss from exposure at
work. as the additional noise energy received is negligible compared to the 85 dB(A) permitted at work. This level of 70 dB(A) is sufficiently low to allow the ear to recover from previous exposure to noise.
c) Work area noise limit
THE RECOMMENDED WORK AREA NOISE LIMIT AT DESIGN IS 85 dB(A).
The work area is defined as any position not less than 1 m from equipment surfaces accessible to personnel, or any position where a worker's ear may be exposed to noise in the normal course of this duty. The design limit should always take into account all operating modes which can be expected in a properly functioning installation.
For existing plant, the limit for workers not wearing hearing protection is 90 dB(A), irrespective of duration of exposure (see also section (d)).
HSE 053 December 1991
2
HSE 053 3 December 1991
d) Noise control at source
PLANT NOISE SHOULD BE REDUCED TO THE LOWEST PRACTICABLE LEVELS,
Priority should be given to reducing noise levels where they exceed 85 dB(A).
e) Hearing protection
EAR PROTECTORS SHOULD BE AVAILABLE FOR USE IN AREAS WITH NOISE LEVELS ABOVE 80 dB(A).
For areas where noise levels are between 85 and 90 dB(A), two options are available to management:
• to signpost the area at the 85 dB(A) level and prescribe obligatory permanent use of hearing protection,
or
• to specify in the work permit, on a per case basis, when hearing protection must be used, on the basis that workers should not be exposed to a daily noise dose exceeding 85 dB(A).
THE USE OF EAR PROTECTORS IS MANDATORY IN AREAS WHERE NOISE LEVELS ARE 90 dB(A) OR ABOVE
Ear protectors should also be worn by persons exposed to high noise levels which are produced not by machinery or work environment but by the task carried out, e.g. by use of hand-held tools.
f) Audiometry
Any person, whose job has been identified to be liable to a daily noise dose exceeding 80 dB(A), should be monitored by means of audiometry.
For groups of workers, the risk of hearing loss resulting from occupational noise exposure (independent of other causes such as ageing) can be assessed statistically. Data for hearing loss as a function of noise dose and years of exposure, are given in ISO standard 1999 (1975).
The loss of hearing as a result of noise is determined by the individual's personal susceptibility and exposure, at work and elsewhere. Controlling occupational noise exposure will not affect individual susceptibility or non-occupational exposure. Thus, on its' own, no standard for limitation of exposure to noise at work can guarantee complete protection in individual cases. The recommended noise limits above are based on noise level, duration of exposure and expected effects.
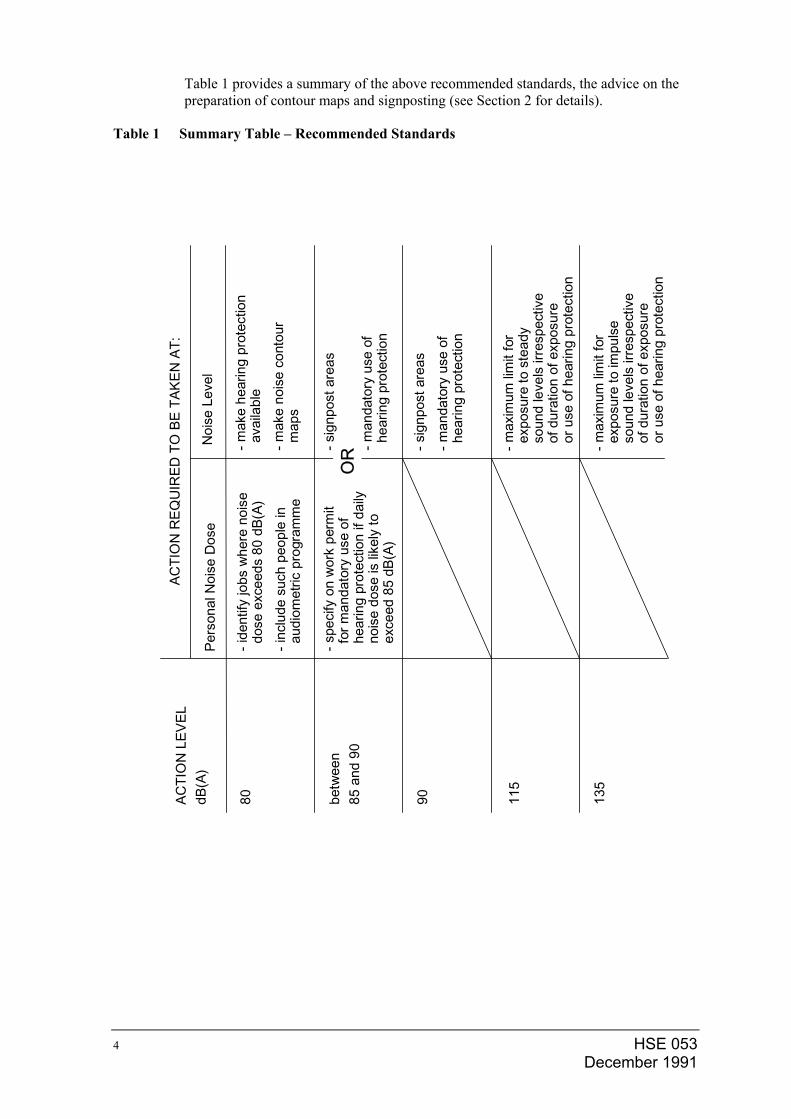
Table 1 provides a summary of the above recommended standards, the advice on the preparation of contour maps and signposting (see Section 2 for details).
Table 1 Summary Table – Recommended Standards
ACTI
ON
LEV
ELdB
(A)
ACTI
ON
REQ
UIR
ED T
O B
E TA
KEN
AT:
Pers
onal
Noi
se D
ose
Noi
se L
evel
-ide
ntify
jobs
whe
re n
oise
dose
exc
eeds
80
dB(A
)-i
nclu
de s
uch
peop
le in
audi
omet
ric p
rogr
amm
e
-spe
cify
on
wor
k pe
rmit
for m
anda
tory
use
of
hear
ing
prot
ectio
n if
daily
nois
e do
se is
like
ly to
exce
ed 8
5 dB
(A)
betw
een
85 a
nd 9
0
90 115
135
80-m
ake
hear
ing
prot
ectio
nav
aila
ble
-mak
e no
ise
cont
our
map
s
-sig
npos
t are
as
-man
dato
ry u
se o
fhe
arin
g pr
otec
tion
-sig
npos
t are
as-m
anda
tory
use
of
hear
ing
prot
ectio
n
-max
imum
lim
it fo
rex
posu
re to
ste
ady
soun
d le
vels
irre
spec
tive
of d
urat
ion
of e
xpos
ure
or u
se o
f hea
ring
prot
ectio
n
-max
imum
lim
it fo
rex
posu
re to
impu
lse
soun
d le
vels
irre
spec
tive
of d
urat
ion
of e
xpos
ure
or u
se o
f hea
ring
prot
ectio
n
OR
HSE 053 December 1991
4
HSE 053 5 December 1991
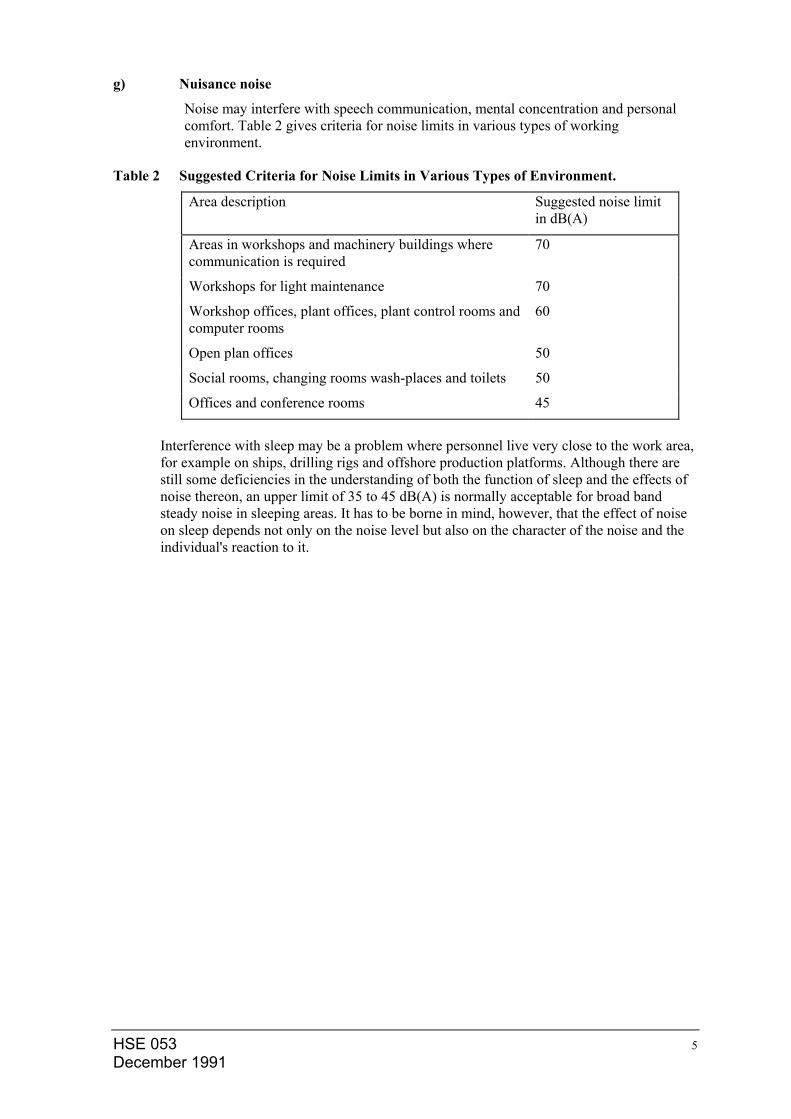
g) Nuisance noise
Noise may interfere with speech communication, mental concentration and personal comfort. Table 2 gives criteria for noise limits in various types of working environment.
Table 2 Suggested Criteria for Noise Limits in Various Types of Environment.
Area description Suggested noise limit in dB(A)
Areas in workshops and machinery buildings where communication is required
70
Workshops for light maintenance 70
Workshop offices, plant offices, plant control rooms and computer rooms
60
Open plan offices 50
Social rooms, changing rooms wash-places and toilets 50
Offices and conference rooms 45
Interference with sleep may be a problem where personnel live very close to the work area, for example on ships, drilling rigs and offshore production platforms. Although there are still some deficiencies in the understanding of both the function of sleep and the effects of noise thereon, an upper limit of 35 to 45 dB(A) is normally acceptable for broad band steady noise in sleeping areas. It has to be borne in mind, however, that the effect of noise on sleep depends not only on the noise level but also on the character of the noise and the individual's reaction to it.
2 ASSESSMENT OF NOISE LEVELS AND NOISE DOSE
An assessment of noise levels and noise doses should take place every five years or whenever process, plant or job-profiles change. It consists of the following four steps:
a. Identify and map areas and activities where steady noise levels exceed 80 dB(A), 85 dB(A), 90 dB(A) and 115 dB(A).
b. Identify and map areas and activities where impulse noise levels are above 13 5 dB(A).
c. Identify jobs in which the personal noise dose is likely to exceed 80 dB(A) and 85 dB(A).
d. Signpost areas and identify tools and equipment where noise levels exceed 85 dB(A) or 90 dB(A) (see 1e page 3).
See Table 1 for a summary of these actions.
These steps are further clarified in the following sections.
2.1 Measurement of Noise Levels
This Section outlines the equipment and procedures recommended for the measurement of workplace noise levels and occupational noise (doses) and the associated information that should be collected. The aim is to present practical guidance so that meaningful and reliable noise data are obtained using standardised approaches.
Initially, prior to making any field measurement, it is necessary for the objectives of a proposed noise survey to be defined. This ensures that attention is focused on the precise nature of the data required and is an essential pre-requisite to specifying the types of instrumentation and the degree of practical expertise that are needed. The objectives may include the determination of:
• noise exposure;
• noise data for engineering control purposes;
• noise data to establish hearing protection requirements.
Accordingly, these guidelines, presented in a sequential fashion, cover a brief description of the various types of noise measurement equipment (Section 2.1.1), their application (Section 2.1.2), and the measurement procedures (Section 2.1.3).
2.1.1 Instrumentation There is a wide selection of equipment for the measurement of noise in the workplace, ranging from simple general-purpose-type sound-level meters for the determination of overall noise levels to the more accurate and versatile precision sound-level meters which, depending on specification, may also be capable of measuring impulse noise and/or integrating sound pressure levels over a period ranging from a few seconds to a full day.
If, in addition, noise spectra are required, sound-level meters with built-in octave filters are available; alternatively, there are meters which can be used with external filters for octave, third octave or narrow-band analysis. Other equipment used in conjunction with sound-level meters includes graphic level recorders for recording on-the-spot noise histories and frequency spectra, and tape recorders for noise recording and subsequent analysis in the laboratory.
HSE 053 December 1991
6
HSE 053 7 December 1991
For most workplace circumstances, a basic set of measuring instrumentation comprising a precision sound-level meter - preferably with impulse noise and integrating facilities - an octave band filter and the essential associated accessories such as an acoustic calibrator and microphone windshield are required. These and other useful items of equipment are considered below.
2.1.1.1 Sound Level Meters Sound-level meters are portable, self-contained, battery-powered instruments each incorporating a microphone, an amplifier, a weighting network system, a rectifier and an indicating meter.
Until 1979 there were two categories of meter, namely the "precision" type, which satisfied the requirements of the International Electrotechnical Commission (IEC) document No. 179, and the "industrial" grade which complied with IEC 123. However, in 1979 IEC produced a new document, IEC 651, that replaced IEC 123 and 179. This consolidated the two previous grades of sound-level meter and introduced two new grades, as follows:
Type 0: laboratory reference meter;
Type 1: precision-grade meter (replaced IEC 179);
Type 2: industrial-grade meter (replaced IEC 123);
Type 3: survey meter.
For measurement of workplace noise the use of a Type 1 or Type 2 meter is recommended. Type 3 is not recommended in view of the very large tolerances of that grade of instrument. Normally, sound level meters are not intrinsically safe but a manufacturer may be able to supply a version with a specified degree of intrinsic safety at extra cost.
Up to four standardised weighting networks (A, B, C, D) may be incorporated into a sound-level meter, although some equipment has only the A-weighting network. The latter is widely used because the A-weighted noise exposure level has been found to be the best single figure value for predicting subjective response to noise exposure. Consequently, for hearing conservation purposes, overall noise level measurements should be made using the A-weighted scale, and recorded as dB(A).
A further classification of sound-level meters can be made according to the types of noise level reading that are given.
2.1.1.1.1 Sound Level Meters with Direct Read-Out
A standard sound level meter, equipped with a "fast" and "slow" meter response, is capable of directly measuring both a steady noise level and a slightly fluctuating noise level, and in most instances use of the "slow" meter response is recommended.
However, the standard meter cannot be used to measure impulse noise because the rise time of even the "fast" meter response does not match that of the human ear and therefore the peak of such rapid transient noises is under-recorded. On the other hand some meters are equipped with an "impulse" time constant which enables the meter reading to increase very rapidly as the noise level increases.
This is coupled with a long delay time in the impulse circuit to allow the user an opportunity to read the peak level, but care should be exercised in interpreting the results in view of the asymmetric response characteristics.
Some impulse sound-level meters possess "peak hold" circuitry, whereby the meter is capable of indicating the highest peak noise level until reset by the operator.
2.1.1.1.2 Sound Level Meters with Integrating Facility
Integrating sound-level meters are used to determine the equivalent steady A-weighted noise level (Leq) corresponding to a time-varying noise situation over a known period. This is particularly useful when the noise environment under study can fluctuate strongly, for example in workshop areas. Care should be taken to ensure that the period over which the Leq is determined is sufficiently representative, e.g. of the working day or a specific operation. This can be verified by repeating the measurement a number of times.
The personal noise dosimeter, an instrument small enough to attach to an individual during all or part of the working day to ascertain noise exposure, is a particular type of integrating sound-level meter. It is extremely useful in determining exposure for jobs where the worker moves around between areas of differing noise level because in these cases it is often difficult to ascertain noise exposure with any degree of accuracy by any other method (see also the Concawe Report "Workshop on personal noise dosimetry" (see p. 57, 9.5).
Some personal noise dosimetry instrumentation is available with data logging facilities. This enables a plot of the noise level to be produced as a function of time for the monitoring period, and can provide valuable information to assist with the assessment of the exposure data.
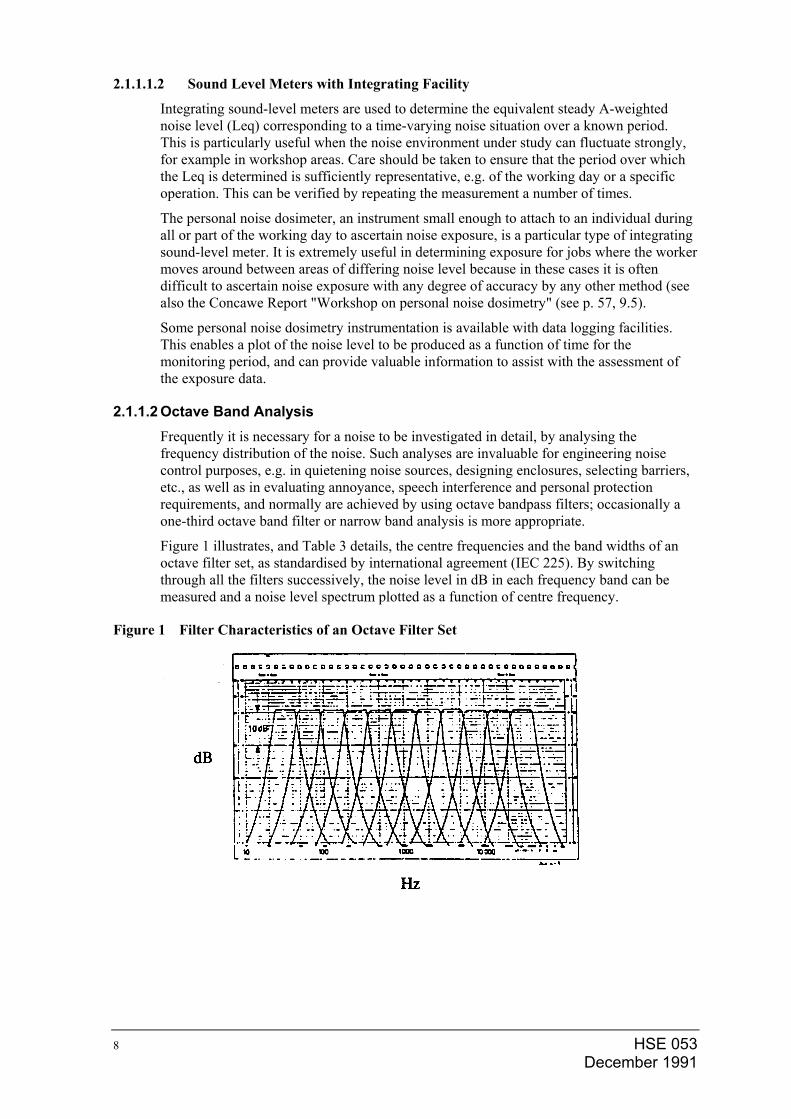
2.1.1.2 Octave Band Analysis Frequently it is necessary for a noise to be investigated in detail, by analysing the frequency distribution of the noise. Such analyses are invaluable for engineering noise control purposes, e.g. in quietening noise sources, designing enclosures, selecting barriers, etc., as well as in evaluating annoyance, speech interference and personal protection requirements, and normally are achieved by using octave bandpass filters; occasionally a one-third octave band filter or narrow band analysis is more appropriate.
Figure 1 illustrates, and Table 3 details, the centre frequencies and the band widths of an octave filter set, as standardised by international agreement (IEC 225). By switching through all the filters successively, the noise level in dB in each frequency band can be measured and a noise level spectrum plotted as a function of centre frequency.
Figure 1 Filter Characteristics of an Octave Filter Set
HSE 053 December 1991
8
HSE 053 9 December 1991
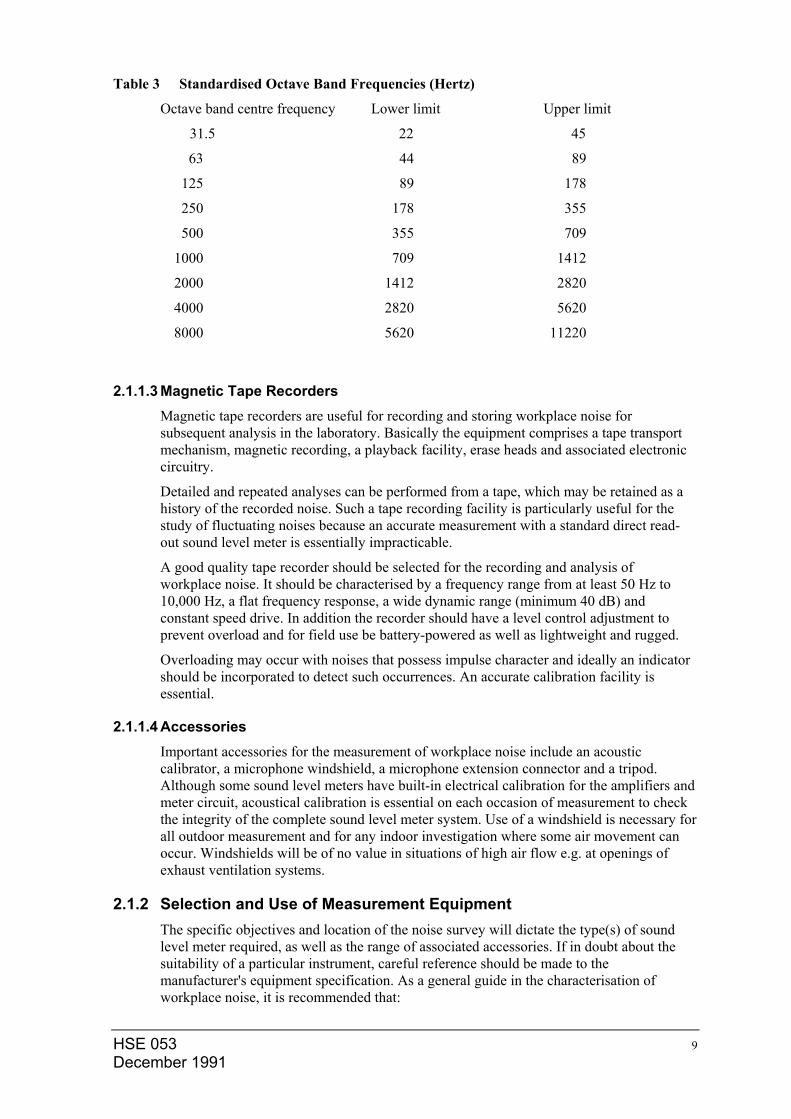
Table 3 Standardised Octave Band Frequencies (Hertz)
Octave band centre frequency Lower limit Upper limit
31.5 22 45
63 44 89
125 89 178
250 178 355
500 355 709
1000 709 1412
2000 1412 2820
4000 2820 5620
8000 5620 11220
2.1.1.3 Magnetic Tape Recorders Magnetic tape recorders are useful for recording and storing workplace noise for subsequent analysis in the laboratory. Basically the equipment comprises a tape transport mechanism, magnetic recording, a playback facility, erase heads and associated electronic circuitry.
Detailed and repeated analyses can be performed from a tape, which may be retained as a history of the recorded noise. Such a tape recording facility is particularly useful for the study of fluctuating noises because an accurate measurement with a standard direct read-out sound level meter is essentially impracticable.
A good quality tape recorder should be selected for the recording and analysis of workplace noise. It should be characterised by a frequency range from at least 50 Hz to 10,000 Hz, a flat frequency response, a wide dynamic range (minimum 40 dB) and constant speed drive. In addition the recorder should have a level control adjustment to prevent overload and for field use be battery-powered as well as lightweight and rugged.
Overloading may occur with noises that possess impulse character and ideally an indicator should be incorporated to detect such occurrences. An accurate calibration facility is essential.
2.1.1.4 Accessories Important accessories for the measurement of workplace noise include an acoustic calibrator, a microphone windshield, a microphone extension connector and a tripod. Although some sound level meters have built-in electrical calibration for the amplifiers and meter circuit, acoustical calibration is essential on each occasion of measurement to check the integrity of the complete sound level meter system. Use of a windshield is necessary for all outdoor measurement and for any indoor investigation where some air movement can occur. Windshields will be of no value in situations of high air flow e.g. at openings of exhaust ventilation systems.
2.1.2 Selection and Use of Measurement Equipment The specific objectives and location of the noise survey will dictate the type(s) of sound level meter required, as well as the range of associated accessories. If in doubt about the suitability of a particular instrument, careful reference should be made to the manufacturer's equipment specification. As a general guide in the characterisation of workplace noise, it is recommended that:
• a sound level meter with direct read-out be used on the "slow" time constant in all cases where the workplace noise is reasonably steady or varies in a stepwise manner, e.g. the starting or stopping of a machine.
Where the noise measurements could be used for engineering control purposes and/or to specify suitable hearing protective devices, the sound-level meter should be equipped with, at least, an octave band analysis capability;
• an integrating sound-level meter be used in cases where the workplace noise level fluctuates rapidly. If noise dose data are required, and the worker moves around between areas of high and low noise level, the use of personal integrating noise dosimetry equipment is likely to be necessary. Care should be taken to ensure that any form of integrating sound-level meter complies with the ISO R 1999 (1) criterion in having a 3 dB(A) trade-off per halving or doubling of exposure time. Instrumentation of an American origin normally has a 5 dB(A) characteristic but can usually be obtained with a 3 dB(A) trade-off.
Noise with an impulse character requires special consideration. Where the impulses are repeated rapidly (> 10 times/sec.), and in a reverberant situation, e.g. riveting, measurement can be made with a conventional sound-level meter using the slow response. For other impulse type noise, a sound-level meter with an impulse facility should be used.
Normally, precise and detailed information on the correct use of standard and integrating sound level meters for determining noise levels can be obtained from the manufacturer's instruction booklet.
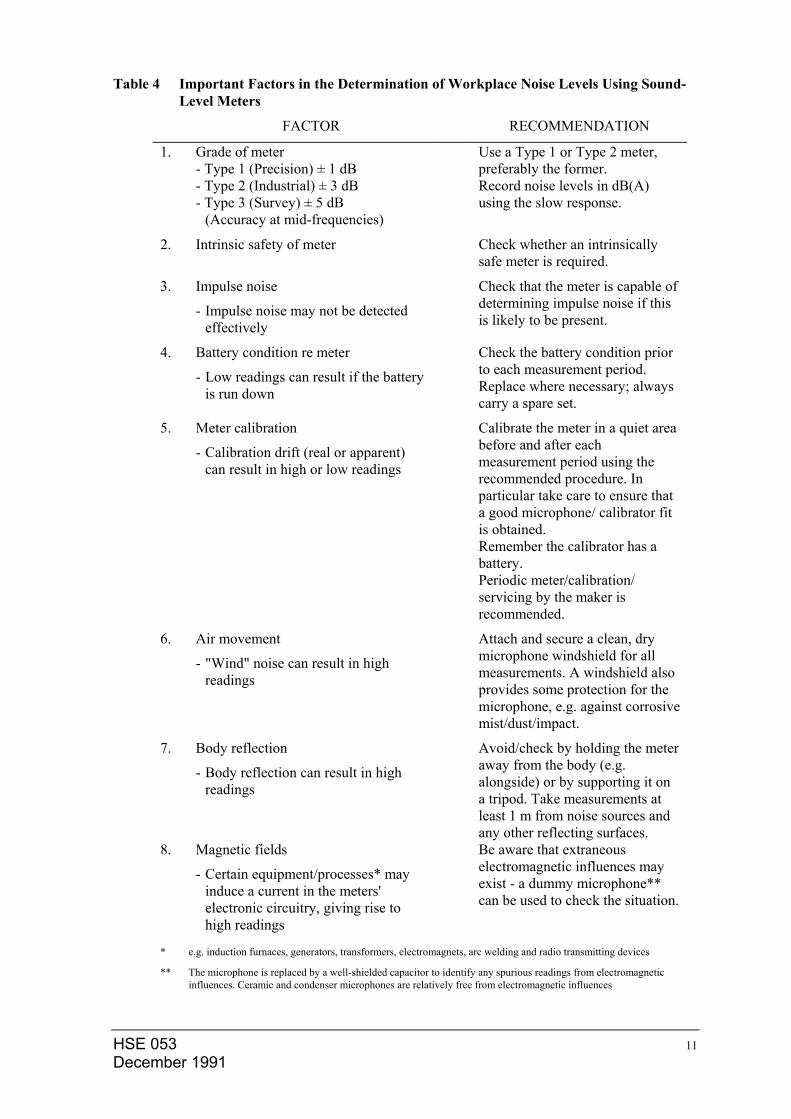
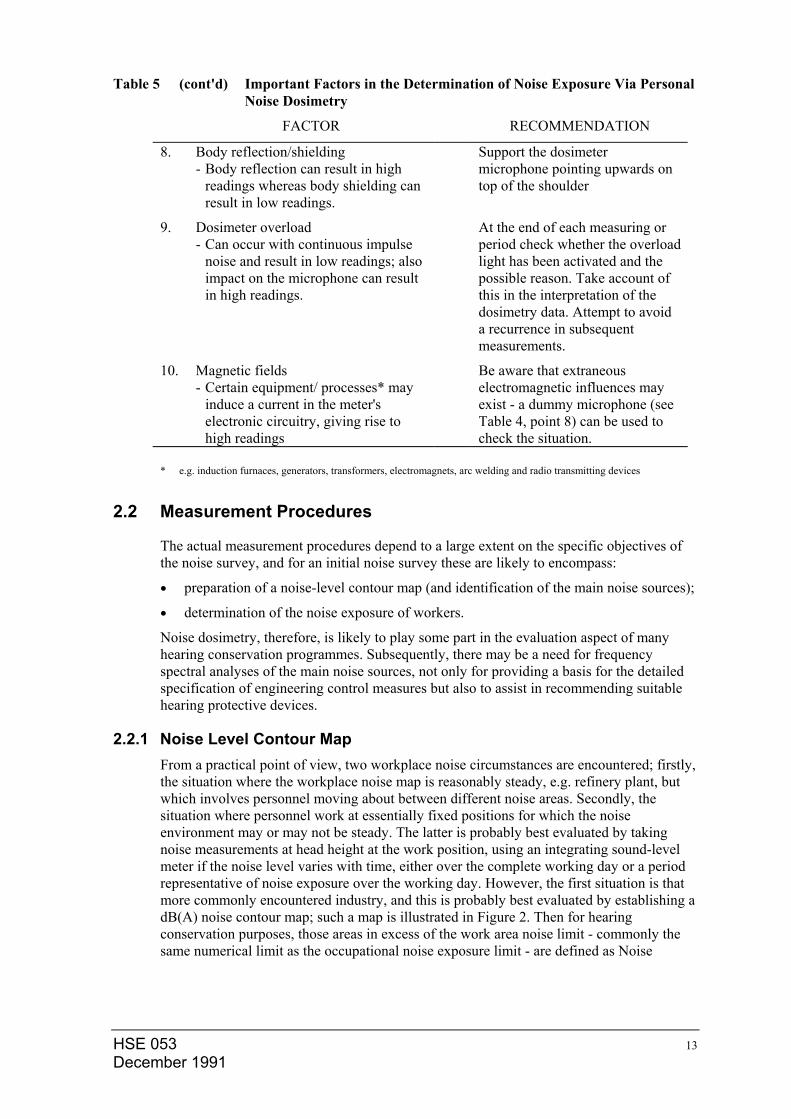
A summary of the more important factors likely to affect the accuracy of noise level measurements is included in Table 4, together with some guidance to ensure that valid data are obtained. As with any noise level measurement, there are a number of critical considerations - some of them identical to those applicable to the use of a simple sound level meter - that can affect the accuracy of the exposure results obtained from personal noise dosimetry studies. Indeed, the usefulness of noise dosimeters in the accurate determination of personal noise dose is the subject of current debate. Accordingly, a summary of the more important factors likely to affect the accuracy of noise exposure measurements are included in Table 5 together with some guidance to ensure that, on the basis of present knowledge, valid data are obtained. The information is based on the findings of a Concawe Workshop (Concawe Report No. 3/84. See p. 57, 9.5).
Intrinsic safety is a very important consideration with personal noise dosimetry. Some instrumentation with British Approvals Service for Electrical Equipment in Flammable Atmosphere (BASEEFA) certification is available, although there is a need to check that the degree of intrinsic safety is compatible with requirements.
HSE 053 December 1991
10
HSE 053 11 December 1991
Table 4 Important Factors in the Determination of Workplace Noise Levels Using Sound-Level Meters
FACTOR RECOMMENDATION
1. Grade of meter - Type 1 (Precision) ± 1 dB - Type 2 (Industrial) ± 3 dB - Type 3 (Survey) ± 5 dB
(Accuracy at mid-frequencies)
Use a Type 1 or Type 2 meter, preferably the former. Record noise levels in dB(A) using the slow response.
2. Intrinsic safety of meter Check whether an intrinsically safe meter is required.
3. Impulse noise
- Impulse noise may not be detected effectively
Check that the meter is capable of determining impulse noise if this is likely to be present.
4. Battery condition re meter
- Low readings can result if the battery is run down
Check the battery condition prior to each measurement period. Replace where necessary; always carry a spare set.
5. Meter calibration
- Calibration drift (real or apparent) can result in high or low readings
Calibrate the meter in a quiet area before and after each measurement period using the recommended procedure. In particular take care to ensure that a good microphone/ calibrator fit is obtained. Remember the calibrator has a battery. Periodic meter/calibration/ servicing by the maker is recommended.
6. Air movement
- "Wind" noise can result in high readings
Attach and secure a clean, dry microphone windshield for all measurements. A windshield also provides some protection for the microphone, e.g. against corrosive mist/dust/impact.
7. Body reflection
- Body reflection can result in high readings
Avoid/check by holding the meter away from the body (e.g. alongside) or by supporting it on a tripod. Take measurements at least 1 m from noise sources and any other reflecting surfaces.
8. Magnetic fields
- Certain equipment/processes* may induce a current in the meters' electronic circuitry, giving rise to high readings
Be aware that extraneous electromagnetic influences may exist - a dummy microphone** can be used to check the situation.
* e.g. induction furnaces, generators, transformers, electromagnets, arc welding and radio transmitting devices
** The microphone is replaced by a well-shielded capacitor to identify any spurious readings from electromagnetic influences. Ceramic and condenser microphones are relatively free from electromagnetic influences
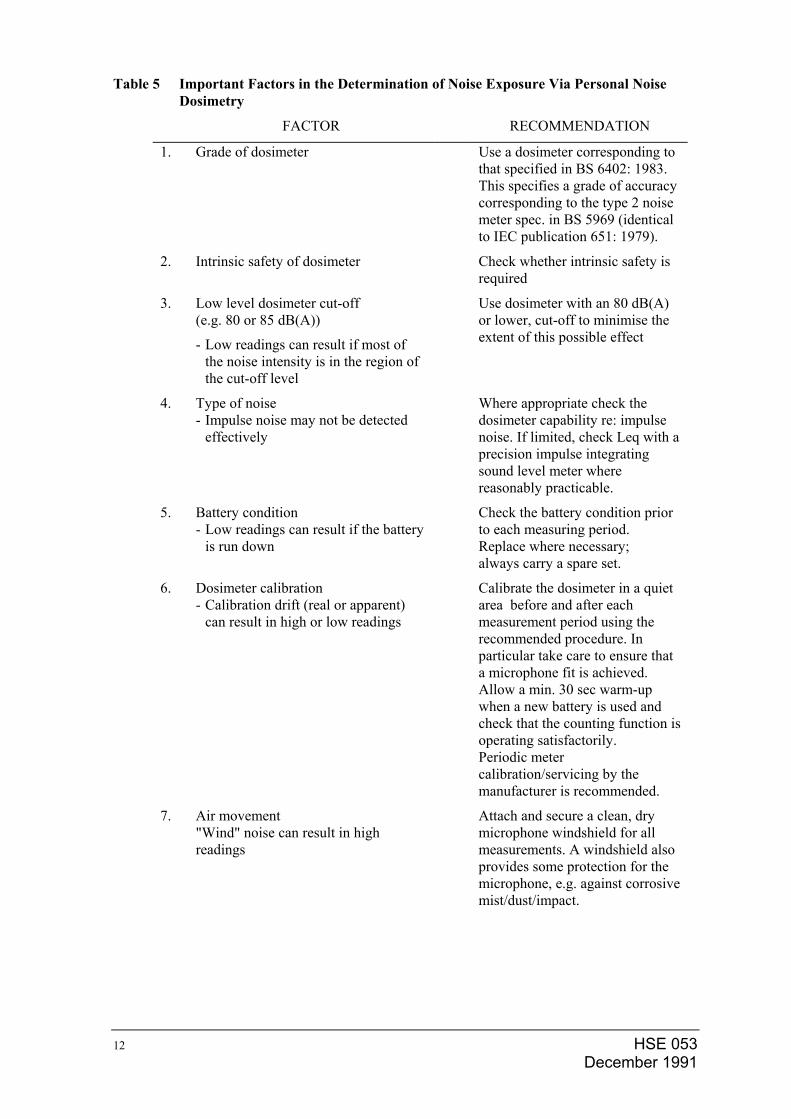
Table 5 Important Factors in the Determination of Noise Exposure Via Personal Noise Dosimetry
FACTOR RECOMMENDATION
1. Grade of dosimeter Use a dosimeter corresponding to that specified in BS 6402: 1983. This specifies a grade of accuracy corresponding to the type 2 noise meter spec. in BS 5969 (identical to IEC publication 651: 1979).
2. Intrinsic safety of dosimeter Check whether intrinsic safety is required
3. Low level dosimeter cut-off (e.g. 80 or 85 dB(A))
- Low readings can result if most of the noise intensity is in the region of the cut-off level
Use dosimeter with an 80 dB(A) or lower, cut-off to minimise the extent of this possible effect
4. Type of noise - Impulse noise may not be detected
effectively
Where appropriate check the dosimeter capability re: impulse noise. If limited, check Leq with a precision impulse integrating sound level meter where reasonably practicable.
5. Battery condition - Low readings can result if the battery
is run down
Check the battery condition prior to each measuring period. Replace where necessary; always carry a spare set.
6. Dosimeter calibration - Calibration drift (real or apparent)
can result in high or low readings
Calibrate the dosimeter in a quiet area before and after each measurement period using the recommended procedure. In particular take care to ensure that a microphone fit is achieved. Allow a min. 30 sec warm-up when a new battery is used and check that the counting function is operating satisfactorily. Periodic meter calibration/servicing by the manufacturer is recommended.
7. Air movement "Wind" noise can result in high readings
Attach and secure a clean, dry microphone windshield for all measurements. A windshield also provides some protection for the microphone, e.g. against corrosive mist/dust/impact.
HSE 053 December 1991
12
HSE 053 13 December 1991
Table 5 (cont'd) Important Factors in the Determination of Noise Exposure Via Personal Noise Dosimetry
FACTOR RECOMMENDATION
8. Body reflection/shielding - Body reflection can result in high
readings whereas body shielding can result in low readings.
Support the dosimeter microphone pointing upwards on top of the shoulder
9. Dosimeter overload - Can occur with continuous impulse
noise and result in low readings; also impact on the microphone can result in high readings.
At the end of each measuring or period check whether the overload light has been activated and the possible reason. Take account of this in the interpretation of the dosimetry data. Attempt to avoid a recurrence in subsequent measurements.
10. Magnetic fields - Certain equipment/ processes* may
induce a current in the meter's electronic circuitry, giving rise to high readings
Be aware that extraneous electromagnetic influences may exist - a dummy microphone (see Table 4, point 8) can be used to check the situation.
* e.g. induction furnaces, generators, transformers, electromagnets, arc welding and radio transmitting devices
2.2 Measurement Procedures
The actual measurement procedures depend to a large extent on the specific objectives of the noise survey, and for an initial noise survey these are likely to encompass:
• preparation of a noise-level contour map (and identification of the main noise sources);
• determination of the noise exposure of workers.
Noise dosimetry, therefore, is likely to play some part in the evaluation aspect of many hearing conservation programmes. Subsequently, there may be a need for frequency spectral analyses of the main noise sources, not only for providing a basis for the detailed specification of engineering control measures but also to assist in recommending suitable hearing protective devices.
2.2.1 Noise Level Contour Map From a practical point of view, two workplace noise circumstances are encountered; firstly, the situation where the workplace noise map is reasonably steady, e.g. refinery plant, but which involves personnel moving about between different noise areas. Secondly, the situation where personnel work at essentially fixed positions for which the noise environment may or may not be steady. The latter is probably best evaluated by taking noise measurements at head height at the work position, using an integrating sound-level meter if the noise level varies with time, either over the complete working day or a period representative of noise exposure over the working day. However, the first situation is that more commonly encountered industry, and this is probably best evaluated by establishing a dB(A) noise contour map; such a map is illustrated in Figure 2. Then for hearing conservation purposes, those areas in excess of the work area noise limit - commonly the same numerical limit as the occupational noise exposure limit - are defined as Noise
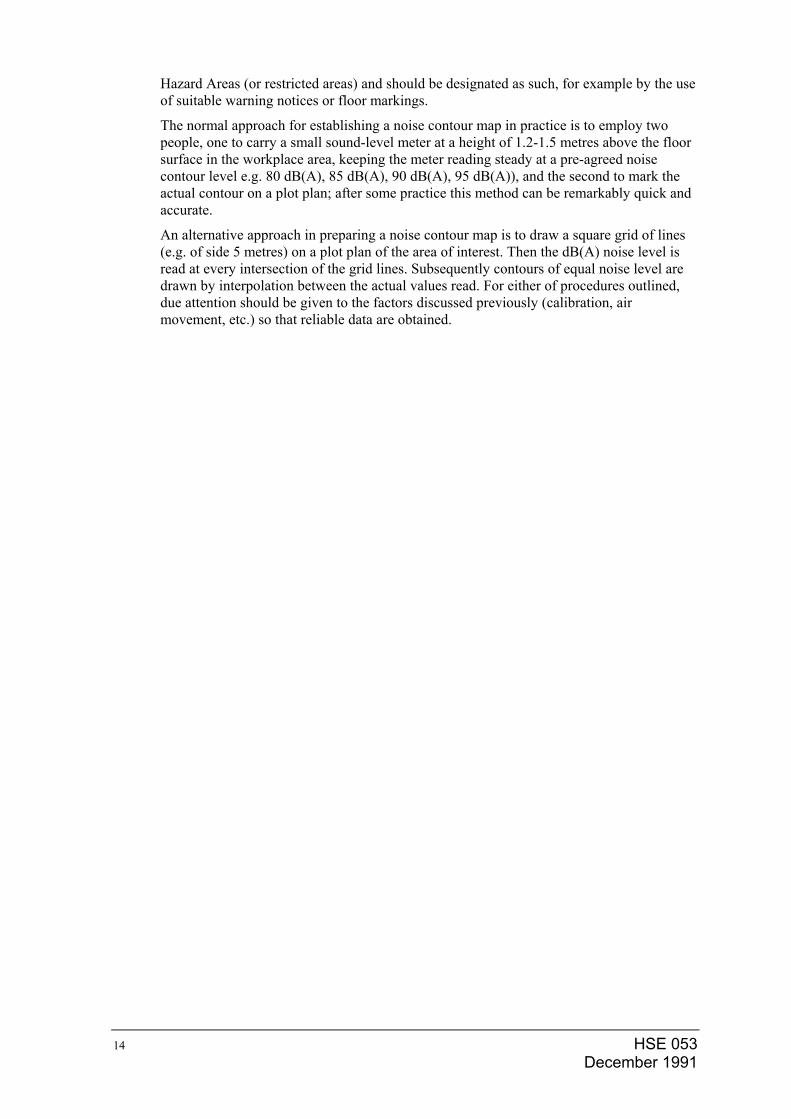
Hazard Areas (or restricted areas) and should be designated as such, for example by the use of suitable warning notices or floor markings.
The normal approach for establishing a noise contour map in practice is to employ two people, one to carry a small sound-level meter at a height of 1.2-1.5 metres above the floor surface in the workplace area, keeping the meter reading steady at a pre-agreed noise contour level e.g. 80 dB(A), 85 dB(A), 90 dB(A), 95 dB(A)), and the second to mark the actual contour on a plot plan; after some practice this method can be remarkably quick and accurate.
An alternative approach in preparing a noise contour map is to draw a square grid of lines (e.g. of side 5 metres) on a plot plan of the area of interest. Then the dB(A) noise level is read at every intersection of the grid lines. Subsequently contours of equal noise level are drawn by interpolation between the actual values read. For either of procedures outlined, due attention should be given to the factors discussed previously (calibration, air movement, etc.) so that reliable data are obtained.
HSE 053 December 1991
14
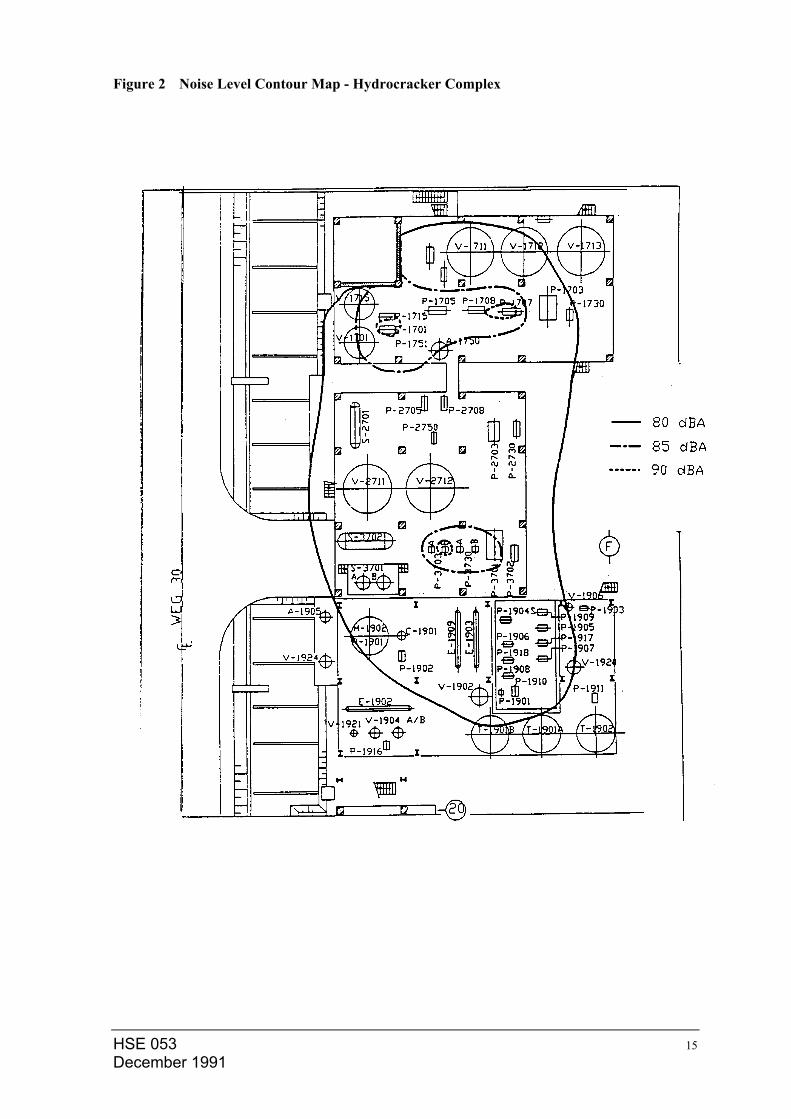
Figure 2 Noise Level Contour Map - Hydrocracker Complex
HSE 053 15 December 1991
2.2.2 Noise Exposure The approach normally adopted in hearing conservation programmes involves creating a noise contour map and requiring hearing protection to be worn in Noise Hazard Areas, irrespective of the daily period of stay. Hearing conservation programmes can be based on the results of noise exposure measurements, particularly where there is a "reasonably steady" noise environment. This method is similar in nature to that followed for most airborne contaminants and involves determining the typical noise doses associated with the various job categories in the areas of interest. Then the need, or otherwise, for a reduction of personal noise dose (e.g. via use of personal protection) is based solely on the exposure classification for each job function rather than on the designation of Noise Hazard Areas. Two procedures can be used for the determination of a worker's equivalent noise dose over a specified period:
• "audit" dosimetry, whereby the Leq exposures are calculated from knowledge of the duration of exposure in various workplace areas of known noise level. The nomogram shown in Section 2.3. is useful for the rapid calculation of Leq and an example is also given. This is the current reference method for estimating noise exposure;
• dosimetry, whereby the Leq exposures are measured directly using monitoring equipment attached to the individual of interest. It is important that the factors most likely to affect the accuracy of the results obtained should be taken fully into account, as discussed in Section 2.1.2.
Some guidance as to the suggested approach in a particular set of circumstances is given in Figure 3. This takes account of whether the job is conducted at a fixed location or not, and the nature of the associated noise pattern.
Whichever approach is adopted, sufficient measurements should be taken amongst a representative sample of exposed employees to define the "typical" range of noise exposures (mean, variability) for each job or function of interest. The variability of the results obtained will dictate to some extent the number of measurements required to characterise a typical noise exposure situation. Furthermore, if reliance is placed on short-period monitoring to assess full-shift noise dose, it is essential that the sampling duration should be representative of the complete work cycle. Another practical point is that some allowance should be made for the wearer(s) to become familiar with the equipment whenever personal noise dosimetry is first introduced into a new location. Such familiarisation should be sufficient to minimise the occurrence of any atypical bias as a result of the "intrusion" which an individual may feel when the instrumentation is just attached.
HSE 053 December 1991
16
Figure 3 Determination of Noise Exposure - Suggested Procedures
Is the daily job undertakenat a fixed location?
YES NO
Is the noise levelreasonable steady?
YES NO
Measure dB(A) noise level with a direct
readout Type 1 soundlevel meter at the job
location.This numerically
equal to the dB(A)equivalent continuous
noise level.
Measure dB(A)equivalent continuous
noise level with aType 1 integrating
sound level meter atthe job location orin the hearing zone
with a noise dosimeterover the shift or
representative parttherefore.
Measure hearing zonedB(A) equivalentcontinuous noiselevel with a noise
dosimeter or estimatefractional exposure (f)
at each job locationusing a Type 1 sound
level meter (integratingversion where
appropriate), sum thef’s and express and a
dB(A) equivalentcontinuous noise level.
Exposure level = Measured/calculated dB(A)(db(A)Leq) equivalent continuous noise level
2.2.3 Recording of Associated Information Each noise level or noise exposure measurement relates to a particular set of operating and other circumstances. Accordingly, it is essential that sufficient information is recorded so that each individual result is fully defined as a specific event. This is important not only to help in the immediate assessment of the data, but also for possible subsequent comparison purposes. Table 6 outlines the types of information that are necessary and Figures 4(a) and 4(b) give examples of data sheets on which such information can be recorded.
HSE 053 17 December 1991
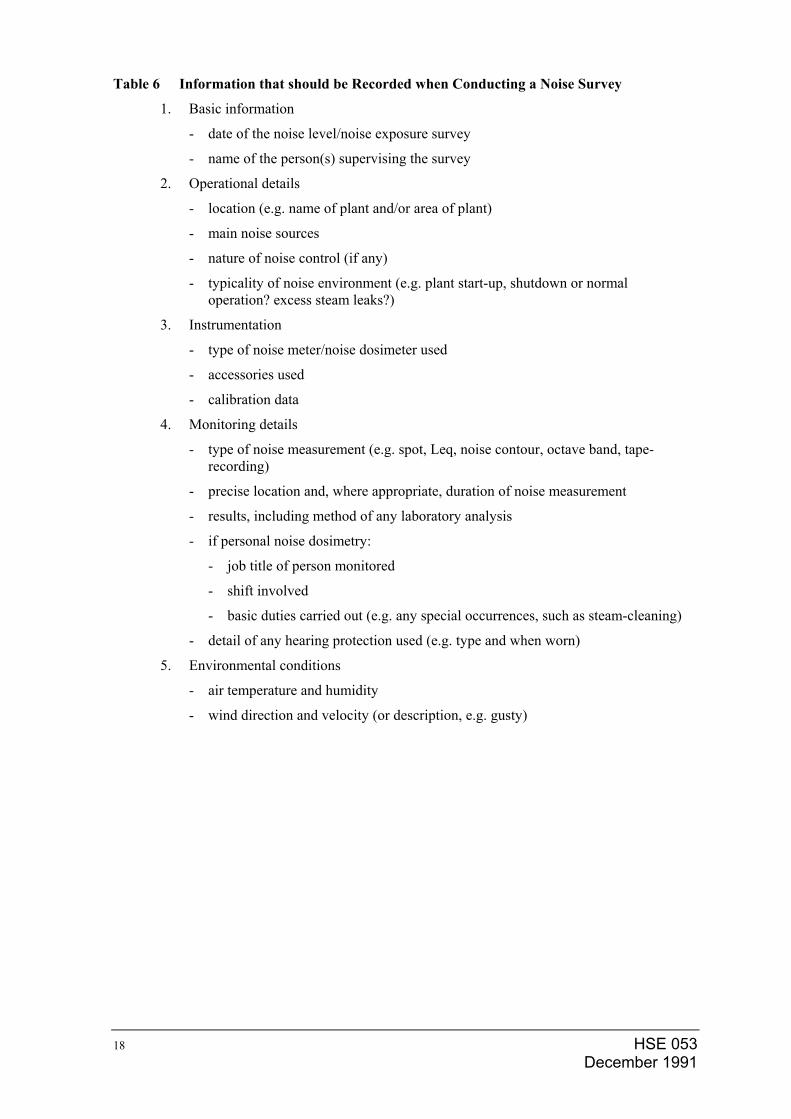
Table 6 Information that should be Recorded when Conducting a Noise Survey
1. Basic information
- date of the noise level/noise exposure survey
- name of the person(s) supervising the survey
2. Operational details
- location (e.g. name of plant and/or area of plant)
- main noise sources
- nature of noise control (if any)
- typicality of noise environment (e.g. plant start-up, shutdown or normal operation? excess steam leaks?)
3. Instrumentation
- type of noise meter/noise dosimeter used
- accessories used
- calibration data
4. Monitoring details
- type of noise measurement (e.g. spot, Leq, noise contour, octave band, tape-recording)
- precise location and, where appropriate, duration of noise measurement
- results, including method of any laboratory analysis
- if personal noise dosimetry:
- job title of person monitored
- shift involved
- basic duties carried out (e.g. any special occurrences, such as steam-cleaning)
- detail of any hearing protection used (e.g. type and when worn)
5. Environmental conditions
- air temperature and humidity
- wind direction and velocity (or description, e.g. gusty)
HSE 053 December 1991
18
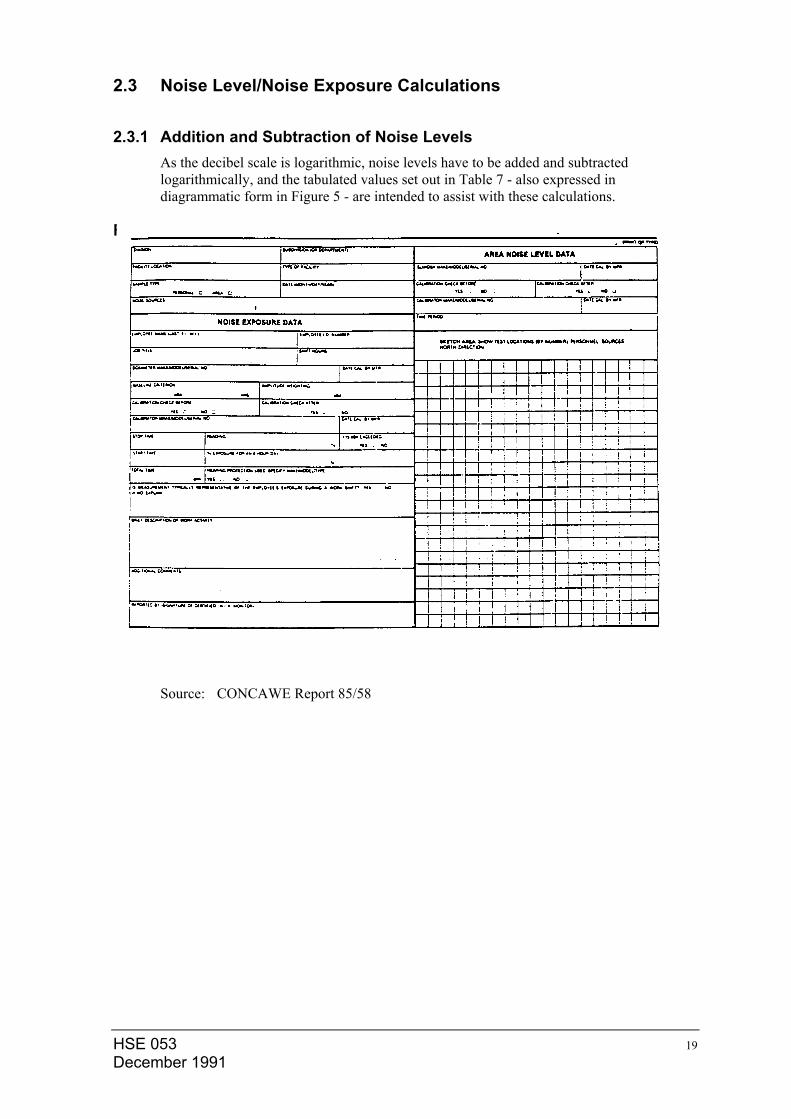
2.3 Noise Level/Noise Exposure Calculations
2.3.1 Addition and Subtraction of Noise Levels As the decibel scale is logarithmic, noise levels have to be added and subtracted logarithmically, and the tabulated values set out in Table 7 - also expressed in diagrammatic form in Figure 5 - are intended to assist with these calculations.
Figure 4(a) Noise Level/Exposure Data Sheet
Source: CONCAWE Report 85/58
HSE 053 19 December 1991
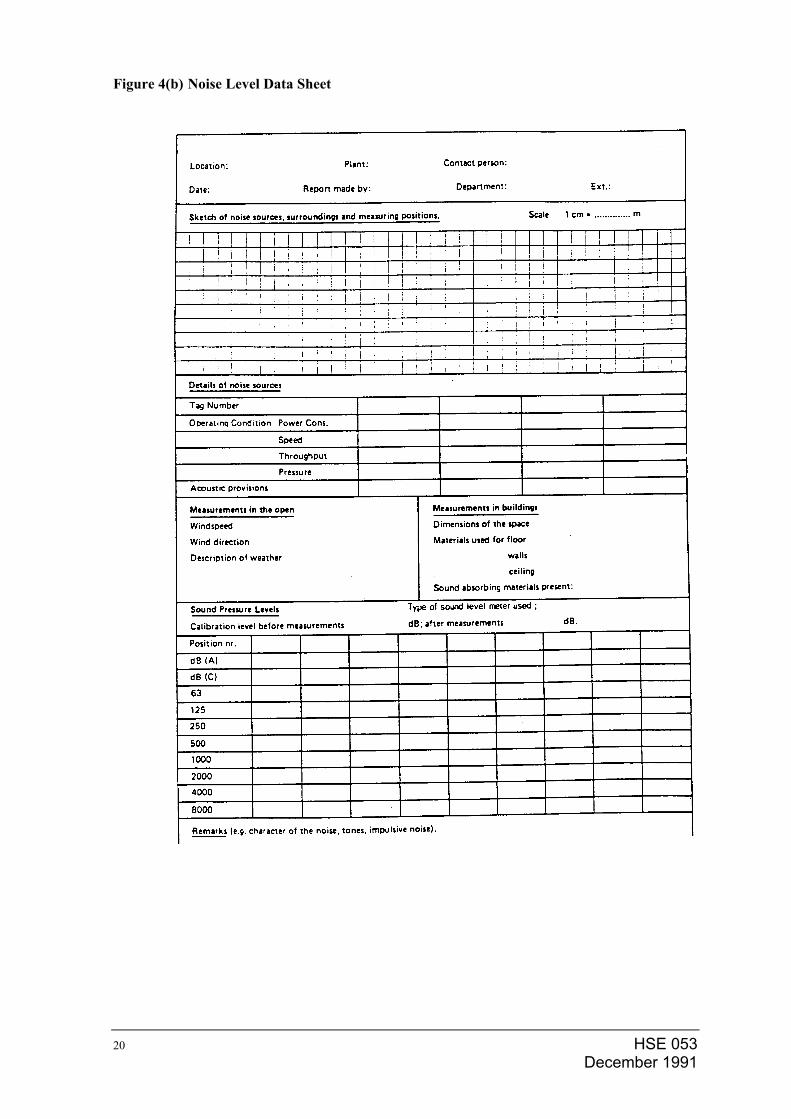
Figure 4(b) Noise Level Data Sheet
HSE 053 December 1991
20
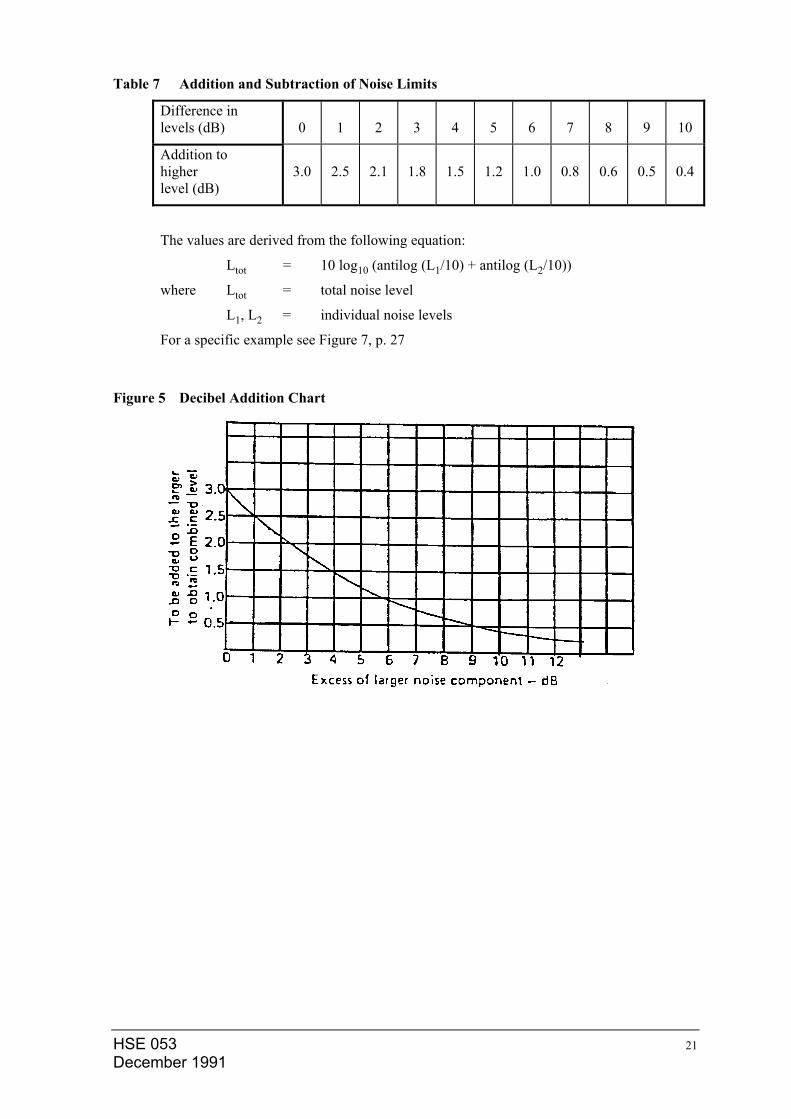
Table 7 Addition and Subtraction of Noise Limits
Difference in levels (dB)
0
1
2
3
4
5
6
7
8
9
10
Addition to higher level (dB)
3.0
2.5
2.1
1.8
1.5
1.2
1.0
0.8
0.6
0.5
0.4
The values are derived from the following equation:
Ltot = 10 log10 (antilog (L1/10) + antilog (L2/10))
where Ltot = total noise level
L1, L2 = individual noise levels
For a specific example see Figure 7, p. 27
Figure 5 Decibel Addition Chart
HSE 053 21 December 1991
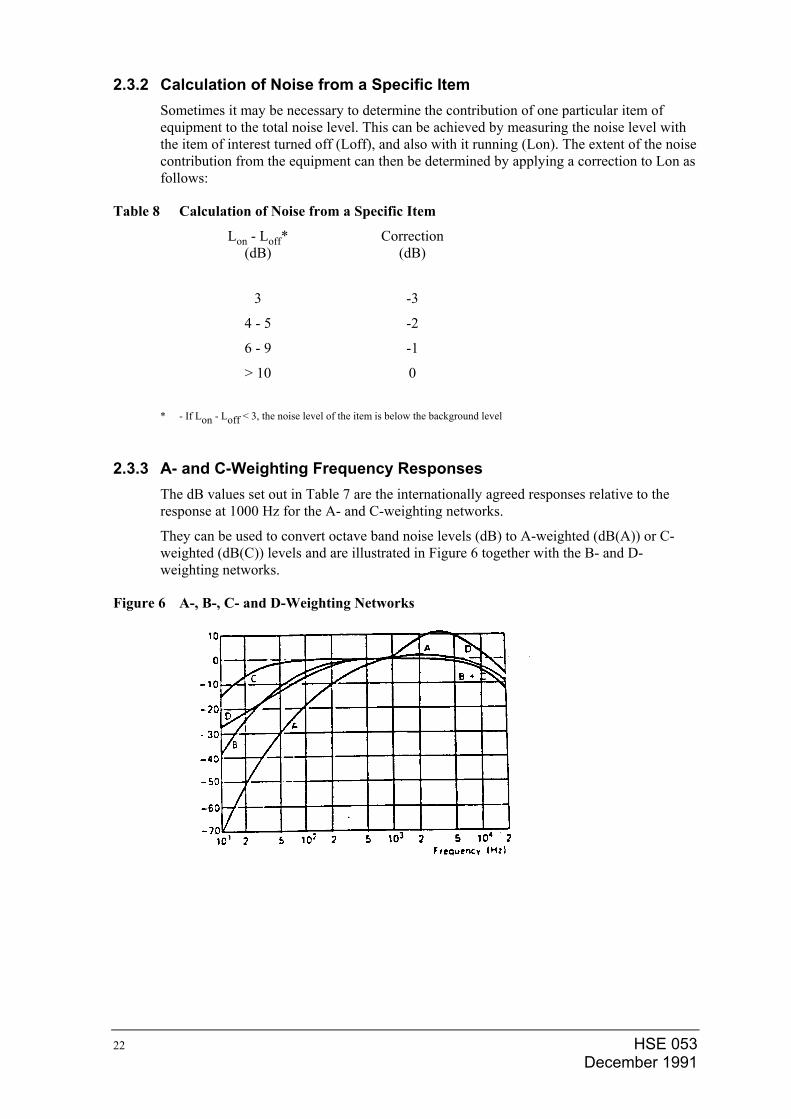
2.3.2 Calculation of Noise from a Specific Item Sometimes it may be necessary to determine the contribution of one particular item of equipment to the total noise level. This can be achieved by measuring the noise level with the item of interest turned off (Loff), and also with it running (Lon). The extent of the noise contribution from the equipment can then be determined by applying a correction to Lon as follows:
Table 8 Calculation of Noise from a Specific Item
Lon - Loff* (dB)
Correction (dB)
3 -3
4 - 5 -2
6 - 9 -1
> 10 0
* - If Lon - Loff < 3, the noise level of the item is below the background level
2.3.3 A- and C-Weighting Frequency Responses The dB values set out in Table 7 are the internationally agreed responses relative to the response at 1000 Hz for the A- and C-weighting networks.
They can be used to convert octave band noise levels (dB) to A-weighted (dB(A)) or C-weighted (dB(C)) levels and are illustrated in Figure 6 together with the B- and D-weighting networks.
Figure 6 A-, B-, C- and D-Weighting Networks
HSE 053 December 1991
22
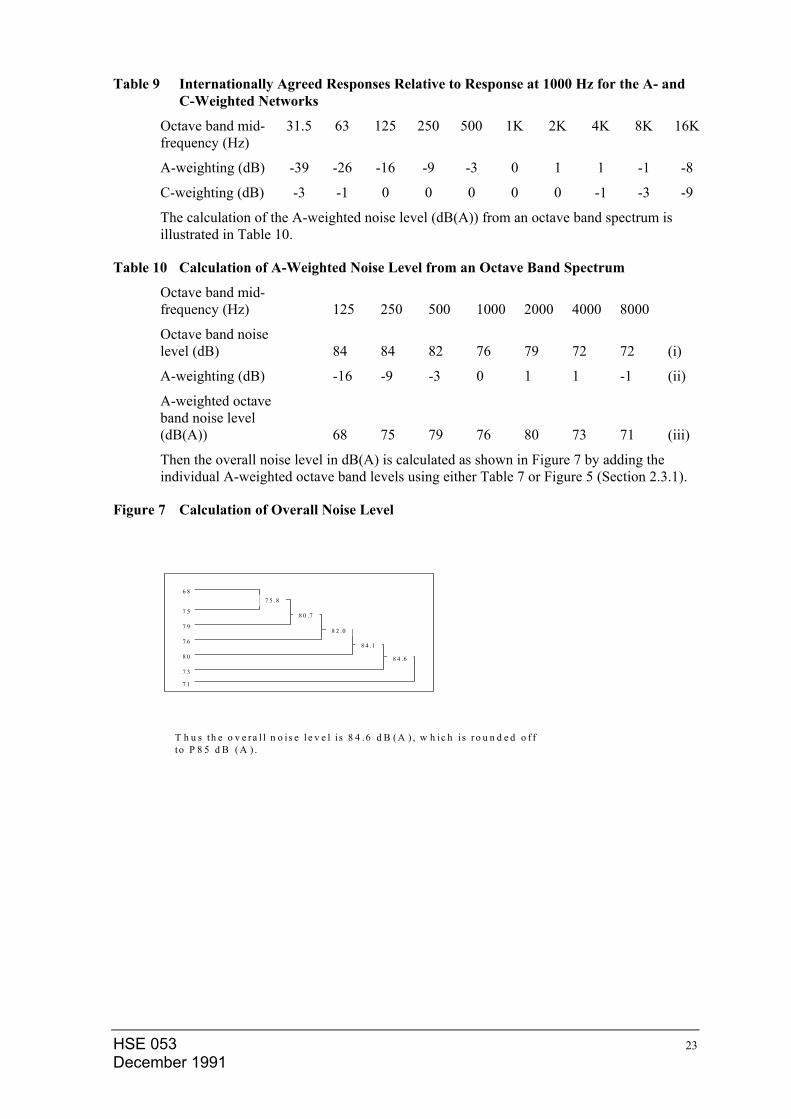
Table 9 Internationally Agreed Responses Relative to Response at 1000 Hz for the A- and C-Weighted Networks
Octave band mid-frequency (Hz)
31.5 63 125 250 500 1K 2K 4K 8K 16K
A-weighting (dB) -39 -26 -16 -9 -3 0 1 1 -1 -8
C-weighting (dB) -3 -1 0 0 0 0 0 -1 -3 -9
The calculation of the A-weighted noise level (dB(A)) from an octave band spectrum is illustrated in Table 10.
Table 10 Calculation of A-Weighted Noise Level from an Octave Band Spectrum
Octave band mid-frequency (Hz)
125
250
500
1000
2000
4000
8000
Octave band noise level (dB)
84
84
82
76
79
72
72
(i)
A-weighting (dB) -16 -9 -3 0 1 1 -1 (ii)
A-weighted octave band noise level (dB(A))
68
75
79
76
80
73
71
(iii)
Then the overall noise level in dB(A) is calculated as shown in Figure 7 by adding the individual A-weighted octave band levels using either Table 7 or Figure 5 (Section 2.3.1).
Figure 7 Calculation of Overall Noise Level
6 8
7 5
7 9
7 6
8 0
7 3
7 1
7 5 .8
8 0 .7
8 2 .0
8 4 .1
8 4 .6
T h u s th e o v e r a l l n o is e l e v e l i s 8 4 .6 d B ( A ) , w h ic h i s r o u n d e d o f fto P 8 5 d B ( A ) .
HSE 053 23 December 1991
It should be noted that the order in which the A-weighted octave band noise levels are added does not matter. In fact it is usually easier to add the higher levels first because, as can be seen from Figure 5 when the cumulative addition level is more than 10-12 dB higher than the remaining components to be added, no further calculated addition to the overall A-weighted sound level is necessary, except for a rounding up of the total level where appropriate.
Alternatively the equation:
Ltot = 10 log10 (antilog L1/10 + antilog L2/10 + ... + antilog Ln/10)
may be used for the addition where:
Ltot = total dB(A) noise level
L1, L2, ..., Ln = individual A-weighted octave band noise levels
2.3.4 Calculation of Equivalent Continuous Noise Level (Leq) A nomogram such as that illustrated in Figure 8 can be used for calculating Leq where the duration of exposure at various noise levels is known. The nomogram is based on a 85 dB(A) Leq (8 hr) limit, although it can be adapted for other noise criteria by appropriate alteration of the dB(A) Leq (8 hr) values. If the total value of f is greater than 1.0, the exposure limit is exceeded. For example, if an operator has the pattern of daily noise exposure shown in Table 11:
Table 11 Example of Pattern of Noise Exposure and the Calculation of Personal Noise Dose
Noise level dB(A)
Exposure duration (minutes)
Fractional exposure (f)
100 10 0.8
100 45 3.5
87 300 1.0
< 80 remainder of day 0.0
Then from the nomogram it can be seen that the fractional exposures (f) are those tabulated and the total equal to 3.3, equivalent to an Leq (8 hr) of 92 dB(A) to the nearest decibel.
HSE 053 December 1991
24
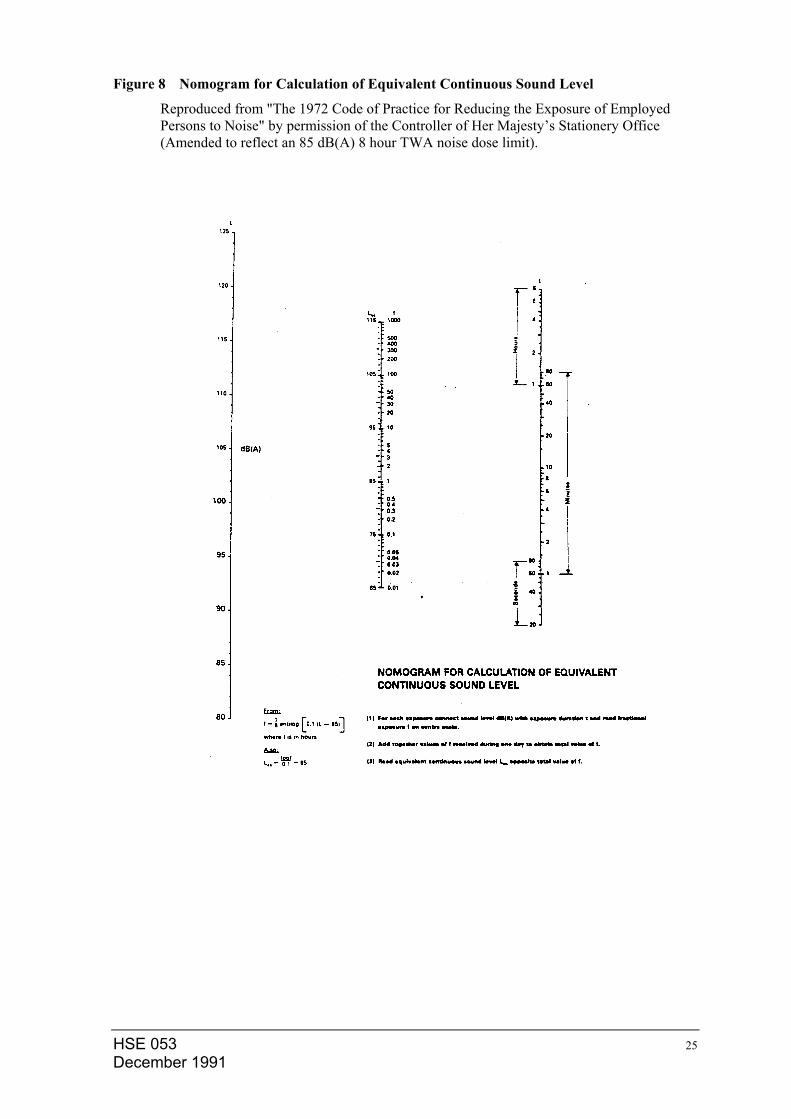
Figure 8 Nomogram for Calculation of Equivalent Continuous Sound Level
Reproduced from "The 1972 Code of Practice for Reducing the Exposure of Employed Persons to Noise" by permission of the Controller of Her Majesty’s Stationery Office (Amended to reflect an 85 dB(A) 8 hour TWA noise dose limit).
HSE 053 25 December 1991
3 NOISE CONTROL
3.1 Introduction
When the installation of potentially noisy new plant or equipment is being considered, or when the evaluation of the existing environment indicates the need for noise control, the recommended approach to minimising the workplace noise is first of all to consider the treatment of the noise source(s), and secondly, where necessary, to consider noise reduction in the path of the sound transmission. If these measures are insufficient, or not reasonably practicable, then attention has to be focused on protecting the worker from the noise.
Specific procedures and techniques are associated with each of the approaches and it is often necessary to take account of all three, in the order of priority recommended, to derive a cost-effective solution. This is particularly relevant for new installations in existing workplaces.
Although some of the important principles and considerations in the noise control treatment of both the source and the transmission path are outlined in this section, reference should be made to the very extensive literature for in-depth guidance and information, including the series of noise specifications that have been produced by the Oil Companies' Materials Association (OCMA) presently distributed by EEMUA (Engineering, Equipment and National Users Association - see Section 9, References) .
Protection of the worker by the use of personal hearing protective devices, the adoption of administrative procedures, etc. is considered in Section 4.
The more important noise sources in industry today are based upon well-proven equipment designs developed some years ago. Change of design in this field has been a slow process, but modifications and new methods of noise reduction have evolved, for example regarding furnaces, valves, electric motors and fin-fan coolers.
The noise control industry has developed a wide range of products such as enclosures, silencers, vibration isolators and noise insulation materials, and use of these is invariably necessary in the design of new plants if current noise requirements in both the work area and the community are to be met. Moreover, in many instances, equipment manufacturers and noise control specialists offer solutions to specific noise problems.
Management commitment to noise control is essential for its success. From a practical point of view the development of planned noise control procedures and equipment noise specifications is vital in achieving an acceptable workplace noise environment.
3.2 Noise Sources
Workplace noise in industry usually arises from a large number of sources. The main ones include:
• rotating equipment;
• combustion equipment;
• valves and piping;
and these are discussed briefly, together with some of the other noise sources.
HSE 053 December 1991
26
HSE 053 27 December 1991
3.2.1 Rotating Equipment
3.2.1.1 Compressors There are many types of compressor, including reciprocating, axial, radial, lobe and screw, all of which have individual noise characteristics.
The smaller screw and lobe compressors are usually very noisy, requiring an enclosure or hood for noise control. Reciprocating compressors, which are slow-moving low-frequency noise emitting sources can also present a noise problem. Noise control may involve an acoustic enclosure, permanent building or the equivalent surrounded by acoustic walls.
Large radial and axial compressors often have a set of associated intercoolers and auxiliary equipment. It is customary to place the less noisy compressor housing on a separate slab foundation within a compressor room, with the more noisy intercoolers and auxiliaries located underneath. These can be enclosed in an absorbent housing for noise control purposes.
The connecting pipework between stages and intercoolers can be extremely noisy. Acoustical lagging of the pipework, intercoolers and vessels, combined with in-line silencers, has proven an effective means of reducing noise.
3.2.1.2 Drivers Steam turbines, gas turbines and electric motors are used as drivers for rotating equipment through direct drives and gearing. Steam turbines can be very noisy due to steam piping and leakages, although the turbine housing is usually a less important noise emitter. Noise reduction can be achieved by pipe lagging and by installing an enclosure around the turbine.
Both high and low voltage electric motors are available. The large high voltage motors (water-cooled) are not normally significant noise sources but the low voltage motors, of which there is a wide range, can present problems. However, some manufacturers now supply low-noise motors as standard.
3.2.1.3 Gears High noise levels are often associated with the operation of gears and this is related to manufacturing and mesh tolerances. Some manufacturers can provide, at extra cost, gears that give less noise emission. The use of acoustic enclosures can often not be avoided.
3.2.1.4 Pumps Normally pumps are not major noise sources, but large boiler feed water pumps may need consideration from a noise control point of view.
3.2.1.5 Fans Induced and forced-draught air and flue gas fans are used in connection with boilers, furnaces and also for ventilation purposes. Noise emission tends to increase with pressure drop and the frequency of the noise increases with increasing speed. Acoustical lagging of the fan housing and ductwork, and the installation of inlet and outlet silencers can significantly reduce noise emission.
3.2.1.6 Air-Fin Coolers Traditionally, air-fin coolers were amongst the more important noise sources in oil and petrochemical plants, where redundant aeroplane propellers with few blades, narrow hubs and high tip speed (above 60 m/sec) were used. Lower tip speed (30 m/sec), aero-
dynamically shaped blades and additional blades can achieve a significant noise reduction for the same heat load.
Today there is a variety of designs with greatly reduced noise emission. This is achieved by using more and wider blades, wider hubs and lowered tip speed. In addition the cowling is bell-shaped to limit eddies. Modern air-fin coolers are 10-12 dB quieter compared with older designs.
3.2.2 Combustion Equipment
3.2.2.1 Boilers Low-frequency noise originating from burner turbulence is generated within boilers, and unless the structural walls are acoustically lagged, vibrations and associated noise emission can arise in the workplace.
Draught fans for boiler duty are often large and sources of low-frequency noise; silencers may be needed. The flue stack can also be a major low-frequency noise emitter.
3.2.2.2 Furnaces Noise from furnaces is caused mainly by combustion sound, and the intensity depends on the type of burners and the fuelling method. Noise emission from gas-fired burners tends to be higher than with oil-fired burners, increasing with firing rate. In recent years the silencing of natural draught furnaces has been achieved by the use of mufflers on individual burners and plenum chambers around air registers whereas noise emission from forced draught furnaces can be reduced by introducing fan silencers.
3.2.2.3 Flares The nature and throughput of a process, and the type of flare tip, can all have a major influence on the noise emission from flares. Nevertheless, flares are not usually a problem as far as work area noise is concerned because they tend to be located some distance away; they can, however, be significant sources for community noise.
Although noise reduction can be achieved by an appropriate choice of flare tip, there is as yet little reliable information about noise emission from flares on which to base this choice.
3.2.3 Valves and Piping Gas control valves and associated pipe-work are important sources contributing to work area noise. Noise emission increases with pressure drop and mass flow. Most control valve manufacturers today have a selection of low-noise valves, in-line silencers and diffusers particularly designed for high pressure drop.
The low-noise valves often employ novel designs to step pressure reduction and prevent pressure recovery, and reductions up to 20-30 dB over standard types can be obtained. The main penalty for reducing noise emission is a higher cost and a reduced mass flow. If the gas is not clean, the staggered narrow holes of the low-noise valves may get clogged.
Acoustical lagging (and mantling) can achieve a large reduction in noise emission from gas carrying pipes. Pipework transporting liquid streams is usually a smaller noise emitter but cavitation can give rise to noise problems.
3.2.4 Vents Gas and steam vents can be important noise sources, but noise emission can be minimised by using low noise valves, in-line silencers or vent silencers.
HSE 053 December 1991
28
HSE 053 29 December 1991
3.2.5 Steam leakages In an operating plant a substantial contribution to general work area noise can arise from steam purging and steam leakages. Furthermore, during winter operation it may be necessary for steam to be used to avoid the freezing of lines, although excessive noise can be avoided relatively simply by the use of silencers, etc.
The contribution of leakages can be minimised by the routine reporting of their existence coupled with a system of rapid corrective maintenance.
3.2.6 Vibrating equipment and structures The propagation of airborne noise can result from vibrating machinery, which itself can be a vibration emitter or induce secondary vibration in plates and structures. Machinery vibration normally increases with time and a rigorous maintenance policy is an important factor in minimising such noise emission.
3.2.7 Drilling operations equipment In drilling operations one of the greatest sources of noise is the mechanically driven blowers on the diesel engines of the rig power plant. On offshore rigs the noise from the prime movers can be both constant and excessive during certain drilling operations. Where practicable acoustic shields or screening should be applied. If this is not practicable, hearing protection must be worn.
3.2.8 Helicopter travel Noise levels at the unprotected ear during helicopter travel can often exceed 90 dB(A). During a one hour flight at such a noise level a passenger would receive 50% of the allowable daily noise dose. Any further exposures above 85 dB(A) during that day would be additive.
Hearing protection should be worn during helicopter travel where the cabin noise level is above 85 dB(A).
3.3 Noise Control
It is necessary to plan for noise control at the design stage of a plant in order to comply with recommended workplace noise level and noise exposure limits. This is invariably less expensive than the retrofitting of noise abatement material.
As well as noise specifications for new plant, the addition of new equipment to existing plant also requires careful consideration at the design stage.
In such instances an analysis of the ambient noise levels is an essential prerequisite in planning noise control for the new, and the existing, equipment.
The selection of upper acceptable noise criteria for equipment may need to be based on at least two important considerations, namely the work area noise limit and the neighbourhood noise limit. Therefore, where necessary, both should be taken into account.
An example of a planned staged procedure for noise control is outlined in Table 12, and Appendix D of EEMUA 140 (2) gives an example of how to specify equipment noise.
Reference should also be made to Noise Control DEP 31.10.00.31 Gen.
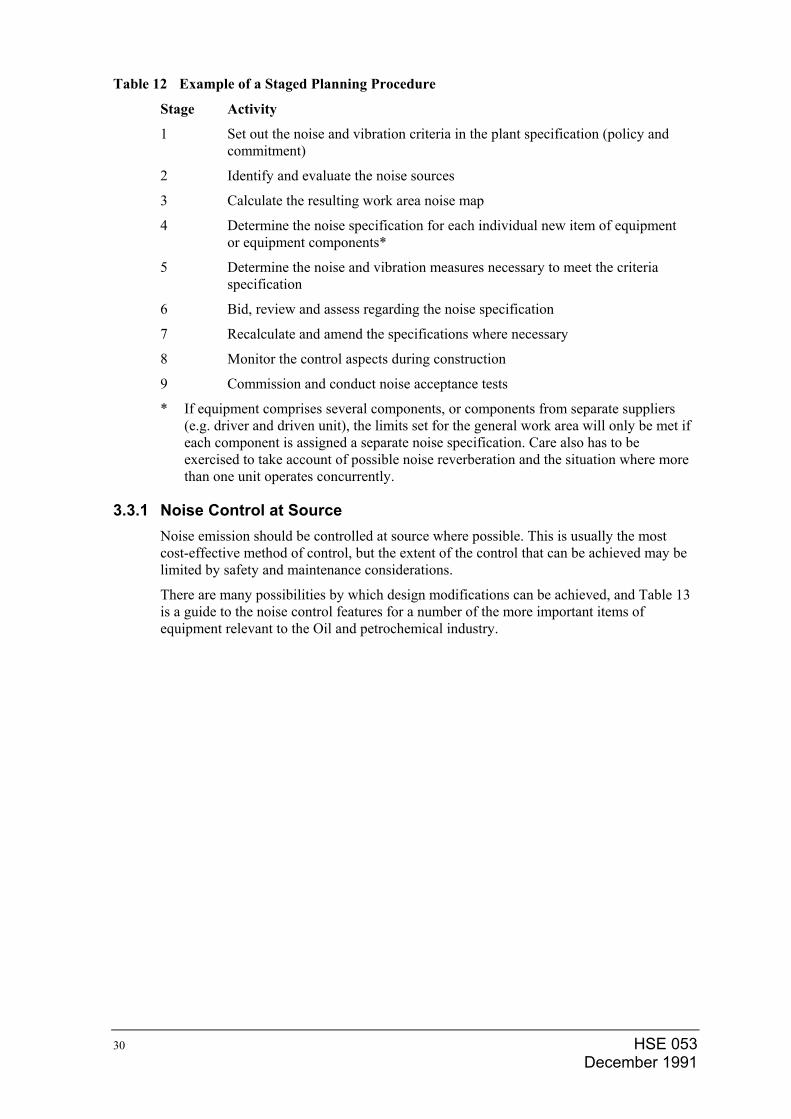
Table 12 Example of a Staged Planning Procedure
Stage Activity
1 Set out the noise and vibration criteria in the plant specification (policy and commitment)
2 Identify and evaluate the noise sources
3 Calculate the resulting work area noise map
4 Determine the noise specification for each individual new item of equipment or equipment components*
5 Determine the noise and vibration measures necessary to meet the criteria specification
6 Bid, review and assess regarding the noise specification
7 Recalculate and amend the specifications where necessary
8 Monitor the control aspects during construction
9 Commission and conduct noise acceptance tests
* If equipment comprises several components, or components from separate suppliers (e.g. driver and driven unit), the limits set for the general work area will only be met if each component is assigned a separate noise specification. Care also has to be exercised to take account of possible noise reverberation and the situation where more than one unit operates concurrently.
3.3.1 Noise Control at Source Noise emission should be controlled at source where possible. This is usually the most cost-effective method of control, but the extent of the control that can be achieved may be limited by safety and maintenance considerations.
There are many possibilities by which design modifications can be achieved, and Table 13 is a guide to the noise control features for a number of the more important items of equipment relevant to the Oil and petrochemical industry.
HSE 053 December 1991
30
HSE 053 31 December 1991
3.3.2 Noise Control in the Transmission Path Where practicable, the most effective method of controlling noise in the transmission path is by the introduction of enclosures, although sometimes barriers can also be extremely useful. Both enclosures and barriers are available in different thicknesses and shapes with noise transmission losses to suit a wide variety of applications. Thin enclosures and barriers can be used successfully with high frequency sources. For low-frequency sources the enclosures and barriers should have a high density.
3.3.2.1 Enclosures Enclosures can be made to fully or partially enclose a noise source, and the performance will depend on the extent of enclosure and the transmission loss of the materials used. Usually a full enclosure gives the best result but partial enclosures can be effective with highly directional noise sources.
3.3.2.2 Acoustic Control of Reverberation Time For noise sources located within a building, the resulting sound level will depend on the absorption factors of the inner surfaces of the building. By using absorptive surface materials on the ceiling and walls, the noise level can be reduced significantly (up to 5 dB) although this approach does not reduce the component of the noise energy received directly by the individual. As a rule of thumb, the combined absorption coefficient should not be less than 0.2 for frequencies above 200 Hz.
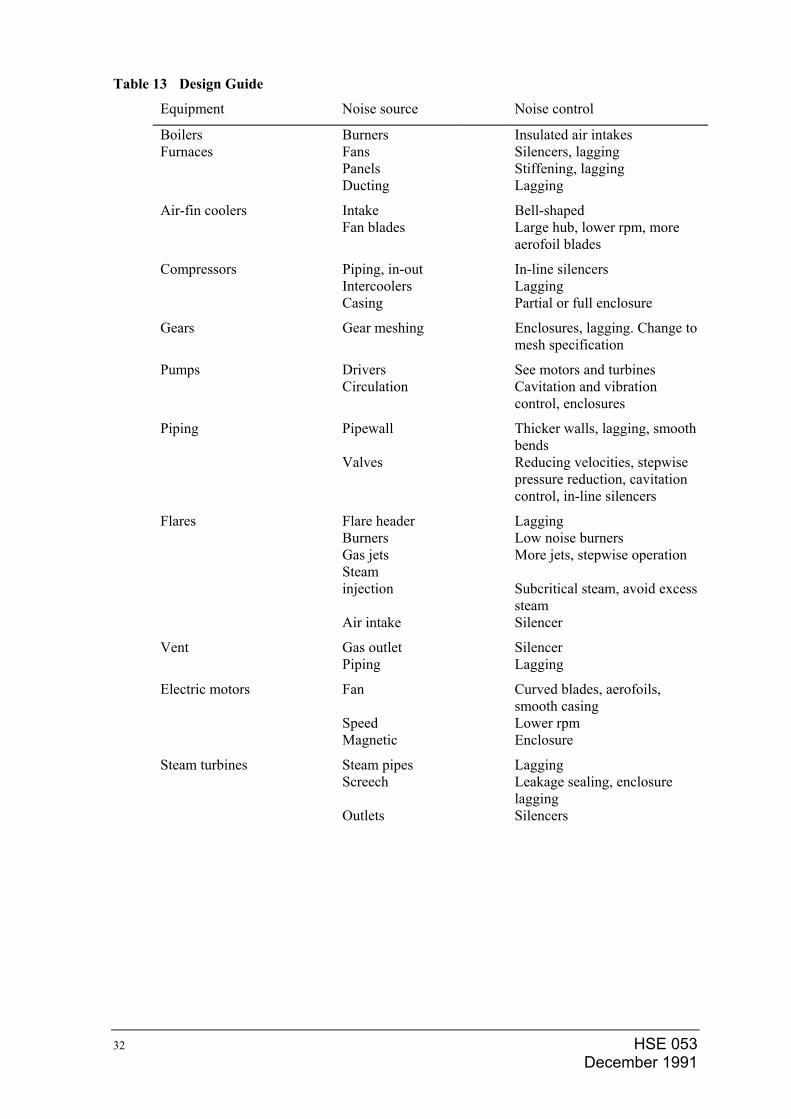
Table 13 Design Guide
Equipment Noise source Noise control
Boilers Burners Insulated air intakes Furnaces Fans
Panels Ducting
Silencers, lagging Stiffening, lagging Lagging
Air-fin coolers Intake Fan blades
Bell-shaped Large hub, lower rpm, more aerofoil blades
Compressors Piping, in-out Intercoolers Casing
In-line silencers Lagging Partial or full enclosure
Gears Gear meshing Enclosures, lagging. Change to mesh specification
Pumps Drivers Circulation
See motors and turbines Cavitation and vibration control, enclosures
Piping Pipewall Valves
Thicker walls, lagging, smooth bends Reducing velocities, stepwise pressure reduction, cavitation control, in-line silencers
Flares Flare header Burners Gas jets Steam injection Air intake
Lagging Low noise burners More jets, stepwise operation Subcritical steam, avoid excesssteam Silencer
Vent Gas outlet Piping
Silencer Lagging
Electric motors Fan Speed Magnetic
Curved blades, aerofoils, smooth casing Lower rpm Enclosure
Steam turbines Steam pipes Screech Outlets
Lagging Leakage sealing, enclosure lagging Silencers
HSE 053 December 1991
32
HSE 053 33 December 1991
3.3.2.3 Vibration Isolation The addition of rubber isolators or steel springs to a vibrating or rotational noise source can reduce the force transmitted to the foundations. Steel springs may be necessary for heavy loads, although they give poor inner damping, whereas rubber isolators are suitable for lower loads and low resonance frequencies.
3.4 Maintenance
Mechanical wear and tear can give rise to a substantial increase in noise emission and therefore regular maintenance has an important role in minimising workplace noise.
Another essential element is the maintenance of acoustic enclosures and pipe insulation to ensure that they remain in good condition. It is necessary to make certain that such enclosures and insulation are correctly replaced if removed. Education and training of the maintenance personnel in these aspects of noise control is important in achieving a successful result.
4 PERSONAL PROTECTION
4.1 Introduction
The control of excessive exposure to noise at work should be achieved by measures such as reduction of the noise at source, enclosure of the noise source, or via some other form of segregation of the noise from the worker. When such action is insufficient or not reasonably practicable, personal hearing protective devices can offer effective noise exposure control provided that they are chosen carefully, worn properly and, where appropriate, maintained. Therefore, although protective devices should be regarded as the last resort in exposure control, when their use is necessary they are extremely important because they represent the last line of defence. However, their use should not preclude the ongoing evaluation of noise control (see Section 3).
4.2 Types of Personal Hearing Protective Devices
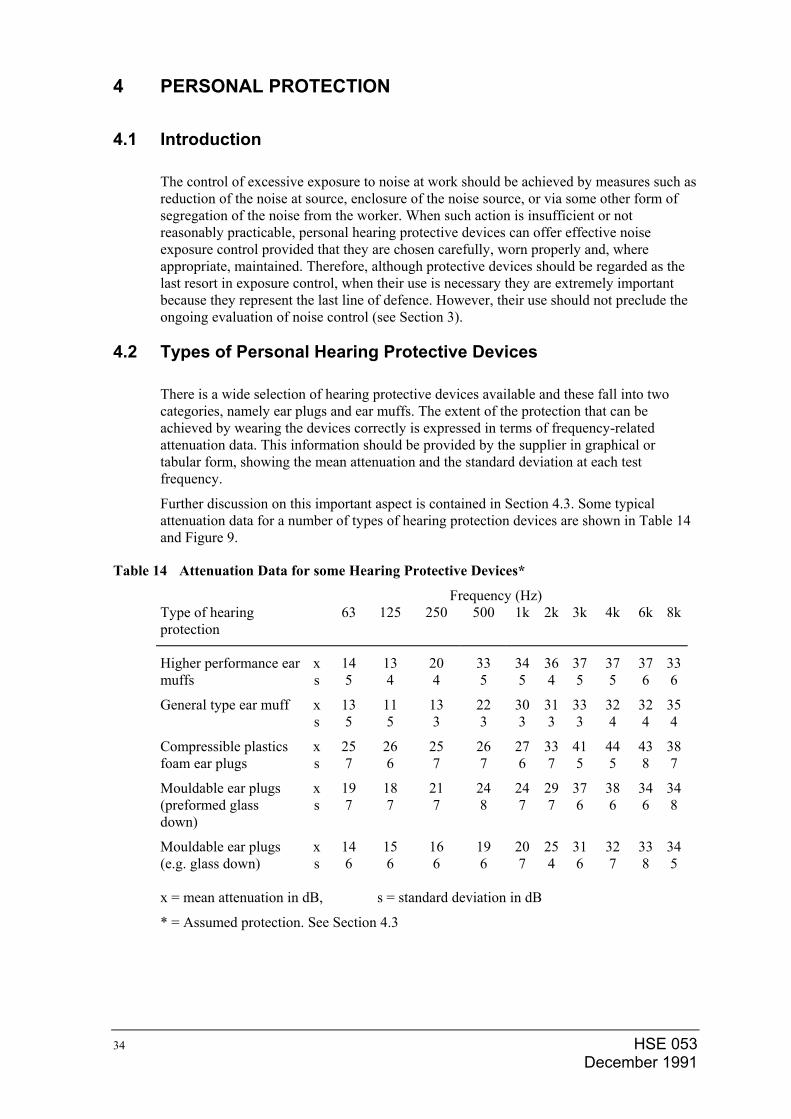
There is a wide selection of hearing protective devices available and these fall into two categories, namely ear plugs and ear muffs. The extent of the protection that can be achieved by wearing the devices correctly is expressed in terms of frequency-related attenuation data. This information should be provided by the supplier in graphical or tabular form, showing the mean attenuation and the standard deviation at each test frequency.
Further discussion on this important aspect is contained in Section 4.3. Some typical attenuation data for a number of types of hearing protection devices are shown in Table 14 and Figure 9.
Table 14 Attenuation Data for some Hearing Protective Devices*
Frequency (Hz) Type of hearing protection
63 125 250 500 1k 2k 3k 4k 6k 8k
Higher performance ear muffs
x s
14 5
13 4
20 4
33 5
34 5
364
37 5
37 5
37 6
336
General type ear muff x s
13 5
11 5
13 3
22 3
30 3
313
33 3
32 4
32 4
354
Compressible plastics foam ear plugs
x s
25 7
26 6
25 7
26 7
27 6
337
41 5
44 5
43 8
387
Mouldable ear plugs (preformed glass down)
x s
19 7
18 7
21 7
24 8
24 7
297
37 6
38 6
34 6
348
Mouldable ear plugs (e.g. glass down)
x s
14 6
15 6
16 6
19 6
20 7
254
31 6
32 7
33 8
345
x = mean attenuation in dB, s = standard deviation in dB
* = Assumed protection. See Section 4.3
HSE 053 December 1991
34
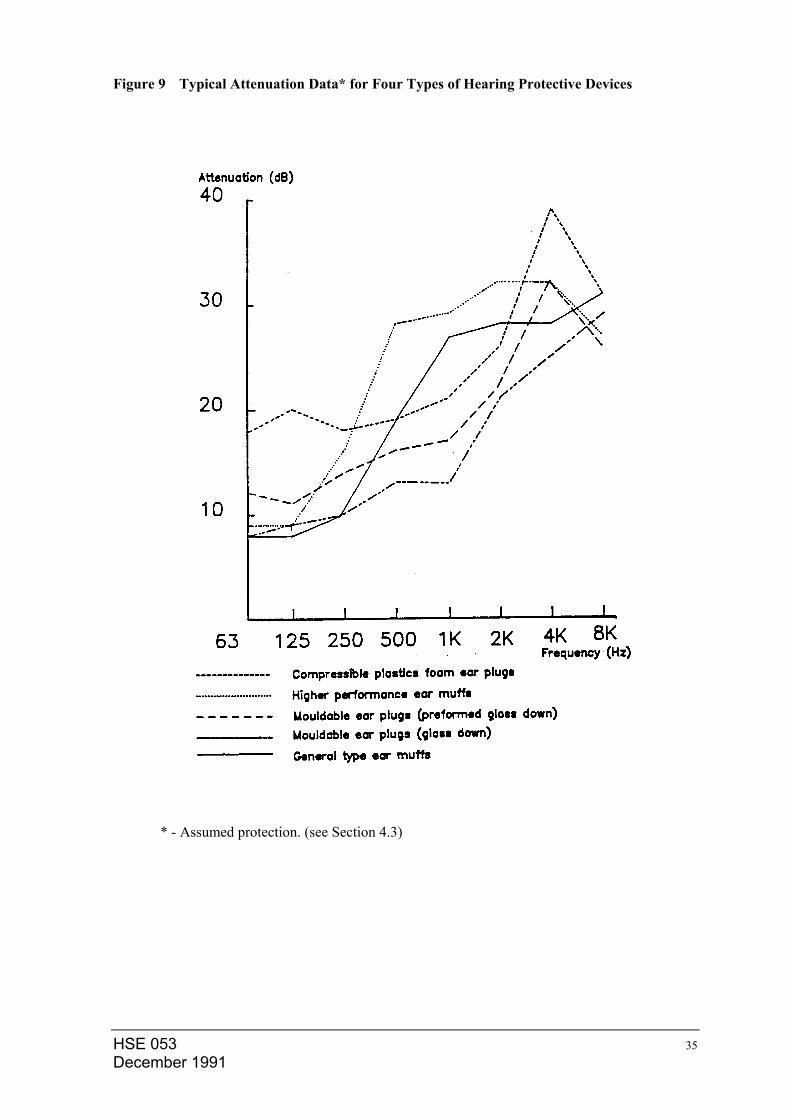
Figure 9 Typical Attenuation Data* for Four Types of Hearing Protective Devices
* - Assumed protection. (see Section 4.3)
HSE 053 35 December 1991
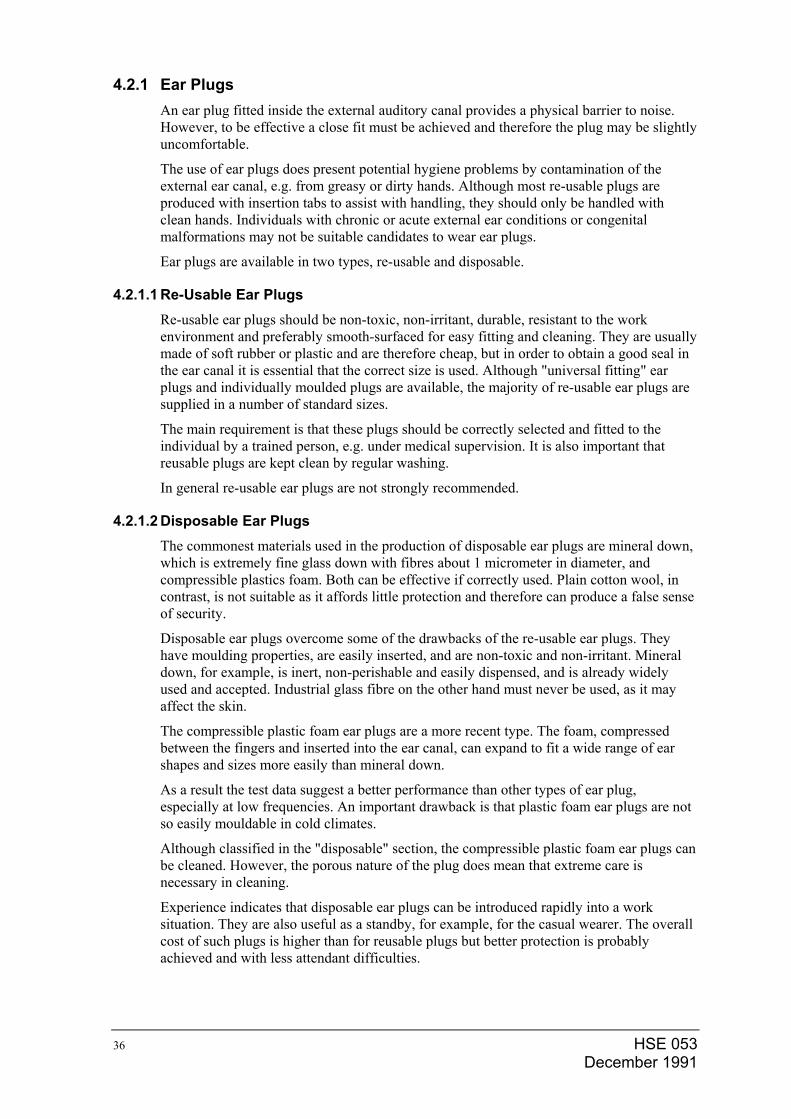
4.2.1 Ear Plugs An ear plug fitted inside the external auditory canal provides a physical barrier to noise. However, to be effective a close fit must be achieved and therefore the plug may be slightly uncomfortable.
The use of ear plugs does present potential hygiene problems by contamination of the external ear canal, e.g. from greasy or dirty hands. Although most re-usable plugs are produced with insertion tabs to assist with handling, they should only be handled with clean hands. Individuals with chronic or acute external ear conditions or congenital malformations may not be suitable candidates to wear ear plugs.
Ear plugs are available in two types, re-usable and disposable.
4.2.1.1 Re-Usable Ear Plugs Re-usable ear plugs should be non-toxic, non-irritant, durable, resistant to the work environment and preferably smooth-surfaced for easy fitting and cleaning. They are usually made of soft rubber or plastic and are therefore cheap, but in order to obtain a good seal in the ear canal it is essential that the correct size is used. Although "universal fitting" ear plugs and individually moulded plugs are available, the majority of re-usable ear plugs are supplied in a number of standard sizes.
The main requirement is that these plugs should be correctly selected and fitted to the individual by a trained person, e.g. under medical supervision. It is also important that reusable plugs are kept clean by regular washing.
In general re-usable ear plugs are not strongly recommended.
4.2.1.2 Disposable Ear Plugs The commonest materials used in the production of disposable ear plugs are mineral down, which is extremely fine glass down with fibres about 1 micrometer in diameter, and compressible plastics foam. Both can be effective if correctly used. Plain cotton wool, in contrast, is not suitable as it affords little protection and therefore can produce a false sense of security.
Disposable ear plugs overcome some of the drawbacks of the re-usable ear plugs. They have moulding properties, are easily inserted, and are non-toxic and non-irritant. Mineral down, for example, is inert, non-perishable and easily dispensed, and is already widely used and accepted. Industrial glass fibre on the other hand must never be used, as it may affect the skin.
The compressible plastic foam ear plugs are a more recent type. The foam, compressed between the fingers and inserted into the ear canal, can expand to fit a wide range of ear shapes and sizes more easily than mineral down.
As a result the test data suggest a better performance than other types of ear plug, especially at low frequencies. An important drawback is that plastic foam ear plugs are not so easily mouldable in cold climates.
Although classified in the "disposable" section, the compressible plastic foam ear plugs can be cleaned. However, the porous nature of the plug does mean that extreme care is necessary in cleaning.
Experience indicates that disposable ear plugs can be introduced rapidly into a work situation. They are also useful as a standby, for example, for the casual wearer. The overall cost of such plugs is higher than for reusable plugs but better protection is probably achieved and with less attendant difficulties.
HSE 053 December 1991
36
4.2.2 Ear Muffs A large number of models of ear muffs is available, but basically of similar construction. A pair comprises two rigid plastic cups, each fitting over an external ear, connected by an adjustable head or neck band. The seal between the head and cups is achieved by soft cushions attached to the cups and filled with either foam or fluid. Although the latter is more efficient, damage to a fluid-seal can result in leakage of the liquid and consequent reduction in effectiveness. Prolonged use of foam-seal, on the other hand can adversely affect the elasticity, thereby reducing the efficiency. The cups are lined with sound absorbent material, foam, to reduce high frequency resonance within the enclosures.
In general, ear muffs can provide good protection, although the extent of the noise attenuation required is not the only important factor. The construction, for example, should be sufficiently robust for the working conditions and the materials used should be resistant to perspiration, skin or hair oil, and influences of the work environment. Long hair and the wearing of spectacles may preclude a good fit, thereby reducing the efficiency of ear muffs. Comfort, too, is an important factor in the effective implementation of hearing protection programmes. Discomfort, for example, may occur when ear muffs are worn in conjunction with spectacles. In addition, efficiency can be impaired by an incorrectly tensioned head band and poor maintenance, e.g. worn or damaged seals. A system of regular inspections and maintenance is therefore essential if ear muffs are used.
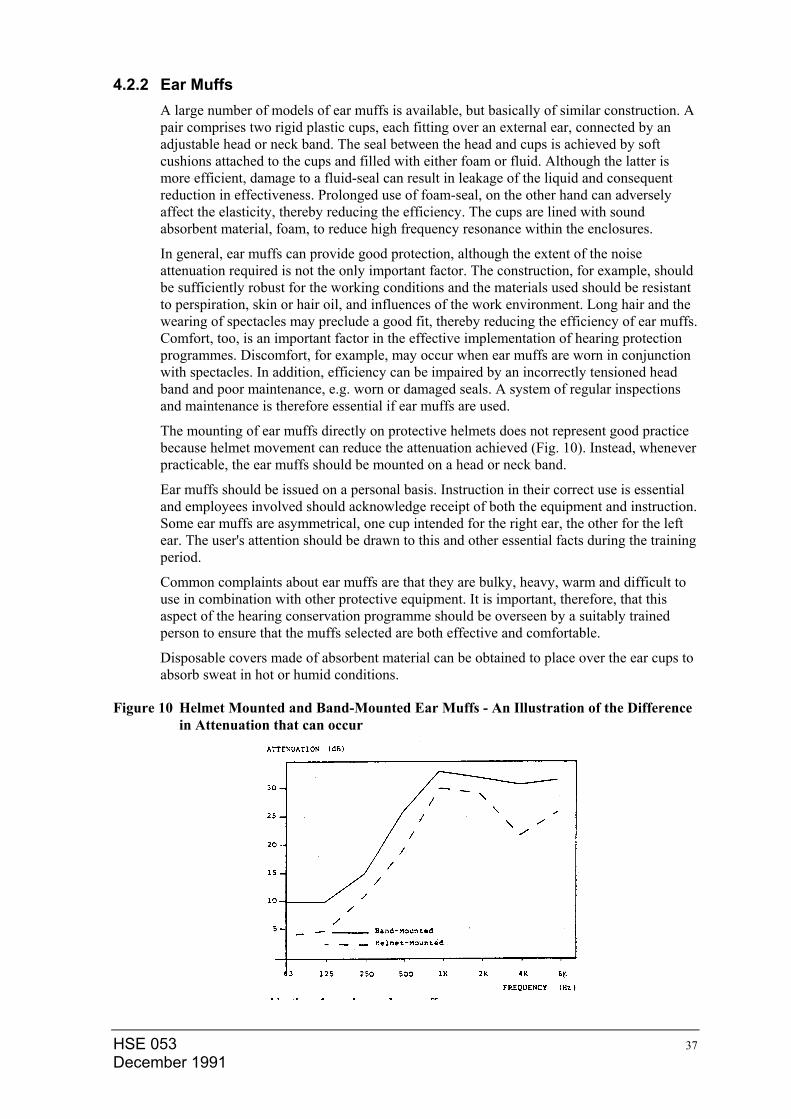
The mounting of ear muffs directly on protective helmets does not represent good practice because helmet movement can reduce the attenuation achieved (Fig. 10). Instead, whenever practicable, the ear muffs should be mounted on a head or neck band.
Ear muffs should be issued on a personal basis. Instruction in their correct use is essential and employees involved should acknowledge receipt of both the equipment and instruction. Some ear muffs are asymmetrical, one cup intended for the right ear, the other for the left ear. The user's attention should be drawn to this and other essential facts during the training period.
Common complaints about ear muffs are that they are bulky, heavy, warm and difficult to use in combination with other protective equipment. It is important, therefore, that this aspect of the hearing conservation programme should be overseen by a suitably trained person to ensure that the muffs selected are both effective and comfortable.
Disposable covers made of absorbent material can be obtained to place over the ear cups to absorb sweat in hot or humid conditions.
Figure 10 Helmet Mounted and Band-Mounted Ear Muffs - An Illustration of the Difference in Attenuation that can occur
HSE 053 37 December 1991
4.2.3 Combination of Ear Plugs and Ear Muffs Sometimes it is necessary to provide personal protection for work in areas where very high noise levels prevail. If ear muffs provide insufficient protection, a combination of ear plugs and ear muffs may be advised.
However, the overall attenuation given is not the arithmetic sum of the attenuation provided separately by each of the devices because of transmission of sound by other routes e.g. via bone conduction. An attenuation of 5-7 dB(A) above that provided by ear muffs alone is normally achieved.
4.2.4 Special Types of Hearing Protective Devices Frequency-selective protectors are special types of hearing protective devices that modify the traditional attenuation properties. Usually they are designed to allow low-frequency "speech sound" to pass whilst excluding the more damaging higher frequency noise. Improved speech communication can be achieved if the noise is essentially of high-frequency character but there are few suitable applications in the petroleum industry.
4.3 Sound Attenuation of Hearing Protection
The manufacturer's test data for hearing protective devices, previously referred to in Section 4.2, may be to ISO standard 4869 (4). However, it is not possible to express the attenuation characteristics for any individual devices in terms of an overall noise level (dB(A)) as the extent of the protection offered is dependent on the frequency distribution of the noise.
As indicated in Section 4.2, the attenuation test data for hearing protective devices incorporate both the mean attenuation and the standard deviation determined at each test frequency, and are normally derived under "ideal" test conditions. Some typical attenuation data are illustrated in Table 14 and Figure 9.
It is clear that the degree of protection varies considerably as a function of frequency, being much greater at higher frequencies. The standard deviation is important because this is a measure of the way in which individual test results vary from the mean attenuation. This is due to variation in the size and shape of heads and ears, and fit. The smaller the deviation the more consistent are the test results. Traditionally, the degree of protection provided to most people at each test frequency is quoted as the "assumed protection". This is calculated as the mean protection minus one standard deviation. Under ideal test circumstances approximately 85% of people would achieve this level of protection or better. Sometimes the assumed level of protection is represented by the mean attenuation minus twice the standard deviation and in these cases 97% of persons can be protected. The importance of wearing hearing protection throughout the exposure period is addressed in Section 4.5.
HSE 053 December 1991
38
HSE 053 39 December 1991
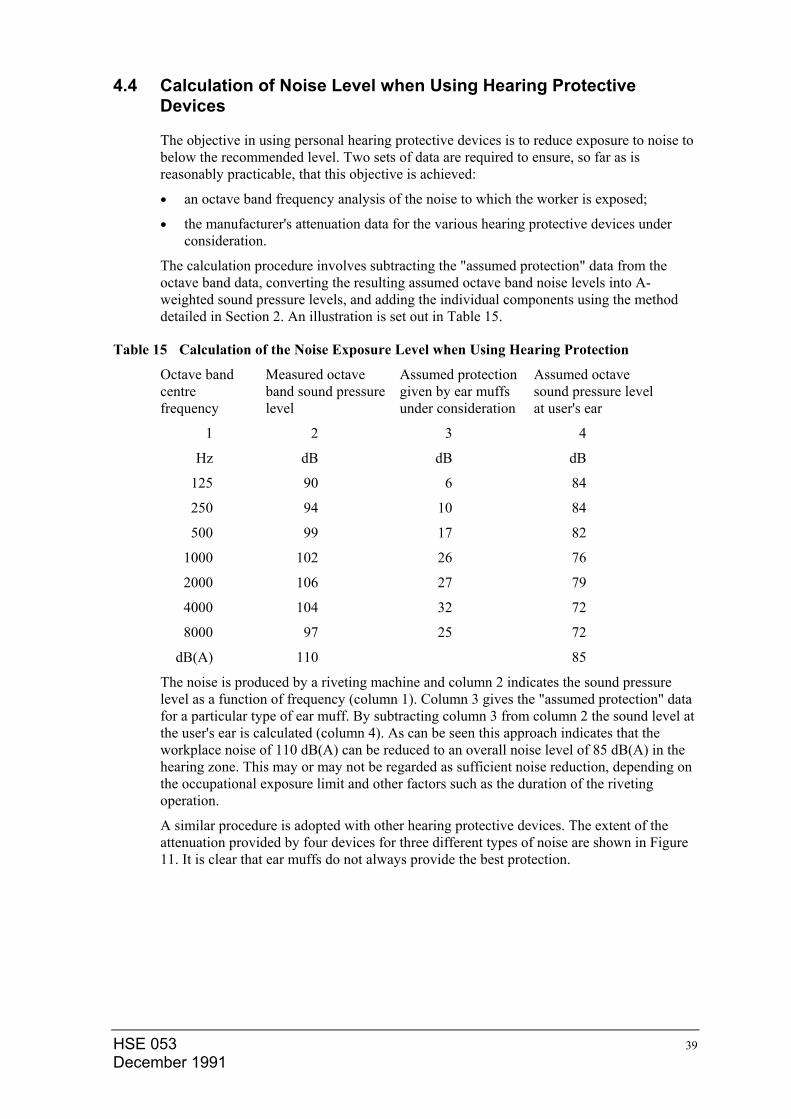
4.4 Calculation of Noise Level when Using Hearing Protective Devices
The objective in using personal hearing protective devices is to reduce exposure to noise to below the recommended level. Two sets of data are required to ensure, so far as is reasonably practicable, that this objective is achieved:
• an octave band frequency analysis of the noise to which the worker is exposed;
• the manufacturer's attenuation data for the various hearing protective devices under consideration.
The calculation procedure involves subtracting the "assumed protection" data from the octave band data, converting the resulting assumed octave band noise levels into A-weighted sound pressure levels, and adding the individual components using the method detailed in Section 2. An illustration is set out in Table 15.
Table 15 Calculation of the Noise Exposure Level when Using Hearing Protection
Octave band centre frequency
Measured octave band sound pressure level
Assumed protection given by ear muffs under consideration
Assumed octave sound pressure level at user's ear
1 2 3 4
Hz dB dB dB
125 90 6 84
250 94 10 84
500 99 17 82
1000 102 26 76
2000 106 27 79
4000 104 32 72
8000 97 25 72
dB(A) 110 85
The noise is produced by a riveting machine and column 2 indicates the sound pressure level as a function of frequency (column 1). Column 3 gives the "assumed protection" data for a particular type of ear muff. By subtracting column 3 from column 2 the sound level at the user's ear is calculated (column 4). As can be seen this approach indicates that the workplace noise of 110 dB(A) can be reduced to an overall noise level of 85 dB(A) in the hearing zone. This may or may not be regarded as sufficient noise reduction, depending on the occupational exposure limit and other factors such as the duration of the riveting operation.
A similar procedure is adopted with other hearing protective devices. The extent of the attenuation provided by four devices for three different types of noise are shown in Figure 11. It is clear that ear muffs do not always provide the best protection.
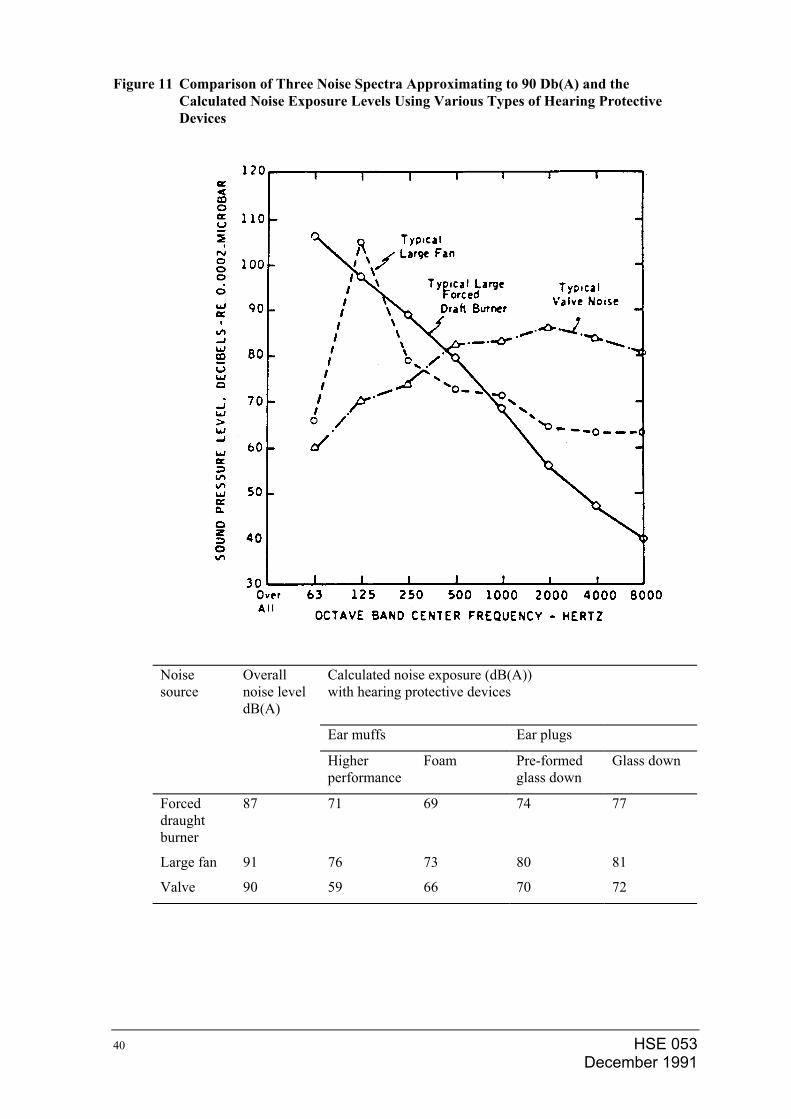
Figure 11 Comparison of Three Noise Spectra Approximating to 90 Db(A) and the Calculated Noise Exposure Levels Using Various Types of Hearing Protective Devices
Noise source
Overall noise level dB(A)
Calculated noise exposure (dB(A)) with hearing protective devices
Ear muffs Ear plugs
Higher performance
Foam Pre-formed glass down
Glass down
Forced draught burner
87 71 69 74 77
Large fan 91 76 73 80 81
Valve 90 59 66 70 72
HSE 053 December 1991
40
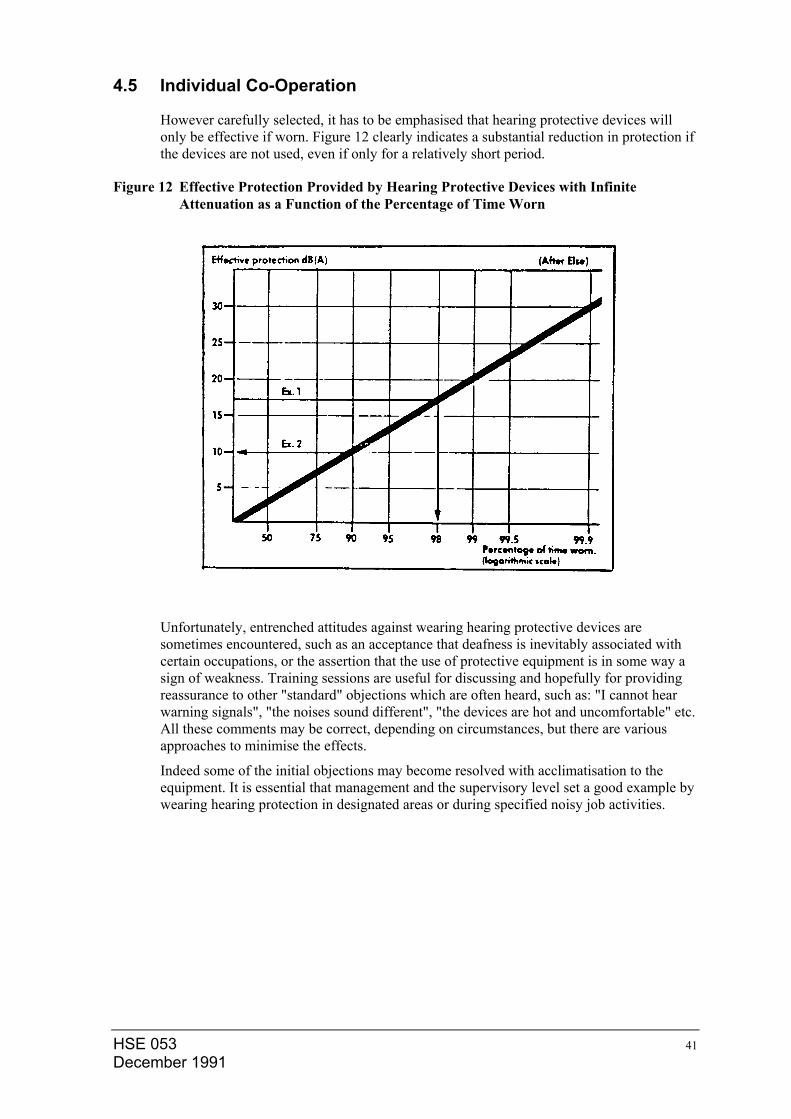
4.5 Individual Co-Operation
However carefully selected, it has to be emphasised that hearing protective devices will only be effective if worn. Figure 12 clearly indicates a substantial reduction in protection if the devices are not used, even if only for a relatively short period.
Figure 12 Effective Protection Provided by Hearing Protective Devices with Infinite Attenuation as a Function of the Percentage of Time Worn
Unfortunately, entrenched attitudes against wearing hearing protective devices are sometimes encountered, such as an acceptance that deafness is inevitably associated with certain occupations, or the assertion that the use of protective equipment is in some way a sign of weakness. Training sessions are useful for discussing and hopefully for providing reassurance to other "standard" objections which are often heard, such as: "I cannot hear warning signals", "the noises sound different", "the devices are hot and uncomfortable" etc. All these comments may be correct, depending on circumstances, but there are various approaches to minimise the effects.
Indeed some of the initial objections may become resolved with acclimatisation to the equipment. It is essential that management and the supervisory level set a good example by wearing hearing protection in designated areas or during specified noisy job activities.
HSE 053 41 December 1991
5 HEARING SURVEILLANCE
5.1 Introduction
The assessment of hearing acuity incorporates three essential features, namely the establishment of an otological history, an ear examination and the recording of an audiogram. An audiogram is a tabular or graphical plot of the hearing acuity of each ear as a function of frequency.
Monitoring by audiometry of the hearing acuity of persons who are occupationally exposed to noise in excess of the adopted noise limits is an integral part of comprehensive hearing conservation programmes.
Individual susceptibility to noise makes it difficult to foresee the extent to which exposure will affect an individual's hearing. Audiometry can provide a check, on an individual basis, of the effectiveness of hearing conservation procedures. It must be stressed that audiometry is not an alternative to control of noise at source or in the transmission path, or even to the protection of personnel from workplace noise.
Moreover, irrespective of local occupational noise exposure limits and the sensitivity of an individual to noise, audiometry facilitates the detection of change in auditory acuity before such changes are noticed by the individual.
In addition, audiometry provides an opportunity, through personal contact, for education of the workforce about the rationale of the hearing conservation measures, and for gauging the extent to which compliance is achieved, e.g. in correctly using any recommended personal protective devices.
Difficulties may arise with the actual audiometric testing in an industrial situation if valid data are to be obtained, because of the exacting standards of the testing procedures, e.g. quiet location, equipment calibration, trained operating personnel and record keeping.
In Appendix I the various elements of audiometry are considered, starting with a brief synopsis of the types of audiometers available.
5.2 Audiometry
The hearing of any person whose personal noise dose is likely to exceed 80 dB(A) during a working day, should be monitored by means of audiometry.
The audiometry frequency schedule summarised in Table 16 will identify early noise induced hearing loss in 99% of a working population.
It should be used bearing in mind that:
• more frequent audiometry might be required on medical or other grounds
• audiometry should follow accepted standards (Cf.ISO/ 6189 ( 1983) "Acoustics - Pure tone air conduction threshold audiometry for hearing conservation purposes") .
HSE 053 December 1991
42
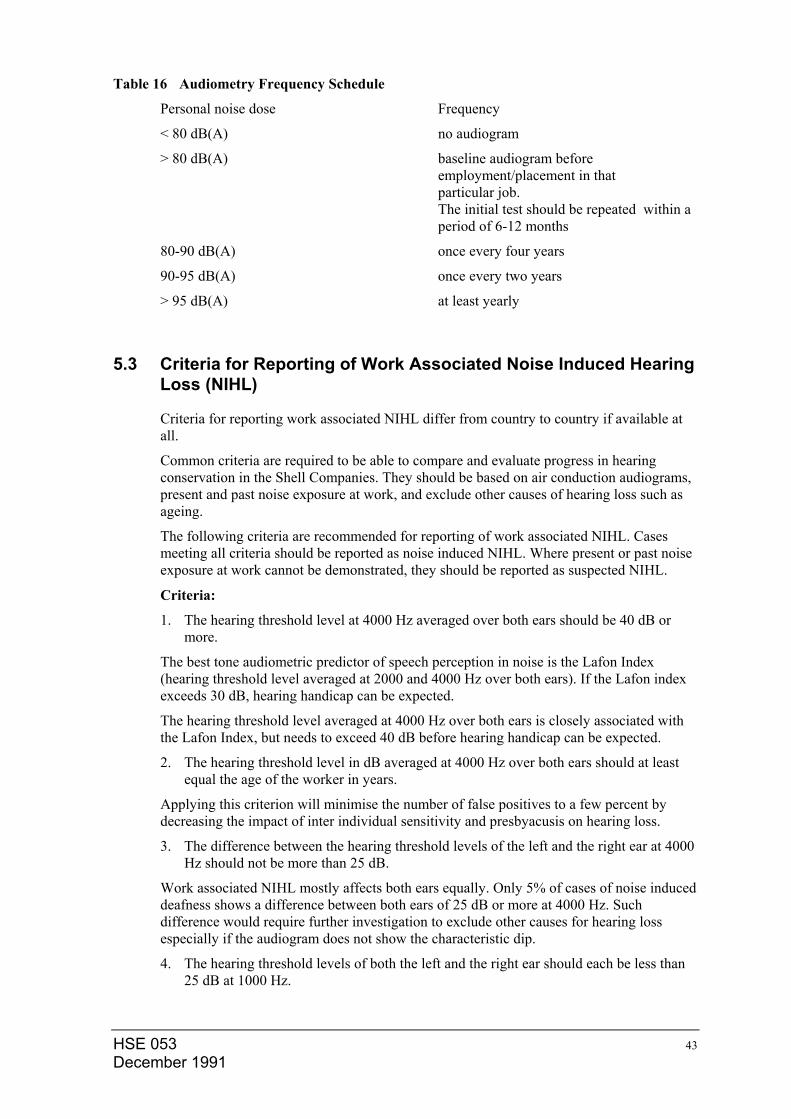
HSE 053 43 December 1991
Table 16 Audiometry Frequency Schedule
Personal noise dose Frequency
< 80 dB(A) no audiogram
> 80 dB(A) baseline audiogram before employment/placement in that particular job. The initial test should be repeated within a period of 6-12 months
80-90 dB(A) once every four years
90-95 dB(A) once every two years
> 95 dB(A) at least yearly
5.3 Criteria for Reporting of Work Associated Noise Induced Hearing
Loss (NIHL)
Criteria for reporting work associated NIHL differ from country to country if available at all.
Common criteria are required to be able to compare and evaluate progress in hearing conservation in the Shell Companies. They should be based on air conduction audiograms, present and past noise exposure at work, and exclude other causes of hearing loss such as ageing.
The following criteria are recommended for reporting of work associated NIHL. Cases meeting all criteria should be reported as noise induced NIHL. Where present or past noise exposure at work cannot be demonstrated, they should be reported as suspected NIHL.
Criteria:
1. The hearing threshold level at 4000 Hz averaged over both ears should be 40 dB or more.
The best tone audiometric predictor of speech perception in noise is the Lafon Index (hearing threshold level averaged at 2000 and 4000 Hz over both ears). If the Lafon index exceeds 30 dB, hearing handicap can be expected.
The hearing threshold level averaged at 4000 Hz over both ears is closely associated with the Lafon Index, but needs to exceed 40 dB before hearing handicap can be expected.
2. The hearing threshold level in dB averaged at 4000 Hz over both ears should at least equal the age of the worker in years.
Applying this criterion will minimise the number of false positives to a few percent by decreasing the impact of inter individual sensitivity and presbyacusis on hearing loss.
3. The difference between the hearing threshold levels of the left and the right ear at 4000 Hz should not be more than 25 dB.
Work associated NIHL mostly affects both ears equally. Only 5% of cases of noise induced deafness shows a difference between both ears of 25 dB or more at 4000 Hz. Such difference would require further investigation to exclude other causes for hearing loss especially if the audiogram does not show the characteristic dip.
4. The hearing threshold levels of both the left and the right ear should each be less than 25 dB at 1000 Hz.
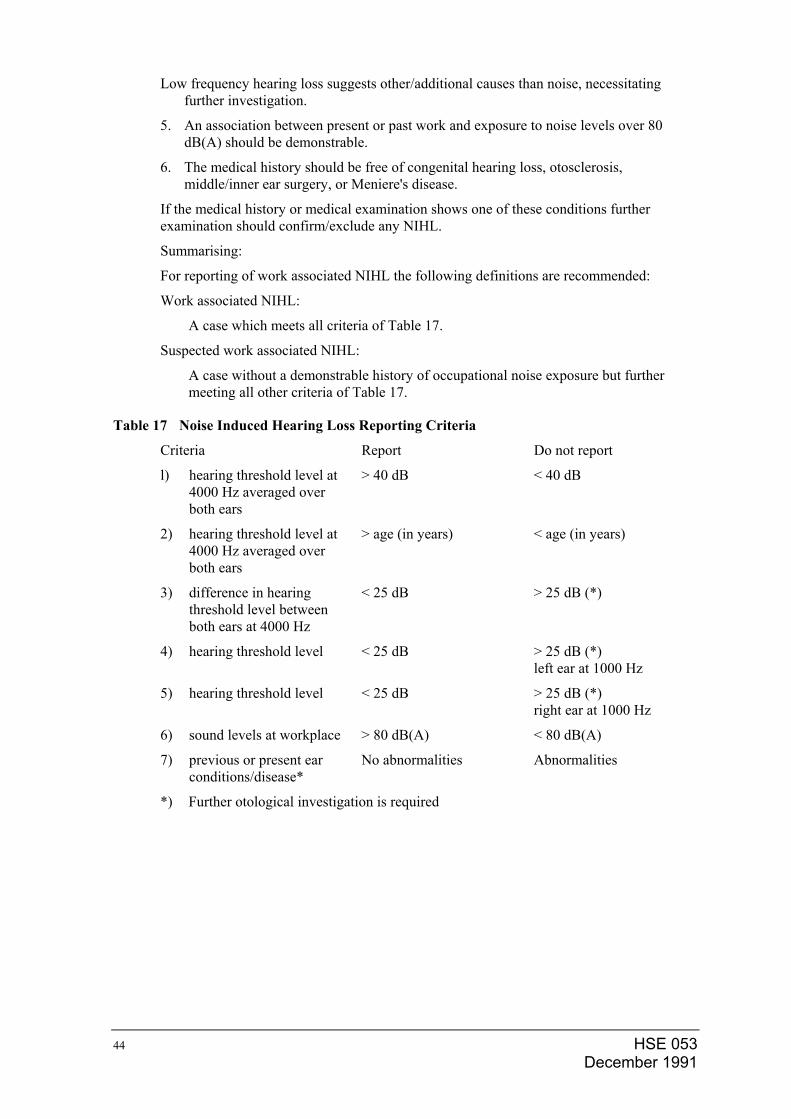
Low frequency hearing loss suggests other/additional causes than noise, necessitating further investigation.
5. An association between present or past work and exposure to noise levels over 80 dB(A) should be demonstrable.
6. The medical history should be free of congenital hearing loss, otosclerosis, middle/inner ear surgery, or Meniere's disease.
If the medical history or medical examination shows one of these conditions further examination should confirm/exclude any NIHL.
Summarising:
For reporting of work associated NIHL the following definitions are recommended:
Work associated NIHL:
A case which meets all criteria of Table 17.
Suspected work associated NIHL:
A case without a demonstrable history of occupational noise exposure but further meeting all other criteria of Table 17.
Table 17 Noise Induced Hearing Loss Reporting Criteria
Criteria Report Do not report
l) hearing threshold level at 4000 Hz averaged over both ears
> 40 dB < 40 dB
2) hearing threshold level at 4000 Hz averaged over both ears
> age (in years) < age (in years)
3) difference in hearing threshold level between both ears at 4000 Hz
< 25 dB > 25 dB (*)
4) hearing threshold level < 25 dB > 25 dB (*) left ear at 1000 Hz
5) hearing threshold level < 25 dB > 25 dB (*) right ear at 1000 Hz
6) sound levels at workplace > 80 dB(A) < 80 dB(A)
7) previous or present ear conditions/disease*
No abnormalities Abnormalities
*) Further otological investigation is required
HSE 053 December 1991
44
HSE 053 45 December 1991
6 RECORDS
Records should be kept on:
a. assessment (including measurement) of sound levels and noise doses;
b. noise control measures;
c. individual cases of noise induced hearing loss;
d. calibration and maintenance of equipment;
e. information and training programmes;
f. issue of hearing protection.
7 REPORTING
Management should receive an annual report on the effectiveness of the Company's hearing conservation programme. This report should at least address:
a. the number of people who are likely to receive a personal noise dose above 80 dB(A) over a normal working day;
b. the number of people with work associated noise induced hearing loss as defined by national criteria. Where national criteria are not available or are considered inadequate by management, the criteria in Chapter 5 of this Guide should be used for reporting at Group Level.
c. the number of people whose work associated noise induced hearing loss has increased since their previous audiogram;
HSE 053 December 1991
46
HSE 053 47 December 1991
8 INFORMATION, INSTRUCTION AND TRAINING
Any person who in the course of his/her normal working activities is likely to receive a personal noise dose above 80 dB(A) should be informed about the Company's hearing conservation programme.
Information, instruction and training should address:
a. the results of the workplace assessment;
b. work associated noise induced hearing loss;
c. jobs and tasks where exposure is likely to occur;
d. company standards for hearing conservation;
e. company measures to control noise on the particular jobs and tasks;
f. selection, use and maintenance of personal hearing protectors;
g. signposting of areas and marking of equipment and tools where noise levels exceed 90 dB(A);
g. the requirement for mandatory use of hearing protection where signs require such use (see Section B.1.e.).
9 REFERENCES
9.1 ISO Standards Noise (International Organization for Standardization)
ISO 226 - 1987 Acoustics - Normal equal - loudness level contours
ISO 389 - 1985 Acoustics - Standard reference zero for the calibration of pure-tone air conduction audiometers
ISO 1996 Acoustics - Description and measurement of environmental noise
1982 Part 1 - Basic quantities and procedures 1987 Part 2 - Acquisition of data pertinent to land use 1987 Part 3 - Application to noise limits
ISO 1999 - 1975 Acoustics - Assessment of occupational noise exposure for hearing conservation purposes
ISO 2204 - 1979 Acoustics - Guide to International Standards on the measurement of airborne acoustical noise and evaluation of its effects on human beings
ISO 2923 - 1975 Acoustics - Measurement of noise on board vessels
ISO/TR 3352 - 1974 Acoustics - Assessment of noise with respect of its effect on the intelligibility of speech
ISO 4869 - 1981 Acoustics - Measurement of sound attenuation of hearing protectors - Subjective method
ISO 4871 - 1984 Acoustics - Noise labelling of machinery and equipment
ISO 6081 - 1986 Acoustics - Noise emitted by machinery and equipment - Guidelines for the preparation of test codes of engineering grade requiring noise measurements at the operator's or bystander's position
ISO 6189 - 1983 Acoustics - Pure tone air conduction threshold audiometry for hearing conservation purposes
ISO 7029 - 1984 Acoustics - Threshold of hearing by air conduction as a function of age and sex for otologically normal persons
ISO 7731 - 1986 Danger signals for work places - Auditory danger signals
ISO 8201 - 1987 Acoustics - Audible emergency evacuation signal
9.2 ISO Standards Vibration and Shock
ISO 2631 - 1985 Evaluation of human exposure to whole body vibration. Part 1 - General requirements; Part 3 - Evaluation of exposure to whole body z-axis vertical
vibration in the frequency range 0.1 to 0.63 Hz ISO 5348 - 1987 Mechanical vibration and shock - Mechanical mounting of
accelerometers
ISO 5349 - 1986 Mechanical vibration - Guidelines for the measurement and the assessment of human exposure to hand-transmitted vibration
HSE 053 December 1991
48
HSE 053 49 December 1991
ISO 5805 - 1981 Mechanical vibration and shock affecting man - Vocabulary
ISO 6897 - 1984 Guidelines for the evaluation of the response of occupants of fixed structures, especially buildings and off-shore structures, to low-frequency horizontal motion (0.063 to 1 Hz)
ISO 7962 - 1987 Mechanical vibration and shock - Mechanical transmissibility of the human body in the z direction
Available from: ISO, Rue de Varembé, Case postal 56, 1211 Geneva 20, Switzerland
9.3 IEC Standards (International Electrotechnical Commission)
IEC 225 - 1966 Octave, half-octave and third-octave band filters intended for the analysis of sounds and vibrations
IEC 645 - 1979 Audiometers
IEC 651 - 1979 Sound level meters
IEC 804 - 1985 Integrating - averaging sound level meters
Available from: IEC, P.O. Box 131, 3 Rue de Varembé, 1211 Geneva 20, Switzerland
9.4 EEMUA Specifications (The Engineering Equipment and
Materials Users Association), previously issued by the Oil Companies Materials Association (OCMA)
Publication No. 140 Noise procedure specification (formerly OCMA NWG-1)
Publication No. 141 Guide to the use of Noise procedure specification (formerly OCMA NWG-3)
Publications are available from: 14 Belgrave Square London SW 1X 8PX England
9.5 Concawe
Report no. 3/84 Workshop on personal noise dosimetry
Report no. 85/58 Guidelines for hearing conservation programmes in the petroleum industry
Report no. 88/61 Implementation of effective hearing conservation programmes in the European oil industry
Available from: Concawe, Madouplein 1, B-1030 Brussel, Belgium
HSE 053 December 1991
50
HSE 053 51 December 1991
APPENDIX I AUDIOMETERS
1 General
An audiometer is an instrument designed to measure hearing acuity. A large range of equipment is available, varying in price and sophistication.
General performance requirements are detailed in the following publications:
• ISO 389(1985)
• IEC 645 (1979) Audiometers
• Audiometry in Industry (UK Health and Safety Executive publication, 1978)
• * BS 5966: 1980 (equivalent to IEC 645)
• * BS 6950: 1988
* BS = British Standard
2 Simple Audiometers
A simple audiometer enables the presentation of specified discrete frequencies at variable sound pressure levels through headphones to each ear in turn (i.e. Pure Tone Air Conduction). The objective is to identify the lowest sound energy level that can be heard at each test frequency in each ear. These so-called discrete frequency audiometers should have the following frequencies for routine testing: 250 Hz, 500 Hz, 1000 Hz, 2000 Hz, 4000 Hz, 6000 Hz, 8000 Hz. At each test frequency the audiometer should be able to measure hearing threshold in a range from -10 dB to 90 dB.
A simple audiometer is widely used for industrial screening purposes.
3 Special Feature Audiometers
A special feature audiometer has various diagnostic capabilities in addition to its ability for assessment of pure tone air conduction.
Broadly speaking, however, these features, such as bone conduction, masking and speech audiometry, are of little general application in industrial screening procedures and therefore are only discussed briefly.
3.1 Bone Conduction In testing bone conduction a special attachment is placed on the mastoid bone so that the sound energy by-passes the conductive mechanisms of the outer and middle ear. However, the procedure is complicated and is more appropriate to diagnostic examination than routine screening.
The use of tuning forks can be useful to differentiate between "conductive" and "nerve" deafness.
3.2 Masking This facility is an integral part of diagnostic audiometers and is used only when there is a known hearing deficiency. To prevent the tones presented to a deficient ear from crossing over to the other ear by bone conduction or otherwise, a narrow band masking noise is presented to the ear which is not being tested.
3.3 Speech Audiometry Actual "social handicap" can be assessed by obtaining a quantitative indication of the ability of the test subject to perceive recorded speech at various sound pressure levels. This "speech audiometry" technique is not generally used in industry.
4 Test Procedures
Detailed procedures for using any individual audiometer are invariably provided by the manufacturer or supplier.
The subject should be seated comfortably during the test period and neither be disturbed nor distracted by non-related events or people in the vicinity. The subject should be clearly visible to the audiometrician, but should not be able to see, directly or indirectly, changes in audiometer settings.
For the actual audiometric test the headphones through which the test tones are presented should be placed carefully over the subject's ears by the audiometrician so as to ensure a good fit. Significant errors can result from the incorrect positioning of the headphones. The subject should be given a simple and concise explanation of the procedures involved and asked to press the audiometer signal switch - or where it is not provided to raise a finger - during the period the tones presented are heard, and to release the switch, or lower the finger, as soon as the sound disappears. Movements or voice communication should be avoided as these may disturb the subject's concentration.
In using any type of audiometer, it is essential that the audiometric examination be carried out by a well-trained audiometrician in order to minimise any risk of mistakes. For example, at least 6 or 7 test frequencies should be checked for each ear so that hearing loss is not "missed" (see above).
It is customary to test the right ear first, but where there is a known difference in hearing ability between the two ears, the better ear should be tested first. Where the difference between the ears is 40 dB or greater, the louder tones may be conducted across the skull from the ear tested. In these cases the special masking procedures referred to above will be necessary.
4.1 The Octave Band Audiometer With this instrument the audiometrician varies the sound level of the various test tones and also operates the on-off switch. The conventional sequence of presentation of the frequencies is 1000 Hz, 2000 Hz, 3000 Hz, 4000 Hz, 6000 Hz, 8000 Hz, repeating 1000 Hz for a reliability check, followed by 500 Hz, and possibly 250 Hz.
Each pure tone is presented for a duration of at least one and up to four seconds. However, it is important to vary the duration of both the test signal and quiet interval to ensure that the subject does not get into a rhythmic "button pushing habit", even when a pure tone is not perceived.
The test procedure commences at the 1000 Hz frequency with the amplitude dial set to O dB. Then the intensity of the sound is increased slowly until the test subject indicates that it can be heard. At this point the intensity of the tone is probably 10 20 dB above the true threshold level. The actual threshold is determined by decreasing the intensity of the 1000 Hz tone in 10 dB steps, with one or two presentations at each successive level, until no response is obtained. From this point the intensity should be raised and lowered in 5 dB steps with pulsed presentation (or "bleeping") until the lowest level at which the subject responds to 50% of the presentations is ascertained. At least one such response should occur when the intensity is raised. The 50% response level is recorded as the threshold of hearing for that frequency.
HSE 053 December 1991
52
HSE 053 53 December 1991
The remaining frequencies should be tested in the same manner and sequence as indicated above. After completion the other ear is tested in the same way. The results should be recorded on an audiogram test card (see below) or tabulated.
4.2 The Continuous Frequency Audiometer The test procedure outlined in the previous section can be shortened by using a so-called continuous sweep frequency audiometer. With this instrument the frequency spectrum is swept over the full range (100-8000 Hz) in two directions, initially at an intensity level of +15 dB. If the test subject is able to hear the full range of frequencies at this level, the hearing is considered to be normal and the test terminated.
However, in cases where the full range of frequencies cannot be heard, the testing is continued at higher sound intensities until all the frequencies are heard. In addition this instrument can be used to determine the hearing threshold at a number of fixed frequencies by varying the intensity of the pure tone at each test frequency.
Normally, a continuous sweep frequency audiometer is also capable of checking bone conduction, masking and the performance of the SISI test (Short Increment Sensitivity Index) used for the detection of abnormalities in the inner ear.
The principal advantage of the continuous frequency audiometer over the octave band instrument is shown in Figure 1, where the same ear has been examined by the two different approaches. The continuous method provides more precise information about the frequency and the extent of the hearing loss.
4.3 The Automatic Recording Audiometer The so-called automatic audiometer is capable of automatically recording on a specially designed record card an individual's response to a sequence of pure tones presented to each ear in turn. This self-recording technique was introduced by Bekesey in 1947 and further developed in 1956 by McMurray and Rudmose whose instrument has a programme sequence involving six test frequencies, each presented for approximately 30 seconds.
With this type of audiometer the individual tested has to press the control button for as long as a tone is heard through the headphones and release it when the sound is no longer audible. Initially each pure tone is presented at a sound level of -10 dB and the intensity steadily increases at the rate of about 2 dB per second. As soon as the tone is heard, and the button pressed, the mechanism is reversed so that the intensity decreases at the same rate. This continues as long as the button is pressed down. When the tone is no longer heard and the button released, the sound level increases again. At each frequency the procedure is repeated 6-8 times and the resulting traces recorded on the card, before the machine automatically passes to the next test frequency. After all frequencies have been tested in one ear the audiometer automatically switches to the other ear. After completion of the audiogram a line can be drawn indicating the average of the maxima and minima of the traverses at each test frequency. This line represents the threshold of hearing for that pure tone frequency.
Most types of automatic audiometer use pulsed tones in order to help the subject to distinguish these from background noise, including tinnitus, whereas with other audiometers the tones are continuous. The former are normally regarded as preferable.
The main advantages of the automatic audiometer are that audiograms can be completed in about 6-8 minutes. As a result more "automatic" audiograms can be recorded in a working day. Although audiometrician involvement is minimal it is necessary to oversee the testing procedure, particularly at the beginning of a recording, in order to ensure valid data.
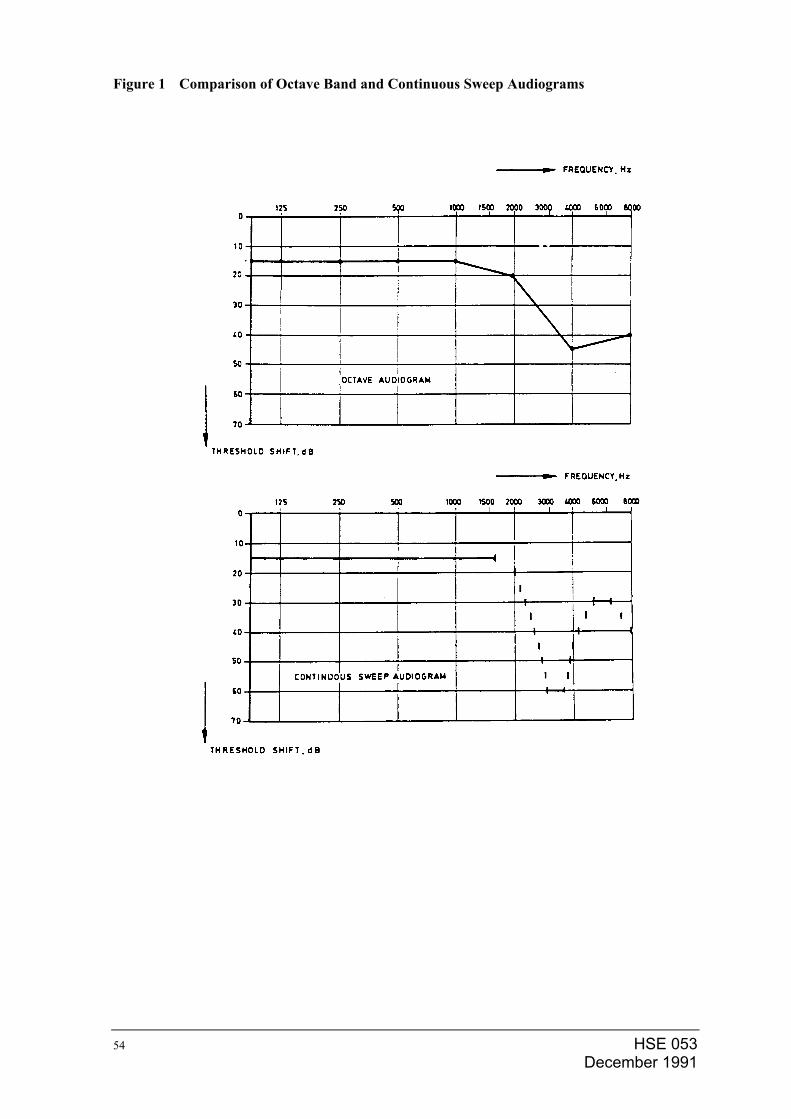
Figure 1 Comparison of Octave Band and Continuous Sweep Audiograms
HSE 053 December 1991
54
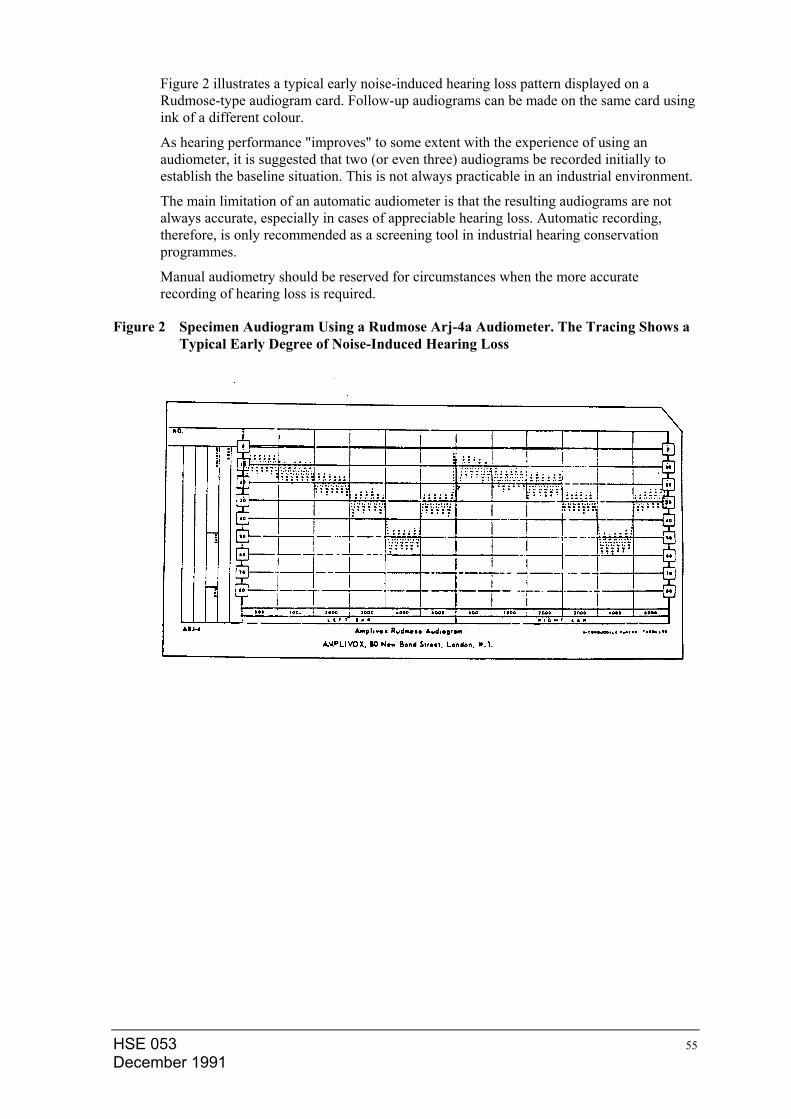
Figure 2 illustrates a typical early noise-induced hearing loss pattern displayed on a Rudmose-type audiogram card. Follow-up audiograms can be made on the same card using ink of a different colour.
As hearing performance "improves" to some extent with the experience of using an audiometer, it is suggested that two (or even three) audiograms be recorded initially to establish the baseline situation. This is not always practicable in an industrial environment.
The main limitation of an automatic audiometer is that the resulting audiograms are not always accurate, especially in cases of appreciable hearing loss. Automatic recording, therefore, is only recommended as a screening tool in industrial hearing conservation programmes.
Manual audiometry should be reserved for circumstances when the more accurate recording of hearing loss is required.
Figure 2 Specimen Audiogram Using a Rudmose Arj-4a Audiometer. The Tracing Shows a Typical Early Degree of Noise-Induced Hearing Loss
HSE 053 55 December 1991
5 Accuracy and Calibration
It is important that the factors affecting the accuracy and reproducibility of audiograms are appreciated and steps taken to minimise their effect. Regular calibration of equipment, a suitable test location, and the availability of a trained audiometrician are essential prerequisites to the audiometric testing if valid data are to be obtained.
Normally, manufacturers recommend the frequency of major equipment calibration and either offer a service or appoint competent agents. In addition, the audiometrician should conduct regular calibrations and these can be accomplished fairly simply and accurately by operator self-testing.
The human ear is an accurate "standard" for these purposes and with practice the operator quickly recognises his/her hearing performance and as a result can identify instrument "faults" greater than a few decibels.
Equally important to the calibration testing is the fact that the findings should be reported and recorded accurately in written form. This is not only good practice but in some countries this information may also have legal significance.
6 Test Environment
The test location is a priority consideration when checking hearing ability because the assessment can be impaired by the presence of significant background noise, especially where this has considerable low-frequency character. In some circumstances the requirement for a quiet test environment can be met by relying on the attenuation provided by the rubber cushion of the earphones, by mounting the earphones inside special cups, or by using a quiet room for the testing. However, in order to ensure that the background noise level is within acceptable limits at all times, it is preferable to use a suitably designed sound-attenuated prefabricated audiometric booth.
The ambient noise environment within a booth should be evaluated periodically over the audiometric test frequency spectrum to ensure that satisfactory conditions are maintained. These data should be recorded in a formal manner and retained. Table 16 indicates a set of octave band noise limits that has been recommended for audiometric test purposes.
HSE 053 December 1991
56
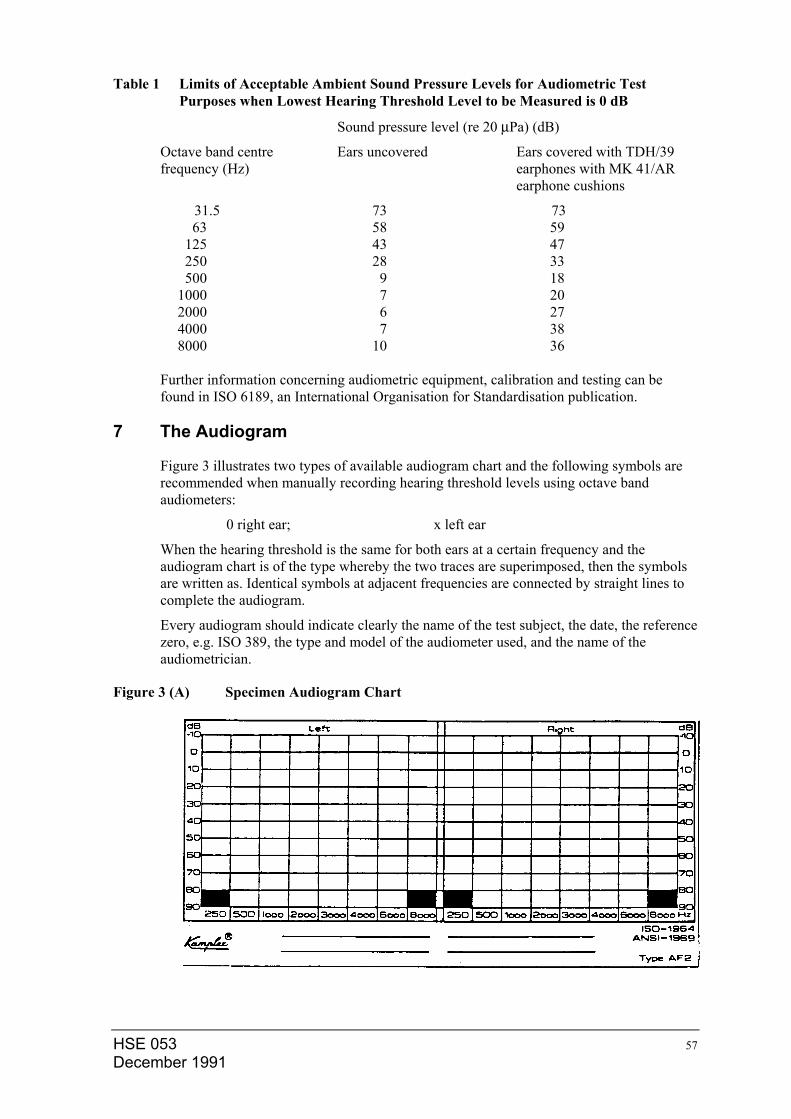
Table 1 Limits of Acceptable Ambient Sound Pressure Levels for Audiometric Test Purposes when Lowest Hearing Threshold Level to be Measured is 0 dB
Sound pressure level (re 20 µPa) (dB)
Octave band centre frequency (Hz)
Ears uncovered Ears covered with TDH/39 earphones with MK 41/AR earphone cushions
31.5 73 73 63 58 59
125 43 47 250 28 33 500 9 18
1000 7 20 2000 6 27 4000 7 38 8000 10 36
Further information concerning audiometric equipment, calibration and testing can be found in ISO 6189, an International Organisation for Standardisation publication.
7 The Audiogram
Figure 3 illustrates two types of available audiogram chart and the following symbols are recommended when manually recording hearing threshold levels using octave band audiometers:
0 right ear; x left ear
When the hearing threshold is the same for both ears at a certain frequency and the audiogram chart is of the type whereby the two traces are superimposed, then the symbols are written as. Identical symbols at adjacent frequencies are connected by straight lines to complete the audiogram.
Every audiogram should indicate clearly the name of the test subject, the date, the reference zero, e.g. ISO 389, the type and model of the audiometer used, and the name of the audiometrician.
Figure 3 (A) Specimen Audiogram Chart
HSE 053 57 December 1991
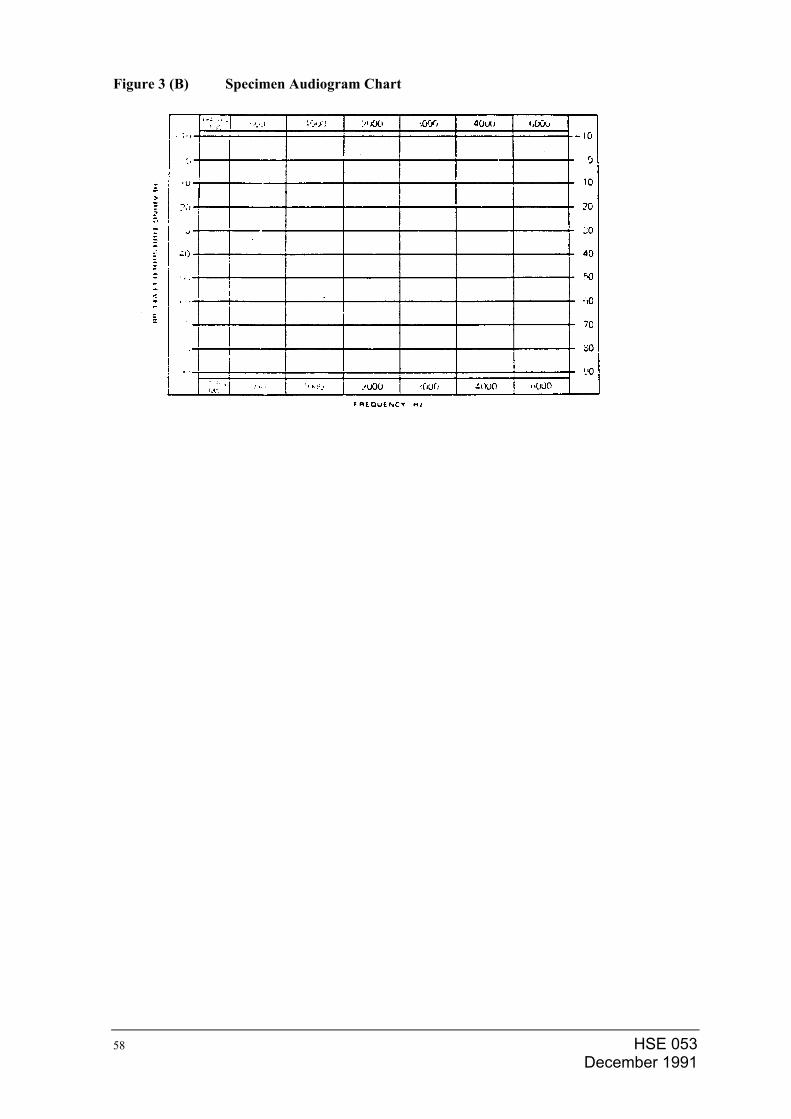
Figure 3 (B) Specimen Audiogram Chart
HSE 053 December 1991
58
HSE 053 59 December 1991
APPENDIX II PHYSICAL CHARACTERISTICS OF SOUND
1 Sound
For the purposes of this guide the word "sound" is a collective noun that describes everything the human ear can hear; it can be music, spoken words, alarm signals or just noise. The word "noise" is often used to describe unwanted or health damaging sound.
The properties of sound can be given objectively in physical terms. Reactions of persons to noise, such as being annoyed, are mostly subjective and therefore difficult to predict; what sounds like music to one is noise to another. Very loud sound may not only be annoying but dangerous; it may damage the ear.
Sound is usually generated as a by-product of processes converting energy, for example in motors, compressors, fired heaters, etc. Fortunately the fraction of the energy converted to sound is very small and ranges from 0.1% to 0.00001% (10-3-10-7) for equipment used in the petrochemical industry. A one megawatt flame for example produces only about one watt of sound; a 100 kilowatt electric motor may produce as little as 0.01 watts of sound.
Sound travels through the air with a speed of approximately 344 m/s, depending on the temperature of the air.
Two main qualities are used to describe the nature of any particular sound - amplitude, which refers to the amount of sound and frequency, relating to the character of the sound. The amount of sound is described differently at the source side (in terms of sound power) and at the receiver (in terms of sound pressure).
2 Measurements and Units
2.1 Sound Power Most sound sources can be conveniently described by giving their rate of production of acoustic energy. This rate is called the sound power and has the symbol W.
The sound power is a handy single number descriptor of a noise source. It is the basis of several types of calculations and the sound power of various sources in a plant can be added to describe the sound power of the plant as a whole.
Sound powers considered in industrial applications range from 1 milliwatt to 1000 watt.
2.2 Sound Pressure The intensity* of the sound from a source becomes gradually lower when moving away from it. In principle the inverse square law applies. This law states that the intensity is inversely proportional to the square of the distance from the source. A factor of 2 in distance (e.g. from 100 m to 200 m or from 1000 m to 2000 m) is equivalent to a factor of 4 in intensity.
* [Intensity is the amount of energy passing through unit area per unit time and is normally expressed in Watts/m2].
Since sound intensity is difficult to measure directly, it is usually derived from the related sound pressure, which can be easily measured. It should be noted that sound intensities caused by various sources can be added, but sound pressures cannot. The sound pressure by itself is not characteristic of the source. To describe a source both sound pressure and distance from the source should be given.
Under certain conditions sound powers can be calculated from sound pressures and vice versa.
The human ear can detect sound pressures over a range from 20 micropascals to 20 pascals (0.2 x 10⁻⁹ bar to 0.2 x 10⁻³ bar).
2.3 The Decibel Sound pressure and sound power are not commonly used as such but are expressed on a logarithmic scale in decibel units. The word "level" is added to the names of the quantities to indicate the use of this logarithmic scale; i.e. sound power measured on a log scale becomes sound power level and sound pressure measured on a log scale becomes sound pressure level. There are other "levels" such as intensity level, acceleration level, etc. All "levels" (except loudness level) are measured in decibels, abbreviated dB; each type of level, however has its own reference quantity.
Every decibel value expresses the factor by which the actual quantity is larger (or smaller for negative values of the decibel) than the reference quantity. The decibel is therefore not an absolute unit of physical measurement, but represents the ratio of a measured quantity to an agreed reference, expressed in the same unit of measurement.
The sound power level, with the symbol Lw (sometimes PWL) is defined as:
W
2.4
60
Lw = 10 log
W
where Lw = sound power level in decibels
W = the sound power of the source in watts Wo = the so-called reference sound power in watts log = logarithm to the base 10
The reference sound power is standardised at 10-12 watt (1 pW) but sometimes the value of 10-13 watt is found (especially in older literature from the USA).
Similarly the sound pressure level, with the symbol Lp (or sometimes SPL) is defined as:
Lp = 10 log = 20 log P2
P°2
P
P°
where Lp = sound pressure level in decibels p = the sound pressure Po = the reference sound pressure
The reference sound pressure is 20 micropascals which corresponds to the threshold of audibility. Zero decibel sound pressure level therefore represents the threshold of audibility.
It should be noted that the intensity of sound is proportional to the square of the sound pressure; this explains the squares under the logarithm in the above formula.
Calculations with Decibels Sound powers and sound intensities can be added arithmetically; sound power levels and sound pressure levels cannot. For example 80 dB and 80 dB when added do not equal 160 dB. Two equal levels give an increase of 3 dB when added. Hence 80 dB plus 80 dB gives a total level of 83 dB.
HSE 053 December 1991
In the general case it can be shown that:
L = 10 log [ antilog + antilog dB L1
10 = . . . ]L2 2
10
Where L is the total sound level and L1, L2, etc. are the individual sound levels being added, and antilog x is equivalent to 10 to the power x.
This formula can be easily applied using a pocket calculator with log and antilog capabilities.
The intensity I (or sound pressure p) at a distance from a sound source may be calculated according to the inverse square law. For a source with sound power W, standing on a paved (hard) surface, with no other reflecting surfaces present, the inverse square law reads:
W
2πr2 I =
where r = the distance in metres between source and receiver and is large compared to the dimensions of the source.
In logarithmic units the same formula reads:
Li = Lp = Lw + 10 log = Lw –8 –20 log r 1
2πr2
This rule of thumb formula does not apply when the ground surface is not paved or when other reflecting surfaces are present (such as inside a building).
3 Frequency
The ear recognises as tones periodic pressure fluctuations, which repeat themselves every cycle. The frequency of the sound is the number of cycles per second, expressed as Hertz (abbreviated to Hz).
Range of hearing
The normal range of hearing in healthy young adults varies somewhat, but generally pressure fluctuations are audible when their frequency lies between 16 Hz and 16,000 Hz.
Musical range
The frequency range of the average piano is approximately 25 Hz to 40,000 Hz, with middle A at 440 Hz. In musical terms, doubling the frequency raises the pitch by one octave.
Conversation range
The principle range of human conversational frequencies is from 350 Hz to 3500 Hz.
Random sound
Random sound comprises a wide band of frequencies with no regularly repeating pressure patterns.
HSE 053 61 December 1991
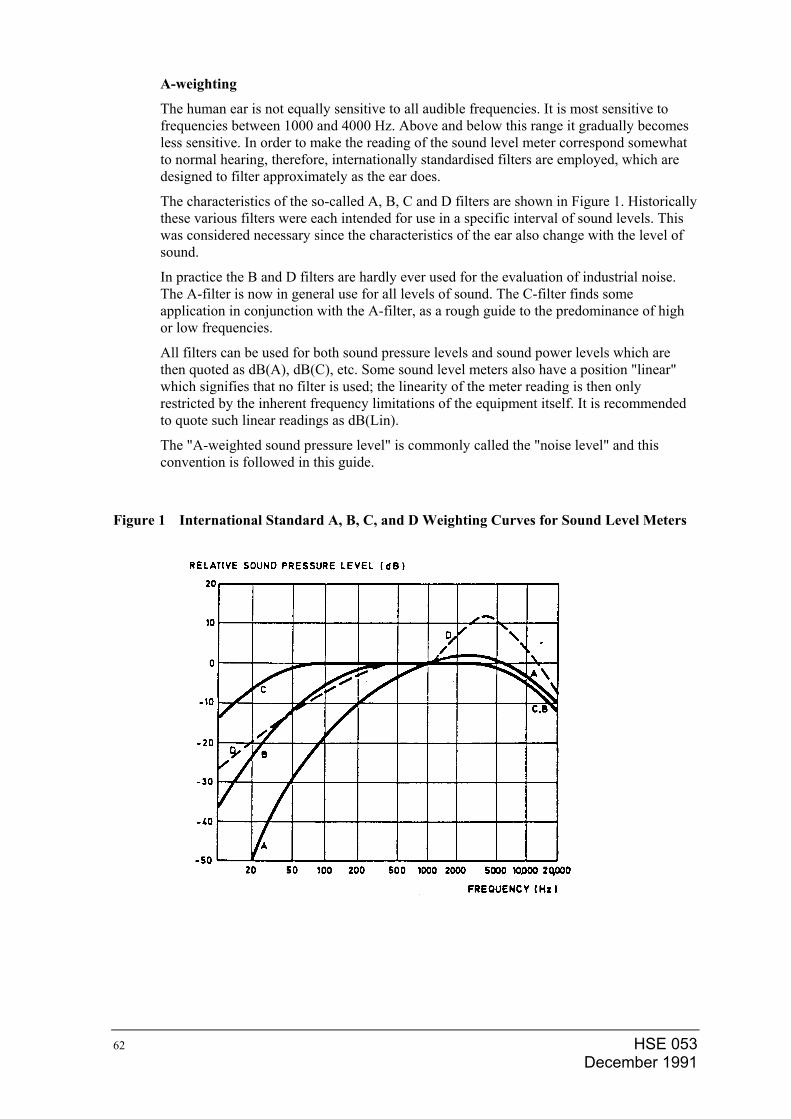
A-weighting
The human ear is not equally sensitive to all audible frequencies. It is most sensitive to frequencies between 1000 and 4000 Hz. Above and below this range it gradually becomes less sensitive. In order to make the reading of the sound level meter correspond somewhat to normal hearing, therefore, internationally standardised filters are employed, which are designed to filter approximately as the ear does.
The characteristics of the so-called A, B, C and D filters are shown in Figure 1. Historically these various filters were each intended for use in a specific interval of sound levels. This was considered necessary since the characteristics of the ear also change with the level of sound.
In practice the B and D filters are hardly ever used for the evaluation of industrial noise. The A-filter is now in general use for all levels of sound. The C-filter finds some application in conjunction with the A-filter, as a rough guide to the predominance of high or low frequencies.
All filters can be used for both sound pressure levels and sound power levels which are then quoted as dB(A), dB(C), etc. Some sound level meters also have a position "linear" which signifies that no filter is used; the linearity of the meter reading is then only restricted by the inherent frequency limitations of the equipment itself. It is recommended to quote such linear readings as dB(Lin).
The "A-weighted sound pressure level" is commonly called the "noise level" and this convention is followed in this guide.
Figure 1 International Standard A, B, C, and D Weighting Curves for Sound Level Meters
HSE 053 December 1991
62
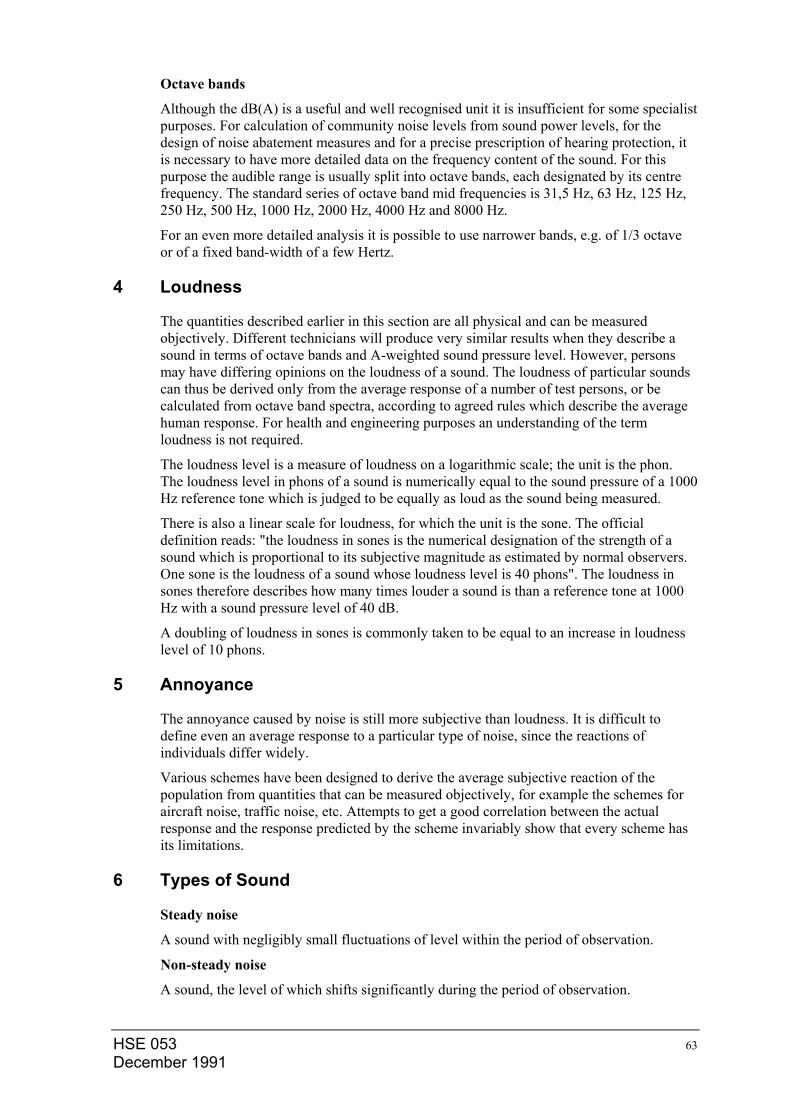
HSE 053 63 December 1991
Octave bands
Although the dB(A) is a useful and well recognised unit it is insufficient for some specialist purposes. For calculation of community noise levels from sound power levels, for the design of noise abatement measures and for a precise prescription of hearing protection, it is necessary to have more detailed data on the frequency content of the sound. For this purpose the audible range is usually split into octave bands, each designated by its centre frequency. The standard series of octave band mid frequencies is 31,5 Hz, 63 Hz, 125 Hz, 250 Hz, 500 Hz, 1000 Hz, 2000 Hz, 4000 Hz and 8000 Hz.
For an even more detailed analysis it is possible to use narrower bands, e.g. of 1/3 octave or of a fixed band-width of a few Hertz.
4 Loudness
The quantities described earlier in this section are all physical and can be measured objectively. Different technicians will produce very similar results when they describe a sound in terms of octave bands and A-weighted sound pressure level. However, persons may have differing opinions on the loudness of a sound. The loudness of particular sounds can thus be derived only from the average response of a number of test persons, or be calculated from octave band spectra, according to agreed rules which describe the average human response. For health and engineering purposes an understanding of the term loudness is not required.
The loudness level is a measure of loudness on a logarithmic scale; the unit is the phon. The loudness level in phons of a sound is numerically equal to the sound pressure of a 1000 Hz reference tone which is judged to be equally as loud as the sound being measured.
There is also a linear scale for loudness, for which the unit is the sone. The official definition reads: "the loudness in sones is the numerical designation of the strength of a sound which is proportional to its subjective magnitude as estimated by normal observers. One sone is the loudness of a sound whose loudness level is 40 phons". The loudness in sones therefore describes how many times louder a sound is than a reference tone at 1000 Hz with a sound pressure level of 40 dB.
A doubling of loudness in sones is commonly taken to be equal to an increase in loudness level of 10 phons.
5 Annoyance
The annoyance caused by noise is still more subjective than loudness. It is difficult to define even an average response to a particular type of noise, since the reactions of individuals differ widely.
Various schemes have been designed to derive the average subjective reaction of the population from quantities that can be measured objectively, for example the schemes for aircraft noise, traffic noise, etc. Attempts to get a good correlation between the actual response and the response predicted by the scheme invariably show that every scheme has its limitations.
6 Types of Sound
Steady noise
A sound with negligibly small fluctuations of level within the period of observation.
Non-steady noise
A sound, the level of which shifts significantly during the period of observation.
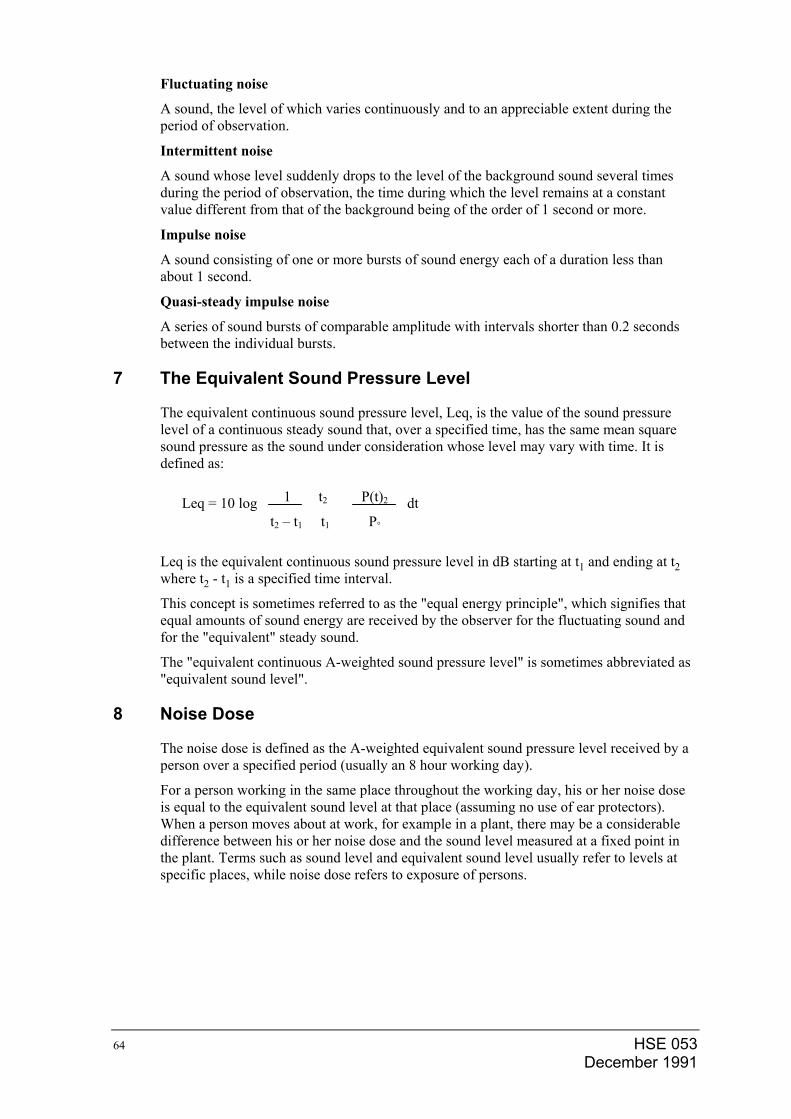
Fluctuating noise
A sound, the level of which varies continuously and to an appreciable extent during the period of observation.
Intermittent noise
A sound whose level suddenly drops to the level of the background sound several times during the period of observation, the time during which the level remains at a constant value different from that of the background being of the order of 1 second or more.
Impulse noise
A sound consisting of one or more bursts of sound energy each of a duration less than about 1 second.
Quasi-steady impulse noise
A series of sound bursts of comparable amplitude with intervals shorter than 0.2 seconds between the individual bursts.
7 The Equivalent Sound Pressure Level
The equivalent continuous sound pressure level, Leq, is the value of the sound pressure level of a continuous steady sound that, over a specified time, has the same mean square sound pressure as the sound under consideration whose level may vary with time. It is defined as:
Leq = 10 log dt 1 t2
t2 – t1 t1
P(t)2
P°
Leq is the equivalent continuous sound pressure level in dB starting at t1 and ending at t2 where t2 - t1 is a specified time interval.
This concept is sometimes referred to as the "equal energy principle", which signifies that equal amounts of sound energy are received by the observer for the fluctuating sound and for the "equivalent" steady sound.
The "equivalent continuous A-weighted sound pressure level" is sometimes abbreviated as "equivalent sound level".
8 Noise Dose
The noise dose is defined as the A-weighted equivalent sound pressure level received by a person over a specified period (usually an 8 hour working day).
For a person working in the same place throughout the working day, his or her noise dose is equal to the equivalent sound level at that place (assuming no use of ear protectors). When a person moves about at work, for example in a plant, there may be a considerable difference between his or her noise dose and the sound level measured at a fixed point in the plant. Terms such as sound level and equivalent sound level usually refer to levels at specific places, while noise dose refers to exposure of persons.
HSE 053 December 1991
64
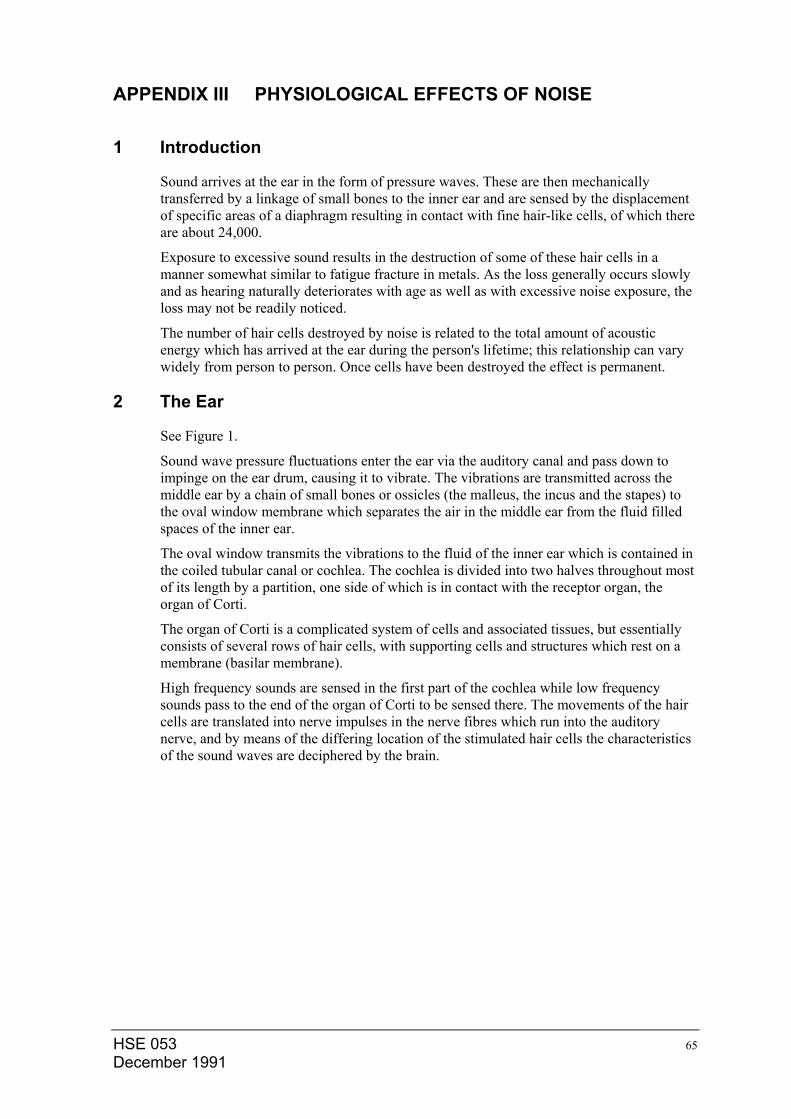
HSE 053 65 December 1991
APPENDIX III PHYSIOLOGICAL EFFECTS OF NOISE
1 Introduction
Sound arrives at the ear in the form of pressure waves. These are then mechanically transferred by a linkage of small bones to the inner ear and are sensed by the displacement of specific areas of a diaphragm resulting in contact with fine hair-like cells, of which there are about 24,000.
Exposure to excessive sound results in the destruction of some of these hair cells in a manner somewhat similar to fatigue fracture in metals. As the loss generally occurs slowly and as hearing naturally deteriorates with age as well as with excessive noise exposure, the loss may not be readily noticed.
The number of hair cells destroyed by noise is related to the total amount of acoustic energy which has arrived at the ear during the person's lifetime; this relationship can vary widely from person to person. Once cells have been destroyed the effect is permanent.
2 The Ear
See Figure 1.
Sound wave pressure fluctuations enter the ear via the auditory canal and pass down to impinge on the ear drum, causing it to vibrate. The vibrations are transmitted across the middle ear by a chain of small bones or ossicles (the malleus, the incus and the stapes) to the oval window membrane which separates the air in the middle ear from the fluid filled spaces of the inner ear.
The oval window transmits the vibrations to the fluid of the inner ear which is contained in the coiled tubular canal or cochlea. The cochlea is divided into two halves throughout most of its length by a partition, one side of which is in contact with the receptor organ, the organ of Corti.
The organ of Corti is a complicated system of cells and associated tissues, but essentially consists of several rows of hair cells, with supporting cells and structures which rest on a membrane (basilar membrane).
High frequency sounds are sensed in the first part of the cochlea while low frequency sounds pass to the end of the organ of Corti to be sensed there. The movements of the hair cells are translated into nerve impulses in the nerve fibres which run into the auditory nerve, and by means of the differing location of the stimulated hair cells the characteristics of the sound waves are deciphered by the brain.
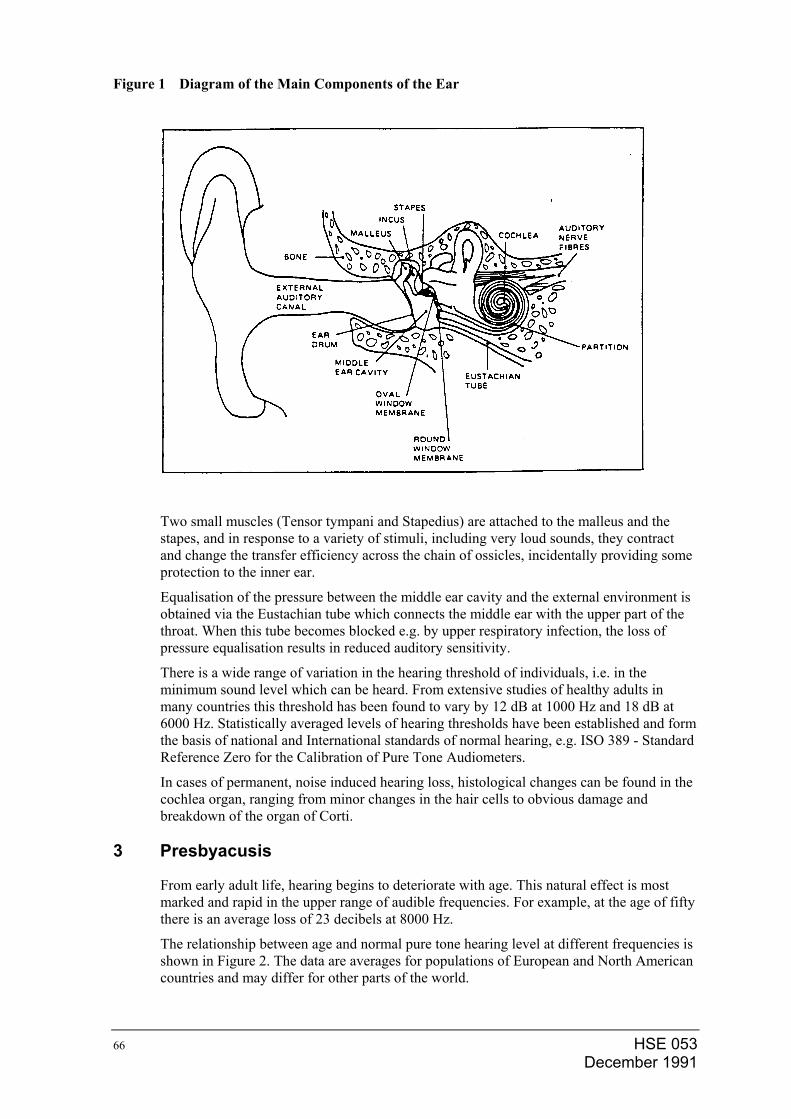
Figure 1 Diagram of the Main Components of the Ear
Two small muscles (Tensor tympani and Stapedius) are attached to the malleus and the stapes, and in response to a variety of stimuli, including very loud sounds, they contract and change the transfer efficiency across the chain of ossicles, incidentally providing some protection to the inner ear.
Equalisation of the pressure between the middle ear cavity and the external environment is obtained via the Eustachian tube which connects the middle ear with the upper part of the throat. When this tube becomes blocked e.g. by upper respiratory infection, the loss of pressure equalisation results in reduced auditory sensitivity.
There is a wide range of variation in the hearing threshold of individuals, i.e. in the minimum sound level which can be heard. From extensive studies of healthy adults in many countries this threshold has been found to vary by 12 dB at 1000 Hz and 18 dB at 6000 Hz. Statistically averaged levels of hearing thresholds have been established and form the basis of national and International standards of normal hearing, e.g. ISO 389 - Standard Reference Zero for the Calibration of Pure Tone Audiometers.
In cases of permanent, noise induced hearing loss, histological changes can be found in the cochlea organ, ranging from minor changes in the hair cells to obvious damage and breakdown of the organ of Corti.
3 Presbyacusis
From early adult life, hearing begins to deteriorate with age. This natural effect is most marked and rapid in the upper range of audible frequencies. For example, at the age of fifty there is an average loss of 23 decibels at 8000 Hz.
The relationship between age and normal pure tone hearing level at different frequencies is shown in Figure 2. The data are averages for populations of European and North American countries and may differ for other parts of the world.
HSE 053 December 1991
66
HSE 053 67 December 1991
4 Effects of Noise on Hearing
Noise induced hearing loss
Noise can produce an impairment of hearing which is known as noise induced hearing loss, which can be either temporary or permanent, depending on the type and the amount of exposure. The degree of impairment depends upon average noise dose.
Temporary threshold shift
The term "temporary threshold shift" is used to denote the temporary deterioration of the auditory threshold resulting from exposure to noise.
Although the actual mechanism is not known, a quite rapid recovery occurs provided the subject is removed from high noise levels and exposure time was limited. The greater part of this recovery occurs in the first forty-eight hours after removal from noisy surroundings. For practical purposes, the amount of hearing loss that is reversed in this period is known as the temporary threshold shift. A small additional hearing recovery occurs after this period, provided the individual is not exposed to further intense sound levels.
Permanent threshold shift
The amount of deterioration in the auditory threshold that persists as a permanent disability despite removal from noise is termed the permanent threshold shift. In such cases, permanent damage is assumed to have occurred to the organ of hearing.
Individual susceptibility
Individuals exposed to the same noise dose usually show differing amounts of hearing loss. There is no satisfactory method of identification, before exposure, of those individuals who are unduly susceptible or sensitive to long term noise.
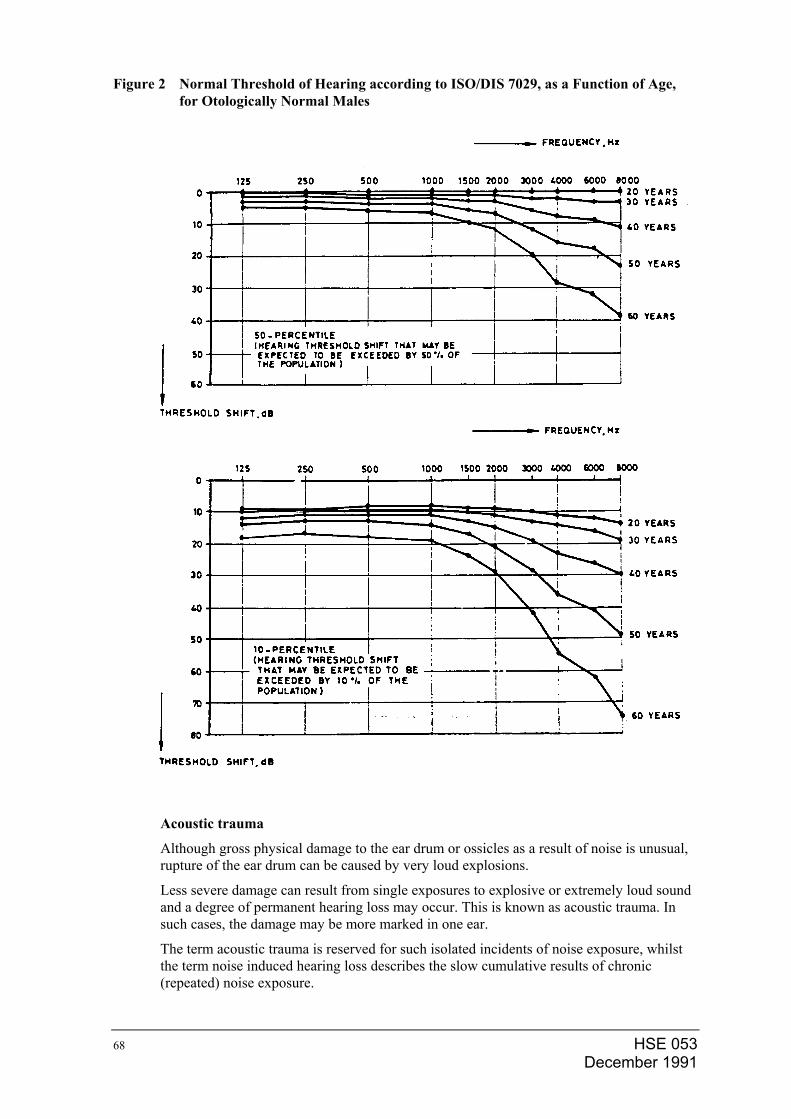
Figure 2 Normal Threshold of Hearing according to ISO/DIS 7029, as a Function of Age, for Otologically Normal Males
Acoustic trauma
Although gross physical damage to the ear drum or ossicles as a result of noise is unusual, rupture of the ear drum can be caused by very loud explosions.
Less severe damage can result from single exposures to explosive or extremely loud sound and a degree of permanent hearing loss may occur. This is known as acoustic trauma. In such cases, the damage may be more marked in one ear.
The term acoustic trauma is reserved for such isolated incidents of noise exposure, whilst the term noise induced hearing loss describes the slow cumulative results of chronic (repeated) noise exposure.
HSE 053 December 1991
68
HSE 053 69 December 1991
Socioacusis
This is a recently coined phrase to describe the type of hearing impairment, temporary or permanent, which is caused by the wide variety of auditory hazards of everyday life. These include increasingly noisy leisure activities such as Walkmans, loud beat bands, pistol or rifle shooting and inadequately silenced motor cycles. Noise induced hearing loss may occur as a result of such activities despite good hearing conservation practices in the workplace.
Audiometric effect
Threshold shift as a result of industrial noise exposure occurs principally at the higher frequency end of the auditory scale, most usually around 4000 Hz, causing a notch in the audiogram. As noise induced hearing loss increases, this notch becomes deeper and wider and increasingly affects lower frequencies. The effect varies for different people.
Tinnitus
Exposure to noise may result also in a temporary or permanent condition known as tinnitus in which a disturbance of the auditory system results in sounds or tones sometimes described as "ringing in the ears". This condition causes decreased auditory sensitivity and may also be very irritating.
5 Effect of Noise on Work Performance
This is a very indefinable factor and depends upon the relationship between efficiency and the level of arousal of an individual. Any factor which affects the level of arousal will also affect efficiency, i.e. motivation, sleep deprivation, heat, noise and other stress conditions.
If a sound affects the level of arousal, it will affect work performance in one way or another. Up to a certain level, sound can be beneficial by causing a raised level of arousal and hence increased work output. On the other hand, a further increase in the level of sound can reduce working efficiency, for example by interference with speech communication, mental concentration and personal comfort.
Notwithstanding the difficulties of being precise in this area of sound problems, recommended overall sound levels can be laid down for differing types of work situations and these have been proposed on the basis of a reasonable compromise between sound outputs of various types of equipment, the comfort of the operators, the need for mental concentration and for communication.
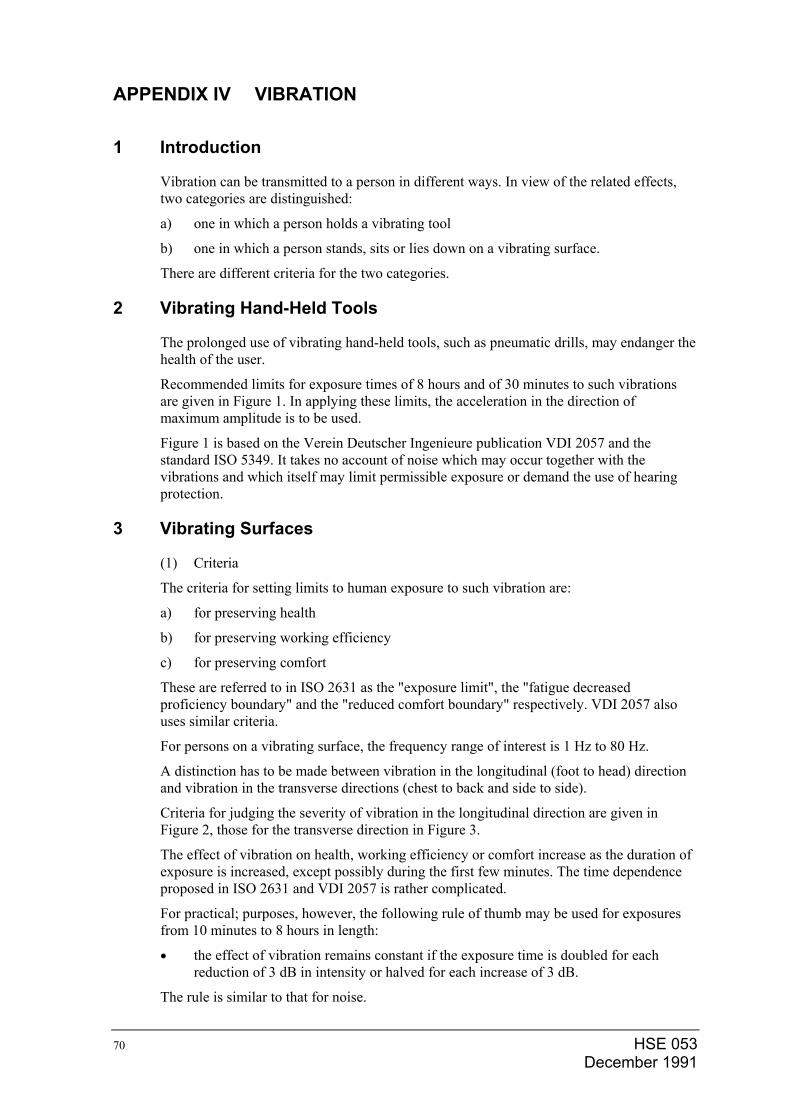
APPENDIX IV VIBRATION
1 Introduction
Vibration can be transmitted to a person in different ways. In view of the related effects, two categories are distinguished:
a) one in which a person holds a vibrating tool
b) one in which a person stands, sits or lies down on a vibrating surface.
There are different criteria for the two categories.
2 Vibrating Hand-Held Tools
The prolonged use of vibrating hand-held tools, such as pneumatic drills, may endanger the health of the user.
Recommended limits for exposure times of 8 hours and of 30 minutes to such vibrations are given in Figure 1. In applying these limits, the acceleration in the direction of maximum amplitude is to be used.
Figure 1 is based on the Verein Deutscher Ingenieure publication VDI 2057 and the standard ISO 5349. It takes no account of noise which may occur together with the vibrations and which itself may limit permissible exposure or demand the use of hearing protection.
3 Vibrating Surfaces
(1) Criteria
The criteria for setting limits to human exposure to such vibration are:
a) for preserving health
b) for preserving working efficiency
c) for preserving comfort
These are referred to in ISO 2631 as the "exposure limit", the "fatigue decreased proficiency boundary" and the "reduced comfort boundary" respectively. VDI 2057 also uses similar criteria.
For persons on a vibrating surface, the frequency range of interest is 1 Hz to 80 Hz.
A distinction has to be made between vibration in the longitudinal (foot to head) direction and vibration in the transverse directions (chest to back and side to side).
Criteria for judging the severity of vibration in the longitudinal direction are given in Figure 2, those for the transverse direction in Figure 3.
The effect of vibration on health, working efficiency or comfort increase as the duration of exposure is increased, except possibly during the first few minutes. The time dependence proposed in ISO 2631 and VDI 2057 is rather complicated.
For practical; purposes, however, the following rule of thumb may be used for exposures from 10 minutes to 8 hours in length:
• the effect of vibration remains constant if the exposure time is doubled for each reduction of 3 dB in intensity or halved for each increase of 3 dB.
The rule is similar to that for noise.
HSE 053 December 1991
70
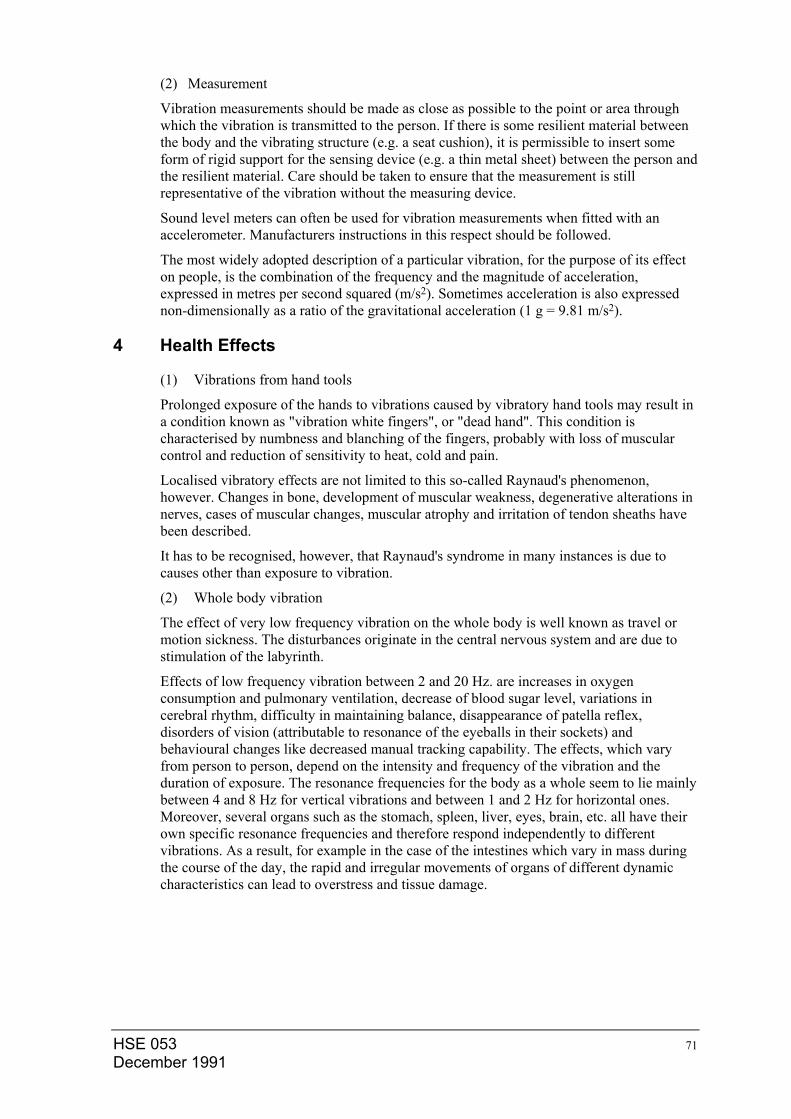
HSE 053 71 December 1991
(2) Measurement
Vibration measurements should be made as close as possible to the point or area through which the vibration is transmitted to the person. If there is some resilient material between the body and the vibrating structure (e.g. a seat cushion), it is permissible to insert some form of rigid support for the sensing device (e.g. a thin metal sheet) between the person and the resilient material. Care should be taken to ensure that the measurement is still representative of the vibration without the measuring device.
Sound level meters can often be used for vibration measurements when fitted with an accelerometer. Manufacturers instructions in this respect should be followed.
The most widely adopted description of a particular vibration, for the purpose of its effect on people, is the combination of the frequency and the magnitude of acceleration, expressed in metres per second squared (m/s2). Sometimes acceleration is also expressed non-dimensionally as a ratio of the gravitational acceleration (1 g = 9.81 m/s2).
4 Health Effects
(1) Vibrations from hand tools
Prolonged exposure of the hands to vibrations caused by vibratory hand tools may result in a condition known as "vibration white fingers", or "dead hand". This condition is characterised by numbness and blanching of the fingers, probably with loss of muscular control and reduction of sensitivity to heat, cold and pain.
Localised vibratory effects are not limited to this so-called Raynaud's phenomenon, however. Changes in bone, development of muscular weakness, degenerative alterations in nerves, cases of muscular changes, muscular atrophy and irritation of tendon sheaths have been described.
It has to be recognised, however, that Raynaud's syndrome in many instances is due to causes other than exposure to vibration.
(2) Whole body vibration
The effect of very low frequency vibration on the whole body is well known as travel or motion sickness. The disturbances originate in the central nervous system and are due to stimulation of the labyrinth.
Effects of low frequency vibration between 2 and 20 Hz. are increases in oxygen consumption and pulmonary ventilation, decrease of blood sugar level, variations in cerebral rhythm, difficulty in maintaining balance, disappearance of patella reflex, disorders of vision (attributable to resonance of the eyeballs in their sockets) and behavioural changes like decreased manual tracking capability. The effects, which vary from person to person, depend on the intensity and frequency of the vibration and the duration of exposure. The resonance frequencies for the body as a whole seem to lie mainly between 4 and 8 Hz for vertical vibrations and between 1 and 2 Hz for horizontal ones. Moreover, several organs such as the stomach, spleen, liver, eyes, brain, etc. all have their own specific resonance frequencies and therefore respond independently to different vibrations. As a result, for example in the case of the intestines which vary in mass during the course of the day, the rapid and irregular movements of organs of different dynamic characteristics can lead to overstress and tissue damage.
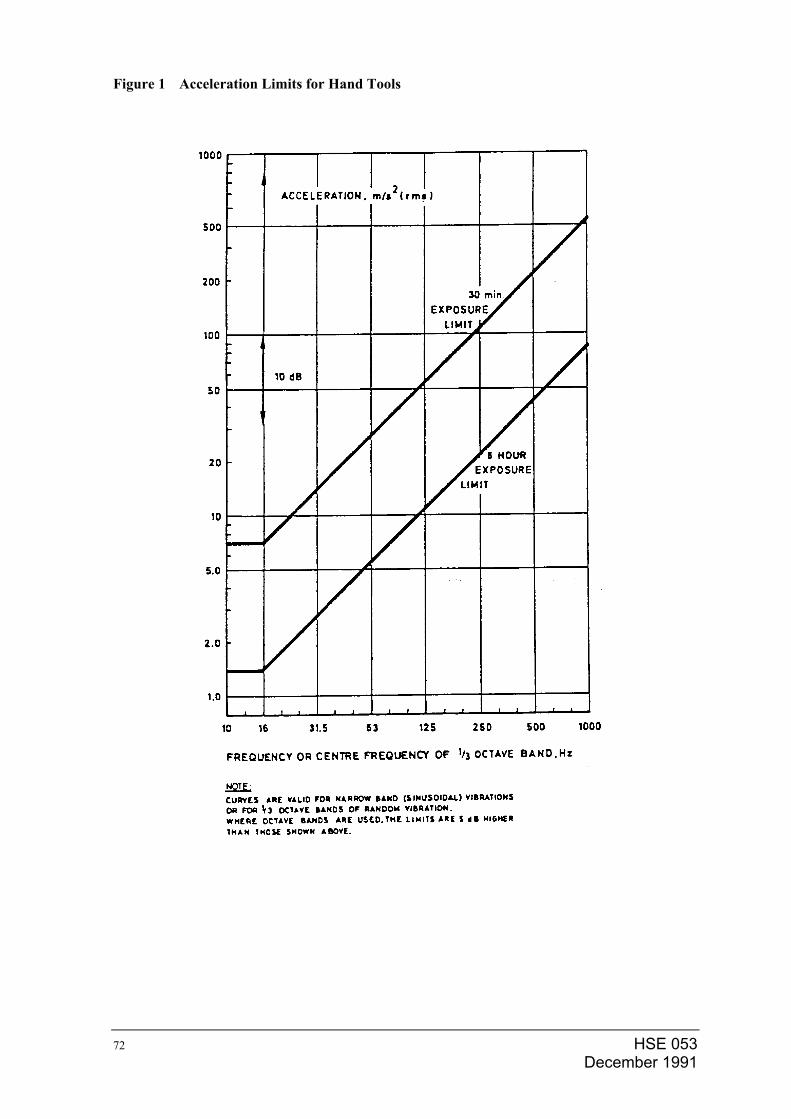
Figure 1 Acceleration Limits for Hand Tools
HSE 053 December 1991
72
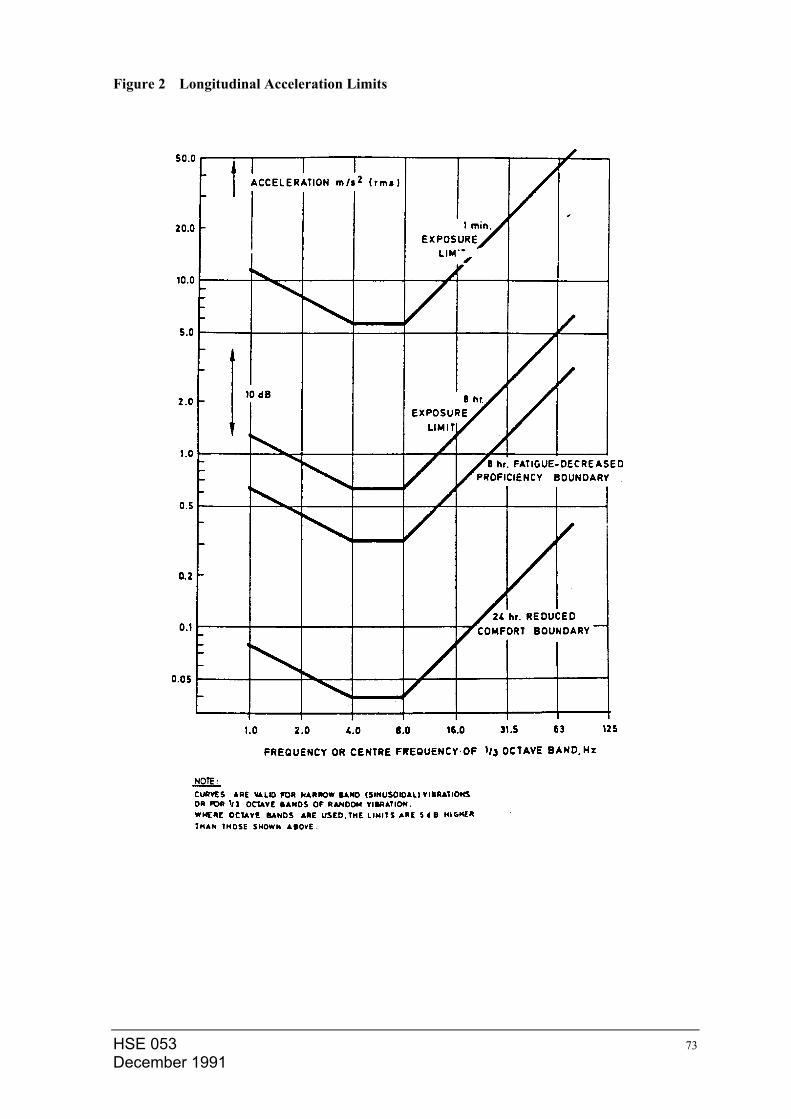
Figure 2 Longitudinal Acceleration Limits
HSE 053 73 December 1991
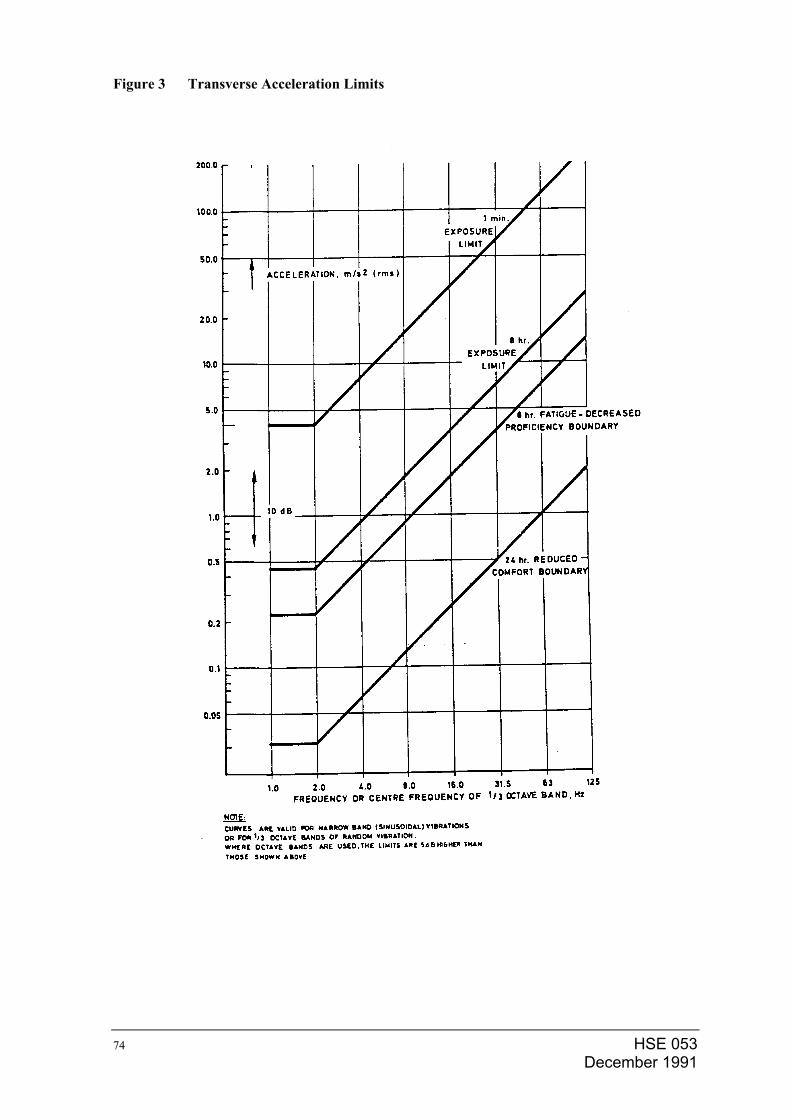
Figure 3 Transverse Acceleration Limits
HSE 053 December 1991
74

HSE 053 75 December 1991
APPENDIX V ULTRASOUND AND INFRASOUND
Ultrasound refers to frequencies of 16 kHz and above and may be produced by low power sources such as ultrasonic cleaning tanks or by electrical devices, and by high power sources such as Jet engines or turbines.
Auditory effects may be produced by the lower frequencies which are within the audible range. Sensory effects such as ringing in the ears have been experienced by some individuals. High frequencies are rapidly attenuated in air with distance from the source and effective protection can be provided by ear plugs or ear muffs.
Infrasound refers typically to frequencies in the range 2-20 Hz and may be produced by sources in nature, such as winds or waterfalls, and by heavy machinery, ground flares and jet engines. No auditory effects have been found but infrasound is thought to cause disturbance of the organs of balance. These effects occur at intensities of 140 dB and above i.e. relatively high intensity levels. These low frequencies are more effectively attenuated by ear inserts than by ear muffs.
It can be seen that the energy levels, the frequency spectra and the target organs all differ from those of audible noise. Consequently different techniques of measurement and evaluation are required. Where hazards do exist they are beyond the scope of the normal hearing conservation programme and special techniques need to be applied.
76 HSE 053 December 1991
APPENDIX VI ENVIRONMENTAL NOISE
Limits for environmental noise are not given in this guide since they will depend on the local situation.
It should be investigated whether local regulations exist with respect to environmental noise, which may include noise limits, methods of measurement and/or calculation, etc. The interpretation of such regulations should be discussed with local authorities with the object of arriving at agreed environmental noise limits.
These environmental noise limits may vary for different times of day or night and for workdays or weekends. The most stringent of the above requirements shall be the basis of design, taking due account of the period of operation of the plant.
It should be ensured that any allowances for occasional higher noise levels that may be acceptable to local authorities are included in the environmental noise limits, e.g. such as for emergencies.
Where local regulations for environmental noise do not exist this aspect of plant design should still be considered at the project definition stage to anticipate adverse community reactions at some later date. British Standard 4142 or ISO 1996 may then be used for guidance.
Authorities usually specify environmental noise limits in terms of maximum sound pressure levels at specified locations in the vicinity of the plant.
Such limits should be converted into limits in terms of a maximum sound power level for the plant under consideration. The resultant limits should be included in the project specification or any other document defining the scope of the project.
Unless otherwise specified, conversion of environmental sound pressure level into plant sound power level and vice versa should be carried out in accordance with EEMUA publication No 140, Part 3 and Appendix F, using either minimal or significant screening curves, whichever is applicable.