Embed Size (px)
Citation preview

Article
Noise Emission of a 200 kW Vertical AxisWind TurbineErik Möllerström 1,2,*, Fredric Ottermo 1, Jonny Hylander 1 and Hans Bernhoff 2
Received: 31 October 2015; Accepted: 22 December 2015; Published: 29 December 2015Academic Editor: Frede Blaabjerg
1 School of Business, Engineering and Science, Halmstad University, Halmstad SE-301 18, Sweden;[email protected] (F.O.); [email protected] (J.H.)
2 Division for Electricity, Department of Engineering Sciences, Uppsala University, Uppsala SE-751 21,Sweden; [email protected]
* Correspondence: [email protected]; Tel.: +46-35-16-7971; Fax: +46-35-18-6192
Abstract: The noise emission from a vertical axis wind turbine (VAWT) has been investigated. A noisemeasurement campaign on a 200 kW straight-bladed VAWT has been conducted, and the result hasbeen compared to a semi-empirical model for turbulent-boundary-layer trailing edge (TBL-TE) noise.The noise emission from the wind turbine was measured, at wind speed 8 m/s, 10 m above ground, to96.2 dBA. At this wind speed, the turbine was stalling as it was run at a tip speed lower than optimaldue to constructional constraints. The noise emission at a wind speed of 6 m/s, 10 m above groundwas measured while operating at optimum tip speed and was found to be 94.1 dBA. A comparisonwith similar size horizontal axis wind turbines (HAWTs) indicates a noise emission at the absolutebottom of the range. Furthermore, it is clear from the analysis that the turbulent-boundary-layertrailing-edge noise, as modeled here, is much lower than the measured levels, which suggests thatother mechanisms are likely to be important, such as inflow turbulence.
Keywords: vertical axis wind turbine (VAWT); H-rotor; noise; noise emission; sound power level
1. Introduction
Wind turbines are categorized into two groups by the orientation of their axis of rotation:horizontal axis wind turbines (HAWTs) and vertical axis wind turbines (VAWTs). The HAWT has by farbeen the most successful concept, with the large and economically feasible turbines of today; however,the VAWT concept has some advantages. VAWTs typically have fewer moving parts and a generatorlocated at ground level which could ultimately lead to higher availability and lower maintenancecost [1]. Furthermore, it has been shown that the concept is more suitable for up-scaling than theHAWT concept [2]. Moreover, of special interest here, VAWTs has potentially lower noise emission [1].
Noise is considered as one of the disadvantages with wind turbines and noise levels at dwellingsand other sensitive areas are typically regulated in national legislation which restrains potentiallocations for wind turbines. For example, in Sweden the recommendations for wind turbine noiseare set by the Swedish Environmental Protection Agency (SEPA) [3] to 40 dBA at dwellings, whichare further lowered to 35 dBA if obvious tones are present in the spectrum. A limit of 35 dBA is setfor specifically sensitive areas such as natural parks and planned recreational areas. These limits arebased on the sound intensity created at a wind speed of 8 m/s, 10 m above ground and measured over4 h. The definition of noise is simply unwanted sound [4]. Distinguishing noise from sound is to alarge extent subjective, but sound from wind turbines is generally considered as unwanted and maytherefore be referred to as noise.
Extensive research has been presented regarding noise from wind turbines. For example, in [5]the sound modeling, masking and propagation has been studied and in [6] the human response to
Energies 2016, 9, 19; doi:10.3390/en9010019 www.mdpi.com/journal/energies

Energies 2016, 9, 19 2 of 10
wind turbine noise has been investigated. However, most research has been concentrated towards themore common HAWT concept whereas little attention has been given to the alternative VAWT, whichhas shown potential for lower noise levels. Work that has been done regarding noise from VAWTsincludes [7,8] where numerical methods are used to simulate aerodynamic noise from VAWTs andwhich for both studies indicate lower noise levels compared to HAWTs. In [9] the noise characteristicsof a model VAWT were investigated and the applicability of different noise prediction models wasexamined. Simulations of VAWT noise emissions from first principles would require an accuratedetermination of the flow close to the blade, which is a computationally expensive task. However,recent progress with large eddy simulations [10–14] might render this approach feasible further on.
In this paper, the noise emission from a 200 kW VAWT is investigated, both by experiments andby using a semi-empirical noise model. Experimental results are compared to the noise emissions ofsimilar sized HAWTs and also used to compare with simple noise modeling, enabling conclusions tobe drawn regarding the applicability of the model for a medium sized VAWT.
2. Theory
Noise from operating wind turbines can be divided into aerodynamic and mechanical noise.Aerodynamic noise is of broadband character, it occurs when the air flows around the blade andoriginates from various complex flow phenomena. The generated noise generally increases with tipspeed and hence the most sound is produced at or close to the tip of the blade. Mechanical noiseoriginates from the relative motions of mechanical components in the gearbox, the generator, yawdrives, cooling fans, hydraulics, and power electronics. For modern turbines the aerodynamic noise isgenerally dominant and in [15] it is shown that for a modern HAWT the most noise is created closeto the blade tip when the blade travels downwards towards the receiver, a result of the directivityof aerodynamic noise emitted from a moving airfoil [4]. The characteristically swishing sound ofa wind turbine is due to amplitude modulation and has been proven to be the sound feature fromwind turbines that is the most annoying [4]. This mid frequency phenomena (400–1000 Hz) is createdby the directivity of the trailing edge noise, and convective amplification. The effect of amplitudemodulation will not be further discussed in this work as we will be focusing on the averaged level ofthe aerodynamic noise.
VAWTs usually have lower tip speed ratios (TSR) than HAWTs. The entire length of a VAWTblade travels at tip speed, which for a HAWT is only true for the actual blade tip. Since it has beenshown that most of the aerodynamic noise from a HAWT is generated close to the tip [15], lower levelsof aerodynamic noise might be expected for a VAWT due to the relatively low blade velocity comparedwith the case of a HAWT. However, the reality is likely to be more complex. An important difference isthat the blades of a VAWT experience a varying angle of attack, whereas for the HAWT case, the angleof attack is nearly constant. An additional difference is that VAWTs usually have support arms carryingthe blades, a feature not needed for HAWTs. However, the support arms can be made streamlined,in which case they will not be expected to generate much noise. Furthermore, the VAWT drive traincan be located at ground level which limits mechanical noise propagation [1].
Modeling the Noise
It has been demonstrated that noise from modern HAWTs is well modeled by theturbulent-boundary-layer trailing edge (TBL-TE) noise contribution [15]. Guided by this, we tryto estimate the noise level by using the empirical model for airfoil self-noise in [16], in particular theTBL-TE part of this model. For small VAWTs (low Reynolds numbers) laminar-boundary-layer trailingedge noise has been observed to be important [9], but for the larger-sized turbine considered herethe Reynolds number is of the order of 1ˆ 106, so the TBL-TE is expected to be dominant over thelaminar-boundary-layer part. A complication is that the model in [16] assumes static angles of attack,whereas in this case the angle of attack is constantly changing. However, static angle-of-attack lift

Energies 2016, 9, 19 3 of 10
and drag data has been successfully used in prediction models of VAWT performance [17], so it isreasonable to evaluate a static approach here as well.
A rapidly varying angle of attack gives rise to a dynamic stall effect, which means that flowseparation at large angles of attack is effectively delayed. In [9], it was observed that the dynamic stalleffect seems to constitute a measurable source of noise, probably due to large force fluctuations whenthe flow eventually separates. This was however only observed for very low TSRs, indicating thatstrong flow separation will not occur for TSR values in the range 2.9 to 3.8, as considered here. In [18],different models for dynamic stall was applied to a VAWT for TSR values between 2.20 and 3.09, anddynamic stall is seen to be present even at TSR 3.09, but its effect here seems to be that stall is to a largeextent avoided. Thus we can expect that the TBL-TE noise might be somewhat overestimated using astatic model for the current TSR range, as the airfoil is stalling less in reality due to dynamic stall.
When calculating the angles of attack, a simple model is adopted, where the flow is assumedto be unperturbed by the turbine, and the angles of attack range up to 15˝, hence reaching the stallregion. More sophisticated flow models will halt the flow around the turbine, implying slightly lowerangles of attack. In reality the VAWT flow is very complex and difficult to simulate accurately, so theactual angle of attack in this situation is a source of uncertainty. However, to get an indication of thenoise levels produced by the TBL-TE model of [16] it seems reasonable to use the simple approachpresented here.
The basic empirical equation for the sound pressure spectrum due to the TBL-TE noise for anairfoil [15,16] is:
p2 p f q “ K p f qδ˚M5L
R2 ¨2 sin2 pθ{2q sin2ϕ
p1´M cosξq4(1)
where K(f ) is a frequency dependent constant, δ˚ is the displacement thickness of the boundarylayer at the trailing edge, M is the blade Mach number, L is the blade span and R the distance fromthe source to the observer. The angles θ, ϕ and ξ are defined according to [15], illustrated for thecurrent geometry in Figure 1. θ is the angle between the source-observer line and the blade chordline, ξ is the angle between the source-observer line and the relative wind speed, and ϕ is understoodfrom Figure 1. When calculating R and the angles, the motion of the air flow needs to be taken intoaccount, using retarded coordinates for the source. In the current geometry, however, this is easilyachieved by simply offset the observer position according to the wind speed and sound travel time.The procedure for calculating K(f) is given in [16] for 1/3 octave bands; the calculation involvesthe Strouhal number corresponding to the displacement thickness and lengthy parametrizations ofexperimental observations. There are three contributions to p2, one from the suction side, one from thepressure side and one additional term due to the angle of attack. Each of these contributions has aseparate calculation of the displacement thickness and the frequency dependence.
Energies 2016, 9, 19
3
lift and drag data has been successfully used in prediction models of VAWT performance [17], so it
is reasonable to evaluate a static approach here as well.
A rapidly varying angle of attack gives rise to a dynamic stall effect, which means that flow
separation at large angles of attack is effectively delayed. In [9], it was observed that the dynamic
stall effect seems to constitute a measurable source of noise, probably due to large force fluctuations
when the flow eventually separates. This was however only observed for very low TSRs, indicating
that strong flow separation will not occur for TSR values in the range 2.9 to 3.8, as considered here.
In [18], different models for dynamic stall was applied to a VAWT for TSR values between 2.20 and
3.09, and dynamic stall is seen to be present even at TSR 3.09, but its effect here seems to be that stall
is to a large extent avoided. Thus we can expect that the TBL‐TE noise might be somewhat
overestimated using a static model for the current TSR range, as the airfoil is stalling less in reality
due to dynamic stall.
When calculating the angles of attack, a simple model is adopted, where the flow is assumed to
be unperturbed by the turbine, and the angles of attack range up to 15°, hence reaching the stall
region. More sophisticated flow models will halt the flow around the turbine, implying slightly
lower angles of attack. In reality the VAWT flow is very complex and difficult to simulate accurately,
so the actual angle of attack in this situation is a source of uncertainty. However, to get an indication
of the noise levels produced by the TBL‐TE model of [16] it seems reasonable to use the simple
approach presented here.
The basic empirical equation for the sound pressure spectrum due to the TBL‐TE noise for an
airfoil [15,16] is:
δ∗∙2 sin θ/2 sin φ
1 cosξ (1)
where K(f) is a frequency dependent constant, δ∗ is the displacement thickness of the boundary
layer at the trailing edge, M is the blade Mach number, L is the blade span and R the distance from
the source to the observer. The angles θ, φ and ξ are defined according to [15], illustrated for the current geometry in Figure 1. θ is the angle between the source‐observer line and the blade chord line,
ξ is the angle between the source‐observer line and the relative wind speed, and φ is understood from Figure 1. When calculating R and the angles, the motion of the air flow needs to be taken into
account, using retarded coordinates for the source. In the current geometry, however, this is easily
achieved by simply offset the observer position according to the wind speed and sound travel time.
The procedure for calculating K(f) is given in [16] for 1/3 octave bands; the calculation involves the
Strouhal number corresponding to the displacement thickness and lengthy parametrizations of
experimental observations. There are three contributions to , one from the suction side, one from
the pressure side and one additional term due to the angle of attack. Each of these contributions has
a separate calculation of the displacement thickness and the frequency dependence.
Figure 1. Definition of the angles θ, φ and ξ. Figure 1. Definition of the angles θ, ϕ and ξ.
Energies 2016, 9, 19 4 of 10
Positioning the observer downwind at a certain horizontal distance Rh to the hub, the angles θ,ϕ and ξ and source-observer distance R, are determined as a function of the turbine dimensions andthe blade azimuth angle β. The squared pressure of Equation (1) is then averaged over the angles βand multiplied by 3 (three blades). Finally, the A-weighted sound pressure level is calculated.
3. Method
3.1. Wind Turbine System
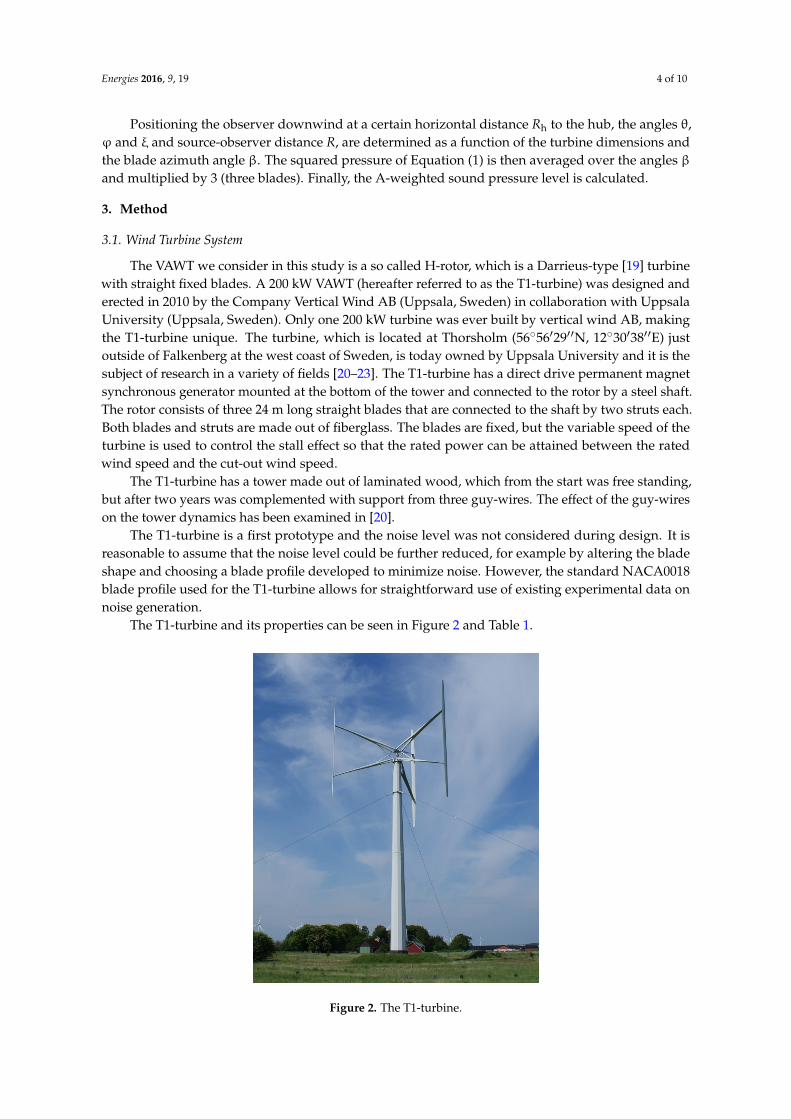
The VAWT we consider in this study is a so called H-rotor, which is a Darrieus-type [19] turbinewith straight fixed blades. A 200 kW VAWT (hereafter referred to as the T1-turbine) was designed anderected in 2010 by the Company Vertical Wind AB (Uppsala, Sweden) in collaboration with UppsalaUniversity (Uppsala, Sweden). Only one 200 kW turbine was ever built by vertical wind AB, makingthe T1-turbine unique. The turbine, which is located at Thorsholm (56˝5612911N, 12˝3013811E) justoutside of Falkenberg at the west coast of Sweden, is today owned by Uppsala University and it is thesubject of research in a variety of fields [20–23]. The T1-turbine has a direct drive permanent magnetsynchronous generator mounted at the bottom of the tower and connected to the rotor by a steel shaft.The rotor consists of three 24 m long straight blades that are connected to the shaft by two struts each.Both blades and struts are made out of fiberglass. The blades are fixed, but the variable speed of theturbine is used to control the stall effect so that the rated power can be attained between the ratedwind speed and the cut-out wind speed.
The T1-turbine has a tower made out of laminated wood, which from the start was free standing,but after two years was complemented with support from three guy-wires. The effect of the guy-wireson the tower dynamics has been examined in [20].
The T1-turbine is a first prototype and the noise level was not considered during design. It isreasonable to assume that the noise level could be further reduced, for example by altering the bladeshape and choosing a blade profile developed to minimize noise. However, the standard NACA0018blade profile used for the T1-turbine allows for straightforward use of existing experimental data onnoise generation.
The T1-turbine and its properties can be seen in Figure 2 and Table 1.
Energies 2016, 9, 19
4
Positioning the observer downwind at a certain horizontal distance Rh to the hub, the angles θ, φ and ξ and source‐observer distance R, are determined as a function of the turbine dimensions
and the blade azimuth angle β. The squared pressure of Equation (1) is then averaged over the
angles β and multiplied by 3 (three blades). Finally, the A‐weighted sound pressure level is calculated.
3. Method
3.1. Wind Turbine System
The VAWT we consider in this study is a so called H‐rotor, which is a Darrieus‐type [19]
turbine with straight fixed blades. A 200 kW VAWT (hereafter referred to as the T1‐turbine) was
designed and erected in 2010 by the Company Vertical Wind AB (Uppsala, Sweden) in collaboration
with Uppsala University (Uppsala, Sweden). Only one 200 kW turbine was ever built by vertical
wind AB, making the T1‐turbine unique. The turbine, which is located at Thorsholm (56°56ʹ29ʺN,
12°30ʹ38ʺE) just outside of Falkenberg at the west coast of Sweden, is today owned by Uppsala
University and it is the subject of research in a variety of fields [20–23]. The T1‐turbine has a direct
drive permanent magnet synchronous generator mounted at the bottom of the tower and connected
to the rotor by a steel shaft. The rotor consists of three 24 m long straight blades that are connected to
the shaft by two struts each. Both blades and struts are made out of fiberglass. The blades are fixed,
but the variable speed of the turbine is used to control the stall effect so that the rated power can be
attained between the rated wind speed and the cut‐out wind speed.
The T1‐turbine has a tower made out of laminated wood, which from the start was free
standing, but after two years was complemented with support from three guy‐wires. The effect of
the guy‐wires on the tower dynamics has been examined in [20].
The T1‐turbine is a first prototype and the noise level was not considered during design. It is
reasonable to assume that the noise level could be further reduced, for example by altering the blade
shape and choosing a blade profile developed to minimize noise. However, the standard NACA0018
blade profile used for the T1‐turbine allows for straightforward use of existing experimental data on
noise generation.
The T1‐turbine and its properties can be seen in Figure 2 and Table 1.
Figure 2. The T1‐turbine. Figure 2. The T1-turbine.

Energies 2016, 9, 19 5 of 10
Table 1. Properties of the T1-turbine.
Category Property Value
Operation
Rated power 200 kWRotational speed 16–33 rpm
Nominal tip speed ratio 3.8Cut-in wind speed 4 m/sRated wind speed 12 m/s
Cut-out wind speed 25 m/sSurvival wind speed 60 m/s
Power regulation Stall
Geometry
Turbine diameter 26 mHub height (foundation included) 40 m
Blade length 24 mBlade chord 0.4–0.9 mSwept area 624 m2
MaterialBlade/strut material Fiberglass composite
Tower material Laminated wood
3.2. Experimental Setup
The microphone used was a BSWA MP201 which together with preamplifier MA211 gives aflat frequency response and Class 1 accuracy (<0.7 dBA) according to the international standard forsound level meters, IEC61672-1 [24]. A Norsonic Nor140 was used as field recorder. For calibration anacoustic calibrator, Brüel and Kjær type 4231, was used. For setting the distance to the tower a laserrangefinder, Leica Pinmaster, with an accuracy of ˘1 m, was used.
For recording the sound pressure level of the wind turbine, the microphone was mounted onan acoustically hard circular board with a primary 90 mm and a secondary 250 mm wind protection.The circular board gives a coherent addition c = 6 dB. The total acoustic attenuation of the windprotections is 0.5 dB with the largest effect on higher frequencies, this effect is deemed negligibleand has not been accounted for in the result. The entire setup is consistent with the internationalstandard International Electrotechnical Commission 61400-11 “Wind turbines—Part 11: Acoustic noisemeasurement techniques” [25].
The wind speed was measured by a Thies Clima 4.3351.00.161 cup anemometer, placed at a heightof 42 m on a wind measurement mast situated 100 m from the actual turbine. The anemometer has ameasuring instability of <1% or <0.2 m/s. The signals from the anemometer was measured by a PLC(programmable logic controller; model: Millenium 3 XD26, Crouzet, San Diego, CA, USA) and logged,at a sampling frequency of 1 Hz, by the cRIO (CompactRIO; model: cRIO9074, National Instruments,Austin, TX, USA) belonging to the wind turbine control system. The rotational speed of the T1-turbinewas measured by a 10-bit rotational encoder which was placed on the lower end of the drive shaft.The rotational speed was logged by the same cRIO as the wind speed.
3.3. Observations
The T1-turbine is located in a plain field with a heavy trafficked motorway 750 m to its southwest.Interfering noise from this freeway was evened out due to the distance and was approximately at thesame level during the entire recording. Furthermore there is a farm located nearby with its accessroad just 70 m from the turbine but there were no interfering traffic during the time of recording.The microphone was placed at a distance of Rh = 40 m from the tower.

Energies 2016, 9, 19 6 of 10
3.4. Calculating Noise Emission from Recordings
When recording noise from a wind turbine, the sound recorded Lp,rec (in dBA) consists of thesound pressure level due to the wind turbine noise Lp,wt as well as the background sound Lp,bg whichare related by [4]:
Lp,rec “ 10¨ log10p10Lp,wt{10 ` 10Lp,bg{10q (2)
Recording with the wind turbine sequentially turned on and shut down and assuming that thewind and background sound conditions are unchanged, Equation (2) can be used to separate thewind turbine sound pressure level from the total sound pressure level. In reality, the conditions arenever unchanged. But by keeping track on the wind speed and using long enough recordings, theeffect of wind speed can be taken into account and the effect of background sound conditions will beevened out. The emitted sound pressure levels of the wind turbine and background can, by taking thespherical sound distribution and the coherent addition of sound reflected from the ground c, be usedto calculate the emitted sound power level (hereafter called noise emission) LW,wt (in dBA) of the windturbine by:
LW,wt “ Lp,wt ´ c` 10¨ log10
ˆ
4πR2
S0
˙
(3)
where S0 is a reference area of 1 m2 and R “b
R2h ` H2 is the distance between the rotor axis at hub
height and the place of recording, where H is the hub height of the turbine and Rh the horizontaldistance between tower and place of recording. The standardized measurement procedure for decidingthe noise emission is described in the standard [25] and a similar but not identical approach has beenused for this work.
Method of Bins and Standard Uncertainty
To calculate the noise emission for a certain wind speed, Lp,wt and Lp,bg must be quantified forthat wind speed. For this, the IEC standard specifies using the method of bins. The measured data,presented as 10 s mean values, is divided into bins, i.e. uniformly sized sections along the wind speedaxis. After that, the mean values of the sound pressure level Lp,i and the mean wind speed Vi, for bin i,are calculated as:
Lp,i “ 10¨ log10
¨
˚
˝
1Ni
Niÿ
j“1
10pLp,i,j
10q
˛
‹
‚
(4)
Vi “1Ni
Niÿ
j“1
vi,j (5)
where Lp,i,j and vi,j is the sound pressure level and wind speed at measurement period j in bin i, andNi is the number of measurement periods. The sound pressure level at wind speeds not coincidingwith Vi is obtained by linear interpolation of the mean bin values. This is done for the wind turbinenoise data to get Lp,wt, and for the background data to get Lp,bg.
The calculation of the standard uncertainties follows the prescription in the IEC standard.The standard uncertainty for Lp,i is calculated as:
uLpi “
d
σLpi2
Ni` uLpe
2 (6)
where σLpi is the standard deviation of Lp,i for bin i, and uLpe is the overall precision of thecorresponding measurement equipment. The next step is to obtain the standard uncertainties atthe interpolated positions, for which the uncertainty of the wind speed is also needed (calculated

Energies 2016, 9, 19 7 of 10
analogously to Equation (6)), as well as the covariance of the wind speed and the sound pressure level.See [25] for details.
3.5. Measurement Limitations
According to the standard [25], regarding VAWTs, a distance Rh “ H` D should be used betweenthe measuring point and the turbine, where H is the hub height and D the equatorial rotor diameter.A 20% or maximum 30 m deviation is allowed as long as the distance is measured with an accuracyof ˘ 2%. However, in this study, a distance Rh = H was used, which is below the minimum distanceallowed for VAWTs. The distance Rh “ H`D appears reasonable for guy-wired Darrieus-type VAWTs(the historically most common type), where hub heights are generally low. The specified HAWTdistance, Rh “ H ` D{2, would in the Darrius case imply a measurement point very close to theblade. The VAWT studied here, with its high tower, is in this sense, however, more similar to a HAWT.In addition, the relatively high noise level due to the nearby freeway motivated a measurement pointeven a little closer, at Rh = H, to increase signal to noise ratio.
The measurements were performed with an upper limit of the rotational speed set to 22 rpm.The reason for this is that the added guy-wires stiffen the tower so that the first mode Eigen frequencyof the tower is excited at 23 rpm. The limitation means that the turbine was operated at optimum tipspeed for the measurements done at 6 m/s (10 m height) but for higher wind speeds the tip speedwas below optimum and thus the turbine was stalling. The stalling contributes to the creation of noisewhile the lower velocity of the blade counteracts it [4]. It is unclear which effect is most important.
4. Results
A recording was performed with the turbine first turned on for 60 min, then turned off for 24 minand then turned on again for another 11 min. The mean wind speed at hub height was 8.0 m/s and9.5 m/s with the turbine turned on and off respectively. If recalculated to the standard 10 m height,using power law extrapolation described in [26], these wind speeds equals 6.3 m/s and 7.4 m/s.By using the 10 s based mean values and assuming that the turbine is turned off when the electricoutput is below 5% of rated power, the total and background noise can respectively be presented asfunctions of wind speed, see Figure 3. Using the linear relations between the mean bin values fromFigure 3 together with Equation (2), the wind turbine sound pressure level Lp,wt can be decided fordifferent wind speeds. Thereafter, the noise emission LW,wt can be decided with Equation (3). Thenoise emissions with standard uncertainty for wind speeds between 5 m/s and 8 m/s are displayed inTable 2.
Energies 2016, 9, 19
7
diameter. A 20% or maximum 30 m deviation is allowed as long as the distance is measured with an
accuracy of ± 2%. However, in this study, a distance Rh = H was used, which is below the minimum
distance allowed for VAWTs. The distance appears reasonable for guy‐wired
Darrieus‐type VAWTs (the historically most common type), where hub heights are generally low.
The specified HAWT distance, /2, would in the Darrius case imply a measurement point
very close to the blade. The VAWT studied here, with its high tower, is in this sense, however, more
similar to a HAWT. In addition, the relatively high noise level due to the nearby freeway motivated
a measurement point even a little closer, at Rh = H, to increase signal to noise ratio.
The measurements were performed with an upper limit of the rotational speed set to 22 rpm.
The reason for this is that the added guy‐wires stiffen the tower so that the first mode Eigen
frequency of the tower is excited at 23 rpm. The limitation means that the turbine was operated at
optimum tip speed for the measurements done at 6 m/s (10 m height) but for higher wind speeds the
tip speed was below optimum and thus the turbine was stalling. The stalling contributes to the
creation of noise while the lower velocity of the blade counteracts it [4]. It is unclear which effect is
most important.
4. Results
A recording was performed with the turbine first turned on for 60 min, then turned off for
24 min and then turned on again for another 11 min. The mean wind speed at hub height was 8.0 m/s
and 9.5 m/s with the turbine turned on and off respectively. If recalculated to the standard 10 m
height, using power law extrapolation described in [26], these wind speeds equals 6.3 m/s and
7.4 m/s. By using the 10 s based mean values and assuming that the turbine is turned off when the
electric output is below 5% of rated power, the total and background noise can respectively be
presented as functions of wind speed, see Figure 3. Using the linear relations between the mean bin
values from Figure 3 together with Equation (2), the wind turbine sound pressure level , can
be decided for different wind speeds. Thereafter, the noise emission , can be decided with
Equation (3). The noise emissions with standard uncertainty for wind speeds between 5 m/s and
8 m/s are displayed in Table 2.
Figure 3. Sound pressure level against wind speed (recalculated to 10 m above ground) presented as
an average per 10 s with turbine turned on (blue) and off (red). The standard uncertainty is plotted
for the sound pressure levels for each bin.
Table 2. Noise emission for different wind speeds calculated from results of recordings.
Wind Speed at
10 m Height
Tip Speed
Ratios (TSR)
Noise Emission with
Standard Uncertainty
Noise Model
Calculation
m/s ‐ dBA dBA
5 3.8 93.1 ± 1.0 69.6
6 3.8 94.1 ± 1.1 74.5
7 3.4 95.4 ± 1.0 78.6
8 2.9 96.2 ± 1.0 82.3
Figure 3. Sound pressure level against wind speed (recalculated to 10 m above ground) presented asan average per 10 s with turbine turned on (blue) and off (red). The standard uncertainty is plotted forthe sound pressure levels for each bin.

Energies 2016, 9, 19 8 of 10
Table 2. Noise emission for different wind speeds calculated from results of recordings.
Wind Speed at10 m Height
Tip SpeedRatios (TSR)
Noise Emission withStandard Uncertainty
Noise ModelCalculation
m/s - dBA dBA5 3.8 93.1 ˘ 1.0 69.66 3.8 94.1 ˘ 1.1 74.57 3.4 95.4 ˘ 1.0 78.68 2.9 96.2 ˘ 1.0 82.3
In Figure 4, the 1/3 octave band of the wind turbine noise can be seen. These bands correspondto the sound pressure level, from the wind turbine, at the recording distance and a hub height windspeed of 8.0 m/s. Each of the bands is calculated using the same method as described for Lp,wt above.
Energies 2016, 9, 19
8
In Figure 4, the 1/3 octave band of the wind turbine noise can be seen. These bands correspond
to the sound pressure level, from the wind turbine, at the recording distance and a hub height wind
speed of 8.0 m/s. Each of the bands is calculated using the same method as described for , above.
Figure 4. 1/3 octave band of T1‐turbine sound pressure level: experimental (blue) and modeled
(green). Both cases for a wind speed (hub height) of 8.0 m/s.
Also shown in Figure 4 is the resulting spectrum of the TBL‐TE noise calculation outlined in
Section 2.1. Conforming to the experimental setup, a horizontal recording distance of 40 m and
mean wind speed of 8.0 m/s at hub height has been used. Input values for the turbine geometry and
TSR are the ones given in Table 1, however with a constant chord length of 0.8 m. Even if the form
of the spectrum shows resemblance with the measured one, it can be clearly seen that the calculated
noise levels are well below what is measured. The overall calculated emission level is 15–20 dB
lower, as can be seen in Table 2. This suggests that the TBL‐TE noise, as modeled here, is not alone
responsible for the measured noise. As seen in the Table 2, however, the difference decreases for
higher wind speeds. This decrease could perhaps be attributed to the static stall of the TBL‐TE
model; at lower TSR the airfoil reaches deeper into the stall region and assuming fully developed
static stall at all times within this region is likely to imply a higher noise level than if dynamic stall
is present, as discussed in Section 2.1 above.
5. Discussion and Conclusions
The noise emission of the T1‐turbine at 8 m/s, 10 m above ground, was measured to 96.2 dBA.
At this wind speed the turbine was stalling due to the upper limit of the rotational speed added after
installing the guy wires, and the effect of this upon the noise level is unclear as there are two
balancing effects. The noise emission at 6 m/s 10 m above ground was measured to 94.1 dBA, this
while operating at optimum tip speed. Available noise surveys performed on similar sized
HAWTs [27–30] has established noise emissions of 95.1–100.2 dBA and 97.3–102.4 dBA for 6 m/s and
8 m/s respectively, see Table 3 for details. Using this for comparison, the T1‐turbine indicates a noise
emission at the absolute lower range of the similar size HAWTs while running at optimum tip
speed. At 8 m/s the noise emission of the T1‐turbine is still lower than any of the compared HAWTs.
Table 3. Noise emission and specifications of horizontal axis wind turbines (HAWTs) in comparison.
Wind speeds for noise emissions are stated for 10 m above ground [27–30].
Turbine
Model
Power
(kW)
Rotor
Diameter (m)
No. of
Blades
Power
Regulation
dBA at
6 m/s
dBA at
8 m/s
Vestas V27 225 27 3 Pitch 96.7 97.3
GEV‐MP R 200–275 32 2 Pitch 100.2 102.4
WTN250 250 30 3 Stall 95.1 99.8
Norwin 29/225 225 29 3 Stall 95.2 97.5
Figure 4. 1/3 octave band of T1-turbine sound pressure level: experimental (blue) and modeled(green). Both cases for a wind speed (hub height) of 8.0 m/s.
Also shown in Figure 4 is the resulting spectrum of the TBL-TE noise calculation outlined inSection 2. Conforming to the experimental setup, a horizontal recording distance of 40 m and meanwind speed of 8.0 m/s at hub height has been used. Input values for the turbine geometry and TSRare the ones given in Table 1, however with a constant chord length of 0.8 m. Even if the form of thespectrum shows resemblance with the measured one, it can be clearly seen that the calculated noiselevels are well below what is measured. The overall calculated emission level is 15–20 dB lower, ascan be seen in Table 2. This suggests that the TBL-TE noise, as modeled here, is not alone responsiblefor the measured noise. As seen in the Table 2, however, the difference decreases for higher windspeeds. This decrease could perhaps be attributed to the static stall of the TBL-TE model; at lower TSRthe airfoil reaches deeper into the stall region and assuming fully developed static stall at all timeswithin this region is likely to imply a higher noise level than if dynamic stall is present, as discussed inSection 2 above.
5. Discussion and Conclusions
The noise emission of the T1-turbine at 8 m/s, 10 m above ground, was measured to 96.2 dBA.At this wind speed the turbine was stalling due to the upper limit of the rotational speed addedafter installing the guy wires, and the effect of this upon the noise level is unclear as there are twobalancing effects. The noise emission at 6 m/s 10 m above ground was measured to 94.1 dBA, this whileoperating at optimum tip speed. Available noise surveys performed on similar sized HAWTs [27–30]has established noise emissions of 95.1–100.2 dBA and 97.3–102.4 dBA for 6 m/s and 8 m/s respectively,see Table 3 for details. Using this for comparison, the T1-turbine indicates a noise emission at the

Energies 2016, 9, 19 9 of 10
absolute lower range of the similar size HAWTs while running at optimum tip speed. At 8 m/s thenoise emission of the T1-turbine is still lower than any of the compared HAWTs.
Table 3. Noise emission and specifications of horizontal axis wind turbines (HAWTs) in comparison.Wind speeds for noise emissions are stated for 10 m above ground [27–30].
Turbine Model Power(kW)
RotorDiameter (m)
No. ofBlades
PowerRegulation
dBA at6 m/s
dBA at8 m/s
Vestas V27 225 27 3 Pitch 96.7 97.3GEV-MP R 200–275 32 2 Pitch 100.2 102.4WTN250 250 30 3 Stall 95.1 99.8
Norwin 29/225 225 29 3 Stall 95.2 97.5
The noise emission of the VAWT is not properly modeled by the TBL-TE part of the airfoilself-noise model given in [16]. This suggests that other mechanisms are important for understandingnoise generation on VAWTs of this size. In [9], where a small VAWT is studied, it was anticipated thatthe inflow turbulence is responsible for generating most of the noise, and the TBL-TE noise was foundto be about 15 dB lower than the measured value. It is interesting to note that an equal deviation isfound here, in spite of the substantial difference in size. If the noise from a MW-size VAWT is believedto be dominated by the TBL-TE noise, as seems to be the case for modern MW-size HAWTs, one wouldhave expected the TBL-TE noise calculation to more closely reproduce the measured values for thisintermediate-size VAWT. Using a model intended for a steady angle of attack in a context where theangle of attack varies will naturally lead to deviations, but as long as the stall region is not entered,and dynamic stall is not prominent, the deviations are likely to be much smaller than 15 dB. Still,to accurately assess the TBL-TE contribution for VAWTs one would need models that properly addressthe unsteady angle of attack.
The noise characteristics of VAWTs need to be investigated further and the 200 kW T1-turbinecreates an opportunity doing so utilizing perhaps the largest operational VAWT existing today.Examples of future work on the T1-turbine are noise directivity measurements, amplitude modulationanalysis and quantification of the aerodynamic noise sources using a microphone array.
Acknowledgments: This work was conducted within the STandUP for ENERGY strategic research framework.Vertical Wind AB is acknowledged for further financial support.
Author Contributions: Erik Möllerström analyzed the experimental measurements, helped with noise modelingand wrote most of the article. Fredric Ottermo was main responsible for noise modeling and wrote parts of thearticle. Jonny Hylander and Hans Bernhoff supervised the project.
Conflicts of Interest: The authors declare no conflict of interest.
References
1. Eriksson, S.; Bernhoff, H.; Leijon, M. Evaluation of different turbine concepts for wind power. Renew. Sustain.Energy Rev. 2008, 12, 1419–1434. [CrossRef]
2. Ottermo, F.; Bernhoff, H. An upper size of vertical axis wind turbines. Wind Energy 2013, 17, 1623–1629.[CrossRef]
3. Adolfsson, E. Riktvärden för Ljud från Vindkraft; Swedish Environmental Protection Agency: Stockholm,Sweden, 2010. (In Swedish)
4. Bowdler, D.; Leventhall, H.G. Wind Turbine Noise; Multi Science Publishing Company Limited: Hockley,UK, 2011.
5. Bolin, K. Wind Turbine Noise and Natural Sounds: Masking, Propagation and Modeling. Ph.D. Thesis,Royal Institute of Technology, Stockholm, Sweden, 2009.
6. Pedersen, E. Human response to wind turbine noise: Perception, annoyance and moderating factors.Ph.D. Thesis, The Sahlgrenska Academy, University of Gothenburg, Gothenburg, Sweden, 2007.
7. Iida, A.; Mizuno, A.; Fukudome, K. Numerical simulation of aerodynamic noise radiated from vertical axiswind turbines. In Proceedings of the 18 International Congress on Acoustics, Kyoto, Japan, 4–9 April 2004.
Energies 2016, 9, 19 10 of 10
8. Dumitrescu, H.; Cardos, V.; Dumitrache, A.; Frunzulica, F. Low-frequency noise prediction of vertical axiswind turbines. Proc. Rom. Acad. 2010, 11, 47–54.
9. Pearson, C. Vertical axis wind turbine acoustics. Ph.D. Thesis, Cambridge University, Cambridge, UK, 2014.10. Barsky, D.; Posa, A.; Rahromostaqim, M.; Leftwich, M.C.; Balaras, E. Experimental and computational wake
characterization of a vertical axis wind turbine. In Proceedings of the 32nd AIAA Applied AerodynamicsConference, Atlanta, GA, USA, 16–20 June 2014.
11. Elkhoury, M.; Kiwata, T.; Aoun, E. Experimental and numerical investigation of a three-dimensionalvertical-axis wind turbine with variable-pitch. J. Wind Eng. Ind. Aerodyn. 2015, 139, 111–123. [CrossRef]
12. Li, C.; Zhu, S.; Xu, Y.; Xiao, Y. 2.5 D large eddy simulation of vertical axis wind turbine in consideration ofhigh angle of attack flow. Renew. Energy 2013, 51, 317–330. [CrossRef]
13. Shamsoddin, S.; Porté-Agel, F. Large eddy simulation of vertical axis wind turbine wakes. Energies 2014, 7,890–912. [CrossRef]
14. Ferreira, C.J.S.; van Zuijlen, A.; Bijl, H.; van Bussel, G.; van Kuik, G. Simulating dynamic stall in atwo-dimensional vertical-axis wind turbine: Verification and validation with particle image velocimetrydata. Wind Energy 2010, 13, 1–17. [CrossRef]
15. Oerlemans, S.; Sijtsma, P.; López, B.M. Location and quantification of noise sources on a wind turbine.J. Sound Vib. 2007, 299, 869–883. [CrossRef]
16. Brooks, T.F.; Pope, D.S.; Marcolini, M.A. Airfoil Self-Noise and Prediction; National Aeronautics and SpaceAdministration: Hampton, VA, USA, 1989.
17. Paraschivoiu, I. Wind Turbine Design: With Emphasis on Darrieus Concept; Presses inter Polytechnique:Montreal, QC, Canada, 2002.
18. Dyachuk, E.; Goude, A. Simulating Dynamic Stall Effects for Vertical Axis Wind Turbines Applying a DoubleMultiple Streamtube Model. Energies 2015, 8, 1353–1372. [CrossRef]
19. Marie, D.G.J. Turbine Having Its Rotating Shaft Transverse to the Flow of the Current. U.S. Patent 1,835,018,8 December 1931.
20. Möllerström, E.; Ottermo, F.; Hylander, J.; Bernhoff, H. Eigen Frequencies of A Vertical Axis Wind TurbineTower Made of Laminated Wood and the Effect Upon Attaching Guy Wires. Wind Eng. 2014, 38, 277–290.[CrossRef]
21. Eriksson, S.; Kjellin, J.; Bernhoff, H. Tip Speed ratio control of a 200 kW VAWT with synchronous generatorand variable DC voltage. Energy Sci. Eng. 2013, 1, 135–143. [CrossRef]
22. Kjellin, J.; Eriksson, S.; Bernhoff, H. Electric control substituting pitch control for large wind turbines.J. Wind Energy 2013, 2013. [CrossRef]
23. Möllerström, E.; Ottermo, F.; Goude, A.; Eriksson, S.; Hylander, J.; Bernhoff, H. Turbulence influence onwind energy extraction for a medium size vertical axis wind turbine. Wind Energy 2016, in press.
24. Electroacoustics—Sound Level Meters—Part 1: Specifications, Edition 2; IEC 61672-1; The InternationalElectrotechnical Commission (IEC): Genèva, Switzerland, 2013.
25. Wind Turbine Generator Systems–Part 11: Acoustic Noise Measurement Techniques, Edition 3; IEC 61400-11;The International Electrotechnical Commission (IEC): Genèva, Switzerland, 2012.
26. Manwell, J.F.; McGowan, J.G.; Rogers, A.L. Wind Energy Explained: Theory, Design and Application; John Wiley& Sons: Hoboken, NJ, USA, 2010.
27. Noise Measurement of VESTAS V27-225kW Wind Turbine, DNV Det Norske Veritas. Available online:http://www.southhams.gov.uk/planningdocs/1/00/20/23/00202341.pdf (accessed on 27 June 2014).
28. GEV MP-R32 m Rotor Diameter Sound Power Levels, VERGNET Wind Turbines. Available online: http://www.cesa.org/assets/2013-Files/ITAC/VergnetGEVMPRacousticreport.pdf (accessed on 23 July 2014).
29. Noise Assessment NORWIN 29 225 kW Wind Turbine, 24 Acoustics. Available online: http://planning.allerdale.gov.uk/portal/servlets/AttachmentShowServlet?ImageName=218119 (accessed on 23 July 2014).
30. General Noise Specifications WTN 250 kW. Wind Technik Nord GmbH. Available online: http://www.newport.gov.uk/stellent/groups/public/documents/planningdocument/cont616474.pdf (accessed on23 July 2014).
© 2015 by the authors; licensee MDPI, Basel, Switzerland. This article is an open accessarticle distributed under the terms and conditions of the Creative Commons by Attribution(CC-BY) license (http://creativecommons.org/licenses/by/4.0/).