Embed Size (px)
Citation preview

Department ofDefence
RAAF BASE WILLIAMTOWN
NOISE AND FLIGHT PATH MONITORINGSYSTEM
Q1 2010 REPORT
ii
11 Mar 2011 RAAF Base Williamtown – Noise and Flight Path Monitoring SystemQ1 2010 Report File name:WLM NFPMS Q1 2010 Report V2.1a.doc
Disclaimer
This report contains a summary of data collected over the specified period and is intended toconvey the best information available from the NFPMS at the time. The system databases areto some extent dependent upon external sources and errors may occur. All care is taken inpreparation of the report but its complete accuracy cannot be guaranteed. The Departmentof Defence and the NFPMS project contractors do not accept any legal liability for any lossesarising from reliance upon data in this report which may be found to be inaccurate.
The NFPMS does not provide “Aircraft noise levels” as defined in AS2021-2000.

iv
11 Mar 2011 RAAF Base Williamtown – Noise and Flight Path Monitoring SystemQ1 2010 Report File name:WLM NFPMS Q1 2010 Report V2.1a.doc
BLANK PAGE

v
RAAF Base Williamtown – Noise and Flight Path Monitoring System 11 Mar 2011File name: WLM NFPMS Q1 2010 Report V2.1a.doc Q1 2010 Report
RAAF BASE WILLIAMTOWNNoise and Flight Path Monitoring System
Q1 2010 Report
Executive Summary
The Department of Defence has engaged Lochard Pty Ltd to install, maintain and operate anoise and flight path monitoring system at RAAF Base Williamtown, New South Wales.
The objective of the RAAF Base Williamtown Noise and Flight Path Monitoring System(WLM NFPMS) project is to monitor and record flight information and the noise levels ofaircraft operations. The system provides detailed information on aircraft noise events andassists the Department of Defence to communicate details of the flying activities to thecommunity.
During the operational reporting period, 1 January – 31 March 2010, the WLM NFPMSrecorded a total of 7,207 aircraft movements; being 3,260 arrivals, 3,322 departures and 625circuit movements. Of the 7,207 recorded aircraft movements, 31% were by Military FastJets, 1% by Military Other Jets, and 3% by Military Propeller Aircraft. 60% of the recordedaircraft movements were by civil aircraft. Unidentified aircraft accounted for 12% of therecorded aircraft movements. These were mainly light civil aircraft undertaking flying trainingwhen the Air Traffic Control Tower was not staffed.
Runway 12 was the dominant runway accounting for 69% of the aircraft movements.
The aircraft noise exposure levels vary from day to day. Annex C presents the range of noiselevels recorded at the community based NMTs.
During Quarter 1 2010 the logarithmic average of the 24 hour LAeq levels recorded were 58.0dB(A) at the Grahamstown Public School NMT, 46.8 dB(A) at the Salt Ash Public SchoolNMT and 51.0 dB(A) at the Wirreanda Public School NMT.
Similarly the average N70 for all recorded aircraft at the three NMTs varied from 1.66 to13.29, whilst for military operational days the average N70 varied from 2.32 to 14.58.
Further information on aircraft noise is detailed in Chapter 3 – Aircraft Noise.

vi
11 Mar 2011 RAAF Base Williamtown – Noise and Flight Path Monitoring SystemQ1 2010 Report File name:WLM NFPMS Q1 2010 Report V2.1a.doc
BLANK PAGE
vii
RAAF Base Williamtown – Noise and Flight Path Monitoring System 11 Mar 2011File name: WLM NFPMS Q1 2010 Report V2.1a.doc Q1 2010 Report
RAAF Base WilliamtownNoise and Flight Path Monitoring System
Q1 2010 Report
TABLE OF CONTENTS PAGEExecutive Summary v
1. INTRODUCTION 11.1 RAAF Base Williamtown Noise and Flight Path Monitoring System 11.2 RAAF Base Williamtown 11.3 The NFPMS Components 11
2. AIRCRAFT OPERATIONS 152.1 Aircraft Movements 152.2 Aircraft Flight Tracks 20
3. AIRCRAFT NOISE 973.1 Measurement of Aircraft Noise 973.2 Factors Affecting the Propagation of Aircraft Noise 1023.3 Noise Environment at RAAF Base Williamtown 104
ANNEXESA. GlossaryB. Aircraft Movement DetailsC. Community Exposure to Aircraft Noise

viii
11 Mar 2011 RAAF Base Williamtown – Noise and Flight Path Monitoring SystemQ1 2010 Report File name:WLM NFPMS Q1 2010 Report V2.1a.doc
LIST OF FIGURES PAGE
Figure 1 Regional Location Plan 3
Figure 2 Base Environs and Runway Layout 9
Figure 3 WLM NFPMS Components 11
Figure 4 A Community-Based NMT 12
Figure 5 Aircraft Movements by Category 16
Figure 6 Runway Usage 18
Figure 7 Track Density Plot – All Aircraft Movements 20
Figure 8 Aircraft Flight Tracks – All Aircraft 23
Figure 9 Aircraft Flight Tracks – Military Jet Arrivals Runway 12 27
Figure 10 Aircraft Flight Tracks – Military Propeller Arrivals Runways 12 & 30 31
Figure 11 Aircraft Flight Tracks – Civil Jet Arrivals Runway 12 35
Figure 12 Aircraft Flight Tracks – Civil Propeller Arrivals Runway 12 39
Figure 13 Aircraft Flight Tracks – Military Jet Arrivals Runway 30 43
Figure 14 Aircraft Flight Tracks – Civil Jet Arrivals Runway 30 47
Figure 15 Aircraft Flight Tracks – Civil Propeller Arrivals Runway 30 51
Figure 16 Aircraft Flight Tracks – Military Jet Departures Runway 12 55
Figure 17 Aircraft Flight Tracks – Military Propeller Departures Runways 12 & 30 59
Figure 18 Aircraft Flight Tracks – Civil Jet Departures Runway 12 63
Figure 19 Aircraft Flight Tracks – Civil Propeller Departures Runway 12 67
Figure 20 Aircraft Flight Tracks – Military Jet Departures Runway 30 71
Figure 21 Aircraft Flight Tracks – Civil Jet Departures Runway 30 75
Figure 22 Aircraft Flight Tracks – Civil Propeller Departures Runway 30 79
Figure 23 Aircraft Flight Tracks – Military Jet Circuits 83
Figure 24 Aircraft Flight Tracks – Military Propeller Circuits 87
Figure 25 Helicopter Flight Tracks – All Runways 91
Figure 26 Unknown Aircraft Flight Tracks – All Runways 95
Figure 27 NMT Location Plan 105
ix
RAAF Base Williamtown – Noise and Flight Path Monitoring System 11 Mar 2011File name: WLM NFPMS Q1 2010 Report V2.1a.doc Q1 2010 Report
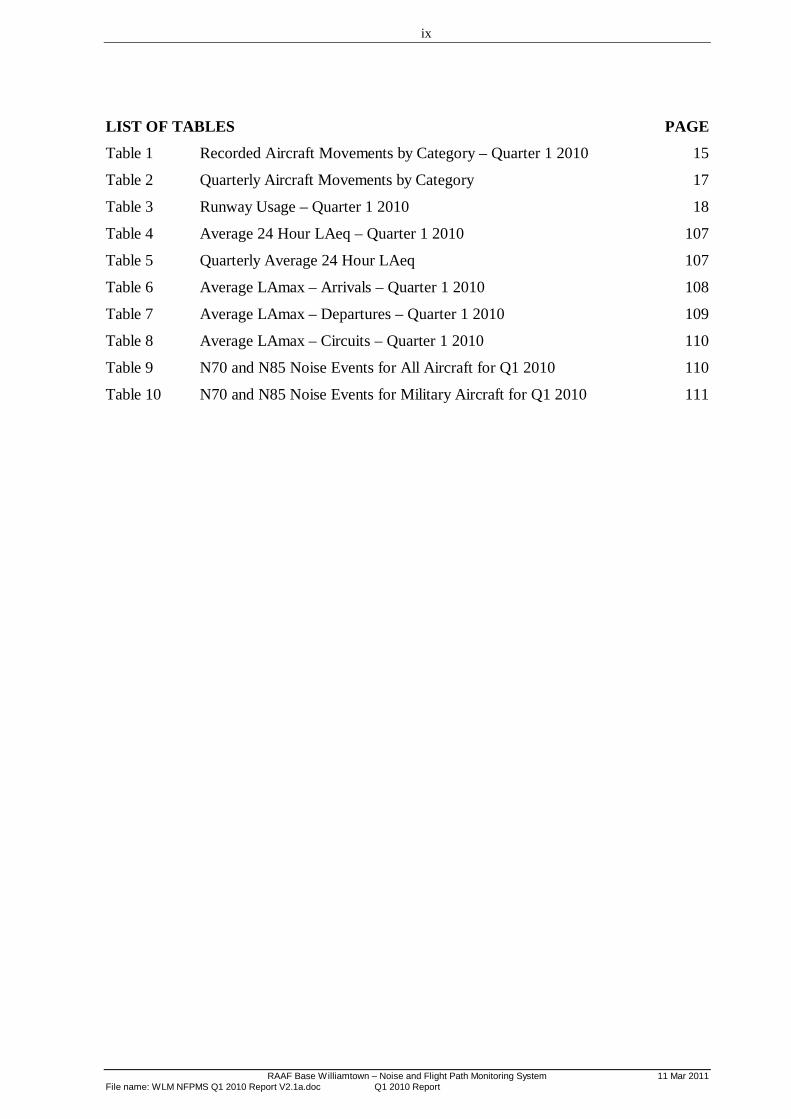
LIST OF TABLES PAGE
Table 1 Recorded Aircraft Movements by Category – Quarter 1 2010 15
Table 2 Quarterly Aircraft Movements by Category 17
Table 3 Runway Usage – Quarter 1 2010 18
Table 4 Average 24 Hour LAeq – Quarter 1 2010 107
Table 5 Quarterly Average 24 Hour LAeq 107
Table 6 Average LAmax – Arrivals – Quarter 1 2010 108
Table 7 Average LAmax – Departures – Quarter 1 2010 109
Table 8 Average LAmax – Circuits – Quarter 1 2010 110
Table 9 N70 and N85 Noise Events for All Aircraft for Q1 2010 110
Table 10 N70 and N85 Noise Events for Military Aircraft for Q1 2010 111

x
11 Mar 2011 RAAF Base Williamtown – Noise and Flight Path Monitoring SystemQ1 2010 Report File name:WLM NFPMS Q1 2010 Report V2.1a.doc
BLANK PAGE
xi
RAAF Base Williamtown – Noise and Flight Path Monitoring System 11 Mar 2011File name: WLM NFPMS Q1 2010 Report V2.1a.doc Q1 2010 Report
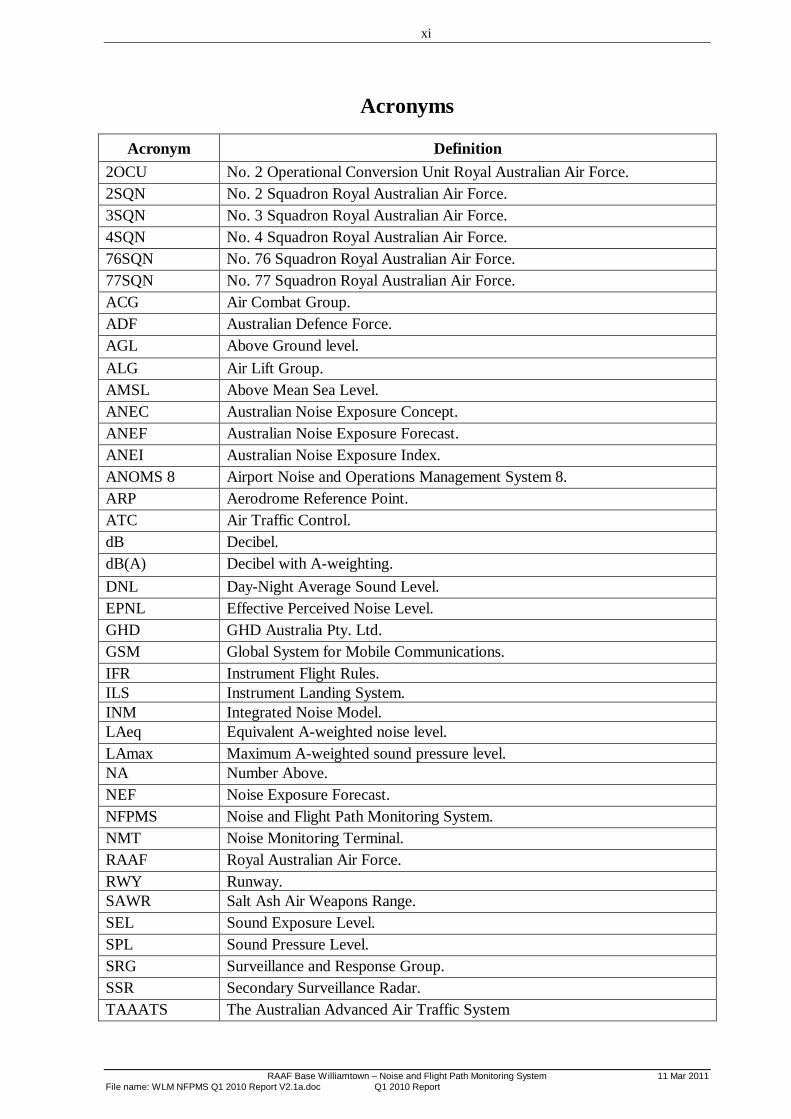
Acronyms
Acronym Definition2OCU No. 2 Operational Conversion Unit Royal Australian Air Force.2SQN No. 2 Squadron Royal Australian Air Force.3SQN No. 3 Squadron Royal Australian Air Force.4SQN No. 4 Squadron Royal Australian Air Force.76SQN No. 76 Squadron Royal Australian Air Force.77SQN No. 77 Squadron Royal Australian Air Force.ACG Air Combat Group.ADF Australian Defence Force.AGL Above Ground level.ALG Air Lift Group.AMSL Above Mean Sea Level.ANEC Australian Noise Exposure Concept.ANEF Australian Noise Exposure Forecast.ANEI Australian Noise Exposure Index.ANOMS 8 Airport Noise and Operations Management System 8.ARP Aerodrome Reference Point.ATC Air Traffic Control.dB Decibel.dB(A) Decibel with A-weighting.DNL Day-Night Average Sound Level.EPNL Effective Perceived Noise Level.GHD GHD Australia Pty. Ltd.GSM Global System for Mobile Communications.IFR Instrument Flight Rules.ILS Instrument Landing System.INM Integrated Noise Model.LAeq Equivalent A-weighted noise level.LAmax Maximum A-weighted sound pressure level.NA Number Above.NEF Noise Exposure Forecast.NFPMS Noise and Flight Path Monitoring System.NMT Noise Monitoring Terminal.RAAF Royal Australian Air Force.RWY Runway.SAWR Salt Ash Air Weapons Range.SEL Sound Exposure Level.SPL Sound Pressure Level.SRG Surveillance and Response Group.SSR Secondary Surveillance Radar.TAAATS The Australian Advanced Air Traffic System

xii
11 Mar 2011 RAAF Base Williamtown – Noise and Flight Path Monitoring SystemQ1 2010 Report File name:WLM NFPMS Q1 2010 Report V2.1a.doc
TACAN TACtical Air Navigation.TAG The Acoustic Group.VPN Virtual Private Network.WLM RAAF Base Williamtown.WLM NFPMS RAAF Base Williamtown Noise and Flight Path Monitoring System.
1
RAAF Base Williamtown – Noise and Flight Path Monitoring System 11 Mar 2011File name: WLM NFPMS Q1 2010 Report V2.1a.doc Q1 2010 Report
1. INTRODUCTION
1.1 RAAF Base Williamtown Noise and Flight Path Monitoring System
1.1.1 The objective of the RAAF Base Williamtown Noise and Flight Path MonitoringSystem (WLM NFPMS) project is to monitor and record flight information and the noise levelsof aircraft operations. The system provides detailed information on aircraft noise events andassists the Department of Defence to communicate details of the flying activities to thecommunity.
1.1.2 In December 2009, the Department of Defence (Defence) engaged Lochard Pty Ltd(Lochard) as the prime contractor to install, maintain and operate a noise and flight pathmonitoring system at RAAF Base Williamtown, New South Wales. Lochard has engagedGHD Australia Pty Ltd (GHD) and The Acoustic Group Pty Ltd (TAG) as sub-consultants toprovide technical services and advice.
1.1.3 This report details the aircraft operations, flight tracks and noise recorded at thecommunity-based Noise Monitoring Terminal (NMT) locations for the period 1 January to 31March 2010. Consistent with the reporting of aircraft noise at other Australian Airports, thereport includes the average 24 hour LAeq and LAmax values. The N70 and N85 average dailyvalues are also reported.
1.2 RAAF Base Williamtown
Location
1.2.1 RAAF Base Williamtown is located approximately 15 km north of Newcastle on theNSW Central Coast, and is part of the Port Stephens Council Local Government Area. Asillustrated in Figure 1 – Regional Location Plan, the Base is bounded by Nelson Bay Road tothe south-east, Medowie Road to the east and Hunter Water Corporation land to the north andwest. The Base property encompasses an area of approximately 800 ha with a perimeter ofapproximately 15 km. The township of Raymond Terrace is located on the extended centrelineof the runway, and a number of other residential suburbs are located in the close vicinity of thebase including Medowie and Salt Ash.
1.2.2 The Salt Ash Air Weapons Range (SAWR) is located approximately 6 km to thenorth-east of the Base and is used for air-surface gunnery and bombing practice. SAWR coversan area of 2,800 ha with a perimeter of approximately 32 km and is bounded by Moffats Road,Old Swan Bay Road, Boundary Road and the Medowie State Forest.

2
11 Mar 2011 RAAF Base Williamtown – Noise and Flight Path Monitoring SystemQ1 2010 Report File name:WLM NFPMS Q1 2010 Report V2.1a.doc
Use and Activity
1.2.3 RAAF Base Williamtown is the home base for the tactical fighter element of the AirCombat Group (ACG) and the airborne early warning and control element of Surveillance andReconnaissance Group (SRG). The following squadrons are based at RAAF BaseWilliamtown:
a. No. 3 Squadron (3SQN) operating F/A-18 Hornet aircraft,
b. No. 77 Squadron (77SQN) operating F/A-18 Hornet aircraft,
c. No. 2 Operational Conversion Unit (2OCU) operating F/A-18 Hornetaircraft,
d. No. 76 Squadron (76SQN) operating Hawk Mk127 aircraft,
e. No. 4 Squadron (4SQN) operating PC-9A Forward Air Control aircraft, and
f. No. 2 Squadron (2SQN) operating B737 AEW&C Wedgetail aircraft.
1.2.4 RAAF Base Williamtown is staffed by over 3,500 personnel, including ADF members,civilian Defence employees and civilian contractors. RAAF Base Williamtown contributes5,906 direct and indirect jobs and $401.6 million to the NSW economy (SGS EconomicPlanning, June 2008, The Economic Contribution of Five Defence Air Bases).

3
RAAF Base Williamtown – Noise and Flight Path Monitoring System 11 Mar 2011File name: WLM NFPMS Q1 2010 Report V2.1a.doc Q1 2010 Report
INSERT FIGURE 1 (REGIONAL LOCATION PLAN)

4
11 Mar 2011 RAAF Base Williamtown – Noise and Flight Path Monitoring SystemQ1 2010 Report File name:WLM NFPMS Q1 2010 Report V2.1a.doc
BLANK PAGE
5
RAAF Base Williamtown – Noise and Flight Path Monitoring System 11 Mar 2011File name: WLM NFPMS Q1 2010 Report V2.1a.doc Q1 2010 Report
1.2.5 RAAF Base Williamtown also supports operations by Military Aircraft from otherBases. Visiting Military Aircraft to RAAF Base Williamtown may include the following:
a. F/A-18F Australian Super Hornet (ASH),
b. F-111,
c. AP-3C Orion,
d. C-130 Hercules,
e. Challenger CL-604,
f. BBJ (Boeing Business Jet),
g. Beechcraft King Air 350,
h. Blackhawk Helicopter, and
i. MRH-90 Multi Role Helicopter.
1.2.6 Details on the above aircraft are available on the Defence website(www.defence.gov.au).
1.2.7 The Base also supports periodic short term deployments by overseas military forces.
1.2.8 As well as the military aircraft operations at RAAF Base Williamtown, civil aircraftoperate from Newcastle Airport terminal on the south-western side of the base. In 1947, theFederal Government agreed to allow civilian flight operations at the RAAF Base Williamtown.The Federal Government continued to run the airport until 1990 when Newcastle City Counciland Port Stephens Council accepted an invitation by the Federal Government to jointly operatethe civil area at RAAF Base Williamtown. Newcastle Airport Limited, was formed on 25 May1993 by the two Councils and a 30-year lease was signed with the Federal Government for 28hectares including the site of the terminal and land for commercial development. In 2005 thelease was extended until 2045. (Newcastle Airport Master Plan 2007)
1.2.9 Currently Newcastle Airport is serviced by six airlines: Aeropelican, Brindabella,Jetstar, Norfolk Air, Virgin Blue and QantasLink. These airlines operate services to Brisbane,Canberra, Coffs Harbour, Gold Coast, Inverell, Melbourne, Norfolk Island, Port Macquarieand Sydney. Newcastle Airport’s annual passenger throughput has grown from 214,000 in2003 in excess of 1,124,000 in 2009/2010. (Newcastle Airport Annual Report 2009/2010)
6
11 Mar 2011 RAAF Base Williamtown – Noise and Flight Path Monitoring SystemQ1 2010 Report File name:WLM NFPMS Q1 2010 Report V2.1a.doc
1.2.10 The aircraft movements in this report are categorised as follows:
a. Military Jet,
(i) Military Fast Jet,
(ii) Military Other Jet,
b. Military Propeller,
c. Military Helicopter,
d. Civil Jet,
(i) Civil Heavy Jet,
(ii) Civil Medium Jet,
(iii) Civil Business Jet,
e. Civil Propeller,
(i) Civil Commuter Propeller,
(ii) Civil Light Propeller,
f. Civil Helicopters, and
g. Unknown.
1.2.11 The unknown aircraft movements are those which occur when no record of the detailsof the aircraft type is recorded, although the NFPMS records the flight track and associatedaircraft noise.
7
RAAF Base Williamtown – Noise and Flight Path Monitoring System 11 Mar 2011File name: WLM NFPMS Q1 2010 Report V2.1a.doc Q1 2010 Report
Future Uses and Activities
1.2.12 In the near future the F/A-18 Hornet will be gradually phased out of service andreplaced with the F-35A Joint Strike Fighter (JSF). The JSF aircraft is currently underdevelopment and is due for staged introduction over the next decade. It is acknowledged thatthe Defence White Paper 2009 confirms around 100 JSF will be purchased. The majority ofthese will be based at RAAF Base Williamtown. The B-737 Airborne Early Warning andControl (AEW&C) “Wedgetail” aircraft operated by 2SQN have only recently been introducedinto service and are expected to remain at RAAF Base Williamtown into the long-term. TheHawk Lead-in-fighter is programmed to be operated until around 2028. It is not known at thistime if the aircraft is to be replaced. The number of PC-9/A aircraft operated by 4SQN isplanned to be increased from 4 to 6.
1.2.13 The number of civil aircraft movements at Newcastle Airport is anticipated toincrease in line with the projected growth in passenger numbers identified in the NewcastleAirport Master Plan.
8
11 Mar 2011 RAAF Base Williamtown – Noise and Flight Path Monitoring SystemQ1 2010 Report File name:WLM NFPMS Q1 2010 Report V2.1a.doc
Runway Layout
1.2.14 Figure 2 – Base Environs and Runway Layout illustrates the orientation of the runwayin relation to the surrounding environs. The use of each runway direction is dependent on thewind direction at the time and other operational considerations. When Runway 12 is used,aircraft will approach from the north-west and depart to the south-east. Similarly whenRunway 30 is used, aircraft will approach from the south-east and depart to the north-west.
1.2.15 Figure 2 also illustrates the orientation of the runway in relation to the surroundingenvirons. RAAF Base Williamtown has a single runway orientated in the 118° / 298° magneticdirection. Runway 12/30 is 2,438 metres long and 45 metres wide.
1.2.16 The Base is located at 31 feet (9 metres) Above Mean Sea Level (AMSL).

9
RAAF Base Williamtown – Noise and Flight Path Monitoring System 11 Mar 2011File name: WLM NFPMS Q1 2010 Report V2.1a.doc Q1 2010 Report
INSERT FIGURE 2 (BASE ENVIRONS AND RUNWAY LAYOUT )

10
11 Mar 2011 RAAF Base Williamtown – Noise and Flight Path Monitoring SystemQ1 2010 Report File name:WLM NFPMS Q1 2010 Report V2.1a.doc
BLANK PAGE
11
RAAF Base Williamtown – Noise and Flight Path Monitoring System 11 Mar 2011File name: WLM NFPMS Q1 2010 Report V2.1a.doc Q1 2010 Report
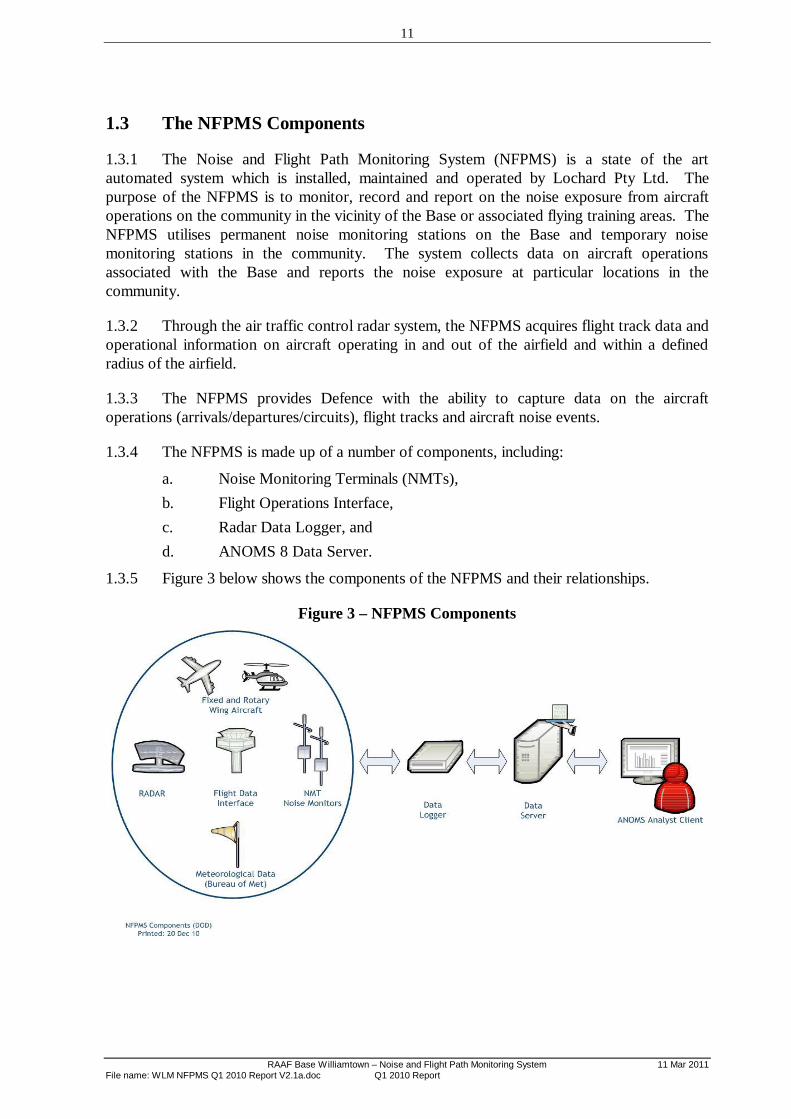
1.3 The NFPMS Components
1.3.1 The Noise and Flight Path Monitoring System (NFPMS) is a state of the artautomated system which is installed, maintained and operated by Lochard Pty Ltd. Thepurpose of the NFPMS is to monitor, record and report on the noise exposure from aircraftoperations on the community in the vicinity of the Base or associated flying training areas. TheNFPMS utilises permanent noise monitoring stations on the Base and temporary noisemonitoring stations in the community. The system collects data on aircraft operationsassociated with the Base and reports the noise exposure at particular locations in thecommunity.
1.3.2 Through the air traffic control radar system, the NFPMS acquires flight track data andoperational information on aircraft operating in and out of the airfield and within a definedradius of the airfield.
1.3.3 The NFPMS provides Defence with the ability to capture data on the aircraftoperations (arrivals/departures/circuits), flight tracks and aircraft noise events.
1.3.4 The NFPMS is made up of a number of components, including:
a. Noise Monitoring Terminals (NMTs),b. Flight Operations Interface,c. Radar Data Logger, andd. ANOMS 8 Data Server.
1.3.5 Figure 3 below shows the components of the NFPMS and their relationships.
Figure 3 – NFPMS Components
12
11 Mar 2011 RAAF Base Williamtown – Noise and Flight Path Monitoring SystemQ1 2010 Report File name:WLM NFPMS Q1 2010 Report V2.1a.doc
Noise Monitoring Terminals
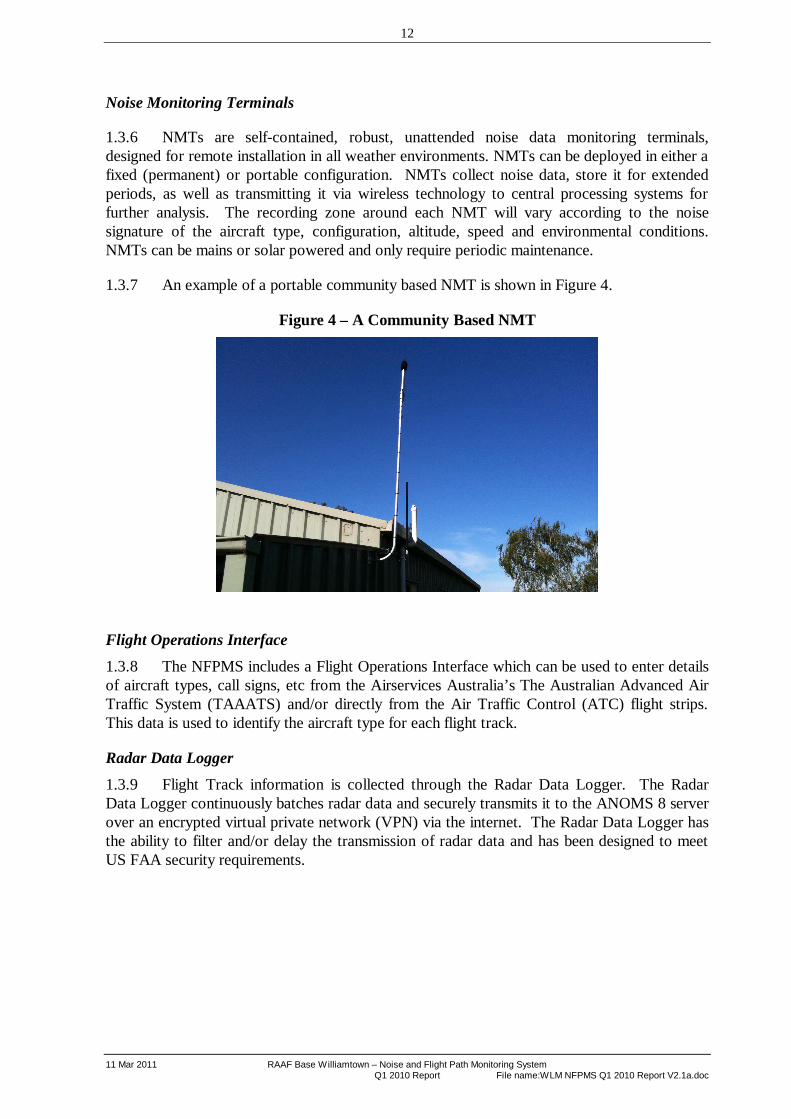
1.3.6 NMTs are self-contained, robust, unattended noise data monitoring terminals,designed for remote installation in all weather environments. NMTs can be deployed in either afixed (permanent) or portable configuration. NMTs collect noise data, store it for extendedperiods, as well as transmitting it via wireless technology to central processing systems forfurther analysis. The recording zone around each NMT will vary according to the noisesignature of the aircraft type, configuration, altitude, speed and environmental conditions.NMTs can be mains or solar powered and only require periodic maintenance.
1.3.7 An example of a portable community based NMT is shown in Figure 4.
Figure 4 – A Community Based NMT
Flight Operations Interface
1.3.8 The NFPMS includes a Flight Operations Interface which can be used to enter detailsof aircraft types, call signs, etc from the Airservices Australia’s The Australian Advanced AirTraffic System (TAAATS) and/or directly from the Air Traffic Control (ATC) flight strips.This data is used to identify the aircraft type for each flight track.
Radar Data Logger
1.3.9 Flight Track information is collected through the Radar Data Logger. The RadarData Logger continuously batches radar data and securely transmits it to the ANOMS 8 serverover an encrypted virtual private network (VPN) via the internet. The Radar Data Logger hasthe ability to filter and/or delay the transmission of radar data and has been designed to meetUS FAA security requirements.
13
RAAF Base Williamtown – Noise and Flight Path Monitoring System 11 Mar 2011File name: WLM NFPMS Q1 2010 Report V2.1a.doc Q1 2010 Report
ANOMS 8
1.3.10 ANOMS 8 is the heart of NFPMS. ANOMS 8 supports and integrates a range ofdata sources, including the NMTs noise data, radar plots and aircraft movement data to createa comprehensive view of airfield operations and the noise environment. ANOMS 8 allows theoperator to comprehensively analyse the recorded aircraft noise events, generate standardreports and present that data. ANOMS 8 complies with the specifications set out in ICAOAnnex 16 and complies with all international aircraft noise measurement standards.
Limitations of the NFPMS
1.3.11 As with any remote monitoring system, the NFPMS has some limitations.
1.3.12 A fundamental issue in terms of the identification of an aircraft noise event is thecorrelation of the noise event recorded by the NMT to an aircraft movement. There are manynoise events which occur on a daily basis at NMT locations in the community which are notassociated with an aircraft movement. Adjacent motor vehicle movements and bird calls cangive rise to noise levels similar to or greater than aircraft operations. As the intent of theNFPMS is to report on the noise contribution of aircraft operations, it is important that noiseevents are correctly correlated to aircraft movements.
1.3.13 During periods of maintenance or power outage at the NMT, no noise events arerecorded.
1.3.14 Atmospheric conditions such as temperature inversion or high wind conditions canaffect the propagation of the aircraft noise so that the noise level at the NMT is reduced to alevel where it may not be correlated to an aircraft movement.
1.3.15 The flight tracks are collected from radar plots from the Secondary SurveillanceRadar (SSR). The SSR picks up the position of the aircraft by the transponder beacontransmitted by the aircraft. Some aircraft will have their transponders switched off in whichcase the aircraft is not detected by the SSR, resulting in no record of the aircraft movement orflight track being collected. In other cases, the transponder may be switched off or moved tothe standby mode during flight, or the aircraft may turn so that the transponder faces awayfrom the radar, resulting in the flight track seemingly to suddenly end.
1.3.16 In some cases, the flight tracks do not connect exactly on to the runway threshold duethe rotation of the radar head and the height of the radar above the airfield often missing somesegments of the flight track.
1.3.17 Military operations include multiple aircraft formations with as many as four aircraftin a formation. Only the lead aircraft in a formation will have its transponder turned onresulting in only one aircraft noise event being detected. The formation flying will lead to anunderestimate of the total aircraft movements being reported by the NFPMS.
1.3.18 During periods of radar outage, due to power failure or maintenance, there are norecords of aircraft movements.

14
11 Mar 2011 RAAF Base Williamtown – Noise and Flight Path Monitoring SystemQ1 2010 Report File name:WLM NFPMS Q1 2010 Report V2.1a.doc
BLANK PAGE
15
RAAF Base Williamtown – Noise and Flight Path Monitoring System 11 Mar 2011File name: WLM NFPMS Q1 2010 Report V2.1a.doc Q1 2010 Report
2. AIRCRAFT OPERATIONS
2.1 Aircraft Movements
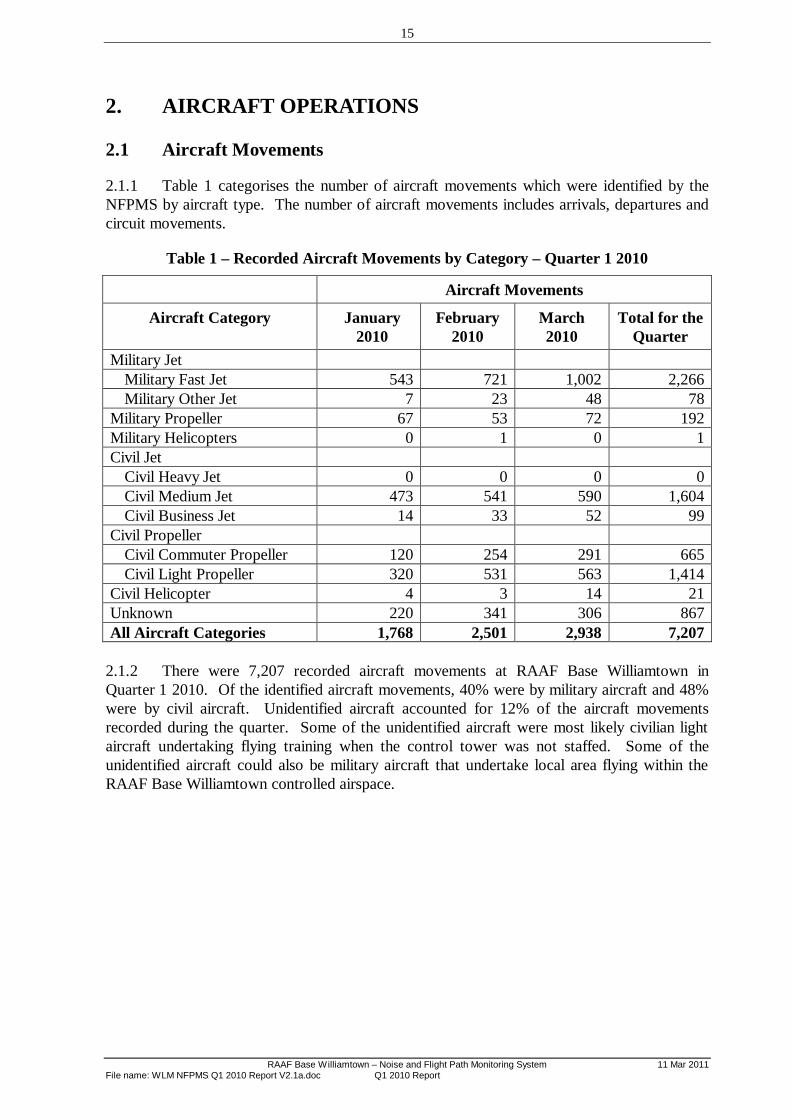
2.1.1 Table 1 categorises the number of aircraft movements which were identified by theNFPMS by aircraft type. The number of aircraft movements includes arrivals, departures andcircuit movements.
Table 1 – Recorded Aircraft Movements by Category – Quarter 1 2010
Aircraft Movements
Aircraft Category January2010
February2010
March2010
Total for theQuarter
Military JetMilitary Fast Jet 543 721 1,002 2,266Military Other Jet 7 23 48 78
Military Propeller 67 53 72 192Military Helicopters 0 1 0 1Civil Jet
Civil Heavy Jet 0 0 0 0Civil Medium Jet 473 541 590 1,604Civil Business Jet 14 33 52 99
Civil PropellerCivil Commuter Propeller 120 254 291 665Civil Light Propeller 320 531 563 1,414
Civil Helicopter 4 3 14 21Unknown 220 341 306 867All Aircraft Categories 1,768 2,501 2,938 7,207
2.1.2 There were 7,207 recorded aircraft movements at RAAF Base Williamtown inQuarter 1 2010. Of the identified aircraft movements, 40% were by military aircraft and 48%were by civil aircraft. Unidentified aircraft accounted for 12% of the aircraft movementsrecorded during the quarter. Some of the unidentified aircraft were most likely civilian lightaircraft undertaking flying training when the control tower was not staffed. Some of theunidentified aircraft could also be military aircraft that undertake local area flying within theRAAF Base Williamtown controlled airspace.

16
11 Mar 2011 RAAF Base Williamtown – Noise and Flight Path Monitoring SystemQ1 2010 Report File name:WLM NFPMS Q1 2010 Report V2.1a.doc
2.1.3 Figure 5 illustrates the aircraft movements by Category for Quarter 1 2010. Adetailed breakdown of movements by aircraft types can be found in Annex B – AircraftMovement Details.
Figure 5 – Aircraft Movements by Category – Quarter 1 2010
29%
0%12%
3% 24%
31%
1%
0%Miltary Fast Jet
Other Military Jet
Military Propeller
Military Helicopter
Civil Jet
Civil Propeller
Civil Helicopter
Unknown
17
RAAF Base Williamtown – Noise and Flight Path Monitoring System 11 Mar 2011File name: WLM NFPMS Q1 2010 Report V2.1a.doc Q1 2010 Report
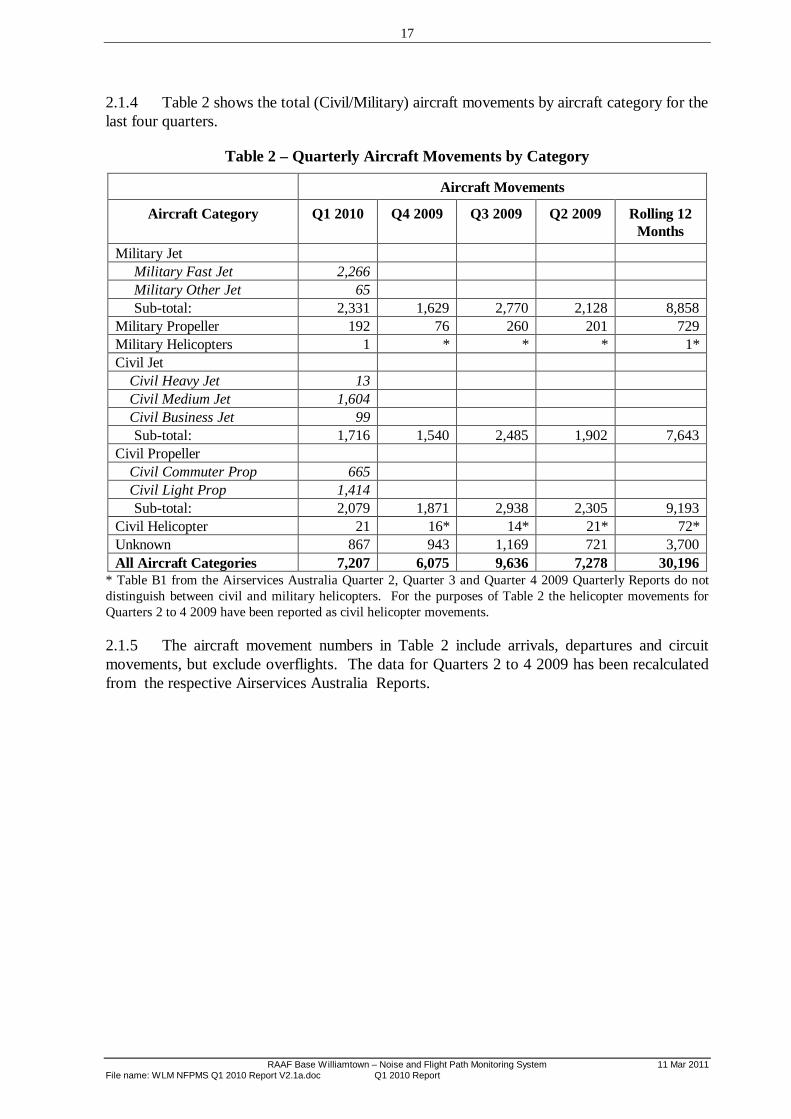
2.1.4 Table 2 shows the total (Civil/Military) aircraft movements by aircraft category for thelast four quarters.
Table 2 – Quarterly Aircraft Movements by Category
Aircraft Movements
Aircraft Category Q1 2010 Q4 2009 Q3 2009 Q2 2009 Rolling 12Months
Military JetMilitary Fast Jet 2,266Military Other Jet 65Sub-total: 2,331 1,629 2,770 2,128 8,858
Military Propeller 192 76 260 201 729Military Helicopters 1 * * * 1*Civil Jet
Civil Heavy Jet 13Civil Medium Jet 1,604Civil Business Jet 99Sub-total: 1,716 1,540 2,485 1,902 7,643
Civil PropellerCivil Commuter Prop 665Civil Light Prop 1,414Sub-total: 2,079 1,871 2,938 2,305 9,193
Civil Helicopter 21 16* 14* 21* 72*Unknown 867 943 1,169 721 3,700All Aircraft Categories 7,207 6,075 9,636 7,278 30,196
* Table B1 from the Airservices Australia Quarter 2, Quarter 3 and Quarter 4 2009 Quarterly Reports do notdistinguish between civil and military helicopters. For the purposes of Table 2 the helicopter movements forQuarters 2 to 4 2009 have been reported as civil helicopter movements.
2.1.5 The aircraft movement numbers in Table 2 include arrivals, departures and circuitmovements, but exclude overflights. The data for Quarters 2 to 4 2009 has been recalculatedfrom the respective Airservices Australia Reports.
18
11 Mar 2011 RAAF Base Williamtown – Noise and Flight Path Monitoring SystemQ1 2010 Report File name:WLM NFPMS Q1 2010 Report V2.1a.doc
Runway usage
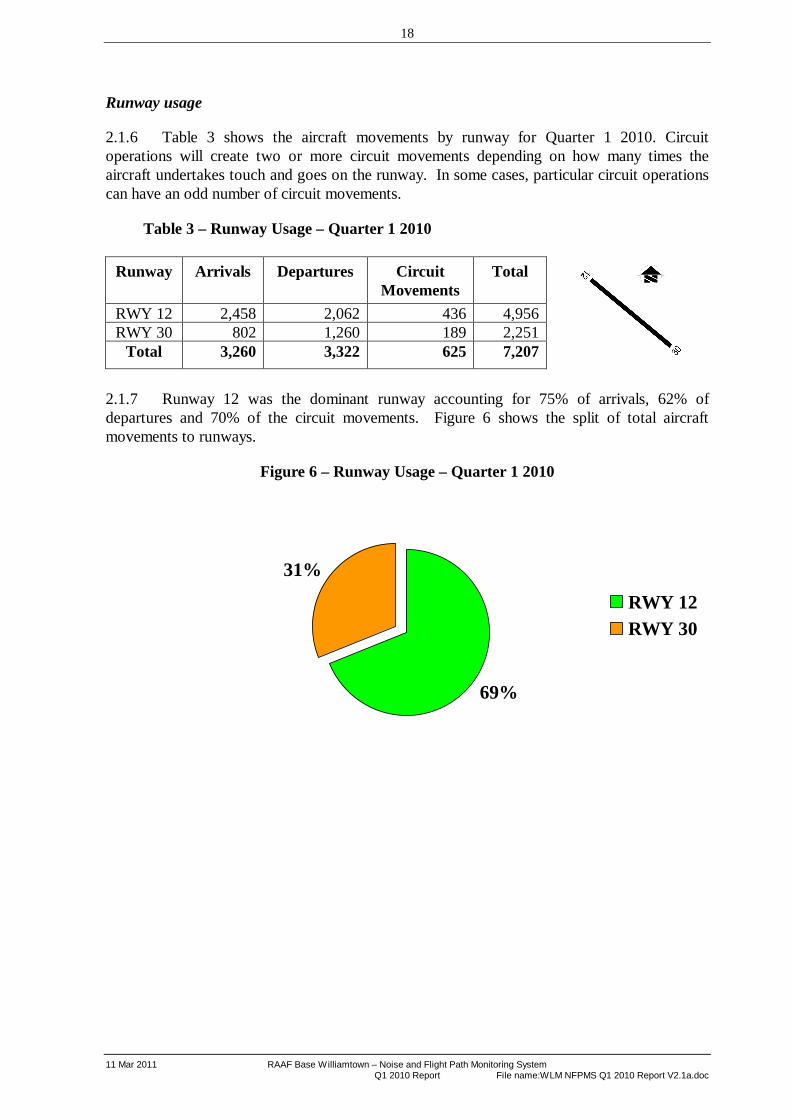
2.1.6 Table 3 shows the aircraft movements by runway for Quarter 1 2010. Circuitoperations will create two or more circuit movements depending on how many times theaircraft undertakes touch and goes on the runway. In some cases, particular circuit operationscan have an odd number of circuit movements.
Table 3 – Runway Usage – Quarter 1 2010
2.1.7 Runway 12 was the dominant runway accounting for 75% of arrivals, 62% ofdepartures and 70% of the circuit movements. Figure 6 shows the split of total aircraftmovements to runways.
Figure 6 – Runway Usage – Quarter 1 2010
69%
31%
RWY 12RWY 30
Runway Arrivals Departures CircuitMovements
Total
RWY 12 2,458 2,062 436 4,956RWY 30 802 1,260 189 2,251
Total 3,260 3,322 625 7,207

19
RAAF Base Williamtown – Noise and Flight Path Monitoring System 11 Mar 2011File name: WLM NFPMS Q1 2010 Report V2.1a.doc Q1 2010 Report
INTENTIONALLY LEFT BLANK

20
11 Mar 2011 RAAF Base Williamtown – Noise and Flight Path Monitoring SystemQ1 2010 Report File name:WLM NFPMS Q1 2010 Report V2.1a.doc
2.2 Aircraft Flight Tracks
Aircraft Flight Track Density Plot
2.2.1 The track density plots are maps of the surrounds of the Base which show the patternof the aircraft flight tracks. The system analyses the number of aircraft movements which passover a grid 18 metres by 18 metres. As the density of aircraft flight tracks increase the colourof the flight tracks changes.
2.2.2 All Aircraft Movements. Figure 7 – Track Density Plot – All Aircraft Movementsshows the track density plot for all recorded aircraft movements for all runways at RAAF BaseWilliamtown. The track density plot shows the dominance of aircraft arrivals using theinstrument approach (ILS and TACAN) to Runway 12. The track density plot shows thecircuit pattern on the south-western side of the runway used by the military fast jets during theinitial and pitch arrival and circuits.
Figure 7 – Track Density Plot - All Aircraft Movements – Quarter 1 2010

21
RAAF Base Williamtown – Noise and Flight Path Monitoring System 11 Mar 2011File name: WLM NFPMS Q1 2010 Report V2.1a.doc Q1 2010 Report
Aircraft Flight Tracks Plots
2.2.3 Figure 8 – Aircraft Flight Tracks – All Aircraft shows the flight track plots for allrecorded aircraft (civil and military) movements at RAAF Base Williamtown for the Quarter 12010. Arrivals are depicted with red flight tracks, departures with blue flight tracks andcircuits with green flight tracks.
2.2.4 Figure 8 illustrates the pattern of circuits on the south-western side of the runwaypredominately flown by military fast jets such as the F/A-18 Hornet and the Hawk. Straight-invisual and instrument arrival flight tracks can be seen to the north-west of the threshold ofRunway 12 and south-east the threshold of Runway 30. The predominate departure flighttracks to the west, south-west, south-east, north and north-west can also be seen in Figure 8.Figure 8 also illustrates the pattern of aircraft undertaking air-to-ground training at SAWR.
2.2.5 The flight tracks are collected from radar plots from the Secondary SurveillanceRadar (SSR). The SSR picks up the position of the aircraft by the transponder beacontransmitted by the aircraft. Some aircraft will have their transponders switched off in whichcase the aircraft is not detected by the SSR resulting in no record of the aircraft movement orflight track being collected. In other cases, the transponder may be switched off or moved tothe standby mode during flight, resulting in the flight track appearing to end suddenly.
2.2.6 In some cases, the flight tracks do not connect exactly on to the runway threshold duethe rotation of the radar head. Also, due to the location and the height of the radar above theairfield often missing some segments of the flight track.

22
11 Mar 2011 RAAF Base Williamtown – Noise and Flight Path Monitoring SystemQ1 2010 Report File name:WLM NFPMS Q1 2010 Report V2.1a.doc
BLANK PAGE
23
RAAF Base Williamtown – Noise and Flight Path Monitoring System 11 Mar 2011File name: WLM NFPMS Q1 2010 Report V2.1a.doc Q1 2010 Report
INSERT FIGURE 8 (ALL AIRCRAFT FLIGHT TRACKS)

24
11 Mar 2011 RAAF Base Williamtown – Noise and Flight Path Monitoring SystemQ1 2010 Report File name:WLM NFPMS Q1 2010 Report V2.1a.doc
BLANK PAGE
25
RAAF Base Williamtown – Noise and Flight Path Monitoring System 11 Mar 2011File name: WLM NFPMS Q1 2010 Report V2.1a.doc Q1 2010 Report
Aircraft Arrival Flight Tracks
2.2.7 Aircraft arrival flight track plots to Runway 12 and Runway 30 are shown in thefollowing figures:
a. Figure 9 – Aircraft Flight Tracks – Military Jet Arrivals Runway 12,
b. Figure 10 – Aircraft Flight Tracks – Military Propeller Arrivals Runways 12& 30,
c. Figure 11 – Aircraft Flight Tracks – Civil Jet Arrivals Runway 12,
d. Figure 12 – Aircraft Flight Tracks – Civil Propeller Arrivals Runway 12,
e. Figure 13 – Aircraft Flight Tracks – Military Jet Arrivals Runway 30,
f. Figure 14 – Aircraft Flight Tracks – Civil Jet Arrivals Runway 30, and
g. Figure 15 – Aircraft Flight Tracks – Civil Propeller Arrivals Runway 30.
2.2.8 The flight tracks have been colour coded according to the altitude of the aircraft infeet Above Mean Sea Level (AMSL) as the aircraft arrives at the airfield. Red designates analtitude of the aircraft up to 500 feet, orange for an altitude between 500 and 1,000 feet,yellow for an altitude between 1,000 and 2,500 feet and light green for an altitude above 2,500feet. RAAF Base Williamtown is 31 feet AMSL. These plots of the flight tracks have beengenerated from the aircraft movement data recorded during the Quarter 1 2010 reportingperiod.
2.2.9 Refer to Annex B – Aircraft Movement Details, Table B2 – Aircraft Types Arrivalsfor details of the aircraft arrival movements.
26
11 Mar 2011 RAAF Base Williamtown – Noise and Flight Path Monitoring SystemQ1 2010 Report File name:WLM NFPMS Q1 2010 Report V2.1a.doc
2.2.10 Military Jet Arrivals to Runway 12. Figure 9 – Aircraft Flight Tracks – MilitaryJet Arrivals Runway 12 shows the flight track plots for all recorded military jet arrivals toRunway 12 at RAAF Base Williamtown. The flight track plot shows the general shape of thearrival tracks to Runway 12. These include initial and pitch arrivals, straight-in arrivals, ILSarrivals and TACAN arrivals.
2.2.11 Figure 9 shows straight-in, ILS and TACAN arrivals from the north west of RAAFBase Williamtown over Brandy Hill, Nelsons Plains, Raymond Terrace and the southern end ofGrahamstown Dam.
2.2.12 Figure 9 shows the initial and pitch arrivals flight track curving over the northern halfof Raymond Terrace (also known as Kings Hill) before arriving through the initial point at thesouthern end of Grahamstown Dam and joining the circuit pattern on the south-western side ofthe runway.
2.2.13 Figure 9 shows the initial and pitch arrivals that originate from the east over theocean, track along Stockton Beach at low level before turning north-west over Stockton, FernBay, then flying over Tomago, Heatherbrae, Millers Forest and Raymond Terrace beforearriving through the initial point at the southern end of Grahamstown Dam and joining thecircuit pattern on the south-western side of the runway.
2.2.14 Figure 9 also shows the flight tracks of military jets using SAWR before arriving backat RAAF Base Williamtown.
2.2.15 The vast majority of the military jet arrivals to Runway 12 were by military fast jetssuch as the F/A-18 Hornet and the Hawk. There are a limited number of arrivals to Runway12 by other military jets such as Boeing B737 BBJ, Challenger CL-604, Boeing B737AEW&C and the C-17A Globemaster III.

27
RAAF Base Williamtown – Noise and Flight Path Monitoring System 11 Mar 2011File name: WLM NFPMS Q1 2010 Report V2.1a.doc Q1 2010 Report
INSERT FIGURE 9 (FLIGHT TRACKS FOR MILITARY JET ARRIVALS TO RUNWAY12)

28
11 Mar 2011 RAAF Base Williamtown – Noise and Flight Path Monitoring SystemQ1 2010 Report File name:WLM NFPMS Q1 2010 Report V2.1a.doc
BLANK PAGE

29
RAAF Base Williamtown – Noise and Flight Path Monitoring System 11 Mar 2011File name: WLM NFPMS Q1 2010 Report V2.1a.doc Q1 2010 Report
INTENTIONALLY LEFT BLANK
30
11 Mar 2011 RAAF Base Williamtown – Noise and Flight Path Monitoring SystemQ1 2010 Report File name:WLM NFPMS Q1 2010 Report V2.1a.doc
2.2.16 Military Propeller Arrivals to Runway 12 and 30. Figure 10 – Aircraft FlightTracks – Military Propeller Arrivals Runway 12 & 30 shows the recorded flight track plots formilitary propeller arrivals to Runway 12 and Runway 30 at RAAF Base Williamtown. Theflight track plot shows the general shape of the arrival tracks to Runways 12 and 30. Theseinclude straight-in arrivals and ILS arrivals.
2.2.17 Figure 10 shows straight-in arrivals on Runway 12 from the north west of RAAFBase Williamtown over Brandy Hill, Nelsons Plains, Raymond Terrace and the southern end ofGrahamstown Dam.
2.2.18 Figure 10 shows a limited number of initial and pitch arrivals flight track curving overthe northern half of Raymond Terrace (also known as Kings Hill) before arriving through theinitial point at the southern end of Grahamstown Dam, joining the circuit pattern on the south-western side of the runway and arriving on Runway 12.
2.2.19 Figure 10 also shows a visual arrival from the north-west that follow the ILS flighttrack before turn to the south-east joining the downwind leg of the circuit over Williamtownand then arriving on Runway 30.
31
RAAF Base Williamtown – Noise and Flight Path Monitoring System 11 Mar 2011File name: WLM NFPMS Q1 2010 Report V2.1a.doc Q1 2010 Report
INSERT FIGURE 10 (FLIGHT TRACKS FOR MILITARY PROPELLER ARRIVALS TORUNWAYS 12 & 30)

32
11 Mar 2011 RAAF Base Williamtown – Noise and Flight Path Monitoring SystemQ1 2010 Report File name:WLM NFPMS Q1 2010 Report V2.1a.doc
BLANK PAGE

33
RAAF Base Williamtown – Noise and Flight Path Monitoring System 11 Mar 2011File name: WLM NFPMS Q1 2010 Report V2.1a.doc Q1 2010 Report
INTENTIONALLY LEFT BLANK

34
11 Mar 2011 RAAF Base Williamtown – Noise and Flight Path Monitoring SystemQ1 2010 Report File name:WLM NFPMS Q1 2010 Report V2.1a.doc
2.2.20 Civil Jet Arrivals to Runway 12. Figure 11 – Aircraft Flight Tracks – Civil JetArrivals Runway 12 shows the recorded flight track plots for civil jet arrivals to Runway 12 atRAAF Base Williamtown. The flight track plot shows the general shape of the arrival tracks toRunway 12. These include visual circuit arrivals, straight-in arrivals and ILS arrivals.
2.2.21 Figure 11 shows arrivals from the north west of RAAF Base Williamtown overBrandy Hill, Nelsons Plains, Raymond Terrace and the southern end of Grahamstown Dam.
2.2.22 Figure 11 shows civil jet aircraft flight tracks from the north over the northern part ofRaymond Terrace (also known as Kings Hill) joining the straight-in arrival flight track.
2.2.23 Figure 11 shows a majority of the civil jet aircraft flight tracks arrive from the southbefore joining the downwind leg of the circuit over Fullerton Cove, flying over Heatherbraeand Raymond Terrace before landing on Runway 12.
2.2.24 Figure 11 also shows a limited number of civil jet aircraft flight tracks arriving fromthe south overfly RAAF Base Williamtown before turning to the west over Campvale,Medowie and Grahamstown Dam to land on Runway 12.
35
RAAF Base Williamtown – Noise and Flight Path Monitoring System 11 Mar 2011File name: WLM NFPMS Q1 2010 Report V2.1a.doc Q1 2010 Report
INSERT FIGURE 11 (FLIGHT TRACKS FOR CIVIL JET ARRIVALS TO RUNWAY 12)

36
11 Mar 2011 RAAF Base Williamtown – Noise and Flight Path Monitoring SystemQ1 2010 Report File name:WLM NFPMS Q1 2010 Report V2.1a.doc
BLANK PAGE

37
RAAF Base Williamtown – Noise and Flight Path Monitoring System 11 Mar 2011File name: WLM NFPMS Q1 2010 Report V2.1a.doc Q1 2010 Report
INTENTIONALLY LEFT BLANK
38
11 Mar 2011 RAAF Base Williamtown – Noise and Flight Path Monitoring SystemQ1 2010 Report File name:WLM NFPMS Q1 2010 Report V2.1a.doc
2.2.25 Civil Propeller Arrivals to Runway 12. Figure 12 – Aircraft Flight Tracks – CivilPropeller Arrivals Runway 12 shows the recorded flight track plots for civil propeller arrivalsto Runway 12 at RAAF Base Williamtown. The flight track plot shows the general shape ofthe arrival tracks to Runway 12. These include visual circuit arrivals, straight-in arrivals andILS arrivals.
2.2.26 Figure 12 shows straight-in and ILS arrivals from the north west of RAAF BaseWilliamtown over Brandy Hill, Nelsons Plains, Raymond Terrace and the southern end ofGrahamstown Dam.
2.2.27 Figure 12 shows civil propeller aircraft flight tracks arriving from the north over thenorthern part of Raymond Terrace (also known as Kings Hill) and Grahamstown Dam beforejoining the straight-in arrival flight track.
2.2.28 Figure 12 shows civil propeller aircraft flight tracks arriving from the south beforejoining the downwind leg of the circuit over Fullerton Cove, flying over Heatherbrae andRaymond Terrace before landing on Runway 12.
2.2.29 Figure 12 also shows a number of civil propeller aircraft flight tracks arriving from thesouth overfly RAAF Base Williamtown before turning to the west over Campvale, Medowieand Grahamstown Dam before landing on Runway 12.
39
RAAF Base Williamtown – Noise and Flight Path Monitoring System 11 Mar 2011File name: WLM NFPMS Q1 2010 Report V2.1a.doc Q1 2010 Report
INSERT FIGURE 12 (FLIGHT TRACKS FOR CIVIL PROPELLER ARRIVALS TORUNWAY 12)

40
11 Mar 2011 RAAF Base Williamtown – Noise and Flight Path Monitoring SystemQ1 2010 Report File name:WLM NFPMS Q1 2010 Report V2.1a.doc
BLANK PAGE

41
RAAF Base Williamtown – Noise and Flight Path Monitoring System 11 Mar 2011File name: WLM NFPMS Q1 2010 Report V2.1a.doc Q1 2010 Report
INTENTIONALLY LEFT BLANK
42
11 Mar 2011 RAAF Base Williamtown – Noise and Flight Path Monitoring SystemQ1 2010 Report File name:WLM NFPMS Q1 2010 Report V2.1a.doc
2.2.30 Military Jet Aircraft Arrivals to Runway 30. Figure 13 – Military Jet AircraftFlight Tracks – Arrivals Runway 30 shows the flight track plots for all recorded military jetaircraft arrivals to Runway 30 at RAAF Base Williamtown. These include initial and pitcharrivals and straight-in arrivals. There is no ILS approach to Runway 30.
2.2.31 Figure 13 shows one straight-in arrival from the south-east of RAAF BaseWilliamtown over Stockton Beach.
2.2.32 Figure 13 shows the predominate initial and pitch arrivals flight track curving over theocean before arriving through the initial point over Stockton Beach and joining the circuitpattern on the south-western side of the runway.
2.2.33 Figure 13 shows one initial and pitch arrival tracking along Stockton Beach at lowlevel before turning over the ocean east of Stockton before arriving through the initial pointover Stockton Beach and joining the circuit pattern on the south-western side of the runway.
2.2.34 Figure 13 also shows flight tracks of military jets using the SAWR before arrivingback at RAAF Base Williamtown.

43
RAAF Base Williamtown – Noise and Flight Path Monitoring System 11 Mar 2011File name: WLM NFPMS Q1 2010 Report V2.1a.doc Q1 2010 Report
INSERT FIGURE 13 (FLIGHT TRACKS FOR MILITARY JET ARRIVALS TO RUNWAY30)

44
11 Mar 2011 RAAF Base Williamtown – Noise and Flight Path Monitoring SystemQ1 2010 Report File name:WLM NFPMS Q1 2010 Report V2.1a.doc
BLANK PAGE

45
RAAF Base Williamtown – Noise and Flight Path Monitoring System 11 Mar 2011File name: WLM NFPMS Q1 2010 Report V2.1a.doc Q1 2010 Report
INTENTIONALLY LEFT BLANK
46
11 Mar 2011 RAAF Base Williamtown – Noise and Flight Path Monitoring SystemQ1 2010 Report File name:WLM NFPMS Q1 2010 Report V2.1a.doc
2.2.35 Civil Jet Aircraft Arrivals to Runway 30. Figure 14 – Civil Jet Aircraft FlightTracks – Arrivals Runway 30 shows the recorded flight track plots for the civil jet aircraftarrivals to Runway 30 at RAAF Base Williamtown. These include visual circuit arrivals andstraight-in arrivals. There is no ILS approach to Runway 30.
2.2.36 Figure 14 shows a number of straight-in arrivals from the south-east of RAAF BaseWilliamtown over Stockton Beach. Some of these straight-in arrivals originate from the northover Tanilba Bay and some originate from the south.
2.2.37 Figure 14 shows the visual arrivals from the north over Medowie before turning overSalt Ash and Stockton Beach and arriving on Runway 30.
2.2.38 Figure 14 shows other visual arrivals from the north track over Grahamstown Dam,then to the west of RAAF Base Williamtown before joining the downwind leg of the circuitover Williamtown and then landing on Runway 30.
2.2.39 Figure 14 also shows a limited number of arrivals from the north-west that follow theILS flight track before turn to the south-east joining the downwind leg of the circuit overWilliamtown and then landing on Runway 30.

47
RAAF Base Williamtown – Noise and Flight Path Monitoring System 11 Mar 2011File name: WLM NFPMS Q1 2010 Report V2.1a.doc Q1 2010 Report
INSERT FIGURE 14 (FLIGHT TRACKS FOR CIVIL JET ARRIVALS TO RUNWAY 30)

48
11 Mar 2011 RAAF Base Williamtown – Noise and Flight Path Monitoring SystemQ1 2010 Report File name:WLM NFPMS Q1 2010 Report V2.1a.doc
BLANK PAGE

49
RAAF Base Williamtown – Noise and Flight Path Monitoring System 11 Mar 2011File name: WLM NFPMS Q1 2010 Report V2.1a.doc Q1 2010 Report
INTENTIONALLY LEFT BLANK
50
11 Mar 2011 RAAF Base Williamtown – Noise and Flight Path Monitoring SystemQ1 2010 Report File name:WLM NFPMS Q1 2010 Report V2.1a.doc
2.2.40 Civil Propeller Aircraft Arrivals to Runway 30. Figure 15 – Civil PropellerAircraft Flight Tracks – Arrivals Runway 30 shows the recorded flight track plots for the civilpropeller aircraft arrivals to Runway 30 at RAAF Base Williamtown. These include visualcircuit arrivals and straight-in arrivals. There is no ILS approach to Runway 30.
2.2.41 Figure 15 shows straight-in arrivals from the south-east of RAAF Base Williamtownover Stockton Beach.
2.2.42 Figure 15 shows a majority of the visual arrivals by civil propeller aircraft from thesouth over Fern Bay and Fullerton Cove before turning and arriving on Runway 30.
2.2.43 Figure 15 also shows a limited number of arrivals from the north-west that follow theILS flight track to Runway 12 before turning to the south-east joining the downwind leg of thecircuit over Williamtown and then landing on Runway 30.

51
RAAF Base Williamtown – Noise and Flight Path Monitoring System 11 Mar 2011File name: WLM NFPMS Q1 2010 Report V2.1a.doc Q1 2010 Report
INSERT FIGURE 15 (FLIGHT TRACKS FOR CIVIL PROPELLER ARRIVALS TORUNWAY 30)

52
11 Mar 2011 RAAF Base Williamtown – Noise and Flight Path Monitoring SystemQ1 2010 Report File name:WLM NFPMS Q1 2010 Report V2.1a.doc
BLANK PAGE
53
RAAF Base Williamtown – Noise and Flight Path Monitoring System 11 Mar 2011File name: WLM NFPMS Q1 2010 Report V2.1a.doc Q1 2010 Report
Aircraft Departure Flight Tracks
2.2.44 Aircraft departure flight track plots from Runway 12 and Runway 30 are shown infollowing figures:
a. Figure 16 – Aircraft Flight Tracks – Military Jet Departures Runway 12,
b. Figure 17 – Aircraft Flight Tracks – Military Propeller Departures Runways12 & 30,
c. Figure 18 – Aircraft Flight Tracks – Civil Jet Departures Runway 12,
d. Figure 19 – Aircraft Flight Tracks – Civil Propeller Departures Runway 12,
e. Figure 20 – Aircraft Flight Tracks – Military Jet Departures Runway 30,
f. Figure 21 – Aircraft Flight Tracks – Civil Jet Departures Runway 30, and
g. Figure 22 – Aircraft Flight Tracks – Civil Propeller Departures Runway 30.
2.2.45 These flight tracks have been colour coded according to the altitude of the aircraft infeet Above Mean Sea Level (AMSL) as the aircraft departs the airfield. Red designates analtitude of the aircraft up to 500 feet, orange for an altitude between 500 and 1,000 feet,yellow for an altitude between 1,000 and 2,500 feet and light green for an altitude above 2,500feet. RAAF Base Williamtown is 31 feet AMSL. These plots of the flight tracks have beengenerated from the aircraft movement data recorded during the Quarter 1 2010 reportingperiod.
2.2.46 Refer to Annex B – Aircraft Movement Details, Table B3 – Aircraft TypesDepartures for details of the aircraft departure movements.
54
11 Mar 2011 RAAF Base Williamtown – Noise and Flight Path Monitoring SystemQ1 2010 Report File name:WLM NFPMS Q1 2010 Report V2.1a.doc
2.2.47 Military Jet Aircraft Departures from Runway 12. Figure 16 – Aircraft FlightTracks – Military Jet Departures Runway 12 shows the recorded flight track plots for militaryjet aircraft departures from Runway 12 at RAAF Base Williamtown. The flight track plotshows the general shape of the departure tracks from Runway 12.
2.2.48 Figure 16 shows the majority of the military jet departures from Runway 12 departstraight out over the ocean or turn to the north-east over Stockton Beach and depart the areafor the over ocean training areas.
2.2.49 Figure 16 shows a limited number of military jet departures turn to the south overFullerton Cove before turning west over Heatherbrae and departing the local area to the west.
2.2.50 Figure 16 also shows flight tracks of military jets using SAWR after departing fromRAAF Base Williamtown.
2.2.51 The vast majority of the military jet departures from Runway 12 were by military fastjets such as the F/A-18 Hornet and the Hawk. There are a limited number of departures fromRunway 12 by other military jets such as Boeing B737 BBJ, Challenger CL-604, Boeing B737AEW&C and the C-17A Globemaster III.
55
RAAF Base Williamtown – Noise and Flight Path Monitoring System 11 Mar 2011File name: WLM NFPMS Q1 2010 Report V2.1a.doc Q1 2010 Report
INSERT FIGURE 16 (FLIGHT TRACKS FOR MILITARY JET DEPARTURES FROMRUNWAY 12)

56
11 Mar 2011 RAAF Base Williamtown – Noise and Flight Path Monitoring SystemQ1 2010 Report File name:WLM NFPMS Q1 2010 Report V2.1a.doc
BLANK PAGE

57
RAAF Base Williamtown – Noise and Flight Path Monitoring System 11 Mar 2011File name: WLM NFPMS Q1 2010 Report V2.1a.doc Q1 2010 Report
INTENTIONALLY LEFT BLANK
58
11 Mar 2011 RAAF Base Williamtown – Noise and Flight Path Monitoring SystemQ1 2010 Report File name:WLM NFPMS Q1 2010 Report V2.1a.doc
2.2.52 Military Propeller Departures from Runway 12 and 30. Figure 17 – AircraftFlight Tracks – Military Propeller Departures Runway 12 & 30 shows the recorded flighttrack plots for military propeller departures from Runway 12 and Runway 30 at RAAF BaseWilliamtown. The flight track plot shows the general shape of the departure tracks fromRunways 12 and 30.
2.2.53 Figure 17 shows a majority of the military propeller departures are to the north-east.Aircraft departing from Runway 12 and then turn to the north-east over Salt Ash, while aircraftdeparting from Runway 30 and then turn to the north-east over Medowie.
2.2.54 Figure 17 also shows a limited number of military propeller aircraft that depart fromRunway 30 to the north-west over Grahamstown Dam and Raymond Terrace.

59
RAAF Base Williamtown – Noise and Flight Path Monitoring System 11 Mar 2011File name: WLM NFPMS Q1 2010 Report V2.1a.doc Q1 2010 Report
INSERT FIGURE 17 (FLIGHT TRACKS FOR MILITARY PROPELLER DEPARTURESFROM RUNWAY 12 & 30)

60
11 Mar 2011 RAAF Base Williamtown – Noise and Flight Path Monitoring SystemQ1 2010 Report File name:WLM NFPMS Q1 2010 Report V2.1a.doc
BLANK PAGE

61
RAAF Base Williamtown – Noise and Flight Path Monitoring System 11 Mar 2011File name: WLM NFPMS Q1 2010 Report V2.1a.doc Q1 2010 Report
INTENTIONALLY LEFT BLANK
62
11 Mar 2011 RAAF Base Williamtown – Noise and Flight Path Monitoring SystemQ1 2010 Report File name:WLM NFPMS Q1 2010 Report V2.1a.doc
2.2.55 Civil Jet Aircraft Departures from Runway 12. Figure 18 – Aircraft Flight Tracks– Civil Jet Departures Runway 12 shows the recorded flight track plots for civil jet aircraftdepartures from Runway 12 at RAAF Base Williamtown. The flight track plot shows thegeneral shape of the departure tracks from Runway 12.
2.2.56 Figure 18 shows the majority of the civil jet departures from Runway 12 undertake aleft turn to the north over Williamtown, Campvale and then overfly Medowie before departingthe local area.
2.2.57 Figure 18 shows a limited number of civil jet departures turn to the south overFullerton Cove before turning to the north-west over Heatherbrae and departing the local areato the north.
2.2.58 Figure 18 also shows a number flight tracks of civil jets departing Runway 12 andthen turning south over Fullerton Cove and departing the local area.
63
RAAF Base Williamtown – Noise and Flight Path Monitoring System 11 Mar 2011File name: WLM NFPMS Q1 2010 Report V2.1a.doc Q1 2010 Report
INSERT FIGURE 18 (FLIGHT TRACKS FOR CIVIL JET DEPARTURES FROMRUNWAY 12)

64
11 Mar 2011 RAAF Base Williamtown – Noise and Flight Path Monitoring SystemQ1 2010 Report File name:WLM NFPMS Q1 2010 Report V2.1a.doc
BLANK PAGE

65
RAAF Base Williamtown – Noise and Flight Path Monitoring System 11 Mar 2011File name: WLM NFPMS Q1 2010 Report V2.1a.doc Q1 2010 Report
INTENTIONALLY LEFT BLANK
66
11 Mar 2011 RAAF Base Williamtown – Noise and Flight Path Monitoring SystemQ1 2010 Report File name:WLM NFPMS Q1 2010 Report V2.1a.doc
2.2.59 Civil Propeller Aircraft Departures from Runway 12. Figure 19 – Aircraft FlightTracks – Civil Propeller Departures Runway 12 shows the recorded flight track plots for civilpropeller aircraft departures from Runway 12 at RAAF Base Williamtown. The flight trackplot shows the general shape of the departure tracks from Runway 12.
2.2.60 Figure 19 shows a large number of the civil propeller departures from Runway 12 turnto the north over Williamtown, Campvale and then overfly Medowie before departing the localarea.
2.2.61 Figure 19 shows a limited number of civil propeller departures turn to the south overFullerton Cove before turning to west and overflying Heatherbrae or alternatively turning tothe north-west, overflying Grahamstown Dam and departing the local area to the north-west.
2.2.62 Figure 19 also shows a large number flight tracks of civil propeller aircraft departingRunway 12 and then turning south-west and departing the local area over Maryland oralternatively the ocean off Fern Bay.
67
RAAF Base Williamtown – Noise and Flight Path Monitoring System 11 Mar 2011File name: WLM NFPMS Q1 2010 Report V2.1a.doc Q1 2010 Report
INSERT FIGURE 19 (FLIGHT TRACKS FOR CIVIL PROPELLER DEPARTURES FROMRUNWAY 12)

68
11 Mar 2011 RAAF Base Williamtown – Noise and Flight Path Monitoring SystemQ1 2010 Report File name:WLM NFPMS Q1 2010 Report V2.1a.doc
BLANK PAGE

69
RAAF Base Williamtown – Noise and Flight Path Monitoring System 11 Mar 2011File name: WLM NFPMS Q1 2010 Report V2.1a.doc Q1 2010 Report
INTENTIONALLY LEFT BLANK
70
11 Mar 2011 RAAF Base Williamtown – Noise and Flight Path Monitoring SystemQ1 2010 Report File name:WLM NFPMS Q1 2010 Report V2.1a.doc
2.2.63 Military Jet Aircraft Departures from Runway 30. Figure 20 – Aircraft FlightTracks – Military Jet Departures Runway 30 shows the recorded flight track plots for militaryjet aircraft departures from Runway 30 at RAAF Base Williamtown. The flight track plotshows the general shape of the departure tracks from Runway 30.
2.2.64 Figure 20 shows the majority of the military jet departures from Runway 30 turn tothe north-east over Grahamstown Dam and depart in one of three directions – to the north-eastover Ferodale, to the east over SAWR or to the south-east over Medowie. These military fastjet departures to the north-east, east and south-east are for the over ocean training areas.
2.2.65 Figure 20 shows a limited number of military jet departures turn to the south overFullerton Cove and Fern Bay and depart the local area to the south-east.
2.2.66 Figure 20 shows some of the military jet departures from Runway 30 turn to thenorth-east over Grahamstown Dam and continue to climb and turn over Medowie beforedeparting to the west over Heatherbrae.
2.2.67 Figure 20 also shows the flight tracks of military jets using SAWR after departingfrom RAAF Base Williamtown.
2.2.68 The majority of the military jet departures from Runway 12 were by military fast jetssuch as the F/A-18 Hornet and the Hawk. There are a limited number of departures fromRunway 12 by other military jets such as Boeing B737 BBJ, Challenger CL-604, Boeing B737AEW&C and the C-17A Globemaster III.
71
RAAF Base Williamtown – Noise and Flight Path Monitoring System 11 Mar 2011File name: WLM NFPMS Q1 2010 Report V2.1a.doc Q1 2010 Report
INSERT FIGURE 20 (FLIGHT TRACKS FOR MILITARY JET DEPARTURES FROMRUNWAY 30)

72
11 Mar 2011 RAAF Base Williamtown – Noise and Flight Path Monitoring SystemQ1 2010 Report File name:WLM NFPMS Q1 2010 Report V2.1a.doc
BLANK PAGE

73
RAAF Base Williamtown – Noise and Flight Path Monitoring System 11 Mar 2011File name: WLM NFPMS Q1 2010 Report V2.1a.doc Q1 2010 Report
INTENTIONALLY LEFT BLANK
74
11 Mar 2011 RAAF Base Williamtown – Noise and Flight Path Monitoring SystemQ1 2010 Report File name:WLM NFPMS Q1 2010 Report V2.1a.doc
2.2.69 Civil Jet Aircraft Departures from Runway 30. Figure 21 – Aircraft Flight Tracks– Civil Jet Departures Runway 30 shows the recorded flight track plots for civil jet aircraftdepartures from Runway 30 at RAAF Base Williamtown. The flight track plot shows thegeneral shape of the departure tracks from Runway 30.
2.2.70 Figure 21 shows a large number of the civil jet departures from Runway 30 turn to thenorth over Grahamstown Dam and then overfly Ferodale or Medowie before departing thelocal area.
2.2.71 Figure 21 shows a large number of civil jet departures turn to the south overFullerton Cove and Fern Bay departing the local area to the south.
2.2.72 Figure 21 also shows a limited number of flight tracks of civil jets departing Runway30 straight out over Raymond Terrace and Brandy Hill.
75
RAAF Base Williamtown – Noise and Flight Path Monitoring System 11 Mar 2011File name: WLM NFPMS Q1 2010 Report V2.1a.doc Q1 2010 Report
INSERT FIGURE 21 (FLIGHT TRACKS FOR CIVIL JET DEPARTURES FROMRUNWAY 30)

76
11 Mar 2011 RAAF Base Williamtown – Noise and Flight Path Monitoring SystemQ1 2010 Report File name:WLM NFPMS Q1 2010 Report V2.1a.doc
BLANK PAGE

77
RAAF Base Williamtown – Noise and Flight Path Monitoring System 11 Mar 2011File name: WLM NFPMS Q1 2010 Report V2.1a.doc Q1 2010 Report
INTENTIONALLY LEFT BLANK
78
11 Mar 2011 RAAF Base Williamtown – Noise and Flight Path Monitoring SystemQ1 2010 Report File name:WLM NFPMS Q1 2010 Report V2.1a.doc
2.2.73 Civil Propeller Aircraft Departures from Runway 30. Figure 22 – Aircraft FlightTracks – Civil Propeller Departures Runway 30 shows the recorded flight track plots for civilpropeller aircraft departures from Runway 30 at RAAF Base Williamtown. The flight trackplot shows the general shape of the departure tracks from Runway 30.
2.2.74 Figure 22 shows a number of the civil propeller departures from Runway 30 turn tothe north over Grahamstown Dam and then overfly Ferodale or Medowie before departing thelocal area.
2.2.75 Figure 22 shows some of the civil propeller departures overfly Grahamstown Dambefore departing to the north-west over the northern part of Raymond Terrace (also known asKings Hill).
2.2.76 Figure 22 shows a large number of the civil propeller departures turn to the south-west overfly Tomago and Maryland before departing the local area.
2.2.77 Figure 22 also shows a limited number of civil propeller aircraft departing Runway 30straight out to the north-west over Raymond Terrace and Brandy Hill.

79
RAAF Base Williamtown – Noise and Flight Path Monitoring System 11 Mar 2011File name: WLM NFPMS Q1 2010 Report V2.1a.doc Q1 2010 Report
INSERT FIGURE 22 (FLIGHT TRACKS FOR CIVIL PROPELLER DEPARTURES FROMRUNWAY 30)

80
11 Mar 2011 RAAF Base Williamtown – Noise and Flight Path Monitoring SystemQ1 2010 Report File name:WLM NFPMS Q1 2010 Report V2.1a.doc
BLANK PAGE
81
RAAF Base Williamtown – Noise and Flight Path Monitoring System 11 Mar 2011File name: WLM NFPMS Q1 2010 Report V2.1a.doc Q1 2010 Report
Circuit Flight Tracks
2.2.78 Aircraft circuit flight track plots from Runway 12 and Runway 30 are shown on in thefollowing figures:
a. Figure 23 – Aircraft Flight Tracks – Military Jet Circuits, and
b. Figure 24 – Aircraft Flight Tracks – Military Propeller Circuits.
2.2.79 These flight tracks have been colour coded according to the altitude of the aircraft infeet Above Mean Sea Level (AMSL) as the aircraft undertakes the circuit training. Reddesignates an altitude of the aircraft up to 500 feet, orange for an altitude between 500 and1,000 feet, yellow for an altitude between 1,000 and 2,500 feet and light green for an altitudeabove 2,500 feet. The aircraft undertaking circuit training fly at an altitude of 1,500 feetAMSL. RAAF Base Williamtown is at 31 feet AMSL. These plots of the flight tracks havebeen generated from the aircraft movement data recorded during the Quarter 1 2010 reportingperiod.
2.2.80 Refer to Annex B – Aircraft Movement Details, Table B4 – Aircraft Types CircuitMovements for details of the aircraft circuit movements.

82
11 Mar 2011 RAAF Base Williamtown – Noise and Flight Path Monitoring SystemQ1 2010 Report File name:WLM NFPMS Q1 2010 Report V2.1a.doc
2.2.81 Military Jet Circuits. Figure 23 – Aircraft Flight Tracks – Military Jet Circuitsshows the recorded flight track plots for military jet aircraft circuits at RAAF BaseWilliamtown. The flight track plot shows the general shape of the circuit tracks.
2.2.82 Figure 23 shows the circuit pattern used by the military jet aircraft to the south-westof the runway.
2.2.83 Figure 23 shows the straight-in, ILS and TACAN approaches over Brandy Hill,Raymond Terrace and Grahamstown Dam can be seen to the north-west of RAAF BaseWilliamtown, and the straight-in and TACAN approaches over the ocean can be seen to thesouth-east of RAAF Base Williamtown.
2.2.84 Figure 23 shows a limited number of air-to-ground attack training flights tracks atSAWR.
2.2.85 Figure 23 also shows a number of low-level navigation training flights along theStockton Beach coastline can be seen in Figure 22.
2.2.86 Some tracks appear to stop suddenly indicating that the pilot has switched-off theaircraft’s transponder and the SSR no longer picks up the aircraft’s flight track.

83
RAAF Base Williamtown – Noise and Flight Path Monitoring System 11 Mar 2011File name: WLM NFPMS Q1 2010 Report V2.1a.doc Q1 2010 Report
INSERT FIGURE 23 (MILITARY JET CIRCUIT TRACKS)

84
11 Mar 2011 RAAF Base Williamtown – Noise and Flight Path Monitoring SystemQ1 2010 Report File name:WLM NFPMS Q1 2010 Report V2.1a.doc
BLANK PAGE

85
RAAF Base Williamtown – Noise and Flight Path Monitoring System 11 Mar 2011File name: WLM NFPMS Q1 2010 Report V2.1a.doc Q1 2010 Report
INTENTIONALLY LEFT BLANK

86
11 Mar 2011 RAAF Base Williamtown – Noise and Flight Path Monitoring SystemQ1 2010 Report File name:WLM NFPMS Q1 2010 Report V2.1a.doc
2.2.87 Military Propeller Circuits. Figure 24 – Aircraft Flight Tracks – Military PropellerCircuits shows the recorded flight track plots for military propeller aircraft circuits at RAAFBase Williamtown. The flight track plot shows the general shape of the circuit tracks.
2.2.88 Figure 24 shows the circuit pattern used by the military propeller aircraft to the south-west of the runway.
2.2.89 Figure 24 shows a series of higher level (above 2,500 ft) racetrack shaped circuitswere flown over RAAF Base Williamtown, Campvale, Fullerton Cove and Fern Bay.
2.2.90 Figure 24 shows a straight-in, ILS and TACAN approaches over Brandy Hill,Raymond Terrace and Grahamstown Dam can be seen to the north-west of RAAF BaseWilliamtown, and the straight-in and TACAN approaches over the ocean can be seen to thesouth-east of RAAF Base Williamtown.
2.2.91 Figure 24 shows air-to-ground attack training flights tracks at SAWR can be seen inFigure 23.
2.2.92 Figure 24 also shows a limited number of low-level navigation training flights alongthe Stockton Beach coastline.
2.2.93 Some tracks appear to stop suddenly indicating that the pilot has switched-off theaircraft’s transponder and the SSR no longer picks up the aircraft’s flight track.
87
RAAF Base Williamtown – Noise and Flight Path Monitoring System 11 Mar 2011File name: WLM NFPMS Q1 2010 Report V2.1a.doc Q1 2010 Report
INSERT FIGURE 24 (Military Propeller Circuit tracks)

88
11 Mar 2011 RAAF Base Williamtown – Noise and Flight Path Monitoring SystemQ1 2010 Report File name:WLM NFPMS Q1 2010 Report V2.1a.doc
BLANK PAGE

89
RAAF Base Williamtown – Noise and Flight Path Monitoring System 11 Mar 2011File name: WLM NFPMS Q1 2010 Report V2.1a.doc Q1 2010 Report
INTENTIONALLY LEFT BLANK

90
11 Mar 2011 RAAF Base Williamtown – Noise and Flight Path Monitoring SystemQ1 2010 Report File name:WLM NFPMS Q1 2010 Report V2.1a.doc
Helicopter Flight Tracks All Runways
2.2.94 Figure 25 – Helicopter Flight Tracks – All Runways illustrates the recordedhelicopter flight tracks plots (both military and civil) to and from the helicopter landing areas atRAAF Base Williamtown for the Quarter 1 2010. Arrivals are depicted with red flight tracks,departures with blue flight tracks and circuits with green flight tracks.
2.2.95 Figure 25 shows that the majority of the helicopter arrivals and departures werestraight-in to the relevant helicopter landing areas.
2.2.96 Figure 25 shows some of the helicopter tracks were to and from the runways andothers were to and from the parallel taxiway.
2.2.97 Figure 25 also shows that there are a number of helicopter flight tracks at the Defencetraining area property at Tanilba Bay.
91
RAAF Base Williamtown – Noise and Flight Path Monitoring System 11 Mar 2011File name: WLM NFPMS Q1 2010 Report V2.1a.doc Q1 2010 Report
INSERT FIGURE 25 (Helicopter Flight Tracks All Runways)

92
11 Mar 2011 RAAF Base Williamtown – Noise and Flight Path Monitoring SystemQ1 2010 Report File name:WLM NFPMS Q1 2010 Report V2.1a.doc
BLANK PAGE

93
RAAF Base Williamtown – Noise and Flight Path Monitoring System 11 Mar 2011File name: WLM NFPMS Q1 2010 Report V2.1a.doc Q1 2010 Report
INTENTIONALLY LEFT BLANK

94
11 Mar 2011 RAAF Base Williamtown – Noise and Flight Path Monitoring SystemQ1 2010 Report File name:WLM NFPMS Q1 2010 Report V2.1a.doc
Unknown Aircraft Flight Tracks All Runways
2.2.98 Figure 26 – Unknown Aircraft Flight Tracks – All Runways illustrates the recordedflight tracks by unknown aircraft at RAAF Base Williamtown for the Quarter 1 2010. Arrivalsare depicted with red flight tracks, departures with blue flight tracks and circuits with greenflight tracks.
2.2.99 Figure 26 shows the majority of the unknown arrivals and departures appear to bepossible civil helicopter flight tracks operating to and from Civil Terminal Apron at RAAFBase Williamtown. These possible civil helicopter flight tracks appear to be operating to andfrom Newcastle via a flight track over Tomago and Hexham.
2.2.100 Figure 26 shows some of these possible civil helicopter flight tracks fly to and fromRAAF Base Williamtown to and from Stockton Beach and then track north-east and south-west along beach.
2.2.101 Figure 26 shows unknown aircraft using the straight-in, ILS and TACAN arrivalflight tracks over Brandy Hill, Raymond Terrace and Grahamstown Dam to Runway 12.
2.2.102 Figure 26 also shows unknown aircraft, possibly military fast jets and PC-9 aircraftcircuit flight tracks at SAWR.
95
RAAF Base Williamtown – Noise and Flight Path Monitoring System 11 Mar 2011File name: WLM NFPMS Q1 2010 Report V2.1a.doc Q1 2010 Report
INSERT FIGURE 26 (Unknown Aircraft Flight Tracks – All Runways)

96
11 Mar 2011 RAAF Base Williamtown – Noise and Flight Path Monitoring SystemQ1 2010 Report File name:WLM NFPMS Q1 2010 Report V2.1a.doc
BLANK PAGE

97
RAAF Base Williamtown – Noise and Flight Path Monitoring System 11 Mar 2011File name: WLM NFPMS Q1 2010 Report V2.1a.doc Q1 2010 Report
3. AIRCRAFT NOISE
3.1 Measurement of Aircraft Noise
3.1.1 Noise is described as unwanted sound. The two main components of a sound eventare the loudness and pitch. The loudness is related to the energy of the sound wave and pitchis related to the frequency of the sound.
3.1.2 The human ear relates the loudness to the Sound Pressure, which is an easy parameterto measure with a noise measurement instrument. The loudness of actual sound levels is madeby comparison to a standard pressure of 2x10⁻⁵ Pascals (Newtons per square metre) taken at areference frequency of 1,000 Hz. This sound pressure has been set as the lower threshold ofhearing; with the upper threshold of the hearing pressure range being 1,000 Pa, wherepermanent damage would be done to the eardrum. Because of this very large range of soundpressures, a logarithmic scale was developed which, for typical noise events, consolidated therange of sound pressures from 0 to 140 dB. This expression of the level of sound is referencedas the Sound Pressure Level (SPL) and is measured in decibels (dB).
3.1.3 Within the human auditory system, for similar pressure levels, the pitch, or technicallythe frequency, determines the interpretation of the loudness. At equal sound pressures, lowfrequencies are perceived as less loud than middle frequencies in the 1,000 to 4,000 Hz range.At frequencies above 4,000 Hz, sensitivity decreases.
3.1.4 The human ear of a young person corresponds to a frequency range of 20 Hz to20,000 Hz. This is called the audible range. One general trend is that as people age they areless able to hear the higher frequencies, so that the high frequency limit may be reduced to15,000 Hz or in extreme cases down to 10,000 Hz.
3.1.5 The human ear is better equipped to hear the mid frequency ranges and thereforepeople can find noises in this frequency band more annoying. The “A” filter approximates thesensitivity of the ear and relates the relative loudness of the various noises at differentfrequencies to the human’s ear response to those noises. The “A weighted” decibel scale,referenced as dB(A) has generally been adopted as the relevant parameter for the measurementof community noise and has been adopted for aircraft noise, due primarily to the simple natureof obtaining an A-weighted noise level.
3.1.6 There are a large number of descriptors which have been developed to describeaircraft noise. These include:
a. single event descriptors which can be measured or calculated by a noisemonitoring instrument, and
b. equal energy parameters which accumulate a number of noise events overtime and need to be calculated.
3.1.7 Refer to Annex A – Glossary for a description of the common acoustic parametersused in the measurement of the community’s exposure to aircraft noise.
3.1.8 Two commonly used single event noise descriptors of aircraft and community noiseare the “maximum” A-weighted sound pressure level (LAmax) and the “equivalent” A-weighted noise level (LAeq).
98
11 Mar 2011 RAAF Base Williamtown – Noise and Flight Path Monitoring SystemQ1 2010 Report File name:WLM NFPMS Q1 2010 Report V2.1a.doc
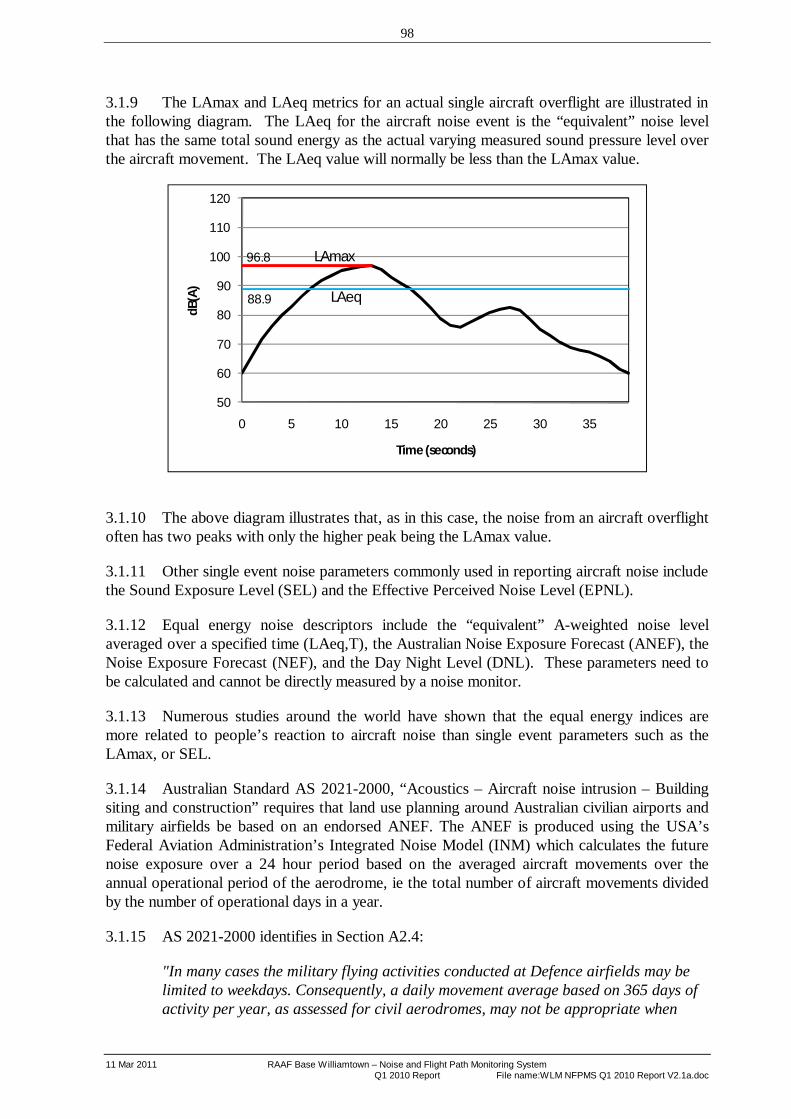
3.1.9 The LAmax and LAeq metrics for an actual single aircraft overflight are illustrated inthe following diagram. The LAeq for the aircraft noise event is the “equivalent” noise levelthat has the same total sound energy as the actual varying measured sound pressure level overthe aircraft movement. The LAeq value will normally be less than the LAmax value.
50
60
70
80
90
100
110
120
0 5 10 15 20 25 30 35
dB(A
)
Time (seconds)
LAmax
LAeq88.9
96.8
3.1.10 The above diagram illustrates that, as in this case, the noise from an aircraft overflightoften has two peaks with only the higher peak being the LAmax value.
3.1.11 Other single event noise parameters commonly used in reporting aircraft noise includethe Sound Exposure Level (SEL) and the Effective Perceived Noise Level (EPNL).
3.1.12 Equal energy noise descriptors include the “equivalent” A-weighted noise levelaveraged over a specified time (LAeq,T), the Australian Noise Exposure Forecast (ANEF), theNoise Exposure Forecast (NEF), and the Day Night Level (DNL). These parameters need tobe calculated and cannot be directly measured by a noise monitor.
3.1.13 Numerous studies around the world have shown that the equal energy indices aremore related to people’s reaction to aircraft noise than single event parameters such as theLAmax, or SEL.
3.1.14 Australian Standard AS 2021-2000, “Acoustics – Aircraft noise intrusion – Buildingsiting and construction” requires that land use planning around Australian civilian airports andmilitary airfields be based on an endorsed ANEF. The ANEF is produced using the USA’sFederal Aviation Administration’s Integrated Noise Model (INM) which calculates the futurenoise exposure over a 24 hour period based on the averaged aircraft movements over theannual operational period of the aerodrome, ie the total number of aircraft movements dividedby the number of operational days in a year.
3.1.15 AS 2021-2000 identifies in Section A2.4:
"In many cases the military flying activities conducted at Defence airfields may belimited to weekdays. Consequently, a daily movement average based on 365 days ofactivity per year, as assessed for civil aerodromes, may not be appropriate when
99
RAAF Base Williamtown – Noise and Flight Path Monitoring System 11 Mar 2011File name: WLM NFPMS Q1 2010 Report V2.1a.doc Q1 2010 Report
producing the ANEF for military airfields and joint Defence/civil airports. Whenmilitary flying activities at an airfield are expected to occur for less than 365 daysper year, average daily movement numbers for military aircraft may be assessed onthe basis of average aircraft movements during operating days only."
3.1.16 AS2021 does not identify the determination of an average day for joint Defence/civilairports. As the intent of an ANEF map for a military aerodrome is to identify the noise impactof military operations, which tend to produce higher noise levels than for civilian operations atthe same aerodrome, the average daily operations used for the ANEF must be different to adomestic or international civilian airport.
3.1.17 For the preparation of the Hawk LIF EIS the Commonwealth Department ofEnvironment agreed that the appropriate method for ANEF was to utilise:
a. the average daily civil aircraft movements calculated by dividing the forecastannual civil aircraft movements by 365 flying days.
b. the average daily military aircraft movements calculated by dividing theforecast annual military aircraft military aircraft movements by 240 flyingdays at RAAF Base Williamtown, and
c. in the case of SAWR aircraft operations divided by 115 flying days (the limitof flying days at SAWR).
3.1.18 In a layman’s sense the ANEF for RAAF Base Williamtown (including SAWR) showsthe aircraft noise exposure on days when military operations occur. Therefore on days whenmilitary operations do not occur, the noise exposure will be less, and for weekends may befurther reduced by a lower number of civilian aircraft movements. The LAeq and maximumlevels appended to this report reflect that position.
3.1.19 The future exposure to aircraft noise is illustrated as ANEF contours drawn on a mapof the environs around the aerodrome. The contours show increasing aircraft noise exposurefrom 20 ANEF to 40 ANEF. These ANEF contour numbers are not related to any value of thesingle event noise parameters and cannot be directly measured.
3.1.20 In addition to an ANEF, there is an Australian Noise Exposure Index (ANEI). TheANEI is produced using the INM and is a calculation of the noise exposure of actual aircraftoperations from a previous year (as distinct from a forecast of future operations). The ANEIhas the same units as the ANEF and is the average daily aircraft noise exposure around theaerodrome for that year. As the ANEI represents a calculated noise exposure for operations inthe past, any comparison with existing aircraft noise levels can only relate to an ANEI ratherthan a future ANEF.
3.1.21 For the insulation of buildings within the 20 ANEF contour, the Australian StandardAS2021-2000 utilises the “Aircraft noise level” as the highest external level determined foreach aircraft operation and mode. The “Aircraft noise level” is location specific. The maximumlevels in Tables C4, C5 and C6 provide an arithmetic average, the minimum and the maximumof the range of aircraft maximum levels recorded for the different aircraft types. The aircraftmaximum levels in Tables C4, C5 and C6 are not “Aircraft noise levels” as defined in AS2021-2000.

100
11 Mar 2011 RAAF Base Williamtown – Noise and Flight Path Monitoring SystemQ1 2010 Report File name:WLM NFPMS Q1 2010 Report V2.1a.doc
3.1.22 The inquiry by the Senate Select Committee on Aircraft Noise in Sydney (Falling onDeaf Ears - 1995) found that the ANEF System was not generally understood andrecommended that the ANEF be supplemented by additional acoustic metrics.
3.1.23 Whilst not required by AS 2021-2000 for measuring noise exposure, the LAeq,Tparameter may be used as a supplementary acoustic for the measurement of aircraft noiseexposure in Australia. The LAeq,T parameter is the summation of all the LAeq values for eachaircraft operation, logarithmically averaged over a period of time typically 16 or 24 hours. TheLAeq may also be referenced as Leq. A 24 hour LAeq is often referenced as Leq 24.
3.1.24 Many acoustic studies around the world have confirmed that there is a directrelationship with the 24 hour LAeq parameter and people’s reaction to aircraft noise, with onestudy in the UK (The Aircraft Noise Index Study - 1985) identified a step in people’s reactionat a LAeq of 57 dB(A). Based on this report, the UK Government adopted the LAeqparameter as a measure of aircraft noise and used 57 dB(A) as the approximate value wherethere is general community annoyance from aircraft noise. Evidence from the study showedthat people become moderately disturbed at LAeq 65 dB(A) and were considered highlydisturbed at LAeq 70 dB(A).
3.1.25 The World Health Organisation (WHO) recommends that, for transportationactivities, the noise exposure should be measured in terms of the average 24 hour LAeq andrecommends an external 55dB(A) as the value where people start to became annoyed withaircraft noise.
3.1.26 The LAeq and some derived parameters are used by many other countries around theworld as the simplest means of measuring people’s reaction to aircraft noise. Most of Europeuse the WHO LAeq recommendations. Canada uses the NEF system which is similar to theANEF system but with a different night weighting. The USA and New Zealand use the DNLsystem which is a LAeq with a night weighting from 10 pm to 7 am.
3.1.27 Airservices Australia has reported (refer to pages 7-8 of the Q2 2005 NFPMS reportfor RAAF Base Williamtown) that an order of magnitude estimate for comparison with theANEI value can be obtained by subtracting 35 dB(A) from the average 24 hour LAeq value.The WHO external noise recommendation of 55 dB(A) would therefore approximate an ANEIvalue of 20. An average 24 hour LAeq value of 60 dB(A) would approximate an ANEI valueof 25 being the “unacceptable” limit for residential housing under AS 2021-2000. Similarly forcomparison purposes, a LAeq value of 65 dB(A) would approximate ANEI 30 and LAeq 70dB(A) would approximate ANEI 35.
3.1.28 Because the equal energy parameters are not easily understood, additionalsupplementary parameters have also been used to further describe aircraft noise. The LAmaxmetric is the most common supplementary aircraft noise parameter used around the world.The WHO recommends that for aviation operations, in addition to the LAeq, additionaldescriptors such as LAmax should also be reported.

101
RAAF Base Williamtown – Noise and Flight Path Monitoring System 11 Mar 2011File name: WLM NFPMS Q1 2010 Report V2.1a.doc Q1 2010 Report
3.1.29 In 2000, the then Australian Department of Transport and Regional Services(DOTARS) suggested the Number Above (NA) parameter also be used as an additionalindicator of the community’s exposure to aircraft noise. This parameter provides an averagedaily number of aircraft noise events above a certain LAmax dB(A) level. The N70 parameterrepresents the daily average number of aircraft noise events greater than a LAmax of70 dB(A), N85 for average aircraft noise events greater than 85 dB(A) etc. DOTARSrecommended that the N70 parameter be used as 70 dB(A) is the LAmax level where speechcommunication can be disrupted by aircraft noise. The benefit of the NA parameter is yet to bequantified as the relationship between a particular NA value and people’s annoyance ordisturbance has not been established.
3.1.30 This quarterly report on the noise exposure of existing aircraft operations on the localcommunity documents the quarterly average 24 hour LAeq value. The NA parameters of N70and N85 are also documented.
102
11 Mar 2011 RAAF Base Williamtown – Noise and Flight Path Monitoring SystemQ1 2010 Report File name:WLM NFPMS Q1 2010 Report V2.1a.doc
3.2 Factors Affecting the Propagation of Aircraft Noise
3.2.1 The noise level measured at each NMT can vary considerably between similaroperations by the same aircraft type. The variation can be in excess of a sound pressure levelof 10 dB(A) – a doubling of the subjective loudness of a particular sound.
3.2.2 The factors affecting the measured noise level at a particular location include thefollowing:
a. thrust setting of the aircraft,b. attitude,c. configuration of the aircraft,d. flight track flown,e. distance of the monitor to the aircraft position, andf. environmental (weather) considerations.
3.2.3 The thrust setting of the engines of the aircraft is probably the most importantconsideration as this represents the noise power at the source. The thrust setting will bedependent on payload, range, configuration, pilot technique, weather conditions (particularlywind and temperature) and whether the aircraft is accelerating, decelerating or in a constantpower setting. This is particularly important for military aircraft, which may use afterburnerpower which may significantly increase the noise level.
3.2.4 The attitude of the aircraft can also affect the propagation of the noise level from theaircraft. The noise level can be dependent on whether the aircraft is climbing, descending,banking or in level flight. Banking, in particular, can shield the noise output from the enginesfrom the observer.
3.2.5 The configuration of the aircraft such as flap settings and undercarriage position canalso affect the noise generated by the aircraft. The lowering of flaps and undercarriage willusually result in an increase in aircraft noise from the disturbed air flow and turbulence.
3.2.6 The flight track flown and the distance of the noise monitor from the actual aircraftposition also have a bearing on the recorded noise level. The noise is dissipated through theatmosphere in proportion to the square of the distance. A doubling of the distance will resultin a decrease in the noise level by approximately 6 dB(A).
3.2.7 Environmental considerations affecting the propagation of aircraft noise through theatmosphere include the following:
a. atmospheric absorption,b. wind,c. temperature gradient, andd. lateral attenuation.
103
RAAF Base Williamtown – Noise and Flight Path Monitoring System 11 Mar 2011File name: WLM NFPMS Q1 2010 Report V2.1a.doc Q1 2010 Report
3.2.8 Atmospheric absorption influences the propagation of aircraft noise and hence theimpact on the community. Temperature and humidity affect the absorptive properties of theatmosphere; this in turn affects change in the rate of the attenuation, which is not the sameover the audible frequency spectrum. For example, over distances lower frequency sounds areless attenuated than higher frequency sounds. Cloud cover affects how aircraft noise isreflected and carried through the atmosphere. For example, cloud cover tends to reflectaircraft noise and therefore on a cloudy day aircraft noise will be carried over a longer distance.
3.2.9 Wind direction and strength can also impact on the propagation of the aircraft noisethrough the atmosphere. The propagation of noise from source to receiver will vary whetherthe receiver is upwind, downwind or crosswind from the source. Similarly, the strength of thewind can increase or decrease the sound depending on the relative positions of the source andthe receiver.
3.2.10 Temperature gradient, particularly where there is an occurrence of temperatureinversion, will also impact on the noise received at a monitor from a particular aircraftoperation. Depending on the conditions existing at the time the sound waves may be dispersedupwards, downwards, towards or away from the receiver.
3.2.11 Lateral attenuation is described as being the absorption of aircraft noise from theground, diffraction and directivity effects. Lateral attenuation is considered as excessattenuation, whereas by the same token the noise may be reflected from water bodies; expansesof hard surfaces etc. and cause an increase in the noise level thereby reducing the attenuation.
3.2.12 Weather data for RAAF Base Williamtown is collected by the Williamtown RAAFMeteorological Office. The relevant monthly weather data can be compared with the longterm average over the last 70 years to determine whether there have been any abnormalweather conditions. Detailed weather information for RAAF Base Williamtown for theprevious 14 months is available on the internet at the following site:
http://www.bom.gov.au/climate/dwo/IDCJDW2145.latest.shtml.
104
11 Mar 2011 RAAF Base Williamtown – Noise and Flight Path Monitoring SystemQ1 2010 Report File name:WLM NFPMS Q1 2010 Report V2.1a.doc
3.3 Noise Environment at RAAF Base Williamtown
NMT Locations
3.3.1 The community-based NMT locations in the vicinity of RAAF Base Williamtown havebeen located to report the noise exposure from aircraft operations associated with the Base.The noise exposure at each community-based NMT location is assessed in this report anddetails of the aircraft operations which triggered a noise event documented
3.3.2 Three NMTs have been located outside the Base within communities in the vicinity ofthe airfield. These NMTs are illustrated on Figure 27 – NMT Location Plan and have beeninstalled at the following locations:
a. Grahamstown NMT (Grahamstown Public School),
b. Salt Ash NMT (Salt Ash Public School), and
c. Medowie NMT (Wirreanda Public School).
3.3.3 Additional NMTs are planned to be installed within communities in the vicinity ofRAAF Base Williamtown and Salt Ash Air Weapons Range. The noise levels reported at theseadditional NMTs will feature in future quarterly reports.
3.3.4 Figure 27 shows graduated shading with a radius of up to 3.5 km from each NMTlocation. This zone identifies the area where aircraft are likely to generate a noise event at theNMT location. Analysis of the NFPMS data revealed that an aircraft with a high noisesignature such as a F/A-18 Hornet can register a noise event at a NMT as far away as 3.5 km,whereas less noisy aircraft such as light civil aircraft needed to be much closer to the NMT toregister a noise event.
105
RAAF Base Williamtown – Noise and Flight Path Monitoring System 11 Mar 2011File name: WLM NFPMS Q1 2010 Report V2.1a.doc Q1 2010 Report
INSERT FIGURE 27 (NMT LOCATION PLAN)

106
11 Mar 2011 RAAF Base Williamtown – Noise and Flight Path Monitoring SystemQ1 2010 Report File name:WLM NFPMS Q1 2010 Report V2.1a.doc
BLANK PAGE
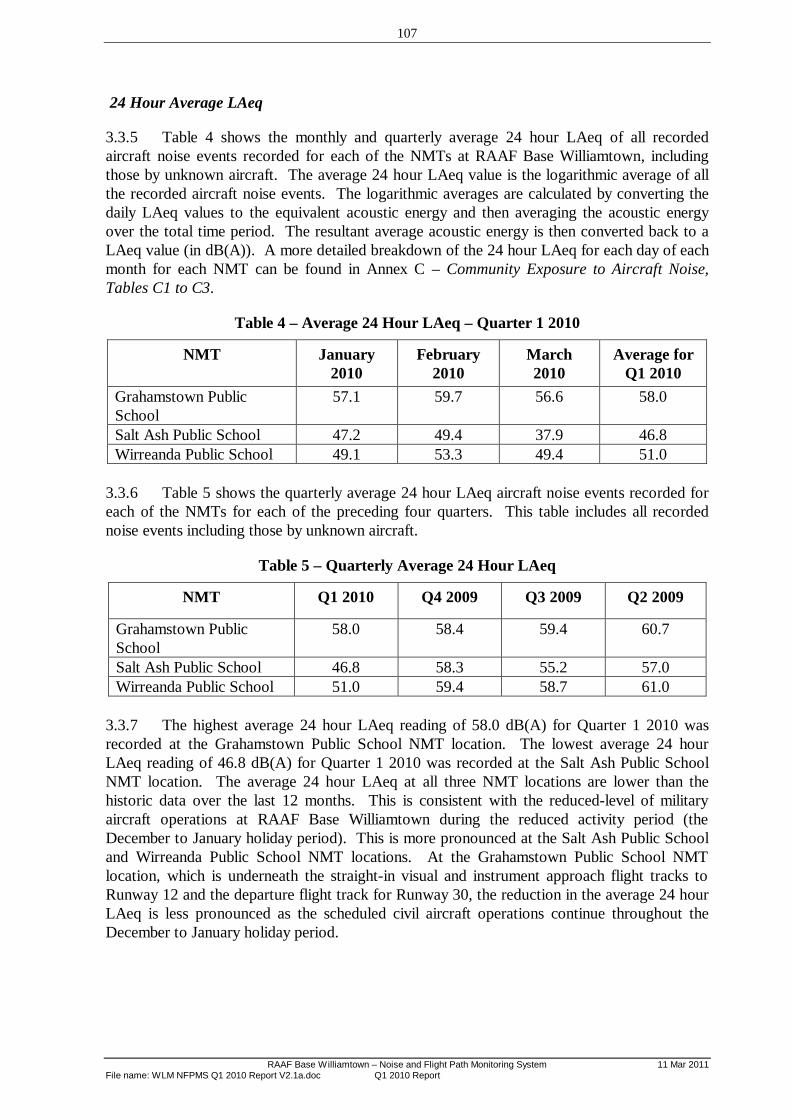
107
RAAF Base Williamtown – Noise and Flight Path Monitoring System 11 Mar 2011File name: WLM NFPMS Q1 2010 Report V2.1a.doc Q1 2010 Report
24 Hour Average LAeq
3.3.5 Table 4 shows the monthly and quarterly average 24 hour LAeq of all recordedaircraft noise events recorded for each of the NMTs at RAAF Base Williamtown, includingthose by unknown aircraft. The average 24 hour LAeq value is the logarithmic average of allthe recorded aircraft noise events. The logarithmic averages are calculated by converting thedaily LAeq values to the equivalent acoustic energy and then averaging the acoustic energyover the total time period. The resultant average acoustic energy is then converted back to aLAeq value (in dB(A)). A more detailed breakdown of the 24 hour LAeq for each day of eachmonth for each NMT can be found in Annex C – Community Exposure to Aircraft Noise,Tables C1 to C3.
Table 4 – Average 24 Hour LAeq – Quarter 1 2010
NMT January2010
February2010
March2010
Average forQ1 2010
Grahamstown PublicSchool
57.1 59.7 56.6 58.0
Salt Ash Public School 47.2 49.4 37.9 46.8Wirreanda Public School 49.1 53.3 49.4 51.0
3.3.6 Table 5 shows the quarterly average 24 hour LAeq aircraft noise events recorded foreach of the NMTs for each of the preceding four quarters. This table includes all recordednoise events including those by unknown aircraft.
Table 5 – Quarterly Average 24 Hour LAeq
NMT Q1 2010 Q4 2009 Q3 2009 Q2 2009
Grahamstown PublicSchool
58.0 58.4 59.4 60.7
Salt Ash Public School 46.8 58.3 55.2 57.0Wirreanda Public School 51.0 59.4 58.7 61.0
3.3.7 The highest average 24 hour LAeq reading of 58.0 dB(A) for Quarter 1 2010 wasrecorded at the Grahamstown Public School NMT location. The lowest average 24 hourLAeq reading of 46.8 dB(A) for Quarter 1 2010 was recorded at the Salt Ash Public SchoolNMT location. The average 24 hour LAeq at all three NMT locations are lower than thehistoric data over the last 12 months. This is consistent with the reduced-level of militaryaircraft operations at RAAF Base Williamtown during the reduced activity period (theDecember to January holiday period). This is more pronounced at the Salt Ash Public Schooland Wirreanda Public School NMT locations. At the Grahamstown Public School NMTlocation, which is underneath the straight-in visual and instrument approach flight tracks toRunway 12 and the departure flight track for Runway 30, the reduction in the average 24 hourLAeq is less pronounced as the scheduled civil aircraft operations continue throughout theDecember to January holiday period.
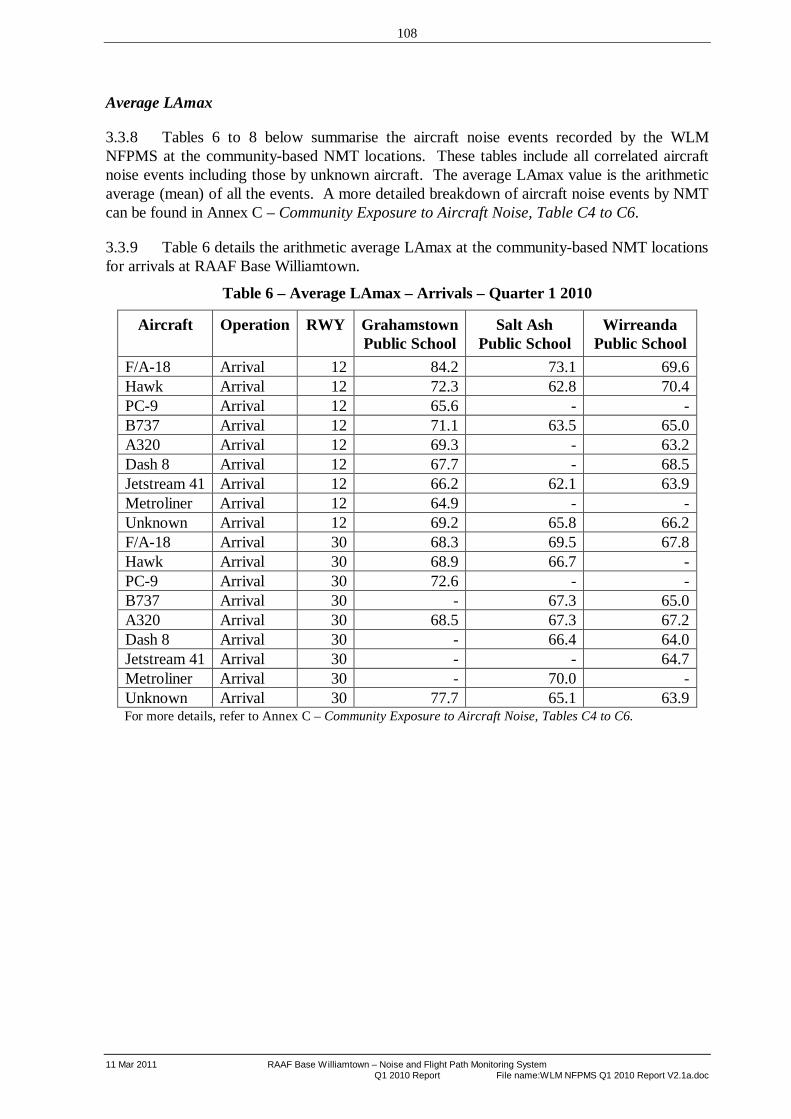
108
11 Mar 2011 RAAF Base Williamtown – Noise and Flight Path Monitoring SystemQ1 2010 Report File name:WLM NFPMS Q1 2010 Report V2.1a.doc
Average LAmax
3.3.8 Tables 6 to 8 below summarise the aircraft noise events recorded by the WLMNFPMS at the community-based NMT locations. These tables include all correlated aircraftnoise events including those by unknown aircraft. The average LAmax value is the arithmeticaverage (mean) of all the events. A more detailed breakdown of aircraft noise events by NMTcan be found in Annex C – Community Exposure to Aircraft Noise, Table C4 to C6.
3.3.9 Table 6 details the arithmetic average LAmax at the community-based NMT locationsfor arrivals at RAAF Base Williamtown.
Table 6 – Average LAmax – Arrivals – Quarter 1 2010
Aircraft Operation RWY GrahamstownPublic School
Salt AshPublic School
WirreandaPublic School
F/A-18 Arrival 12 84.2 73.1 69.6Hawk Arrival 12 72.3 62.8 70.4PC-9 Arrival 12 65.6 - -B737 Arrival 12 71.1 63.5 65.0A320 Arrival 12 69.3 - 63.2Dash 8 Arrival 12 67.7 - 68.5Jetstream 41 Arrival 12 66.2 62.1 63.9Metroliner Arrival 12 64.9 - -Unknown Arrival 12 69.2 65.8 66.2F/A-18 Arrival 30 68.3 69.5 67.8Hawk Arrival 30 68.9 66.7 -PC-9 Arrival 30 72.6 - -B737 Arrival 30 - 67.3 65.0A320 Arrival 30 68.5 67.3 67.2Dash 8 Arrival 30 - 66.4 64.0Jetstream 41 Arrival 30 - - 64.7Metroliner Arrival 30 - 70.0 -Unknown Arrival 30 77.7 65.1 63.9For more details, refer to Annex C – Community Exposure to Aircraft Noise, Tables C4 to C6.

109
RAAF Base Williamtown – Noise and Flight Path Monitoring System 11 Mar 2011File name: WLM NFPMS Q1 2010 Report V2.1a.doc Q1 2010 Report
3.3.10 Table 7 details the arithmetic average LAmax at the community-based NMT locationsfor departures at RAAF Base Williamtown.
Table 7 – Average LAmax – Departures – Quarter 1 2010
Aircraft Operation RWY GrahamstownPublic School
Salt AshPublic School
WirreandaPublic School
F/A-18 Departure 12 71.7 70.7 72.8Hawk Departure 12 69.9 66.4 70.7PC-9 Departure 12 65.7 63.2 65.0B737 Departure 12 62.9 67.3 67.9A320 Departure 12 73.9 65.1 67.9Dash 8 Departure 12 65.6 66.8 66.4Jetstream 41 Departure 12 - - 67.3Metroliner Departure 12 - - -Unknown Departure 12 74.1 66.4 71.9F/A-18 Departure 30 83.4 72.6 75.2Hawk Departure 30 81.1 69.9 74.0PC-9 Departure 30 65.7 69.1 66.7B737 Departure 30 68.9 - 68.6A320 Departure 30 68.2 - 67.0Dash 8 Departure 30 65.3 - 67.5Jetstream 41 Departure 30 66.5 - 69.3Metroliner Departure 30 64.1 - -Unknown Departure 30 76.9 64.4 66.3For more details, refer to Annex C – Community Exposure to Aircraft Noise, Tables C4 to C6.

110
11 Mar 2011 RAAF Base Williamtown – Noise and Flight Path Monitoring SystemQ1 2010 Report File name:WLM NFPMS Q1 2010 Report V2.1a.doc
3.3.11 Table 8 details the arithmetic average LAmax at the community-based NMT locationsfor circuit movements at RAAF Base Williamtown.
Table 8 – Average LAmax – Circuits – Quarter 1 2010
Aircraft Operation RWY GrahamstownPublic School
Salt AshPublic School
WirreandaPublic School
F/A-18 Circuit 12 85.0 65.7 68.5Hawk Circuit 12 69.4 66.1 64.8PC-9 Circuit 12 66.6 63.4 68.5B737 Circuit 12 72.1 - -A320 Circuit 12 68.8 - -Dash 8 Circuit 12 65.2 - -Jetstream 41 Circuit 12 - - -Metroliner Circuit 12 - - -Unknown Circuit 12 67.5 65.9 68.6F/A-18 Circuit 30 83.8 67.6 68.7Hawk Circuit 30 69.8 69.4 63.6PC-9 Circuit 30 67.2 64.5 65.9B737 Circuit 30 69.8 - -A320 Circuit 30 - - -Dash 8 Circuit 30 - - -Jetstream 41 Circuit 30 - - -Metroliner Circuit 30 - - -Unknown Circuit 30 67.5 65.0 65.9For more details, refer to Annex C – Community Exposure to Aircraft Noise, Tables C4 to C6.
3.3.12 For more details, refer to Annex C – Community Exposure to Aircraft Noise Events,Table C4 to C6.
NA Noise Events
3.3.13 Table 9 details the noise events from all recorded aircraft in terms of N70 and N85 forthe first quarter of 2010. There were 90 days in the quarter so the average number of aircraftnoise events per day is simply the total number of events divided by 90.
Table 9 – N70 and N85 Noise Events for All Aircraft for Q1 2010
GrahamstownPublic School
Salt Ash PublicSchool
WirreandaPublic School
Total N70 Events 1,196 149 308Average N70 Events 13.29 1.66 3.42Total N85 Events 361 14 29Average N85 Events 4.01 0.16 0.32
Note – Average N70 and N85 events calculated based on 90 days in the quarter.
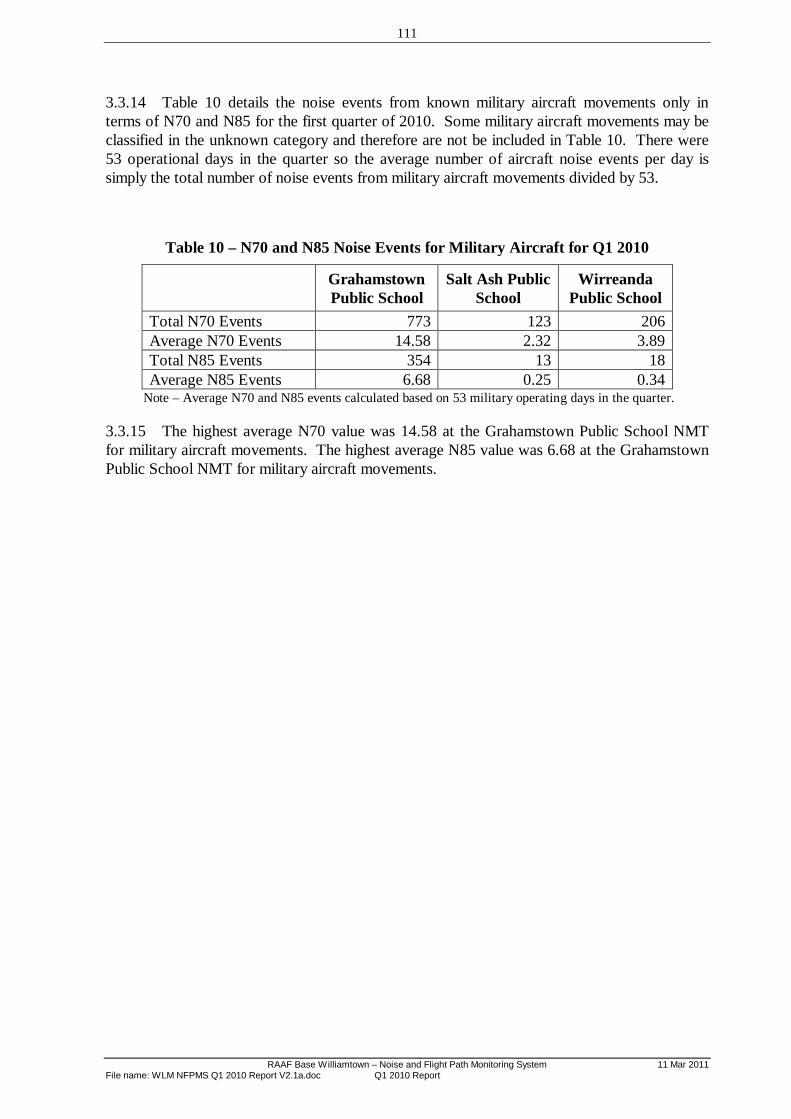
111
RAAF Base Williamtown – Noise and Flight Path Monitoring System 11 Mar 2011File name: WLM NFPMS Q1 2010 Report V2.1a.doc Q1 2010 Report
3.3.14 Table 10 details the noise events from known military aircraft movements only interms of N70 and N85 for the first quarter of 2010. Some military aircraft movements may beclassified in the unknown category and therefore are not be included in Table 10. There were53 operational days in the quarter so the average number of aircraft noise events per day issimply the total number of noise events from military aircraft movements divided by 53.
Table 10 – N70 and N85 Noise Events for Military Aircraft for Q1 2010
GrahamstownPublic School
Salt Ash PublicSchool
WirreandaPublic School
Total N70 Events 773 123 206Average N70 Events 14.58 2.32 3.89Total N85 Events 354 13 18Average N85 Events 6.68 0.25 0.34
Note – Average N70 and N85 events calculated based on 53 military operating days in the quarter.
3.3.15 The highest average N70 value was 14.58 at the Grahamstown Public School NMTfor military aircraft movements. The highest average N85 value was 6.68 at the GrahamstownPublic School NMT for military aircraft movements.

112
11 Mar 2011 RAAF Base Williamtown – Noise and Flight Path Monitoring SystemQ1 2010 Report File name:WLM NFPMS Q1 2010 Report V2.1a.doc
BLANK PAGE

RAAF Base Williamtown – Noise and Flight Path Monitoring System 11 Mar 2011File name: WLM NFPMS Q1 2010 Report V2.1a.doc Q1 2010 Report
Annex AGlossary

11 Mar 2011 RAAF Base Williamtown – Noise and Flight Path Monitoring SystemQ1 2010 Report File name:WLM NFPMS Q1 2010 Report V2.1a.doc
BLANK PAGE
A1
RAAF Base Williamtown – Noise and Flight Path Monitoring System 11 Mar 2011File name: WLM NFPMS Q1 2010 Report V2.1a.doc Q1 2010 Report
Glossary
Aircraft Movement
An aircraft arriving or departing a runway.
ANEF
Aircraft Noise Exposure Forecast. A single number index for predicting the future cumulativeexposure to aircraft noise in communities near aerodromes during a specified time period,typically averaged over one year.
ANEI
Aircraft Noise Exposure Index. A single number index for predicting the exposure to aircraftnoise in communities near aerodromes during a specified previous time period, typicallyaveraged over one year.
Arrival
An aircraft entering the local area and landing on a runway.
dB
The Sound Pressure Level (SPL) expressed on a logarithmic scale.
dB(A)
The A-weighted dB which is frequency adjusted to replicate the sound detected by the humanear.
Departure
An aircraft taking off from a runway and leaving the local area.
Circuit
A procedure where an aircraft departs the runway, circles the airfield and then lands. Onecircuit operation includes two circuit movements. Often circuit operations include a number oftouch-and–goes where the number of aircraft movements will be greater than two, dependingon the number of touch–and–goes completed.
EPNL
The Effective Perceived Noise Level (EPNL) is the tone adjusted noise level in dB. For anaircraft noise event it is the perceived noise level of a continuous reference sound which in thesame total time would convey the same summated noise annoyance to a listener. The EPNL isthe descriptor used for the certification of aircraft noise and is used for the production ofANEFs.
LAmax
LAmax is the single event maximum A-weighted sound level reached during an aircraftmovement.
A2
11 Mar 2011 RAAF Base Williamtown – Noise and Flight Path Monitoring SystemQ1 2010 Report File name:WLM NFPMS Q1 2010 Report V2.1a.doc
LAmax low value
This is the lowest LAmax value in a range of LAmax values for particular operations.
LAmax high value
This is the highest LAmax value in a range of LAmax values for particular operations.
LAmax average value
This is the arithmetically average of a range of LAmax values from the LAmax low value tothe LAmax high value for particular operations.
LAeq
The “equivalent noise level” (LAeq) is the energy equivalent noise level measured in A-weighted decibels (dB(A)). It is a time-averaged sound level; a single-number value thatexpresses the time-varying sound level for the specified period as though it were a constantsound level with the same total sound energy as the time-varying level. Consequently theLAeq is the constant noise level that if continued over the sample period would have the sameenergy as the actual varying, measured sound level. The time period needs to be specified andcan be one hour, 24 hours or the operational hours of the Base.
Number Above (NA)
The NA contour for an airport represents the number of noise events occurring greater than aparticular dB(A) level over a specified time period. The greatest numbers of occurrences arecloser to aircraft flight tracks and the airport runway, and decreases as the distance from thevicinity of these is increased. The N70 is the number of aircraft noise events above 70 dB(A)for an average day. The 70 dB(A) is seen as a critical threshold value as it is equivalent to asingle internal noise event of 60 dB(A), assuming that the aircraft noise is attenuated byapproximately 10dB(A) by the fabric of a house with open windows. An aircraft noise event of60 dB(A) in a domestic dwelling will likely interfere with a conversation or listening of a radioor television. An aircraft noise level of 70 dB(A) outside would require a person to raise theirvoice noticeably.
The N70 is a good indication of aircraft noise because it represents the way in which aircraftnoise is generally perceived and experienced. The N70 contour is scalar, and as the number offlights on a flight track doubles, the N70 event occurrence doubles. However like other noisemetrics, the N70 contour can give the impression that no aircraft noise occurs outside thecontours, which is not the case.
Other NA parameters are often produced such as the N80, N85, N90, N95 and N100. TheN85 parameter is important as 85 dB(A) is the noise level which represents the practical limitwhere residential building noise insulation can reduce the internal noise to an acceptable level.
A Noise and Flight Path Monitoring Systems (NFPMS) gathers the noise information withrespect to the monitoring site. The measured NA values provide information that is moretrusted by some people, and also provides a tool for checking the accuracy of the predictedNA contours. However the NA values only provide information very near the noisemonitoring terminals, and the data should be treated with caution as sound pressure levels canchange significantly over relatively short distances.
A3
RAAF Base Williamtown – Noise and Flight Path Monitoring System 11 Mar 2011File name: WLM NFPMS Q1 2010 Report V2.1a.doc Q1 2010 Report
Sound Exposure Level
The Sound Exposure Level (SEL) is an A-weighted noise level logarithmically summed overthe noise event and referenced to a duration of one second.
Secondary Surveillance Radar
A Secondary Surveillance Radar (SSR) provides data on aircraft positions to air traffic controlby interrogating a transponder on the aircraft. The target aircraft’s transponder responds tothe interrogation by transmitting a coded reply signal.
The Australian Advanced Air Traffic System
The Australian Advanced Air Traffic System (TAAATS) is an integrated air trafficmanagement system which provides air traffic services over most of Australia’s airspace fromtwo centres located at Melbourne and Brisbane.
Touch-and-Go
A procedure whereby an aircraft lands and takes off without coming to a stop.
Track Density
A plot of accumulated flight tracks counted over an 18 metre by 18 metre grid.

A4
11 Mar 2011 RAAF Base Williamtown – Noise and Flight Path Monitoring SystemQ1 2010 Report File name:WLM NFPMS Q1 2010 Report V2.1a.doc
BLANK PAGE
RAAF Base Williamtown – Noise and Flight Path Monitoring System 11 Mar 2011File name: WLM NFPMS Q1 2010 Report V2.1a.doc Q1 2010 Report
Annex BAircraft Movement Details

11 Mar 2011 RAAF Base Williamtown – Noise and Flight Path Monitoring SystemQ1 2010 Report File name:WLM NFPMS Q1 2010 Report V2.1a.doc
BLANK PAGE
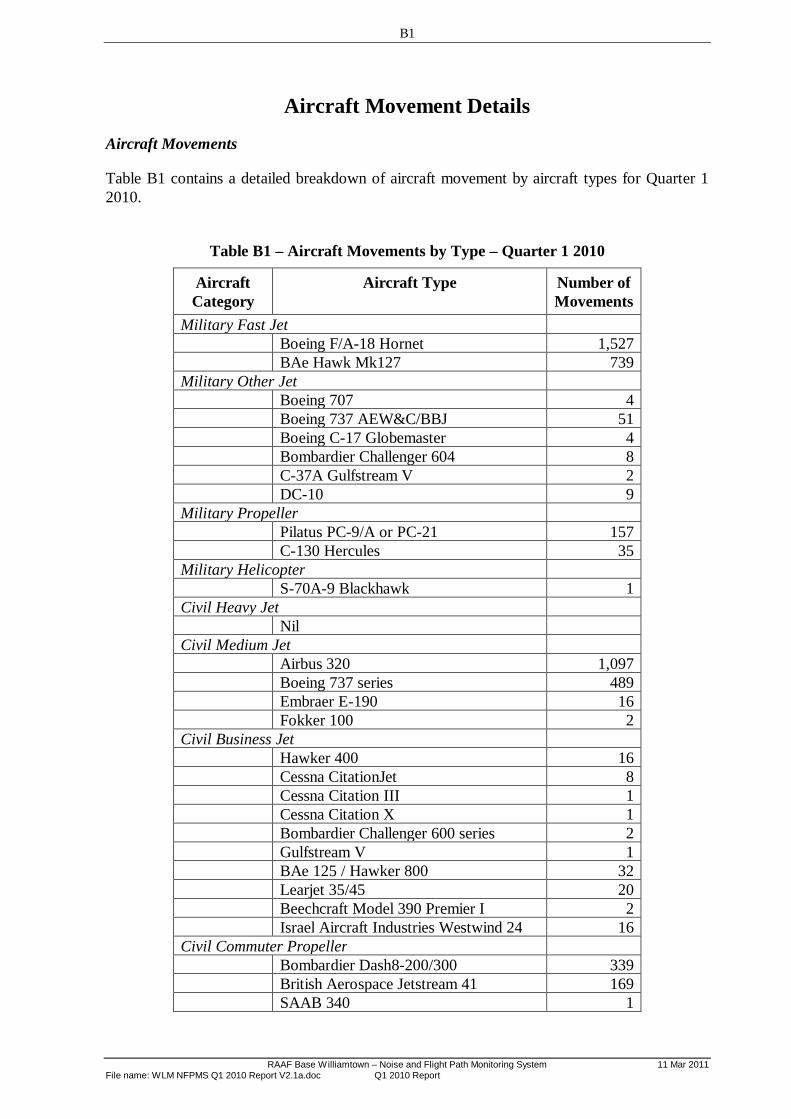
B1
RAAF Base Williamtown – Noise and Flight Path Monitoring System 11 Mar 2011File name: WLM NFPMS Q1 2010 Report V2.1a.doc Q1 2010 Report
Aircraft Movement Details
Aircraft Movements
Table B1 contains a detailed breakdown of aircraft movement by aircraft types for Quarter 12010.
Table B1 – Aircraft Movements by Type – Quarter 1 2010
AircraftCategory
Aircraft Type Number ofMovements
Military Fast JetBoeing F/A-18 Hornet 1,527BAe Hawk Mk127 739
Military Other JetBoeing 707 4Boeing 737 AEW&C/BBJ 51Boeing C-17 Globemaster 4Bombardier Challenger 604 8C-37A Gulfstream V 2DC-10 9
Military PropellerPilatus PC-9/A or PC-21 157C-130 Hercules 35
Military HelicopterS-70A-9 Blackhawk 1
Civil Heavy JetNil
Civil Medium JetAirbus 320 1,097Boeing 737 series 489Embraer E-190 16Fokker 100 2
Civil Business JetHawker 400 16Cessna CitationJet 8Cessna Citation III 1Cessna Citation X 1Bombardier Challenger 600 series 2Gulfstream V 1BAe 125 / Hawker 800 32Learjet 35/45 20Beechcraft Model 390 Premier I 2Israel Aircraft Industries Westwind 24 16
Civil Commuter PropellerBombardier Dash8-200/300 339British Aerospace Jetstream 41 169SAAB 340 1

B2
11 Mar 2011 RAAF Base Williamtown – Noise and Flight Path Monitoring SystemQ1 2010 Report File name:WLM NFPMS Q1 2010 Report V2.1a.doc
AircraftCategory
Aircraft Type Number ofMovements
Fairchild Swearingen Metroliner / Metro 157Civil Light Propeller
AeroCommander 500 26Beechcraft 350 King Air 26Beechcraft 200 King Air 358Beechcraft 55/58 Baron 22Beechcraft 76 Duchess 62Cessna 172 Skyhawk/172RG Cutlass 4Cessna 310 5Cessna 421 Golden Eagle 1Pacific Aerospace CT/4 Airtrainer 5Gippsland GA-8 Airvan 17British Aerospace Jetstream 32 701Piper PA-28 Cherokee/Warrior/Arrow 4Pacific Aerospace P-750 XSTOL 42Piper PA-30 Twin Comanche 24Piper PA-31 Navajo 88Piper PA-34 Seneca 19Piper PA-44 Seminole 2Pilatus PC-12 6Socata TB20 Trinidad / Trinidad GT 1
Civil HelicopterAgustaWestland AW139 2Sikorsky S-76 Spirit 15Unknown helicopter 4
Unknown aircraft typeUnknown aircraft type 867
TOTAL: 7,207

B3
RAAF Base Williamtown – Noise and Flight Path Monitoring System 11 Mar 2011File name: WLM NFPMS Q1 2010 Report V2.1a.doc Q1 2010 Report
Table B2 contains a detailed breakdown of aircraft arrival movements by aircraft types to eachof the two runways.
Table B2 – Aircraft Types – Arrivals – Quarter 1 2010
Aircraft Type RWY 12 RWY 30 TotalMilitary Fast Jet
Boeing F/A-18 Hornet 527 149 676BAe Hawk Mk127 195 70 265
Military Other JetBoeing 707 1 1 2Boeing 737 AEW&C/BBJ 25 2 27Boeing C-17 Globemaster 1 1 2Bombardier Challenger 604 2 2 4C-37A Gulfstream V 1 0 1DC-10 4 1 5
Military PropellerPilatus PC-9/A or PC-21 33 14 47C-130 Hercules 7 10 17
Military HelicopterS-70A-9 Blackhawk 1 0 1
Civil Heavy JetNil
Civil Medium JetAirbus 320 452 94 546Boeing 737 series 156 86 242Embraer E-190 6 2 8Fokker 100 1 0 1
Civil Business JetHawker 400 7 1 8Cessna CitationJet 2 2 4Cessna Citation III 0 1 1Cessna Citation X 1 0 1Bombardier Challenger 600 series 1 0 1Gulfstream V 1 0 1BAe 125 / Hawker 800 14 2 16Learjet 35/45 8 2 10Beechcraft Model 390 Premier I 1 0 1Israel Aircraft Industries Westwind 24 8 0 8
Civil Commuter PropellerBombardier Dash8-200/300 135 34 169British Aerospace Jetstream 41 69 14 83SAAB 340 1 1Fairchild Swearingen Metroliner / Metro 23 58 21 79
Civil Light PropellerCivil Light Propeller sub-total 523 155 678
Civil HelicopterAgustaWestland AW139 1 0 1Sikorsky S-76 Spirit 7 0 7Unknown Helicopter 1 1 2
Unknown aircraft typeUnknown 209 136 345
Total 2,458 802 3,260
B4
11 Mar 2011 RAAF Base Williamtown – Noise and Flight Path Monitoring SystemQ1 2010 Report File name:WLM NFPMS Q1 2010 Report V2.1a.doc
The unknown aircraft type made up 11% of the total arrivals. The majority of the unknownaircraft arriving aircraft used the beacon code 1200 which is normally used for training flightsby general aviation aircraft.
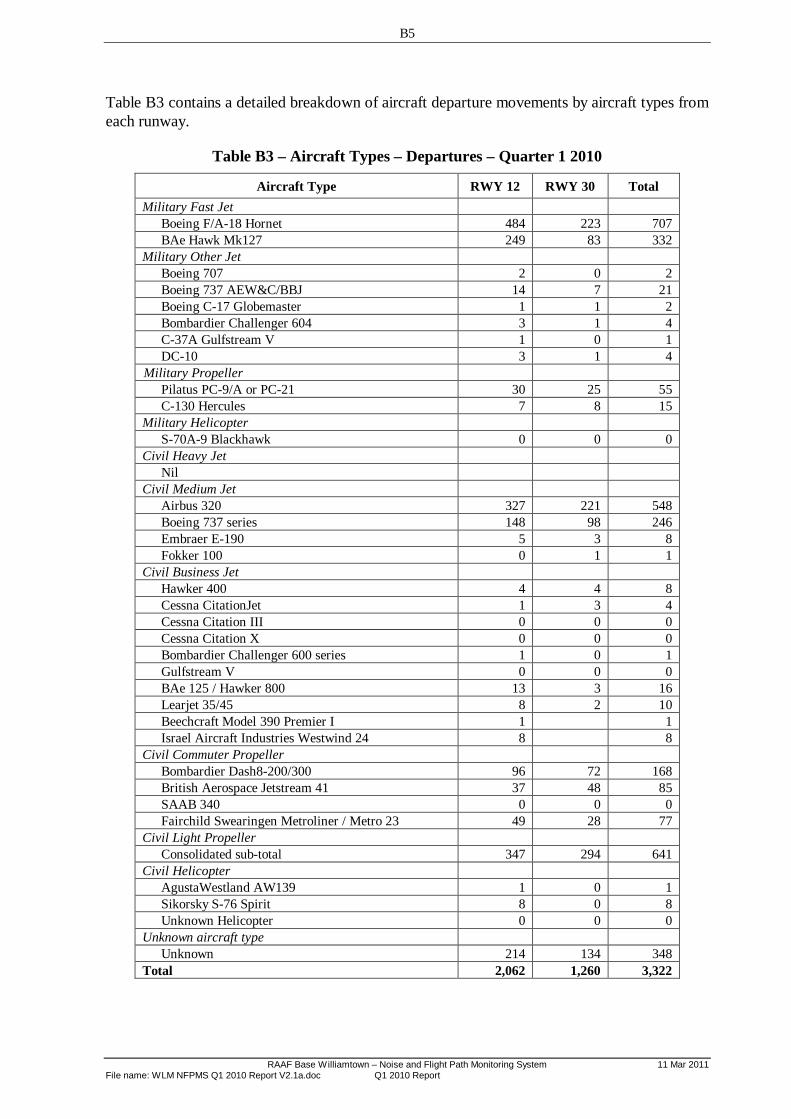
B5
RAAF Base Williamtown – Noise and Flight Path Monitoring System 11 Mar 2011File name: WLM NFPMS Q1 2010 Report V2.1a.doc Q1 2010 Report
Table B3 contains a detailed breakdown of aircraft departure movements by aircraft types fromeach runway.
Table B3 – Aircraft Types – Departures – Quarter 1 2010
Aircraft Type RWY 12 RWY 30 TotalMilitary Fast Jet
Boeing F/A-18 Hornet 484 223 707BAe Hawk Mk127 249 83 332
Military Other JetBoeing 707 2 0 2Boeing 737 AEW&C/BBJ 14 7 21Boeing C-17 Globemaster 1 1 2Bombardier Challenger 604 3 1 4C-37A Gulfstream V 1 0 1DC-10 3 1 4
Military PropellerPilatus PC-9/A or PC-21 30 25 55C-130 Hercules 7 8 15
Military HelicopterS-70A-9 Blackhawk 0 0 0
Civil Heavy JetNil
Civil Medium JetAirbus 320 327 221 548Boeing 737 series 148 98 246Embraer E-190 5 3 8Fokker 100 0 1 1
Civil Business JetHawker 400 4 4 8Cessna CitationJet 1 3 4Cessna Citation III 0 0 0Cessna Citation X 0 0 0Bombardier Challenger 600 series 1 0 1Gulfstream V 0 0 0BAe 125 / Hawker 800 13 3 16Learjet 35/45 8 2 10Beechcraft Model 390 Premier I 1 1Israel Aircraft Industries Westwind 24 8 8
Civil Commuter PropellerBombardier Dash8-200/300 96 72 168British Aerospace Jetstream 41 37 48 85SAAB 340 0 0 0Fairchild Swearingen Metroliner / Metro 23 49 28 77
Civil Light PropellerConsolidated sub-total 347 294 641
Civil HelicopterAgustaWestland AW139 1 0 1Sikorsky S-76 Spirit 8 0 8Unknown Helicopter 0 0 0
Unknown aircraft typeUnknown 214 134 348
Total 2,062 1,260 3,322

B6
11 Mar 2011 RAAF Base Williamtown – Noise and Flight Path Monitoring SystemQ1 2010 Report File name:WLM NFPMS Q1 2010 Report V2.1a.doc
The unknown aircraft type made up 10% of the total departures. The majority of the unknownaircraft arriving aircraft used the beacon code 1200 which is normally used for training flightsby general aviation aircraft.
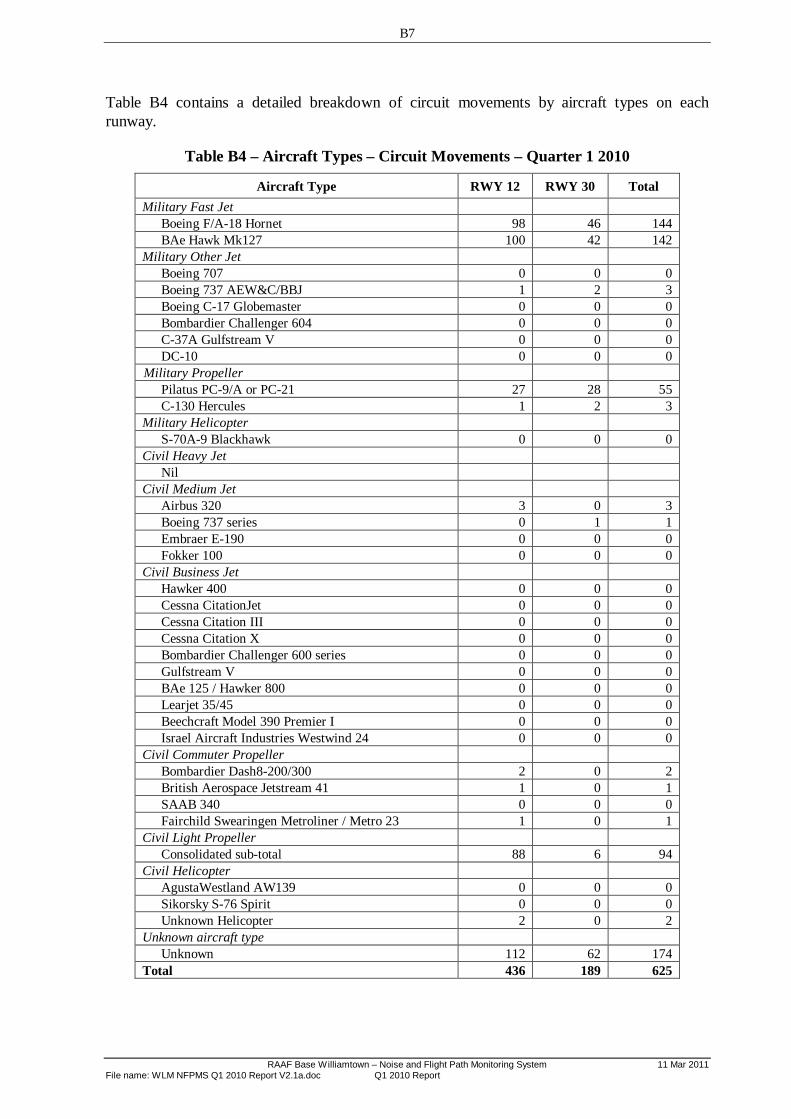
B7
RAAF Base Williamtown – Noise and Flight Path Monitoring System 11 Mar 2011File name: WLM NFPMS Q1 2010 Report V2.1a.doc Q1 2010 Report
Table B4 contains a detailed breakdown of circuit movements by aircraft types on eachrunway.
Table B4 – Aircraft Types – Circuit Movements – Quarter 1 2010
Aircraft Type RWY 12 RWY 30 TotalMilitary Fast Jet
Boeing F/A-18 Hornet 98 46 144BAe Hawk Mk127 100 42 142
Military Other JetBoeing 707 0 0 0Boeing 737 AEW&C/BBJ 1 2 3Boeing C-17 Globemaster 0 0 0Bombardier Challenger 604 0 0 0C-37A Gulfstream V 0 0 0DC-10 0 0 0
Military PropellerPilatus PC-9/A or PC-21 27 28 55C-130 Hercules 1 2 3
Military HelicopterS-70A-9 Blackhawk 0 0 0
Civil Heavy JetNil
Civil Medium JetAirbus 320 3 0 3Boeing 737 series 0 1 1Embraer E-190 0 0 0Fokker 100 0 0 0
Civil Business JetHawker 400 0 0 0Cessna CitationJet 0 0 0Cessna Citation III 0 0 0Cessna Citation X 0 0 0Bombardier Challenger 600 series 0 0 0Gulfstream V 0 0 0BAe 125 / Hawker 800 0 0 0Learjet 35/45 0 0 0Beechcraft Model 390 Premier I 0 0 0Israel Aircraft Industries Westwind 24 0 0 0
Civil Commuter PropellerBombardier Dash8-200/300 2 0 2British Aerospace Jetstream 41 1 0 1SAAB 340 0 0 0Fairchild Swearingen Metroliner / Metro 23 1 0 1
Civil Light PropellerConsolidated sub-total 88 6 94
Civil HelicopterAgustaWestland AW139 0 0 0Sikorsky S-76 Spirit 0 0 0Unknown Helicopter 2 0 2
Unknown aircraft typeUnknown 112 62 174
Total 436 189 625

B8
11 Mar 2011 RAAF Base Williamtown – Noise and Flight Path Monitoring SystemQ1 2010 Report File name:WLM NFPMS Q1 2010 Report V2.1a.doc
The unknown aircraft type made up 28% of the total circuit movements. The majority of theunknown aircraft arriving aircraft used the beacon code 1200 which is normally used fortraining flights by general aviation aircraft.
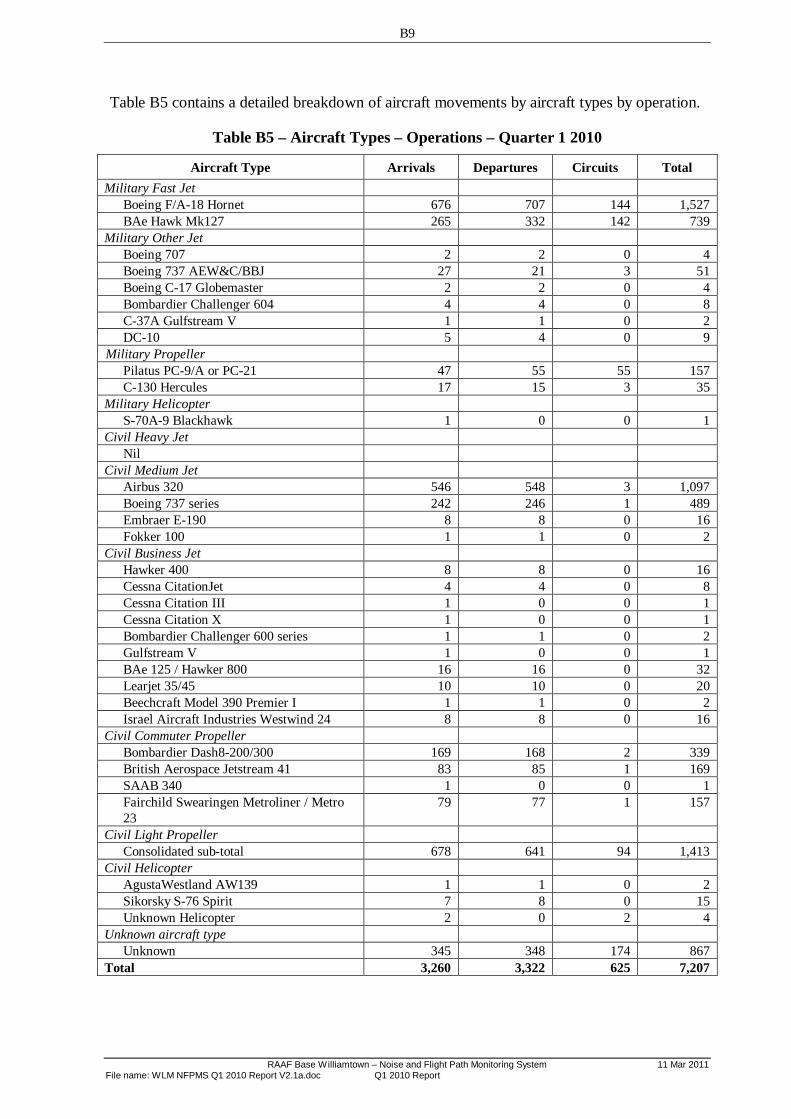
B9
RAAF Base Williamtown – Noise and Flight Path Monitoring System 11 Mar 2011File name: WLM NFPMS Q1 2010 Report V2.1a.doc Q1 2010 Report
Table B5 contains a detailed breakdown of aircraft movements by aircraft types by operation.
Table B5 – Aircraft Types – Operations – Quarter 1 2010
Aircraft Type Arrivals Departures Circuits TotalMilitary Fast Jet
Boeing F/A-18 Hornet 676 707 144 1,527BAe Hawk Mk127 265 332 142 739
Military Other JetBoeing 707 2 2 0 4Boeing 737 AEW&C/BBJ 27 21 3 51Boeing C-17 Globemaster 2 2 0 4Bombardier Challenger 604 4 4 0 8C-37A Gulfstream V 1 1 0 2DC-10 5 4 0 9
Military PropellerPilatus PC-9/A or PC-21 47 55 55 157C-130 Hercules 17 15 3 35
Military HelicopterS-70A-9 Blackhawk 1 0 0 1
Civil Heavy JetNil
Civil Medium JetAirbus 320 546 548 3 1,097Boeing 737 series 242 246 1 489Embraer E-190 8 8 0 16Fokker 100 1 1 0 2
Civil Business JetHawker 400 8 8 0 16Cessna CitationJet 4 4 0 8Cessna Citation III 1 0 0 1Cessna Citation X 1 0 0 1Bombardier Challenger 600 series 1 1 0 2Gulfstream V 1 0 0 1BAe 125 / Hawker 800 16 16 0 32Learjet 35/45 10 10 0 20Beechcraft Model 390 Premier I 1 1 0 2Israel Aircraft Industries Westwind 24 8 8 0 16
Civil Commuter PropellerBombardier Dash8-200/300 169 168 2 339British Aerospace Jetstream 41 83 85 1 169SAAB 340 1 0 0 1Fairchild Swearingen Metroliner / Metro23
79 77 1 157
Civil Light PropellerConsolidated sub-total 678 641 94 1,413
Civil HelicopterAgustaWestland AW139 1 1 0 2Sikorsky S-76 Spirit 7 8 0 15Unknown Helicopter 2 0 2 4
Unknown aircraft typeUnknown 345 348 174 867
Total 3,260 3,322 625 7,207

B10
11 Mar 2011 RAAF Base Williamtown – Noise and Flight Path Monitoring SystemQ1 2010 Report File name:WLM NFPMS Q1 2010 Report V2.1a.doc
The unknown aircraft type made up 11% of the total arrival movements, 10% of the totaldeparture movements, 28% of the total circuit movements and 12% of total movements. Themajority of the unknown arriving aircraft used the beacon code 1200 which is normally usedfor training flights by general aviation aircraft.
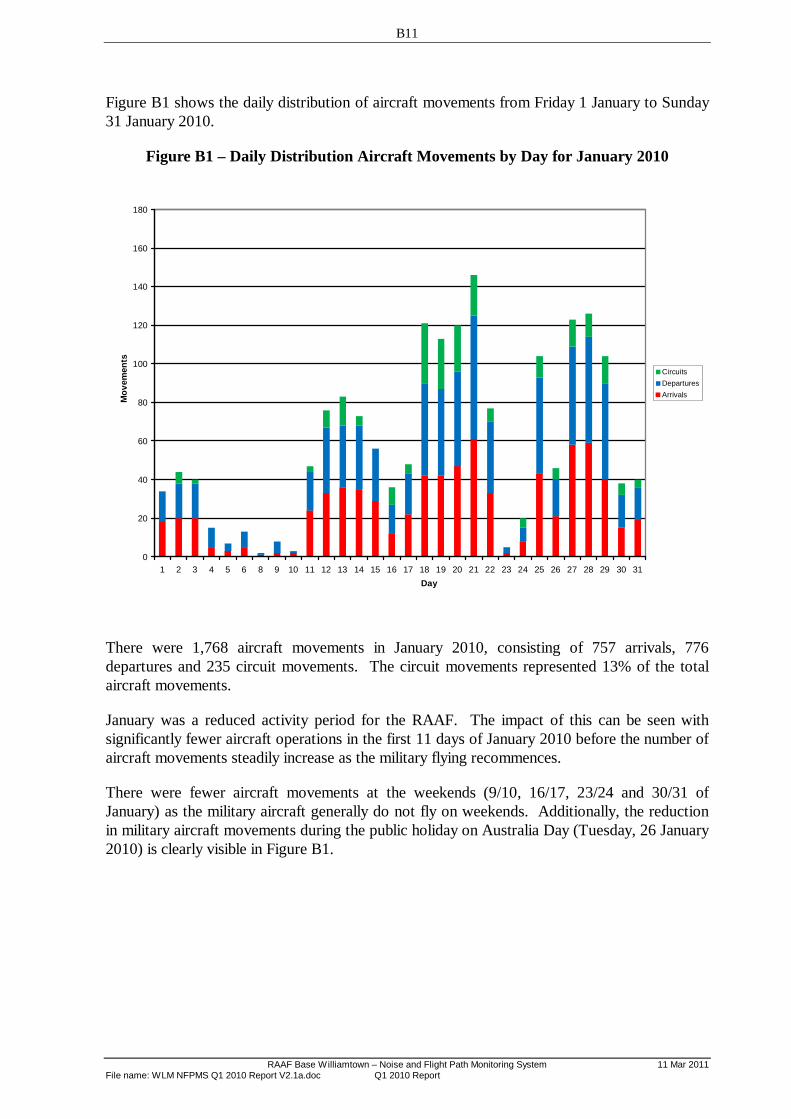
B11
RAAF Base Williamtown – Noise and Flight Path Monitoring System 11 Mar 2011File name: WLM NFPMS Q1 2010 Report V2.1a.doc Q1 2010 Report
Figure B1 shows the daily distribution of aircraft movements from Friday 1 January to Sunday31 January 2010.
Figure B1 – Daily Distribution Aircraft Movements by Day for January 2010
0
20
40
60
80
100
120
140
160
180
1 2 3 4 5 6 8 9 10 11 12 13 14 15 16 17 18 19 20 21 22 23 24 25 26 27 28 29 30 31Day
Mov
emen
ts
CircuitsDeparturesArrivals
There were 1,768 aircraft movements in January 2010, consisting of 757 arrivals, 776departures and 235 circuit movements. The circuit movements represented 13% of the totalaircraft movements.
January was a reduced activity period for the RAAF. The impact of this can be seen withsignificantly fewer aircraft operations in the first 11 days of January 2010 before the number ofaircraft movements steadily increase as the military flying recommences.
There were fewer aircraft movements at the weekends (9/10, 16/17, 23/24 and 30/31 ofJanuary) as the military aircraft generally do not fly on weekends. Additionally, the reductionin military aircraft movements during the public holiday on Australia Day (Tuesday, 26 January2010) is clearly visible in Figure B1.

B12
11 Mar 2011 RAAF Base Williamtown – Noise and Flight Path Monitoring SystemQ1 2010 Report File name:WLM NFPMS Q1 2010 Report V2.1a.doc
Figure B2 shows the daily distribution of aircraft movements from Monday 1 February toSunday 28 February 2010.
Figure B2 – Daily Distribution of Aircraft Movements by Day for February 2010
0
20
40
60
80
100
120
140
160
180
1 2 3 4 5 6 7 8 9 10 11 12 13 14 15 16 17 18 19 20 21 22 23 24 25 26 27 28Day
Mov
emen
ts
CircuitsDeparturesArrivals
There were 2,501 aircraft movements in February 2010, consisting of 1,103 arrivals, 1,150departures and 248 circuit movements. The circuit movements represented 10% of the totalaircraft movements.
The weekly cycle of aircraft movements can be seen in Figure B2 with Wednesday generallybeing the busiest day for aircraft movements.
There were fewer aircraft movements at the weekends (6/7, 13/14, 20/21 and 27/28 ofFebruary) as the military aircraft generally do not fly on weekends.
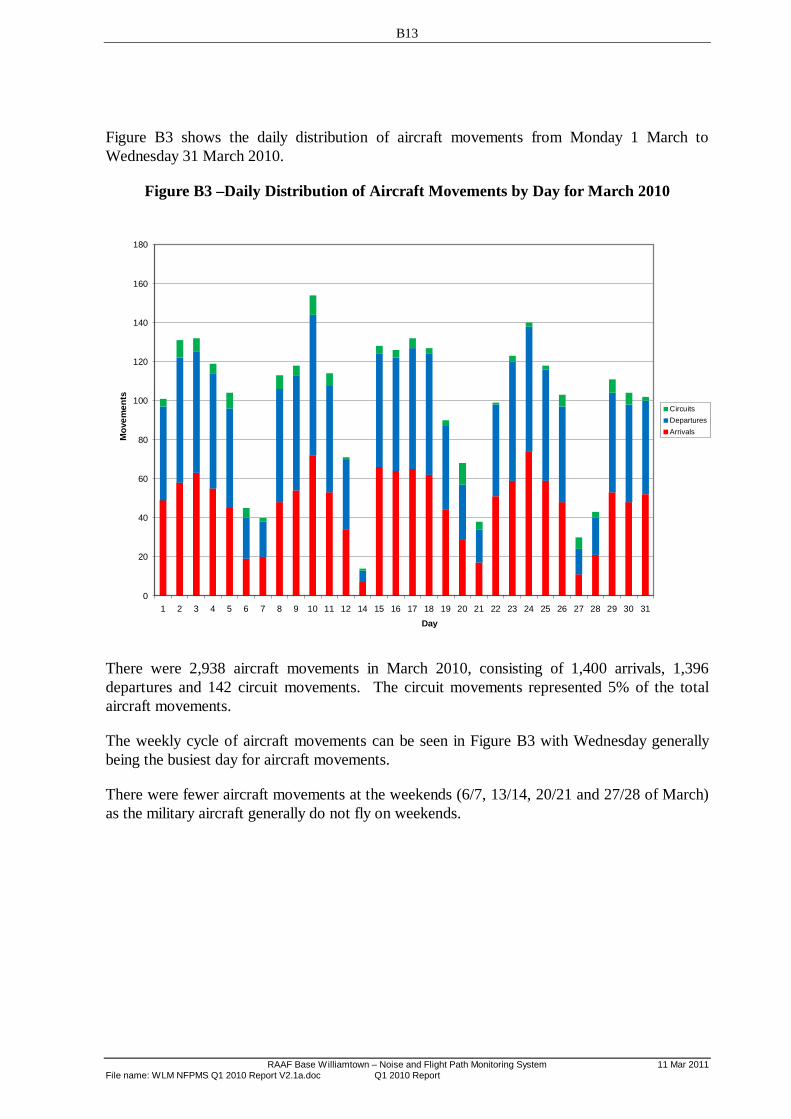
B13
RAAF Base Williamtown – Noise and Flight Path Monitoring System 11 Mar 2011File name: WLM NFPMS Q1 2010 Report V2.1a.doc Q1 2010 Report
Figure B3 shows the daily distribution of aircraft movements from Monday 1 March toWednesday 31 March 2010.
Figure B3 –Daily Distribution of Aircraft Movements by Day for March 2010
0
20
40
60
80
100
120
140
160
180
1 2 3 4 5 6 7 8 9 10 11 12 14 15 16 17 18 19 20 21 22 23 24 25 26 27 28 29 30 31Day
Mov
emen
ts
CircuitsDeparturesArrivals
There were 2,938 aircraft movements in March 2010, consisting of 1,400 arrivals, 1,396departures and 142 circuit movements. The circuit movements represented 5% of the totalaircraft movements.
The weekly cycle of aircraft movements can be seen in Figure B3 with Wednesday generallybeing the busiest day for aircraft movements.
There were fewer aircraft movements at the weekends (6/7, 13/14, 20/21 and 27/28 of March)as the military aircraft generally do not fly on weekends.

B14
11 Mar 2011 RAAF Base Williamtown – Noise and Flight Path Monitoring SystemQ1 2010 Report File name:WLM NFPMS Q1 2010 Report V2.1a.doc
Figure B4 shows the aggregation of aircraft movements by time of day for the whole of theperiod from Friday 1 January to Sunday 31 January 2010. Generally, most flights after 1700 hor before 0700 h are likely to be civil aircraft operating to and from Newcastle Airport.However military night flying training can occur on occasion after 1900 h.
Figure B4 –Distribution of Aircraft Movements by Time of Day for January 2010
0
50
100
150
200
250
300
350
0 1 2 3 4 5 6 7 8 9 10 11 12 13 14 15 16 17 18 19 20 21 22 23
Hou
rly M
ovem
ents
Hour of the Day
Circuits
Departures
Arrivals
In the early morning period between 0000 h and 0700 h, no military aircraft operations tookplace in the month of January 2010. Between 0000 h and 0600 h, there were a number ofNSW Air Ambulance operations and a number of operations by privately-owned generalavaition aircraft. Between 0600 h and 0700 h, there were a significant number of scheduledcivil airline operations.
In the evening periond between 1900 h and 2400 h, there were 47 military aircraft operationsthat took place during the period 25-29 January 2010. The remaining 176 aircraft operationswere undertaken by civil aircraft.
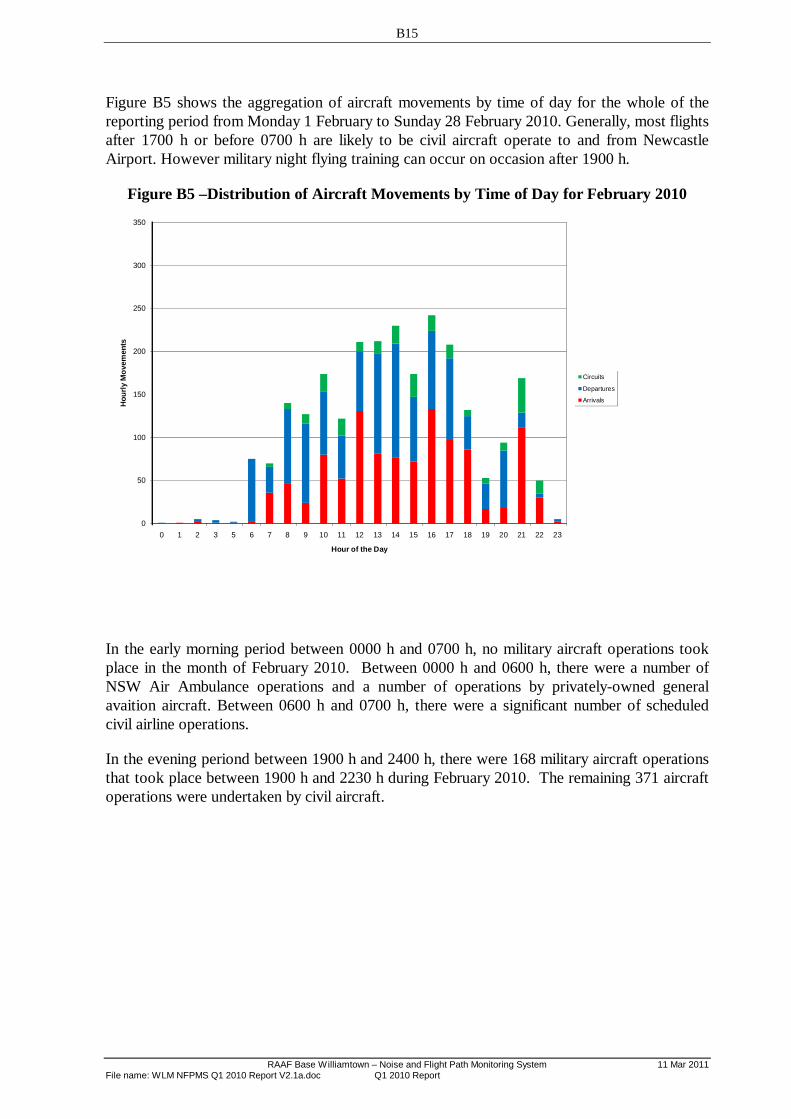
B15
RAAF Base Williamtown – Noise and Flight Path Monitoring System 11 Mar 2011File name: WLM NFPMS Q1 2010 Report V2.1a.doc Q1 2010 Report
Figure B5 shows the aggregation of aircraft movements by time of day for the whole of thereporting period from Monday 1 February to Sunday 28 February 2010. Generally, most flightsafter 1700 h or before 0700 h are likely to be civil aircraft operate to and from NewcastleAirport. However military night flying training can occur on occasion after 1900 h.
Figure B5 –Distribution of Aircraft Movements by Time of Day for February 2010
0
50
100
150
200
250
300
350
0 1 2 3 5 6 7 8 9 10 11 12 13 14 15 16 17 18 19 20 21 22 23
Hou
rly M
ovem
ents
Hour of the Day
Circuits
Departures
Arrivals
In the early morning period between 0000 h and 0700 h, no military aircraft operations tookplace in the month of February 2010. Between 0000 h and 0600 h, there were a number ofNSW Air Ambulance operations and a number of operations by privately-owned generalavaition aircraft. Between 0600 h and 0700 h, there were a significant number of scheduledcivil airline operations.
In the evening periond between 1900 h and 2400 h, there were 168 military aircraft operationsthat took place between 1900 h and 2230 h during February 2010. The remaining 371 aircraftoperations were undertaken by civil aircraft.
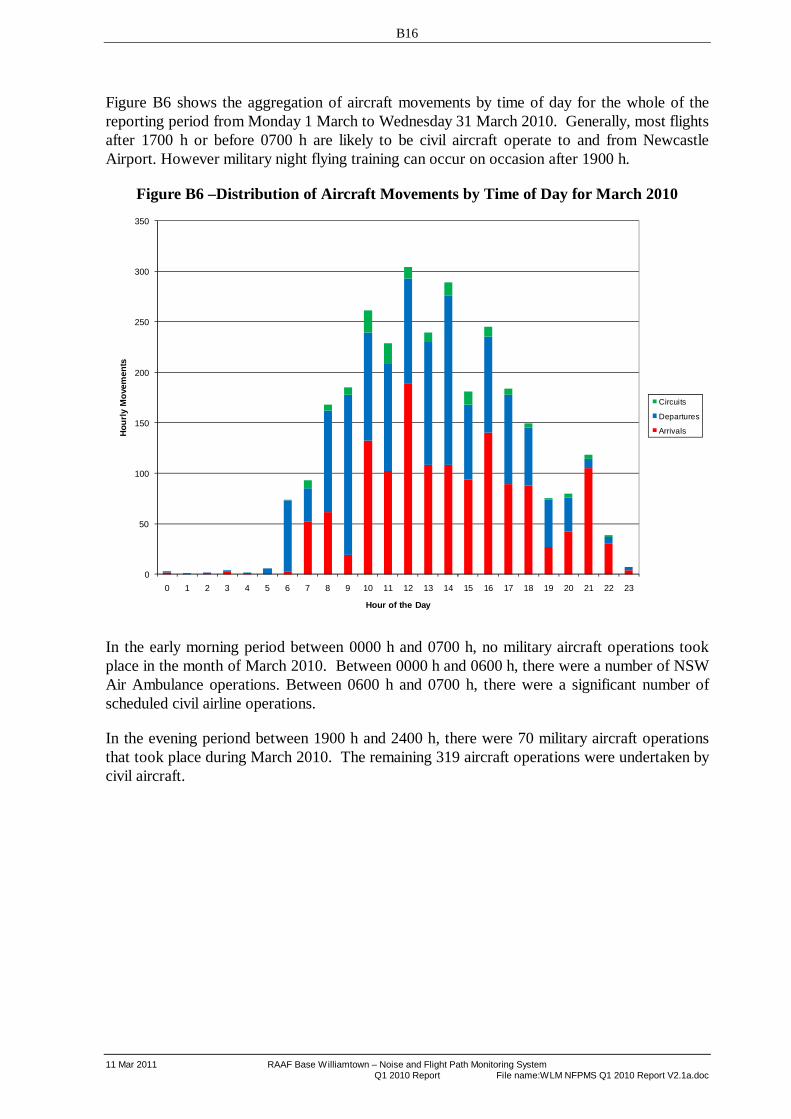
B16
11 Mar 2011 RAAF Base Williamtown – Noise and Flight Path Monitoring SystemQ1 2010 Report File name:WLM NFPMS Q1 2010 Report V2.1a.doc
Figure B6 shows the aggregation of aircraft movements by time of day for the whole of thereporting period from Monday 1 March to Wednesday 31 March 2010. Generally, most flightsafter 1700 h or before 0700 h are likely to be civil aircraft operate to and from NewcastleAirport. However military night flying training can occur on occasion after 1900 h.
Figure B6 –Distribution of Aircraft Movements by Time of Day for March 2010
0
50
100
150
200
250
300
350
0 1 2 3 4 5 6 7 8 9 10 11 12 13 14 15 16 17 18 19 20 21 22 23
Hou
rly
Mov
emen
ts
Hour of the Day
Circuits
Departures
Arrivals
In the early morning period between 0000 h and 0700 h, no military aircraft operations tookplace in the month of March 2010. Between 0000 h and 0600 h, there were a number of NSWAir Ambulance operations. Between 0600 h and 0700 h, there were a significant number ofscheduled civil airline operations.
In the evening periond between 1900 h and 2400 h, there were 70 military aircraft operationsthat took place during March 2010. The remaining 319 aircraft operations were undertaken bycivil aircraft.
RAAF Base Williamtown – Noise and Flight Path Monitoring System 11 Mar 2011File name: WLM NFPMS Q1 2010 Report V2.1a.doc Q1 2010 Report
Annex CCommunity Exposure to Aircraft Noise

11 Mar 2011 RAAF Base Williamtown – Noise and Flight Path Monitoring SystemQ1 2010 Report File name:WLM NFPMS Q1 2010 Report V2.1a.doc
BLANK PAGE

C1
RAAF Base Williamtown – Noise and Flight Path Monitoring System 11 Mar 2011File name: WLM NFPMS Q1 2010 Report V2.1a.doc Q1 2010 Report
Community Exposure to Aircraft Noise
LAeq Aircraft Noise Events
Tables C1 to C3 detail the 24 Hour LAeq for aircraft noise events for each day of the quarterat each of the three community-based NMT locations. Table C1 below details the daily LAeqcontribution from aircraft noise events at each of the community-based NMT locations overthe 24 hour period for each day of January 2010.
Table C1 – 24 Hour LAeq Aircraft Noise for January 2010
Day of Month GrahamstownPublic School
Salt Ash PublicSchool
WirreandaPublic School
1 34.8 0.0 0.02 40.3 0.0 24.23 42.9 0.0 38.14 35.2 0.0 34.65 34.5 0.0 26.36 37.0 0.0 0.07 0.0 0.0 0.08 25.0 30.5 29.39 28.8 0.0 29.210 33.3 0.0 0.011 43.0 39.8 39.812 49.7 45.5 40.513 58.1 58.2 41.414 59.7 42.1 43.115 42.9 39.0 36.716 42.4 42.8 38.617 38.9 25.7 29.018 56.7 50.5 46.419 61.2 49.5 55.320 59.8 49.9 52.321 55.8 50.6 54.622 57.5 34.4 38.323 28.7 0.0 0.024 37.6 0.0 28.225 62.7 54.1 45.526 52.4 38.0 52.227 65.9 45.9 59.428 63.3 50.7 50.529 63.5 44.3 55.730 42.4 32.5 43.831 39.3 0.0 30.6
The logarithmic average of the LAeq aircraft noise events at each of the community-basedNMT locations for the month of January 2010 are as follows:
Grahamstown Public School NMT 57.1 dB(A)Salt Ash Public School NMT 47.2 dB(A)Wirreanda Public School NMT 49.1 dB(A)
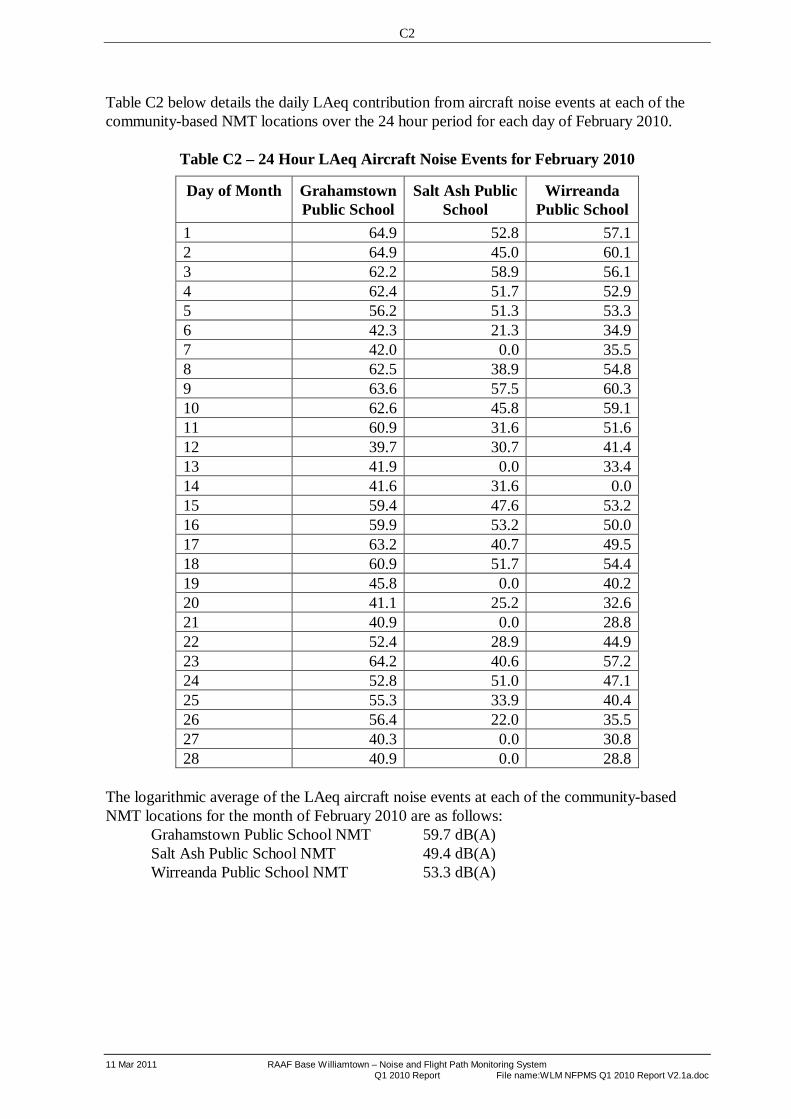
C2
11 Mar 2011 RAAF Base Williamtown – Noise and Flight Path Monitoring SystemQ1 2010 Report File name:WLM NFPMS Q1 2010 Report V2.1a.doc
Table C2 below details the daily LAeq contribution from aircraft noise events at each of thecommunity-based NMT locations over the 24 hour period for each day of February 2010.
Table C2 – 24 Hour LAeq Aircraft Noise Events for February 2010
Day of Month GrahamstownPublic School
Salt Ash PublicSchool
WirreandaPublic School
1 64.9 52.8 57.12 64.9 45.0 60.13 62.2 58.9 56.14 62.4 51.7 52.95 56.2 51.3 53.36 42.3 21.3 34.97 42.0 0.0 35.58 62.5 38.9 54.89 63.6 57.5 60.310 62.6 45.8 59.111 60.9 31.6 51.612 39.7 30.7 41.413 41.9 0.0 33.414 41.6 31.6 0.015 59.4 47.6 53.216 59.9 53.2 50.017 63.2 40.7 49.518 60.9 51.7 54.419 45.8 0.0 40.220 41.1 25.2 32.621 40.9 0.0 28.822 52.4 28.9 44.923 64.2 40.6 57.224 52.8 51.0 47.125 55.3 33.9 40.426 56.4 22.0 35.527 40.3 0.0 30.828 40.9 0.0 28.8
The logarithmic average of the LAeq aircraft noise events at each of the community-basedNMT locations for the month of February 2010 are as follows:
Grahamstown Public School NMT 59.7 dB(A)Salt Ash Public School NMT 49.4 dB(A)Wirreanda Public School NMT 53.3 dB(A)
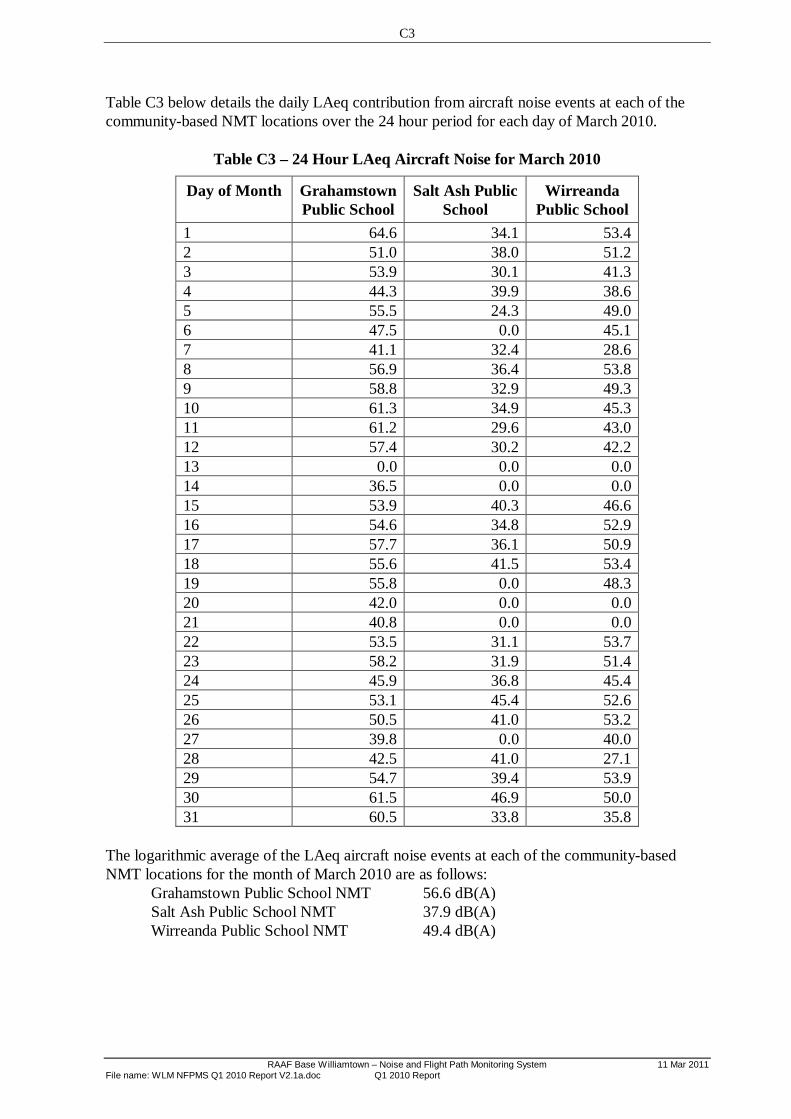
C3
RAAF Base Williamtown – Noise and Flight Path Monitoring System 11 Mar 2011File name: WLM NFPMS Q1 2010 Report V2.1a.doc Q1 2010 Report
Table C3 below details the daily LAeq contribution from aircraft noise events at each of thecommunity-based NMT locations over the 24 hour period for each day of March 2010.
Table C3 – 24 Hour LAeq Aircraft Noise for March 2010
Day of Month GrahamstownPublic School
Salt Ash PublicSchool
WirreandaPublic School
1 64.6 34.1 53.42 51.0 38.0 51.23 53.9 30.1 41.34 44.3 39.9 38.65 55.5 24.3 49.06 47.5 0.0 45.17 41.1 32.4 28.68 56.9 36.4 53.89 58.8 32.9 49.310 61.3 34.9 45.311 61.2 29.6 43.012 57.4 30.2 42.213 0.0 0.0 0.014 36.5 0.0 0.015 53.9 40.3 46.616 54.6 34.8 52.917 57.7 36.1 50.918 55.6 41.5 53.419 55.8 0.0 48.320 42.0 0.0 0.021 40.8 0.0 0.022 53.5 31.1 53.723 58.2 31.9 51.424 45.9 36.8 45.425 53.1 45.4 52.626 50.5 41.0 53.227 39.8 0.0 40.028 42.5 41.0 27.129 54.7 39.4 53.930 61.5 46.9 50.031 60.5 33.8 35.8
The logarithmic average of the LAeq aircraft noise events at each of the community-basedNMT locations for the month of March 2010 are as follows:
Grahamstown Public School NMT 56.6 dB(A)Salt Ash Public School NMT 37.9 dB(A)Wirreanda Public School NMT 49.4 dB(A)
C4
11 Mar 2011 RAAF Base Williamtown – Noise and Flight Path Monitoring SystemQ1 2010 Report File name:WLM NFPMS Q1 2010 Report V2.1a.doc
Maximum Aircraft Noise Events
Tables C4 to C6 details the maximum noise levels recorded by the WLM NFPMS at each ofthe three community-based NMT locations. The average LAmax value is the arithmeticaverage of all the recorded aircraft noise events. The tables show noise events for aircraft thatare based at RAAF Base Williamtown or regularly operate from RAAF Base Williamtown.
The Standard Deviation of a data set is defined as the square root of the variance. It is awidely used parameter for the variability or dispersion of data points from the mean (arithmeticaverage). A low standard deviation indicates that the data points tend to be very closetogether, whereas a high standard deviation indicates that the data points are spread over alarge range of values.
AS2021-2000 specifies for the purpose of noise control the use of the “Aircraft noise level” –the average maximum noise level which is determined for each aircraft type on the specificflight mode or track relevant to the receiver location. The NFPMS report does not provide“Aircraft noise levels” as defined in AS2021-2000.
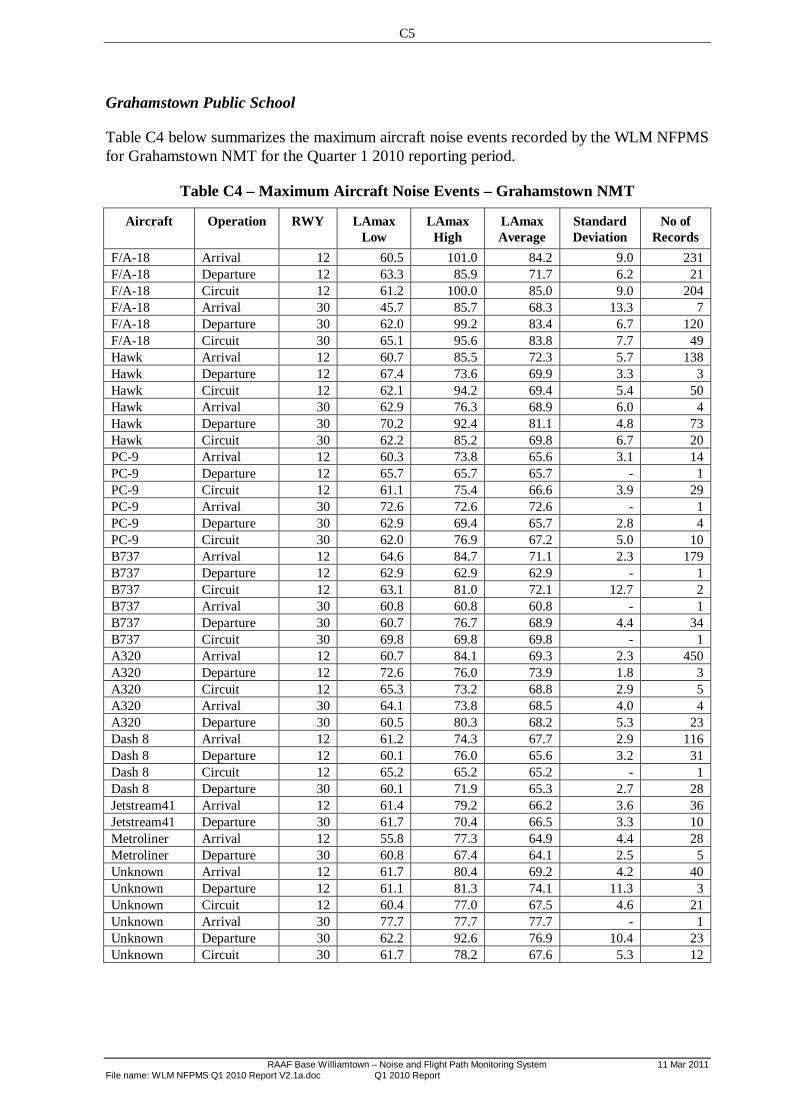
C5
RAAF Base Williamtown – Noise and Flight Path Monitoring System 11 Mar 2011File name: WLM NFPMS Q1 2010 Report V2.1a.doc Q1 2010 Report
Grahamstown Public School
Table C4 below summarizes the maximum aircraft noise events recorded by the WLM NFPMSfor Grahamstown NMT for the Quarter 1 2010 reporting period.
Table C4 – Maximum Aircraft Noise Events – Grahamstown NMT
Aircraft Operation RWY LAmaxLow
LAmaxHigh
LAmaxAverage
StandardDeviation
No ofRecords
F/A-18 Arrival 12 60.5 101.0 84.2 9.0 231F/A-18 Departure 12 63.3 85.9 71.7 6.2 21F/A-18 Circuit 12 61.2 100.0 85.0 9.0 204F/A-18 Arrival 30 45.7 85.7 68.3 13.3 7F/A-18 Departure 30 62.0 99.2 83.4 6.7 120F/A-18 Circuit 30 65.1 95.6 83.8 7.7 49Hawk Arrival 12 60.7 85.5 72.3 5.7 138Hawk Departure 12 67.4 73.6 69.9 3.3 3Hawk Circuit 12 62.1 94.2 69.4 5.4 50Hawk Arrival 30 62.9 76.3 68.9 6.0 4Hawk Departure 30 70.2 92.4 81.1 4.8 73Hawk Circuit 30 62.2 85.2 69.8 6.7 20PC-9 Arrival 12 60.3 73.8 65.6 3.1 14PC-9 Departure 12 65.7 65.7 65.7 - 1PC-9 Circuit 12 61.1 75.4 66.6 3.9 29PC-9 Arrival 30 72.6 72.6 72.6 - 1PC-9 Departure 30 62.9 69.4 65.7 2.8 4PC-9 Circuit 30 62.0 76.9 67.2 5.0 10B737 Arrival 12 64.6 84.7 71.1 2.3 179B737 Departure 12 62.9 62.9 62.9 - 1B737 Circuit 12 63.1 81.0 72.1 12.7 2B737 Arrival 30 60.8 60.8 60.8 - 1B737 Departure 30 60.7 76.7 68.9 4.4 34B737 Circuit 30 69.8 69.8 69.8 - 1A320 Arrival 12 60.7 84.1 69.3 2.3 450A320 Departure 12 72.6 76.0 73.9 1.8 3A320 Circuit 12 65.3 73.2 68.8 2.9 5A320 Arrival 30 64.1 73.8 68.5 4.0 4A320 Departure 30 60.5 80.3 68.2 5.3 23Dash 8 Arrival 12 61.2 74.3 67.7 2.9 116Dash 8 Departure 12 60.1 76.0 65.6 3.2 31Dash 8 Circuit 12 65.2 65.2 65.2 - 1Dash 8 Departure 30 60.1 71.9 65.3 2.7 28Jetstream41 Arrival 12 61.4 79.2 66.2 3.6 36Jetstream41 Departure 30 61.7 70.4 66.5 3.3 10Metroliner Arrival 12 55.8 77.3 64.9 4.4 28Metroliner Departure 30 60.8 67.4 64.1 2.5 5Unknown Arrival 12 61.7 80.4 69.2 4.2 40Unknown Departure 12 61.1 81.3 74.1 11.3 3Unknown Circuit 12 60.4 77.0 67.5 4.6 21Unknown Arrival 30 77.7 77.7 77.7 - 1Unknown Departure 30 62.2 92.6 76.9 10.4 23Unknown Circuit 30 61.7 78.2 67.6 5.3 12

C6
11 Mar 2011 RAAF Base Williamtown – Noise and Flight Path Monitoring SystemQ1 2010 Report File name:WLM NFPMS Q1 2010 Report V2.1a.doc
Salt Ash Public School
Table C5 below summarizes the maximum aircraft noise events recorded by the WLM NFPMSfor the Salt Ash NMT for the Quarter 1 2010 reporting period.
Table C5 – Maximum Aircraft Noise Events – Salt Ash NMT
Aircraft Operation RWY LAmaxLow
LAmaxHigh
LAmaxAverage
StandardDeviation
No ofRecords
F/A-18 Arrival 12 62.0 87.0 73.1 6.7 26F/A-18 Departure 12 60.2 87.7 70.7 8.0 93F/A-18 Circuit 12 60.8 73.1 65.7 4.1 10F/A-18 Arrival 30 62.9 81.9 69.5 6.8 6F/A-18 Departure 30 59.8 86.8 72.6 7.7 54F/A-18 Circuit 30 61.4 77.5 67.6 6.1 7Hawk Arrival 12 62.8 62.8 62.8 - 1Hawk Departure 12 60.7 87.0 66.4 5.0 46Hawk Circuit 12 61.2 74.7 66.1 4.0 10Hawk Arrival 30 60.4 76.2 66.7 5.8 7Hawk Departure 30 62.8 79.3 69.9 5.5 15Hawk Circuit 30 61.1 76.0 69.4 4.8 7PC-9 Departure 12 59.9 66.1 63.2 2.8 8PC-9 Circuit 12 61.1 67.4 63.4 2.4 5PC-9 Departure 30 67.9 71.1 69.1 1.8 3PC-9 Circuit 30 60.2 68.7 64.5 2.8 8B737 Arrival 12 63.5 63.5 63.5 - 1B737 Departure 12 67.3 67.3 67.3 - 1B737 Arrival 30 61.6 72.2 67.3 4.0 12A320 Departure 12 60.3 85.1 65.1 4.0 45A320 Circuit 12 62.5 76.3 67.3 5.4 9Dash 8 Departure 12 61.2 76.1 66.8 4.2 19Dash 8 Arrival 30 63.6 70.9 66.4 3.0 5Jetstream41 Arrival 12 62.1 62.1 62.1 - 1Metroliner Arrival 30 70.0 70.0 70.0 - 1Unknown Arrival 12 61.4 72.2 65.8 3.6 10Unknown Departure 12 60.7 71.0 66.4 3.2 15Unknown Circuit 12 60.7 76.1 65.9 3.6 30Unknown Arrival 30 62.9 66.8 65.1 1.6 4Unknown Departure 30 61.9 67.1 64.4 2.0 8Unknown Circuit 30 61.6 73.6 65.0 3.8 8
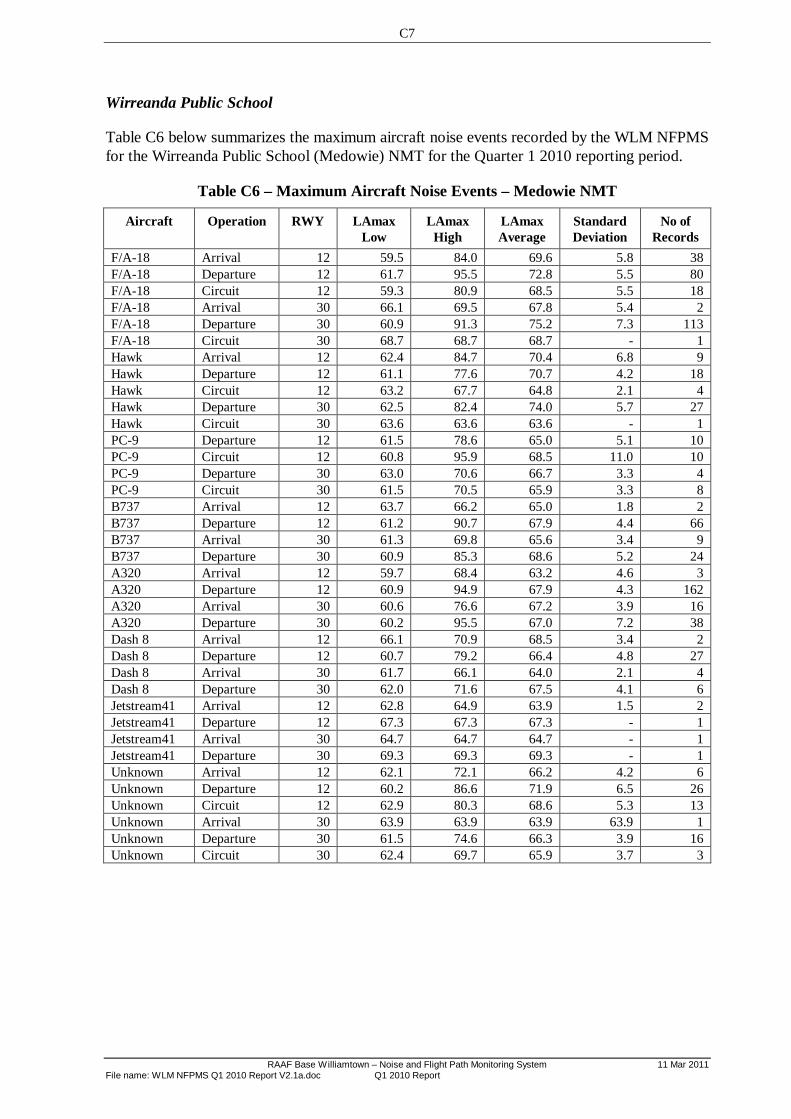
C7
RAAF Base Williamtown – Noise and Flight Path Monitoring System 11 Mar 2011File name: WLM NFPMS Q1 2010 Report V2.1a.doc Q1 2010 Report
Wirreanda Public School
Table C6 below summarizes the maximum aircraft noise events recorded by the WLM NFPMSfor the Wirreanda Public School (Medowie) NMT for the Quarter 1 2010 reporting period.
Table C6 – Maximum Aircraft Noise Events – Medowie NMT
Aircraft Operation RWY LAmaxLow
LAmaxHigh
LAmaxAverage
StandardDeviation
No ofRecords
F/A-18 Arrival 12 59.5 84.0 69.6 5.8 38F/A-18 Departure 12 61.7 95.5 72.8 5.5 80F/A-18 Circuit 12 59.3 80.9 68.5 5.5 18F/A-18 Arrival 30 66.1 69.5 67.8 5.4 2F/A-18 Departure 30 60.9 91.3 75.2 7.3 113F/A-18 Circuit 30 68.7 68.7 68.7 - 1Hawk Arrival 12 62.4 84.7 70.4 6.8 9Hawk Departure 12 61.1 77.6 70.7 4.2 18Hawk Circuit 12 63.2 67.7 64.8 2.1 4Hawk Departure 30 62.5 82.4 74.0 5.7 27Hawk Circuit 30 63.6 63.6 63.6 - 1PC-9 Departure 12 61.5 78.6 65.0 5.1 10PC-9 Circuit 12 60.8 95.9 68.5 11.0 10PC-9 Departure 30 63.0 70.6 66.7 3.3 4PC-9 Circuit 30 61.5 70.5 65.9 3.3 8B737 Arrival 12 63.7 66.2 65.0 1.8 2B737 Departure 12 61.2 90.7 67.9 4.4 66B737 Arrival 30 61.3 69.8 65.6 3.4 9B737 Departure 30 60.9 85.3 68.6 5.2 24A320 Arrival 12 59.7 68.4 63.2 4.6 3A320 Departure 12 60.9 94.9 67.9 4.3 162A320 Arrival 30 60.6 76.6 67.2 3.9 16A320 Departure 30 60.2 95.5 67.0 7.2 38Dash 8 Arrival 12 66.1 70.9 68.5 3.4 2Dash 8 Departure 12 60.7 79.2 66.4 4.8 27Dash 8 Arrival 30 61.7 66.1 64.0 2.1 4Dash 8 Departure 30 62.0 71.6 67.5 4.1 6Jetstream41 Arrival 12 62.8 64.9 63.9 1.5 2Jetstream41 Departure 12 67.3 67.3 67.3 - 1Jetstream41 Arrival 30 64.7 64.7 64.7 - 1Jetstream41 Departure 30 69.3 69.3 69.3 - 1Unknown Arrival 12 62.1 72.1 66.2 4.2 6Unknown Departure 12 60.2 86.6 71.9 6.5 26Unknown Circuit 12 62.9 80.3 68.6 5.3 13Unknown Arrival 30 63.9 63.9 63.9 63.9 1Unknown Departure 30 61.5 74.6 66.3 3.9 16Unknown Circuit 30 62.4 69.7 65.9 3.7 3