Embed Size (px)
Citation preview

1

Noel WhiteChief Executive Officer
2TYSON FOODS, INC. FEBRUARY 19, 2020
Forward-Looking Statements
Certain information in this report constitutes forward-looking statements. Such forward-looking statements include, but are not limited to, current views and estimates of our outlook for fiscal 2020, other future economic circumstances, industry conditions in domestic and international markets, our performance and financial results (e.g., debt levels, return on invested capital, value-added product growth, capital expenditures, tax rates, access to foreign markets and dividend policy). These forward-looking statements are subject to a number of factors and uncertainties that could cause our actual results and experiences to differmaterially from anticipated results and expectations expressed in such forward-looking statements. We wish to caution readers not to place undue reliance on any forward-looking statements, which speak only as of the date made. We undertake no obligation to update any forward-looking statements, whether as a result of new information, future events or otherwise. Among the factors that may cause actual results and experiences to differ from anticipated results and expectations expressed in such forward-looking statements are the following: (i) fluctuations in the cost and availability of inputs and raw materials, such as live cattle, live swine, feed grains (including corn and soybean meal) and energy; (ii) market conditions for finished products, including competition from other global and domestic food processors, supply and pricing of competing products and alternative proteinsand demand for alternative proteins; (iii) outbreak of a livestock disease (such as African swine fever (ASF), avian influenza (AI) or bovine spongiform encephalopathy (BSE)), which could have an adverse effect on livestock we own, the availability of livestock we purchase, consumer perception of certain protein products or our ability to access certain domestic and foreign markets; (iv) the effectiveness of our financial fitness program; (v) the implementation of an enterprise resource planning system; (vi)access to foreign markets together with foreign economic conditions, including currency fluctuations, import/export restrictionsand foreign politics; (vii) changes in availability and relative costs of labor and contract farmers and our ability to maintain good relationships with employees, labor unions, contract farmers and independent producers providing us livestock; (viii) issues related to food safety, including costs resulting from product recalls, regulatory compliance and any related claims or litigation; (ix) changes in consumer preference and diets and our ability to identify and react to consumer trends; (x) effectiveness of advertising and marketing programs; (xi) our ability to leverage brand value propositions; (xii) risks associated with leverage, including cost increases due to rising interest rates or changes in debt ratings or outlook; (xiii) impairment in the carrying value of our goodwill or indefinite life intangible assets; (xiv) compliance with and changes to regulations and laws (both domestic and foreign), including changes in accounting standards, tax laws, environmental laws, agricultural laws and occupational, health and safety laws; (xv) adverse results from litigation; (xvi) cyber incidents, security breaches or other disruptions of our information technology systems; (xvii) our ability to make effective acquisitions or joint ventures and successfully integrate newly acquired businesses into existing operations; (xviii) risks associated with our commodity purchasing activities; (xix) the effect of, or changes in, general economic conditions; (xx) significant marketing plan changes by large customers or loss of one or more large customers; (xxi) impacts on our operations caused by factors and forces beyond our control, such as natural disasters, fire, bioterrorism, pandemics or extreme weather; (xxii) failure to maximize or assert our intellectual property rights; (xxiii) our participation in multiemployer pension plans; (xxiv) the Tyson Limited Partnership’s ability to exercise significant control over the Company; (xxv) effects related to changes in tax rates, valuation of deferred tax assets and liabilities, or tax laws and their interpretation; (xxvi) volatility in capital markets or interest rates; (xxvii) risks associated with our failure to integrate Keystone Foods’ operations or to realize the targeted cost savings, revenues and other benefits of the acquisition; and (xxviii) those factors listed under Item 1A. “Risk Factors” included in our Annual Report filed on Form 10-K for the period ended September 28, 2019.

Uniquely positioned to meet growing protein demand
4
With our scale, diversified portfolio, international
footprint and track record of growth, Tyson Foods is
uniquely positioned for continued long-term growth
in an environment of growing global demand for
protein coupled with limited global supplies of beef,
pork and chicken.
TYSON FOODS, INC. FEBRUARY 19, 2020

Today’s Key Takeaways
Global demand for protein is growing
Our strengths position us to meet the world’s need for more protein
Our strategy capitalizes on our strengths
1
2
3
5TYSON FOODS, INC. FEBRUARY 19, 2020

Today’s Speakers
Stewart GlendinningEVP & CFO
Noel WhiteCEO
Dean BanksPresident
TYSON FOODS, INC. FEBRUARY 19, 2020 6

We operate in growing spaces
TYSON FOODS, INC. FEBRUARY 19, 2020 7
Product Portfolio

8
We are one of the largest food companiesFiscal 2019 Sales $42.4 Billion
36% 31% 10% 20% 3%
Beef Chicken Pork Prepared Foods International / Other
45% 31% 13% 11%
Consumer Products Foodservice International Industrial / Other
Sales by Segment
Sales by Distribution Channel
TYSON FOODS, INC. FEBRUARY 19, 2020

9
We know protein – leading market share
TYSON FOODS, INC. FEBRUARY 19, 2020
#1 #1 #3
21% 22%16%
Fed BeefSource: Cattle Buyers Weekly, 2018. Based on maximum U.S. capacity (head per day).
Source: Watt Poultry USA, March 2019. Based on ready-to-cook pounds produced.
Source: Kerns and Associates, September 2018 as reported in National Pork Board Quick Facts. Based on estimated daily U.S. capacity (head per day).

Global demand for protein is growing rapidly
TYSON FOODS, INC. FEBRUARY 19, 2020 10
+Disposable Income/GDP
growth
Increasing Modernization of Retailing and Food Service
Ongoing Urbanization
Population growth
+
+
Global demandGrowing over 5 years
45Bpounds
28B lbs. Chicken8B lbs. Beef9B lbs. Pork [
Source: Euromonitor

Global demand opportunity -As GDP rises, so does protein consumption
11
(2%)(1%)0%1%2%3%4%5%6%7%8%9%
10%
(1%) 0% 1% 2% 3% 4% 5% 6% 7% 8% 9% 10%
Japan
IndonesiaChina
South Africa ThailandHong Kong, China
Mexico
India
Malaysia
South Korea
Taiwan
Vietnam
Australia Poland
Russia
Ukraine
Argentina
Brazil
Colombia
Egypt
Philippines
Israel
Canada
Chile
Saudi Arabia
United Arab Emirates
USA
FranceGermany
Italy
Turkey
United Kingdom
Fres
h M
eat V
olum
e C
AG
R (2
005
–20
18)
Source: Euromonitor
GDP CAGR vs. Total Meat Volume CAGR (2005 –2018)
GDP CAGR (2005 – 2018)
r = 0.53
TYSON FOODS, INC. FEBRUARY 19, 2020

12TYSON FOODS, INC. FEBRUARY 19, 2020
2020U.S. Protein Production ~75 Billion Pounds
The opportunity is enormous
Tyson Foods~20% Share
U.S. Protein

13TYSON FOODS, INC. FEBRUARY 19, 2020
The opportunity is enormous
2020Global Protein Production 568 Billion Pounds
Data Source: Euromonitor

14TYSON FOODS, INC. FEBRUARY 19, 2020
The opportunity is enormous
2025Global Protein Production
Data Source: Euromonitor

The opportunity is enormous
2050Global Protein Production
Data Source: Euromonitor

TYSON FOODS, INC. FEBRUARY 19, 2020
The opportunity is enormous
2050Global Protein Production
Data Source: EuromonitorExtrapolated from current U.S. market shareFor illustrative purposes only

Our strengths position us to meet the world’s need for protein
• Diverse protein portfolio
• Scale
• Leading market positions and brands
• Powerful Innovation Platform
• Deep customer relationships
• Growing global footprint
• Strong sustainability platform
Opportunity to Differentiate
• Strength across all meal occasions and protein demand
• Achieve low cost production and fulfillment along with superior distribution channel coverage
• Leverage brand equity and trust to win with consumers
• Partner with large customers to leverage our portfolio globally
• Deliver protein at global scale and do it in a sustainable manner
TYSON FOODS, INC. FEBRUARY 19, 2020 17
Strengths

Our scale allows us to invest in critical capabilities
18
Insights &Innovation
Supply ChainNetwork
Technology
TYSON FOODS, INC. FEBRUARY 19, 2020
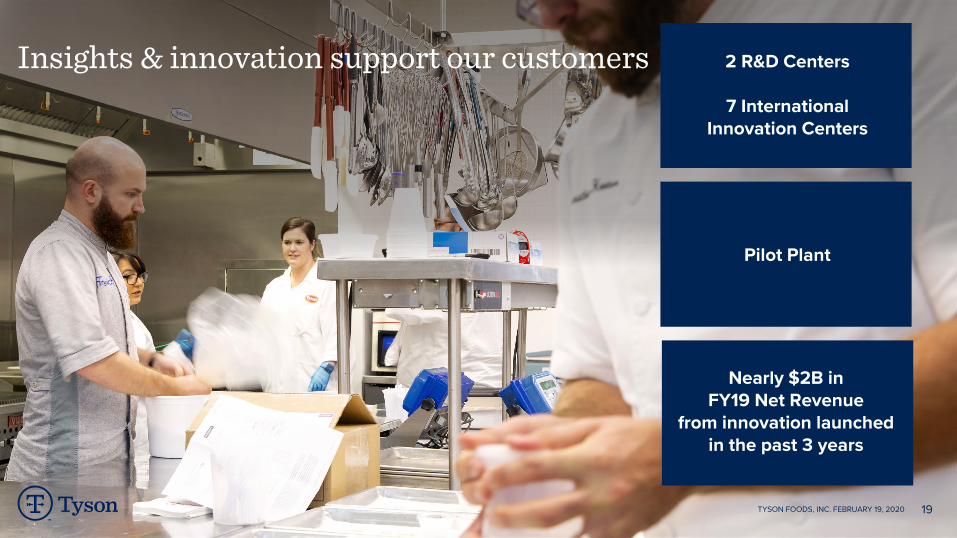
Insights & innovation support our customers
19TYSON FOODS, INC. FEBRUARY 19, 2020
2 R&D Centers
7 International Innovation Centers
Pilot Plant
Nearly $2B inFY19 Net Revenue
from innovation launchedin the past 3 years
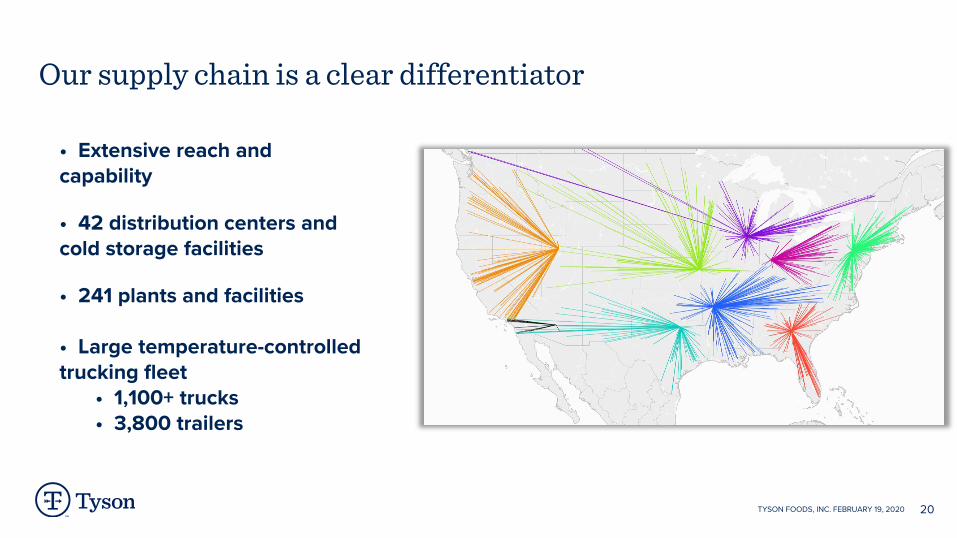
Our supply chain is a clear differentiator
20
• Extensive reach and capability
• 42 distribution centers and cold storage facilities
• 241 plants and facilities
• Large temperature-controlled trucking fleet
• 1,100+ trucks• 3,800 trailers
TYSON FOODS, INC. FEBRUARY 19, 2020

Scale enables investment in technology
21
Robotics & Automation
Manufacturing and Automation
Center
AdvancedAnalytics
MachineLearning
TYSON FOODS, INC. FEBRUARY 19, 2020

Iconic leading brands and rapid growth brands
22
Emerging Brands Iconic Brands
TYSON FOODS, INC. FEBRUARY 19, 2020

We have deep customer relationships
23TYSON FOODS, INC. FEBRUARY 19, 2020
Consumer Products: 150+ Category captainships
Foodservice: Leader in new product development
All channels: consumer insights and innovation leads to sales growth, margin growth and repeat business

Sustainability with a global approach
24TYSON FOODS, INC. FEBRUARY 19, 2020
ESG Commitments:
• 30% reduction in GHG emissions by 2030Approved by Science-Based Targets Initiative
• 12% reduction in water use intensity by 2020
• Support improved environmental practices on2 million acres of corn by the end of 2020
• ProForest partnership on deforestation riskassessment across our global agriculture supply chain
• Coalition for Global Protein™

WORKING DRAFTLast Modified 4/27/2018 8:43 PM Central Standard TimePrinted 4/27/2018 11:08 AM Central Standard Time
Grow Deliver SustainOur business by delivering
superior value to consumers and customers
Savings for growth and returns through commercial, operational and financial
excellence
Our company and our world for future generations
Our strategy
26TYSON FOODS, INC. FEBRUARY 19, 2020

Dean BanksPresident
27TYSON FOODS, INC. FEBRUARY 19, 2020
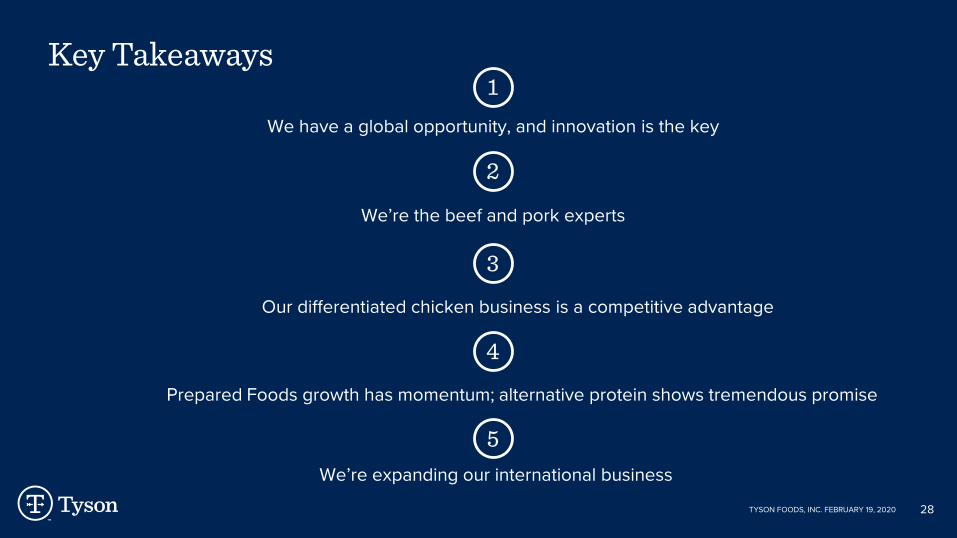
Key Takeaways
We have a global opportunity, and innovation is the key
We’re the beef and pork experts
Prepared Foods growth has momentum; alternative protein shows tremendous promise
1
2
3
28
4
Our differentiated chicken business is a competitive advantage
TYSON FOODS, INC. FEBRUARY 19, 2020
We’re expanding our international business
5

Beef & Pork
TYSON FOODS, INC. FEBRUARY 19, 2020 29

We are the Beef & Pork experts
The onlyAmerican-ownedsupplier of bothbeef and pork
Trusted leader in the meat industry for 60 years
Leadingcustomer brand and private label
supplier
Differentiators: KnowledgeExpertise
Production capabilities
TYSON FOODS, INC. FEBRUARY 19, 2020 30

Case-ready growth opportunity
TYSON FOODS, INC. FEBRUARY 19, 2020 31
~50%of current U.S. meat sales are
case-ready products
Then Now
0
500
1,000
1,500
2,000
2,500
3,000
3,500
4,000
2004 2005 2006 2007 2008 2009 2010 2011 2012 2013 2014 2015 2016 2017 2018 2019 2020E0%
5%
10%
15%
20%
25%
30%
35%
40%
Exports Exports % of Production
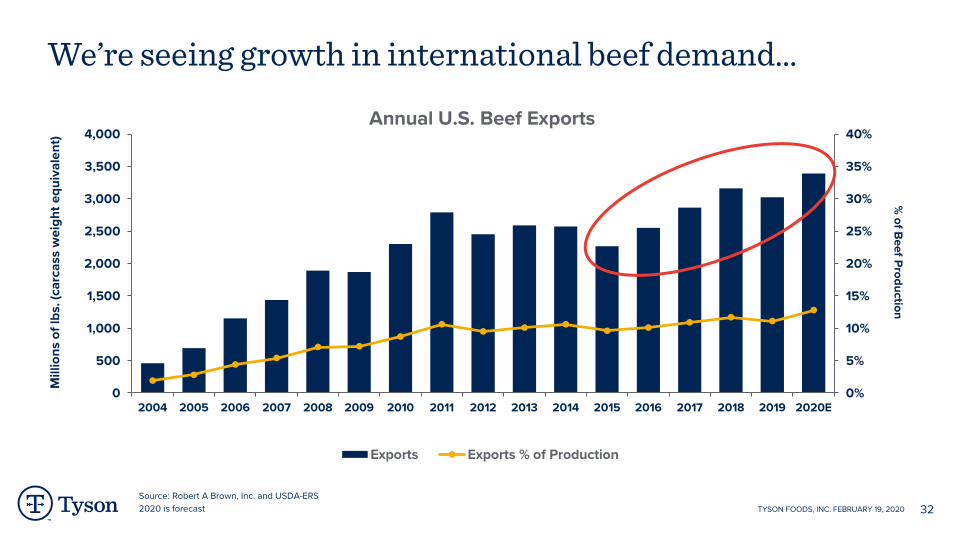
We’re seeing growth in international beef demand…
Annual U.S. Beef Exports
Mill
ions
of l
bs. (
carc
ass
wei
ght e
quiv
alen
t)%
of Beef Production
Source: Robert A Brown, Inc. and USDA-ERS2020 is forecast TYSON FOODS, INC. FEBRUARY 19, 2020 32
0
1,000
2,000
3,000
4,000
5,000
6,000
7,000
8,000
9,000
10,000
2004 2005 2006 2007 2008 2009 2010 2011 2012 2013 2014 2015 2016 2017 2018 2019 2020E0%
5%
10%
15%
20%
25%
30%
35%
40%
45%
50%
Exports Exports % of Production
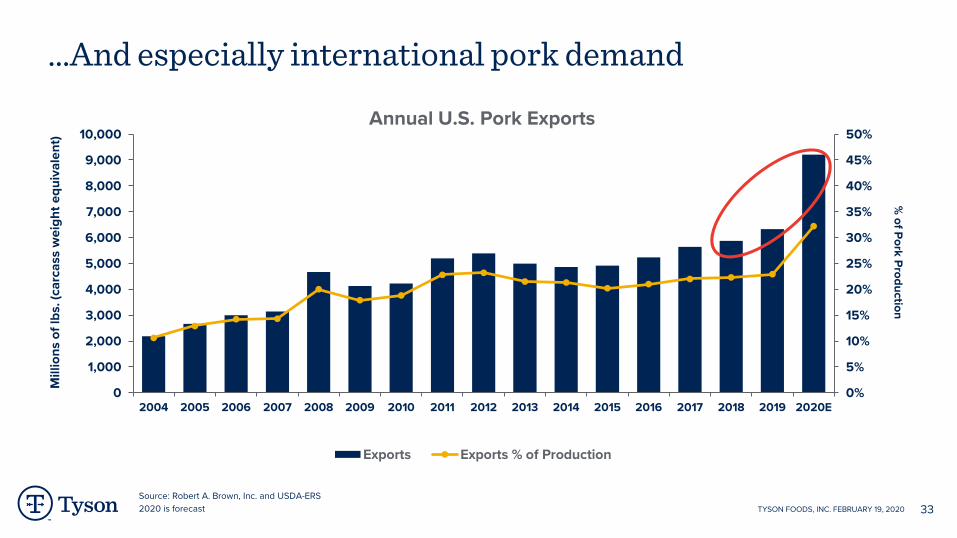
…And especially international pork demand
Annual U.S. Pork Exports
% of Pork Production
Source: Robert A. Brown, Inc. and USDA-ERS2020 is forecast
Mill
ions
of l
bs. (
carc
ass
wei
ght e
quiv
alen
t)
TYSON FOODS, INC. FEBRUARY 19, 2020 33

~5% of global protein supply could be eliminated
Likely to bea multi-year event
We’re seeing early effects of African Swine Fever
TYSON FOODS, INC. FEBRUARY 19, 2020 34
Estimated loss of >35% of the Chinese pork supply (’17 vs. ’20)
Wholesale pork prices at record highs in China, EU and Brazil
Global reallocation occurringacross all proteins
China now world’s largest importer of beef
Tyson pork exports up ~600% in fiscalQ1’20 vs. Q1’19.
Source: Rabobank

35
Chicken
TYSON FOODS, INC. FEBRUARY 19, 2020
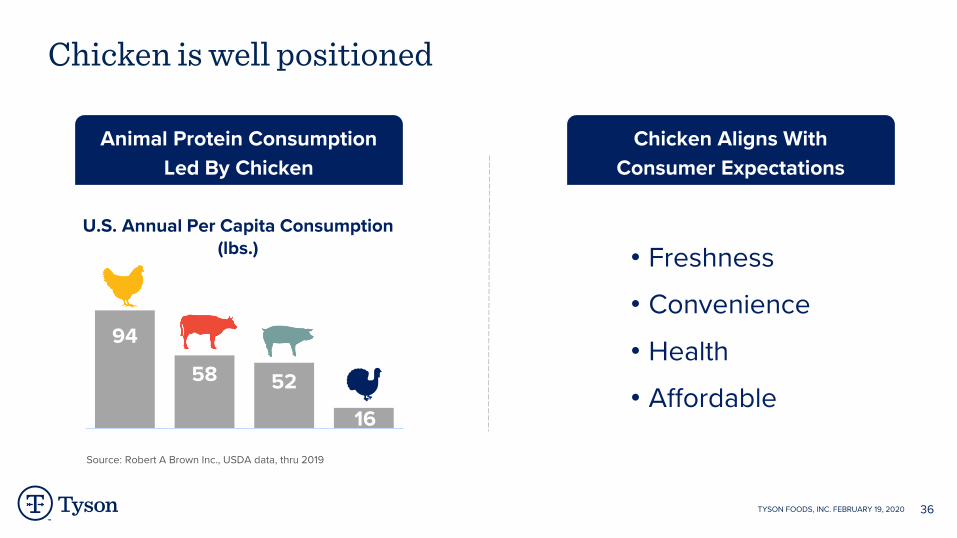
Chicken is well positioned
TYSON FOODS, INC. FEBRUARY 19, 2020
• Freshness
• Convenience
• Health
• Affordable
Animal Protein Consumption Led By Chicken
Chicken Aligns WithConsumer Expectations
U.S. Annual Per Capita Consumption (lbs.)
94
58 52
16020406080
100
Chicken Beef Pork TurkeySource: Robert A Brown Inc., USDA data, thru 2019
36

37TYSON FOODS, INC. FEBRUARY 19, 2020
Advantaged Portfolio & Innovation
Diverse Go-To-Market Strategy
Key Metrics: Value-added Volume, Net Sales, Margin Growth, AOI, ROS
Leading Broiler Producer in the US
50+ plants37+ MM head/week
Tyson chicken’s proven and sustainable business model
Capacity
SUPPLYDEMAND
Best In Class Process & Capabilities
Customer Demand
Raw Materials
Buy vs. Grow
Deliver to Customer Sales &
Operating Plan
Capacity

38
Flexible structure to continually value up
Based on FY19 Chicken segment sales, excluding CobbTYSON FOODS, INC. FEBRUARY 19, 2020
Domestic & International• Premium Pet
Snacks• Aquaculture
Consumer Facing
Deli & Fast Food• Select Fast Food• Hot Case Deli• Rotisserie
Retail & Foodservice• Quick Service
Restaurants• K-12• Hospital• Casual Dining
Grocery• Fresh Tray Pack• Individually Quick
Frozen• Cornish
Tray Pack
20-25%of Chicken segment sales
Small Bird
15-20%of Chicken segment sales
Big Bird /Retail
45-50%of Chicken segment sales
Tyson Ingredient Solutions
5-10%of Chicken segment sales
Rendering

Tyson chicken portfolio is well balanced and diverse
39TYSON FOODS, INC. FEBRUARY 19, 2020
Product Categories Tyson Competitor A Competitor B Competitor C
Tray Pack
Small Bird
Big Bird - Value added
Ingredient Solutions
Genetics

Global leader in poultry genetics
40TYSON FOODS, INC. FEBRUARY 19, 2020
Where Cobb products are sold

New chicken product innovation
41TYSON FOODS, INC. FEBRUARY 19, 2020

Prepared Foods
42TYSON FOODS, INC. FEBRUARY 19, 2020
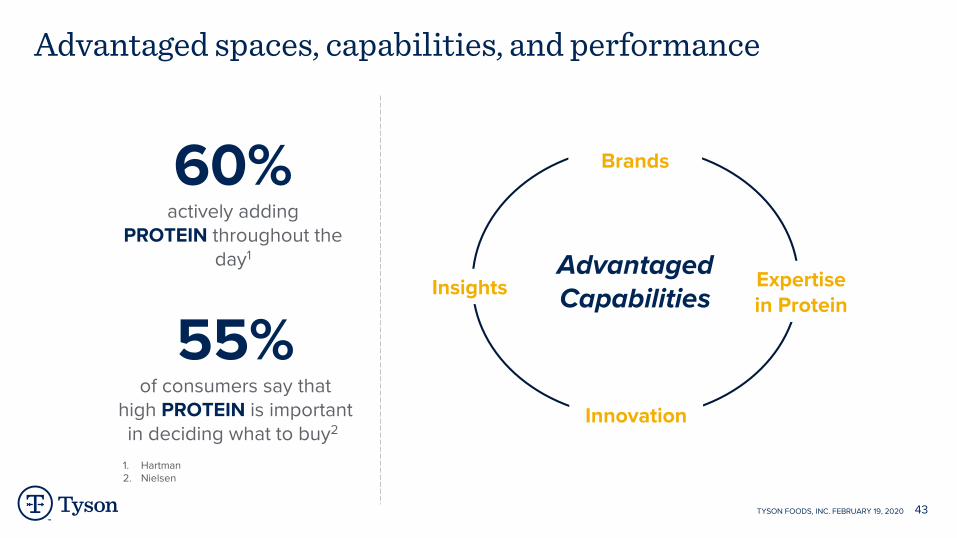
Advantaged spaces, capabilities, and performance
60%actively adding
PROTEIN throughout the day1
Insights
Brands
Expertise in Protein
Innovation
AdvantagedCapabilities
55%of consumers say that
high PROTEIN is importantin deciding what to buy2
1. Hartman2. Nielsen
43TYSON FOODS, INC. FEBRUARY 19, 2020

Volume Sales % Chg. among top 10 branded food companies > $5B
-0.4%
5.2%
3.4%
1.9%0.9% 0.9%
0.1%
-0.2%
-1.6% -1.6%
-3.5% -3.6%
Total F&B
Total Tyson
Core Bus. Lines
Source: Nielsen Fixed Weight Volume EQ Sales 52 weeks ending 12/28/2019Product = Total F&P, Alcohol + Total U.S. xAOC Pet Food
Tyson Core Business Lines = Aidells Dinner Sausage, Hillshire Farm Dinner Sausage, Hillshire Farm Lunchmeat, Ball Park Hot Dogs,Jimmy Dean Frozen Protein Breakfast, Jimmy Dean Breakfast Sausage, Wright/Jimmy Dean/Tyson Bacon, Tyson Frozen Value-Added Poultry, State Fair Corn Dogs, Tyson Pet Treats, Tyson Snacking
Tyson leads in retail volume growth
44TYSON FOODS, INC. FEBRUARY 19, 2020
Tyson has delivered 6 consecutive quarters of growth

Portfolio of powerhouse brands
80%HOUSEHOLDPENETRATION
45TYSON FOODS, INC. FEBRUARY 19, 2020
Source: Nielsen

Brand strength
1.4xhigher average unaided
awareness for Tyson leading brands vs. competition1
1.6xmore likely for a Tyson leading
brand to be chosen as their “favorite” by consumers than competitor brands2
1. Source: Tyson Brand Health Tracking, Q1 FY20202. Source: Tyson Brand Health Tracking, Q1 FY2020
46TYSON FOODS, INC. FEBRUARY 19, 2020

Brand Growth
47TYSON FOODS, INC. FEBRUARY 19, 2020
0
0.5
1
1.5
2
2.5
2017 2018 2019
Jimmy Dean Sales $ Growth
BILLION
S
+19.1%
0
0.1
0.2
0.3
0.4
0.5
0.6
2017 2018 2019
Hillshire Farm Sales $ Growth
+9.2%
BILLION
SSource: Nielsen, most recent three calendar years, ending 2019

81%72% 68%
59% 59% 58%48%
38%
19%
40% 40%
26%15%
25% 26%
5%
24%31%
24%10% 9% 4%
Category HH Penetration Brand HH Penetration
SOURCE: Nielsen a) National Consumer Panel 52 weeks ending 12/28/2019 b)Total US All Outlet Combined for 52 weeks ending 12/28/2019 1 Stack Pack Bacon Segment 2 Super-premium smoked sausage segment; 3 Adult Combos 4 Natural Meat Pet Treats Segment
Branded $ SharePosition
#2 #11 #1 #1 #1 #12 #1 #1
YOY Category $ Growth
#1
+3.6%+0.4% +3.5% +1% +5.4% +5.4% +2.4% +3.9% -0.3%
#23
+7.2% +7.5%
#14
Room for more growth
TYSON FOODS, INC. FEBRUARY 19, 2020 49
Lunchmeat Bacon Hot DogsSmokedSausage
SmokedSausage
BreakfastSausage
FrozenPreparedChicken
FrozenProtein
BreakfastFrozen
Corn Dogs Snacking Pet Treats
POTENTIAL{

Innovation growth engine
50TYSON FOODS, INC. FEBRUARY 19, 2020

⅔fresh is
important
Innovation in Fresh Food
51TYSON FOODS, INC. FEBRUARY 19, 2020
OF PEOPLE SAY
Source: Hartman group 2018
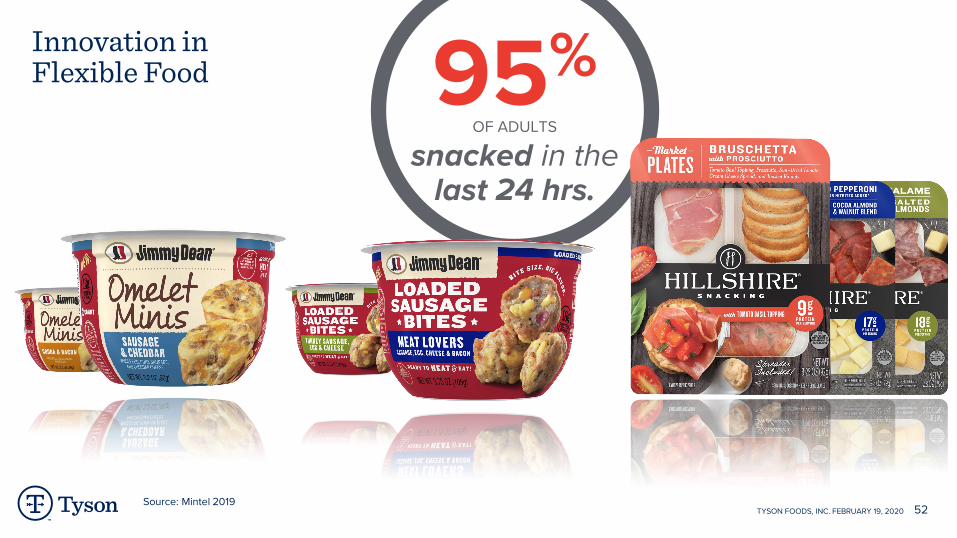
Innovation in Flexible Food
52TYSON FOODS, INC. FEBRUARY 19, 2020
95%snacked in the
last 24 hrs.
OF ADULTS
Source: Mintel 2019

Innovation in Functional Food
53TYSON FOODS, INC. FEBRUARY 19, 2020
2/3seek functional
benefits
OF PEOPLE SAY
Source: Proactive health white paper –Kerry Foods 2018

TYSON FOODS, INC. FEBRUARY 19, 2020 54
Beyond the buzz: significant incremental potential in alternative protein
SOURCE: Hartman Group & Tyson Foods: Consumer Opportunity Areas for Plant-Based Protein, 2018

Excellent products in <1yr
Raised & Rooted – Tyson advantages in action
TYSON FOODS, INC. FEBRUARY 19, 2020 55
Launched at scale Available widely

TYSON FOODS, INC. FEBRUARY 19, 2020 56
International
56TYSON FOODS, INC. FEBRUARY 19, 2020

International strategic purpose
TYSON FOODS, INC. FEBRUARY 19, 2020 57
Drive growth in key demand marketswith locally relevant products,
enabled through a strategic supply chain to serve our customers as OneTyson

International growth model
58
existing production footprint
global sourcing model
for growth through acquisition
OPTIMIZE LEVERAGEINVEST
TYSON FOODS, INC. FEBRUARY 19, 2020

Trade agreements
TYSON FOODS, INC. JUNE 20, 2019 5959

5-year International growth
60TYSON FOODS, INC. FEBRUARY 19, 2020
$0
$1,000
$2,000
$3,000
$4,000
$5,000
$6,000
$7,000
FY16 FY17 FY18 FY19 Q1 FY20 LTMSales of Exports & In-Country Production
(In m
illio
ns)
12.3%CAGR

Global Production Footprint
61TYSON FOODS, INC. FEBRUARY 19, 2020

Our products are sold in 140+ countries around the world
62TYSON FOODS, INC. FEBRUARY 19, 2020

63

Stewart GlendinningExecutive Vice President & Chief Financial Officer
TYSON FOODS, INC. FEBRUARY 19, 2020 64

Key Takeaways
History of strong financial performance
Significant cash generation
Disciplined approach to capital allocation
We are focused on our return of capital employed
1
2
3
4
TYSON FOODS, INC. FEBRUARY 19, 2020 65
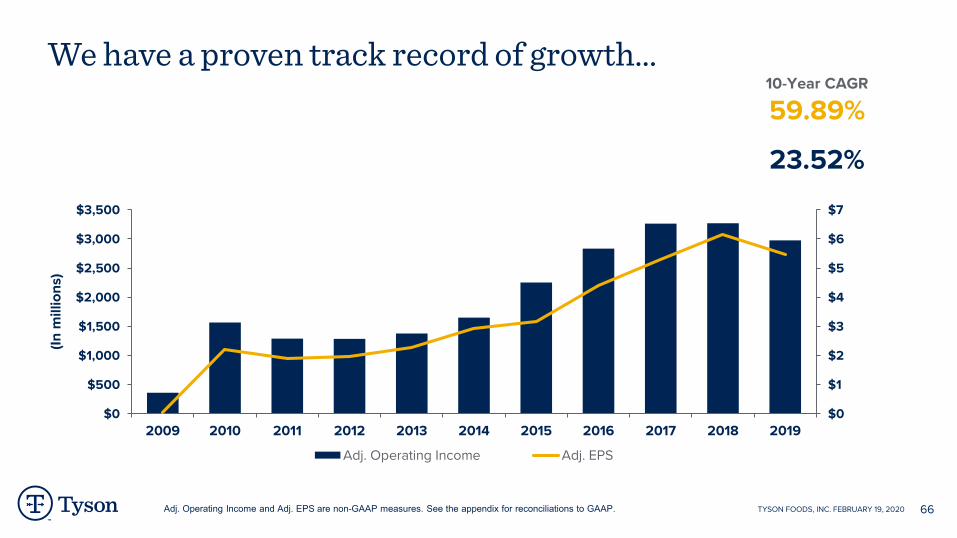
We have a proven track record of growth…
$0
$1
$2
$3
$4
$5
$6
$7
2009 2010 2011 2012 2013 2014 2015 2016 2017 2018 2019$0
$500
$1,000
$1,500
$2,000
$2,500
$3,000
$3,500
Adj. Operating Income Adj. EPS
23.52%
(In m
illio
ns)
59.89%10-Year CAGR
Adj. Operating Income and Adj. EPS are non-GAAP measures. See the appendix for reconciliations to GAAP. TYSON FOODS, INC. FEBRUARY 19, 2020 66

Tyson leads in total shareholder return
0%
200%
400%
600%
800%
1000%
TSN HRL HSY PPC MDLZ PEP KO CAG SJM GIS CPB ADM K BG KHC
Source: Bloomberg.TSR = Current Share Price / Beginning Share Price + Accumulated Dividends Per Share Re-Invested Reflects activity during the period 12/31/09 to 12/27/19.
N/A
TYSON FOODS, INC. FEBRUARY 19, 2020 67

Delivering strong cash returns while investing in our business
68
6.0%
7.0%
8.0%
9.0%
10.0%
11.0%
12.0%
$0
$500
$1,000
$1,500
$2,000
$2,500
$3,000
$3,500
FY15 FY16 FY17 FY18 FY19
Net Cash Generated Cash Returns
(In m
illio
ns)
Net cash generated and cash returns are non-GAAP measures. See the appendix for calculations and reconciliations to GAAP.FY15 measures were based on a 53-week year while FY16, FY17, FY18 & FY19 were based on 52-week years TYSON FOODS, INC. FEBRUARY 19, 2020

Capital allocation strategy
Repurchase our shares
Fund our dividend
commitments
Invest in our growth
Reduce / maintain
debt levels
TYSON FOODS, INC. FEBRUARY 19, 2020 69

How we use our cash
FY15 FY16 FY17 FY18 FY190x
1x
2x
3x
Net Debt to Adjusted EBITDA
FY15 FY16 FY17 FY18 FY190
300
600
900
1,200
1,500Capital Expenditures
FY15 FY16 FY17 FY18 FY190
100
200
300
400
500
Dividends
FY15 FY16 FY17 FY18 FY190
500
1,000
1,500
2,000
Share Repurchases
Net Debt and Adj. EBITDA are non-GAAP measures. See the appendix for reconciliations to GAAP. TYSON FOODS, INC. FEBRUARY 19, 2020 70$
in m
illio
ns
$ in
mill
ions
$ in
mill
ions

Scale & Synergy
New Capabilities
New Brands
New Geographies + New Markets
We continue to look for strategic acquisitions
TYSON FOODS, INC. FEBRUARY 19, 2020 71

We’ve consistently demonstrated M&A success
JUNE 2017
$3.2B
NOVEMBER 2018
$2.3B
JUNE2019
$326M
AUGUST2014
$8.2B $382M
JUNE2018
Thailand, EU
$864M
AUGUST2018
American Proteins assets
TYSON FOODS, INC. FEBRUARY 19, 2020 72

Financial goals
Createlong-term
shareholder value
Maintain a disciplined
approach toward strategic M&A
Maintain a strong balance sheet for optionality
Reduce leverage to 2.0x
Investment grade credit ratings
TYSON FOODS, INC. FEBRUARY 19, 2020 73

High Single DigitAdjusted EPS Growth
>3%
Financial goals
Value Added Sales Volume Growth
Achieve over time:
TYSON FOODS, INC. FEBRUARY 19, 2020 74
Investment thesis
With our scale, diversified portfolio, international
footprint and track record of growth, Tyson Foods is
uniquely positioned for continued long-term growth
in an environment of growing global demand for
protein coupled with limited global supplies of beef,
pork and chicken.
TYSON FOODS, INC. FEBRUARY 19, 2020 75

Grow. Deliver. Sustain.
TYSON FOODS, INC. JUNE 20, 2019 76

Appendix
TYSON FOODS, INC. FEBRUARY 19, 2020 77

Operating Income EPS
Operating Income EPS
Operating Income EPS
Operating Income EPS
Operating Income EPS
Reported 2,827$ 5.52$ 3,032$ 8.19$ 2,921$ 4.79$ 2,805$ 4.53$ 2,180$ 2.95$ Add: Keystone purchase accounting and acquisition related costs 37 0.08 - - - - - - - - Add: Beef production facility fire costs 31 0.06 - - - - - - - - Add: Pension plan termination charge - 0.03 - - - - - - - - Less: Gain on sale of investment - (0.11) - - - - - - - - Add: One-time cash bonus to frontline employees - - 109 0.22 - - - - - - Add: Restructuring and related charges 41 0.08 59 0.12 150 0.26 - - - - Add: Impairments net of realized gains associated with the divestitures of businesses
41 0.09 68 0.34 45 (0.01) - - - -
Add: San Diego Prepared Foods operation impairment - - - - 52 0.09 - - - - Add: AdvancePierre purchase accounting and acquisition related costs - - - - 85 0.18 - - - - Less: Tax benefit from remeasurement of net deferred tax liabilities at lower enacted tax rates
- - - (2.71) - - - - - -
Less: Recognition of previously unrecognized tax benefit and audit settlement - (0.29) - - - - - (0.14) - (0.06) Less: Insurance proceeds (net of costs) related to a legacy Hillshire Brands plant fire
- - - - - - - - (8) (0.02)
Less: Gain on sale of equity securities - - - - - - - - - (0.03) Less: Gain on sale of the Mexico operation - - - - - - - - (161) (0.24) Less: Impact of additional week - - - - - - - - (44) (0.06) Add: China Impairment - - - - - - - - 169 0.41 Add: Merger and integration costs - - - - - - - - 57 0.09 Add: Prepared Foods network optimization charges - - - - - - - - 59 0.09 Add: Denison plant closure - - - - - - - - 12 0.02 Adjusted 2,977$ 5.46$ 3,268$ 6.16$ 3,253$ 5.31$ 2,805$ 4.39$ 2,264$ 3.15$
October 1, 2016 October 3, 2015September 29, 2018 September 30, 2017September 28, 2019Fiscal Year Ended
Adjusted net income per share attributable to Tyson (Adjusted EPS) and adjusted operating income (Adjusted operated income) are presented as supplementary measures of our financial performance that are not required by, or presented in accordance with, GAAP. We use Adjusted EPS and Adjusted operating income as internal performance measurements and as two criteria for evaluating our performance relative to that of our peers. We believe Adjusted EPS and Adjusted operating income are meaningful to our investors to enhance their understanding of our financial performance and are frequently used by securities analysts, investors and other interested parties to compare our performance with the performance of other companies that report Adjusted EPS and Adjusted operating income. Further, we believe that Adjusted EPS and Adjusted operating income are useful measures because they improve comparability of results of operations from period to period. Adjusted EPS and Adjusted operating income should not be considered substitutes for net income per share attributable to Tyson, operating income or any other measure of financial performance reported in accordance with GAAP. Investors should rely primarily on our GAAP results and use non-GAAP financial measures only supplementally in making investment decisions. Our calculation of Adjusted EPS and Adjusted operating income may not be comparable to similarly titled measures reported by other companies.
TYSON FOODS, INC. FEBRUARY 19, 2020 78
Operating Income & EPS Reconciliations($ in millions, except per share data)(unaudited)
Continued on next page
Operating Income EPS
Operating Income EPS
Operating Income EPS
Operating Income EPS
Operating Income EPS
Operating Income (Loss) EPS
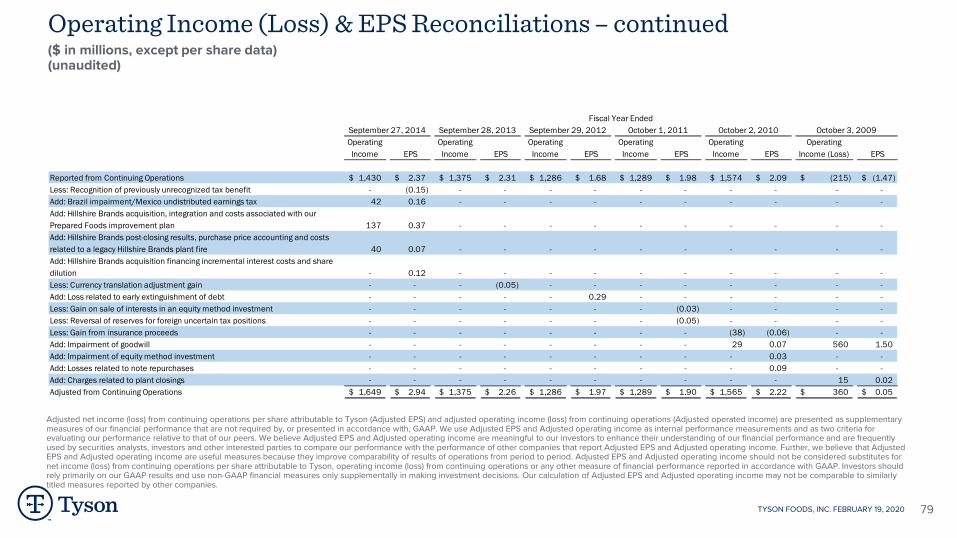
Reported from Continuing Operations 1,430$ 2.37$ 1,375$ 2.31$ 1,286$ 1.68$ 1,289$ 1.98$ 1,574$ 2.09$ (215)$ (1.47)$ Less: Recognition of previously unrecognized tax benefit - (0.15) - - - - - - - - - - Add: Brazil impairment/Mexico undistributed earnings tax 42 0.16 - - - - - - - - - - Add: Hillshire Brands acquisition, integration and costs associated with our Prepared Foods improvement plan 137 0.37 - - - - - - - - - - Add: Hillshire Brands post-closing results, purchase price accounting and costs related to a legacy Hillshire Brands plant fire 40 0.07 - - - - - - - - - - Add: Hillshire Brands acquisition financing incremental interest costs and share dilution - 0.12 - - - - - - - - - - Less: Currency translation adjustment gain - - - (0.05) - - - - - - - - Add: Loss related to early extinguishment of debt - - - - - 0.29 - - - - - - Less: Gain on sale of interests in an equity method investment - - - - - - - (0.03) - - - - Less: Reversal of reserves for foreign uncertain tax positions - - - - - - - (0.05) - - - - Less: Gain from insurance proceeds - - - - - - - - (38) (0.06) - - Add: Impairment of goodwill - - - - - - - - 29 0.07 560 1.50 Add: Impairment of equity method investment - - - - - - - - - 0.03 - - Add: Losses related to note repurchases - - - - - - - - - 0.09 - - Add: Charges related to plant closings - - - - - - - - - - 15 0.02 Adjusted from Continuing Operations 1,649$ 2.94$ 1,375$ 2.26$ 1,286$ 1.97$ 1,289$ 1.90$ 1,565$ 2.22$ 360$ 0.05$
October 3, 2009September 28, 2013 September 29, 2012 October 1, 2011 October 2, 2010September 27, 2014Fiscal Year Ended
Adjusted net income (loss) from continuing operations per share attributable to Tyson (Adjusted EPS) and adjusted operating income (loss) from continuing operations (Adjusted operated income) are presented as supplementary measures of our financial performance that are not required by, or presented in accordance with, GAAP. We use Adjusted EPS and Adjusted operating income as internal performance measurements and as two criteria for evaluating our performance relative to that of our peers. We believe Adjusted EPS and Adjusted operating income are meaningful to our investors to enhance their understanding of our financial performance and are frequently used by securities analysts, investors and other interested parties to compare our performance with the performance of other companies that report Adjusted EPS and Adjusted operating income. Further, we believe that Adjusted EPS and Adjusted operating income are useful measures because they improve comparability of results of operations from period to period. Adjusted EPS and Adjusted operating income should not be considered substitutes for net income (loss) from continuing operations per share attributable to Tyson, operating income (loss) from continuing operations or any other measure of financial performance reported in accordance with GAAP. Investors should rely primarily on our GAAP results and use non-GAAP financial measures only supplementally in making investment decisions. Our calculation of Adjusted EPS and Adjusted operating income may not be comparable to similarly titled measures reported by other companies.
TYSON FOODS, INC. FEBRUARY 19, 2020 79
Operating Income (Loss) & EPS Reconciliations – continued($ in millions, except per share data)(unaudited)
September 28, 2019 September 29, 2018 September 30, 2017 October 1, 2016 October 3, 2015 (a)
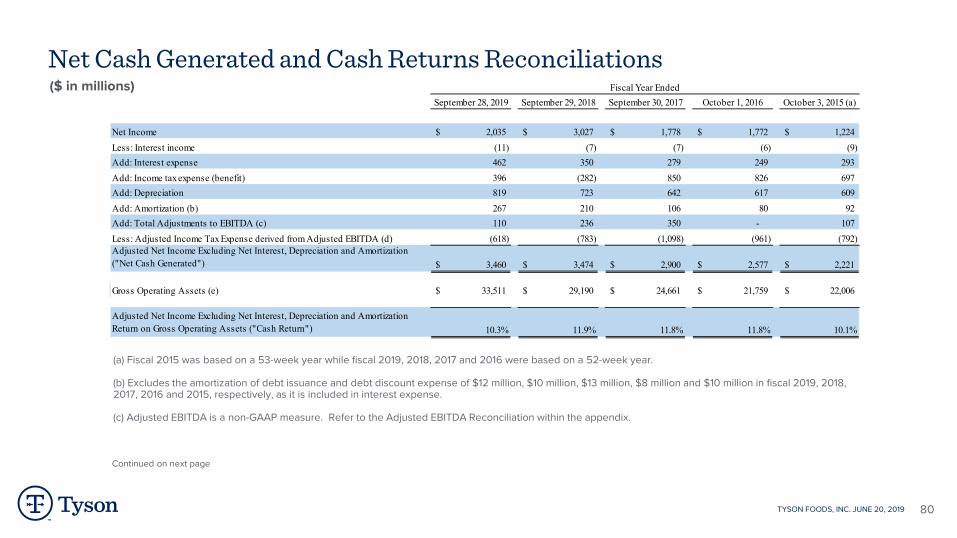
Net Income 2,035$ 3,027$ 1,778$ 1,772$ 1,224$ Less: Interest income (11) (7) (7) (6) (9) Add: Interest expense 462 350 279 249 293 Add: Income tax expense (benefit) 396 (282) 850 826 697 Add: Depreciation 819 723 642 617 609 Add: Amortization (b) 267 210 106 80 92 Add: Total Adjustments to EBITDA (c) 110 236 350 - 107 Less: Adjusted Income Tax Expense derived from Adjusted EBITDA (d) (618) (783) (1,098) (961) (792) Adjusted Net Income Excluding Net Interest, Depreciation and Amortization ("Net Cash Generated") 3,460$ 3,474$ 2,900$ 2,577$ 2,221$
Gross Operating Assets (e) 33,511$ 29,190$ 24,661$ 21,759$ 22,006$
Adjusted Net Income Excluding Net Interest, Depreciation and Amortization Return on Gross Operating Assets ("Cash Return") 10.3% 11.9% 11.8% 11.8% 10.1%
Fiscal Year Ended
TYSON FOODS, INC. JUNE 20, 2019 80
Net Cash Generated and Cash Returns Reconciliations
Continued on next page
($ in millions)
(a) Fiscal 2015 was based on a 53-week year while fiscal 2019, 2018, 2017 and 2016 were based on a 52-week year.
(b) Excludes the amortization of debt issuance and debt discount expense of $12 million, $10 million, $13 million, $8 million and $10 million in fiscal 2019, 2018, 2017, 2016 and 2015, respectively, as it is included in interest expense.
(c) Adjusted EBITDA is a non-GAAP measure. Refer to the Adjusted EBITDA Reconciliation within the appendix.

2019 2018 2017 2016 2015 (a)
Reported Income Tax Expense (Benefit) 396$ (282)$ 850$ 826$ 697$ Adjustments to Income Tax Expense (Benefit):Add: Keystone purchase accounting and acquisition related costs 8 - - - - Less: Gain on sale of investment (14) - - - - Add: Recognition of previously unrecognized tax benefit 105 - - 53 26 Add: Pension plan termination charge 4 - - - - Add/(Less): Impairments net of (realized gains) associated with the divestiture of businesses 8 (62) 48 - - Add: Beef production facility fire costs 8 - - - - Add: Restructuring and related charges 10 15 55 - - Add: Tax Benefit from Remeasurement of net deferred tax liabilities at lower enacted tax rates - 1,003 - - - Add: One-time cash bonus to frontline employees - 28 - - - Add: AdvancePierre purchase accounting and acquisition related costs - - 35 - - Add: San Diego Prepared Foods operation impairment - - 18 - - Add: Hillshire Brands merger and integration costs - - - - 19 Add: Prepared Foods network optimization impairment charges - - - - 21 Add: Denison plant closure - - - - 5 Less: Insurance proceeds, net of costs related to a legacy Hillshire Brands plant fire - - - - (3) Less: Gain on sale of the Mexico operation - - - - (63) Less: Gain on sale of equity securities - - - - (7) Total Adjustments to Income Tax Expense 129$ 984$ 156$ 53$ (2)$ Adjusted Income Tax Expense 525$ 702$ 1,006$ 879$ 695$
Add income tax expense derived from Net Interest Expense (from below) 93$ 81$ 92$ 82$ 97$ Adjusted Income Tax Expense derived from Adjusted EBITDA 618$ 783$ 1,098$ 961$ 792$
Fiscal Year Ended
TYSON FOODS, INC. JUNE 20, 2019 81
Net Cash Generated and Cash Returns Reconciliations – continued
Continued on next page
($ in millions)(d) Adjusted Income Tax Expense derived from Adjusted EBITDA is calculated as follows:
2019 2018 2017 2016 2015 (a)
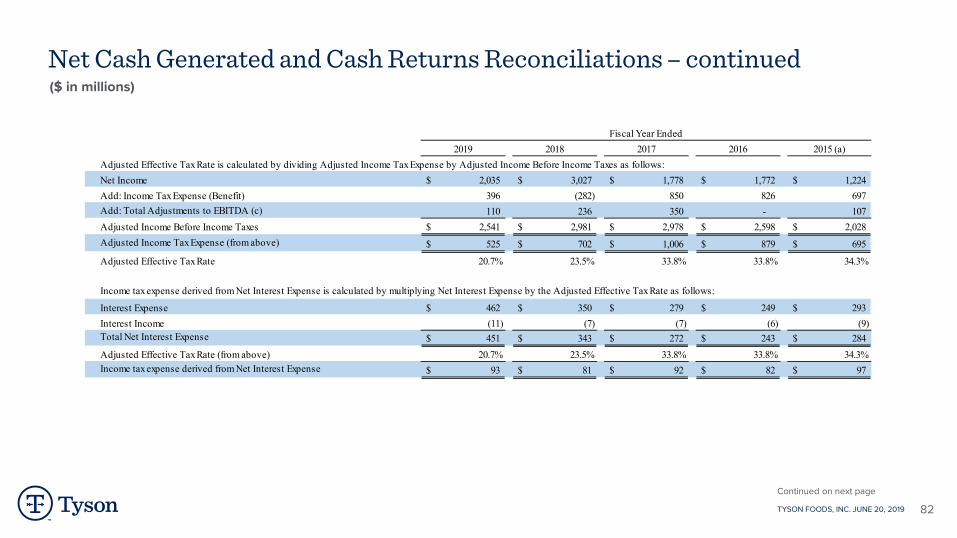
Net Income 2,035$ 3,027$ 1,778$ 1,772$ 1,224$ Add: Income Tax Expense (Benefit) 396 (282) 850 826 697Add: Total Adjustments to EBITDA (c) 110 236 350 - 107 Adjusted Income Before Income Taxes 2,541$ 2,981$ 2,978$ 2,598$ 2,028$ Adjusted Income Tax Expense (from above) 525$ 702$ 1,006$ 879$ 695$
Adjusted Effective Tax Rate 20.7% 23.5% 33.8% 33.8% 34.3%
Interest Expense 462$ 350$ 279$ 249$ 293$ Interest Income (11) (7) (7) (6) (9)Total Net Interest Expense 451$ 343$ 272$ 243$ 284$ Adjusted Effective Tax Rate (from above) 20.7% 23.5% 33.8% 33.8% 34.3%Income tax expense derived from Net Interest Expense 93$ 81$ 92$ 82$ 97$
Adjusted Effective Tax Rate is calculated by dividing Adjusted Income Tax Expense by Adjusted Income Before Income Taxes as follows:
Income tax expense derived from Net Interest Expense is calculated by multiplying Net Interest Expense by the Adjusted Effective Tax Rate as follows:
Fiscal Year Ended
TYSON FOODS, INC. JUNE 20, 2019 82
Net Cash Generated and Cash Returns Reconciliations – continued
Continued on next page
($ in millions)

December 29, 2018 March 30, 2019 June 29, 2019 September 28, 2019
Total Assets 32,335$ 32,498$ 33,665$ 33,097$ Less: Cash (400) (360) (406) (484) Add: Accumulated Depreciation 7,007 7,174 7,345 7,368 Add: Accumulated Amortization 599 667 737 727 Less: Current Liabilities (7,430) (4,614) (5,597) (5,513) Add: Current portion of Long-Term Debt 3,917 1,564 2,125 2,102 Less: Deferred Income Taxes (2,330) (2,278) (2,338) (2,356) Less: Other Non-current Liabilities (1,241) (1,238) (1,128) (1,172) Gross Operating Assets 32,457$ 33,413$ 34,403$ 33,769$ Average Quarterly Gross Operating Assets for Fiscal Year 33,511$
December 30, 2017 March 31, 2018 June 30, 2018 September 29, 2018
Total Assets 28,046$ 28,091$ 28,638$ 29,109$ Less: Cash (293) (198) (170) (270) Add: Accumulated Depreciation 6,499 6,641 6,747 6,866 Add: Accumulated Amortization 386 436 481 536 Less: Current Liabilities (3,978) (3,838) (4,112) (5,031) Add: Current portion of Long-Term Debt 811 1,128 1,308 1,911 Less: Deferred Income Taxes (2,013) (2,039) (2,050) (2,107) Less: Other Non-current Liabilities (1,206) (1,186) (1,187) (1,198) Gross Operating Assets 28,252$ 29,035$ 29,655$ 29,816$ Average Quarterly Gross Operating Assets for Fiscal Year 29,190$
Three Months Ended
Fiscal Year Ended September 28, 2019Three Months Ended
Fiscal Year Ended September 29, 2018
TYSON FOODS, INC. JUNE 20, 2019 83
Net Cash Generated and Cash Returns Reconciliations – continued($ in millions)
Continued on next page
(e) Gross Operating Assets is calculated as follows:

December 31, 2016 April 1, 2017 July 1, 2017 September 30, 2017
Total Assets 22,257$ 22,596$ 28,063$ 28,066$ Less: Cash (307) (243) (231) (318) Add: Accumulated Depreciation 6,114 6,217 6,275 6,374 Add: Accumulated Amortization 290 309 334 335 Less: Current Liabilities (2,972) (3,106) (3,865) (4,032) Add: Current portion of Long-Term Debt 66 543 1,017 906 Less: Deferred Income Taxes (2,538) (2,516) (2,989) (2,979) Less: Other Non-current Liabilities (1,279) (1,280) (1,265) (1,199) Gross Operating Assets 21,631$ 22,520$ 27,339$ 27,153$ Average Quarterly Gross Operating Assets for Fiscal Year 24,661$
January 2, 2016 April 2, 2016 July 2, 2016 October 1, 2016
Total Assets 23,290$ 22,511$ 22,410$ 22,373$ Less: Cash (1,187) (254) (197) (349) Add: Accumulated Depreciation 5,757 5,826 5,954 5,997 Add: Accumulated Amortization 211 231 252 271 Less: Current Liabilities (3,668) (2,610) (2,713) (2,762) Add: Current portion of Long-Term Debt 717 79 79 79 Less: Deferred Income Taxes (2,514) (2,516) (2,486) (2,545) Less: Other Non-current Liabilities (1,343) (1,308) (1,306) (1,242) Gross Operating Assets 21,263$ 21,959$ 21,993$ 21,822$ Average Quarterly Gross Operating Assets for Fiscal Year 21,759$
Fiscal Year Ended September 30, 2017Three Months Ended
Fiscal Year Ended October 1, 2016Three Months Ended
TYSON FOODS, INC. JUNE 20, 2019 84
Net Cash Generated and Cash Returns Reconciliations – continued($ in millions)
Continued on next page

December 27, 2014 March 28, 2015 June 27, 2015 October 3, 2015
Total Assets 23,758$ 23,526$ 23,443$ 22,969$ Less: Cash (381) (223) (471) (688) Add: Accumulated Depreciation 5,364 5,475 5,559 5,640 Add: Accumulated Amortization 156 179 202 192 Less: Current Liabilities (3,954) (4,051) (4,028) (3,535) Add: Current portion of Long-Term Debt 596 1,236 1,205 715 Less: Deferred Income Taxes (2,473) (2,452) (2,447) (2,449) Less: Other Non-current Liabilities (1,263) (1,215) (1,256) (1,304) Gross Operating Assets 21,803$ 22,475$ 22,207$ 21,540$ Average Quarterly Gross Operating Assets for Fiscal Year 22,006$
Fiscal Year Ended October 3, 2015Three Months Ended
TYSON FOODS, INC. JUNE 20, 2019 85
Net Cash Generated and Cash Returns Reconciliations – continued($ in millions)
Adjusted Net Income Excluding Net Interest, Depreciation and Amortization (“Net Cash Generated”) and Adjusted Net Income Excluding Net Interest, Deprecation and Amortization Return on Gross Operating Assets (“Cash Return”) are presented as supplementary measures of our financial performance that are not required by, or presented in accordance with, GAAP. Net Cash Generated is defined as Net Income, as adjusted, less Net Interest, Depreciation and Amortization. Cash Return represents the ratio of our Net Cash Generated to Gross Operating Assets. Gross Operating Assets is defined as Total Assets less Cash, Current Liabilities, Deferred Income Taxes and Other Non-Current Liabilities, plus Accumulated Depreciation, Accumulated Amortization and Current Portion of Long-Term Debt. We use Net Cash Generated and Cash Return to measure financial performance of economic profit and to make capital allocation decisions.
We believe the presentation of Net Cash Generated and Cash Return aids management in decision making utilizing performance measures that are not solely based on or driven by depreciation and amortization. Additionally, Net Cash Generated and Cash Return helps management and investors to assess our ability to generate after-tax earnings before Net Interest, Depreciation and Amortization relative to our Gross Operating Assets. The measurements of Net Cash Generated and Cash Return for the fiscal years presented may not be comparable to those of other companies, which limits their usefulness as comparative measures. Net Cash Generated and Cash Return for the fiscal years presented are not measures required by or calculated in accordance with GAAP and should not be considered as substitutes for net income or any other measure of financial performance reported in accordance with GAAP or as a measure of operating cash flow or liquidity. Investors should rely primarily on our GAAP results and use non-GAAP financial measures only supplementally in making investment decisions.

2019 2018 2017 2016 2015 (b)
Net income 2,035$ 3,027$ 1,778$ 1,772$ 1,224$ Less: Interest income (11) (7) (7) (6) (9) Add: Interest expense 462 350 279 249 293 Add: Income tax expense (benefit) 396 (282) 850 826 697 Add: Depreciation 819 723 642 617 609 Add: Amortization (a) 267 210 106 80 92 EBITDA 3,968$ 4,021$ 3,648$ 3,538$ 2,906$
Adjustments to EBITDA:Add: Keystone purchase accounting and acquisition related costs (c) 37$ -$ -$ -$ -$ Add: Beef production facility fire costs 31 - - - - Add: Pension plan termination charge 15 - - - - Less: Gain on sale of investment (55) - - - - Add: One-time cash bonus to frontline employees - 109 - - - Add: AdvancePierre purchase accounting and acquisition related costs (d) - - 103 - - Add: Impairments net of realized gains associated with the divestiture of businesses (e) 41 68 45 - - Add: Restructuring and related charges 41 59 150 - - Add: San Diego Prepared Foods operation impairment - - 52 - - Add: China Impairment - - - - 169 Add: Hillshire Brands merger and integration costs - - - - 57 Add: Prepared Foods network optimization impairment charges - - - - 59 Add: Denison plant closure - - - - 12 Less: Insurance proceeds, net of costs related to a legacy Hillshire Brands plant fire - - - - (8) Less: Gain on sale of the Mexico operation - - - - (161) Less: Gain on sale of equity securities - - - - (21) Total Adjustments to EBITDA 110$ 236$ 350$ -$ 107$
Adjusted EBITDA 4,078$ 4,257$ 3,998$ 3,538$ 3,013$
Total gross debt 11,932$ 9,873$ 10,203$ 6,279$ 6,690$ Less: Cash and cash equivalents (484) (270) (318) (349) (688) Less: Short-term investments (1) (1) (3) (4) (2) Total net debt 11,447$ 9,602$ 9,882$ 5,926$ 6,000$
Ratio Calculations:Gross debt/EBITDA 3.0x 2.5x 2.8x 1.8x 2.3xNet debt/EBITDA 2.9x 2.4x 2.7x 1.7x 2.1xGross debt/Adjusted EBITDA 2.9x 2.3x 2.6x 1.8x 2.2xNet debt/Adjusted EBITDA 2.8x 2.3x 2.5x 1.7x 2.0x
Fiscal Year Ended
TYSON FOODS, INC. FEBRUARY 19, 2020 86
Adjusted EBITDA Reconciliations($ in millions)(unaudited)
Continued on next page

(a) Excludes the amortization of debt issuance and debt discount expense of $12 million, $10 million, $13 million, $8 million and $10 million fiscal 2019, 2018, 2017, 2016 and 2015, respectively, as it is included in interest expense.
(b) Fiscal 2015 was based on a 53-week year while fiscal 2019, 2018, 2017 and 2016 were based on a 52-week year.
(c) Keystone acquisition and integration costs for the fiscal year 2019 included $11 million of purchase accounting adjustments and $26 million acquisition related costs.
(d) AdvancePierre acquisition and integration costs included $36 million of purchase accounting adjustments, $49 million acquisition related costs and $18 million of acquisition bridge financing fees.
(e) Fiscal year ended September 28, 2019, included a $41 million impairment associated with the planned divestiture of a business. Fiscal year ended September 29, 2018, included $101 million of impairments, net of $33 million realized gains, related to the divestiture of non-protein businesses. Fiscal year ended September 30, 2017, included an impairment related to the expected sale of a non-protein business of $45 million.
EBITDA is defined as net income before interest, income taxes, depreciation and amortization. Net debt to EBITDA (Adjusted EBITDA) represents the ratio of our debt, net of cash and short-term investments, to EBITDA (and to Adjusted EBITDA). EBITDA, Adjusted EBITDA, net debt to EBITDA and net debt to Adjusted EBITDA are presented as supplemental financial measurements in the evaluation of our business. Adjusted EBITDA is a tool intended to assist our management and investors in comparing our performance on a consistent basis for purposes of business decision-making by removing the impact of certain items that management believes do not directly reflect our core operations on an ongoing basis.
We believe the presentation of these financial measures helps management and investors to assess our operating performance from period to period, including our ability to generate earnings sufficient to service our debt, enhances understanding of our financial performance and highlights operational trends. These measures are widely used by investors and rating agencies in the valuation, comparison, rating and investment recommendations of companies; however, the measurements of EBITDA (and Adjusted EBITDA) and net debt to EBITDA (and to Adjusted EBITDA) for the fiscal years presented may not be comparable to those of other companies, which limits their usefulness as comparative measures. EBITDA (and Adjusted EBITDA) and net debt to EBITDA (and to Adjusted EBITDA) for the fiscal years presented are not measures required by or calculated in accordance with generally accepted accounting principles (GAAP) and should not be considered as substitutes for net income or any other measure of financial performance reported in accordance with GAAP or as a measure of operating cash flow or liquidity. EBITDA (and Adjusted EBITDA) is a useful tool for assessing, but is not a reliable indicator of, our ability to generate cash to service our debt obligations because certain of the items added to net income to determine EBITDA (and Adjusted EBITDA involve outlays of cash. As a result, actual cash available to service our debt obligations will be different from EBITDA (and Adjusted EBITDA). Investors should rely primarily on our GAAP results and use non-GAAP financial measures only supplementally in making investment decisions.
TYSON FOODS, INC. FEBRUARY 19, 2020 87
Adjusted EBITDA Reconciliations – continued