Embed Size (px)
Citation preview
Noel-Levitz
Student Satisfaction Survey Report
2012
Noel-Levitz Student Satisfaction Survey Report 2012 i Fox Valley Technical College
TABLE OF CONTENTS
Executive Summary
College Participation and Representation ................................................................... ii
Key Demographic Comparisons ................................................................................ iii
Key Findings ............................................................................................................... iv
Using The Results ...................................................................................................... vii
Interpretive Definitions and Descriptions
Purpose and Background ........................................................................................... viii
Survey Instrument ...................................................................................................... viii
Survey Reports ........................................................................................................... viii
Definition of Performance Gap ................................................................................. viii
Definition of Level of Significance .............................................................................. v
Limitations ................................................................................................................... ix
Acknowledgement ....................................................................................................... ix
Longitudinal Summaries
FVTC Longitudinal Demographic Summary ............................................................... 2
FVTC Longitudinal Institutional Summary.................................................................. 4
FVTC Fall 2011 to Fall 2009 Results Demographics 2011 Summary ..................................................................................... 6
Strategic Planning Overview ........................................................................................ 7
Institutional Summary Item Report ............................................................................. 9
Institutional Summary Scale Report .......................................................................... 12
Institutional Detail Summary Report ......................................................................... 13
Institutional Summary Report .................................................................................... 17
2011 FVTC VS Wisconsin Technical College System Colleges
Strategic Planning Overview ...................................................................................... 19
Institutional Summary Scale Report .......................................................................... 21
Institutional Detail Summary Report ......................................................................... 22
Institutional Summary Report .................................................................................... 25
2011 FVTC VS. National Community Colleges
Strategic Planning Overview ...................................................................................... 27
Institutional Summary Scale Report .......................................................................... 29
Institutional Detail Summary Report ......................................................................... 30
Institutional Summary Report .................................................................................... 33
Appendices
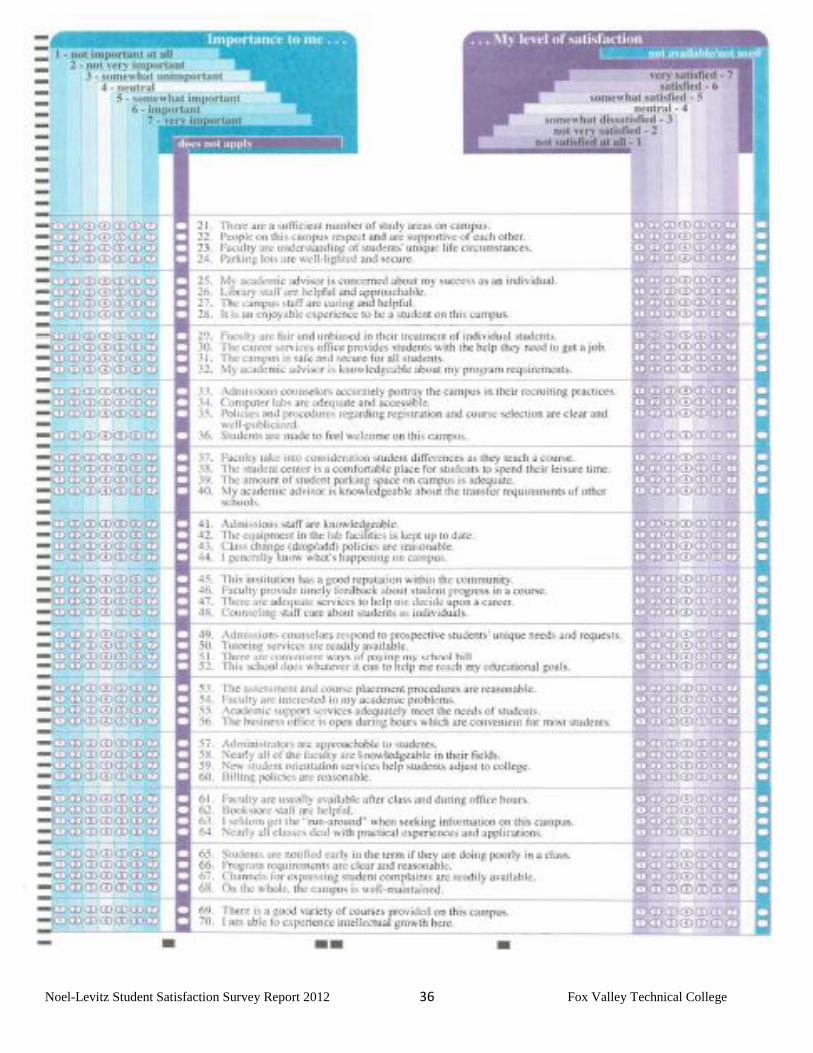
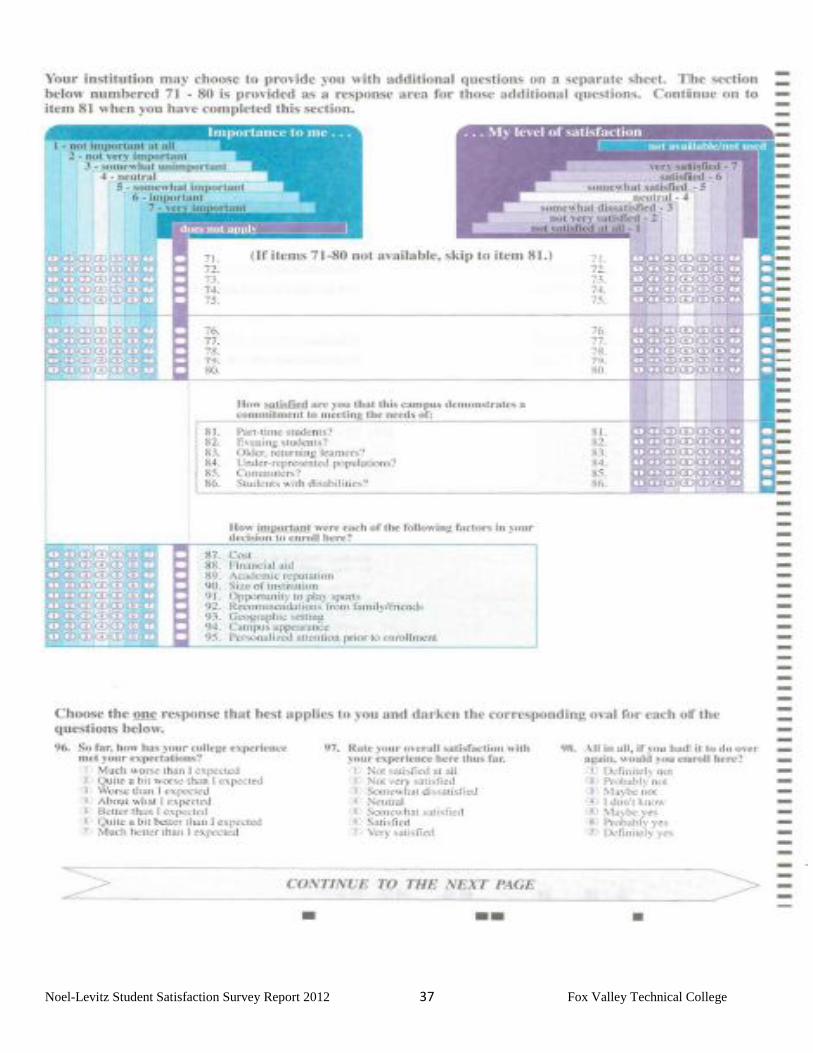
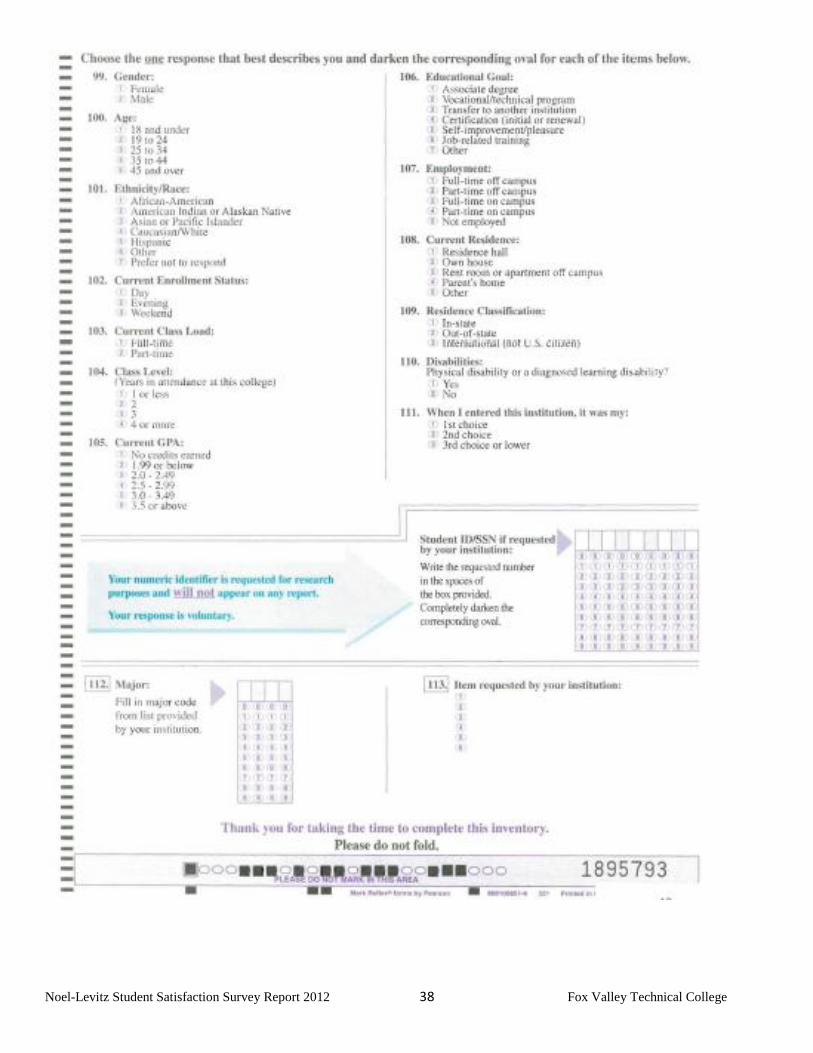
Student Satisfaction Inventory Survey Instrument ................................................... 35
Noel Levitz Student Satisfaction Campus Item List of Questions 2011 .................... 40
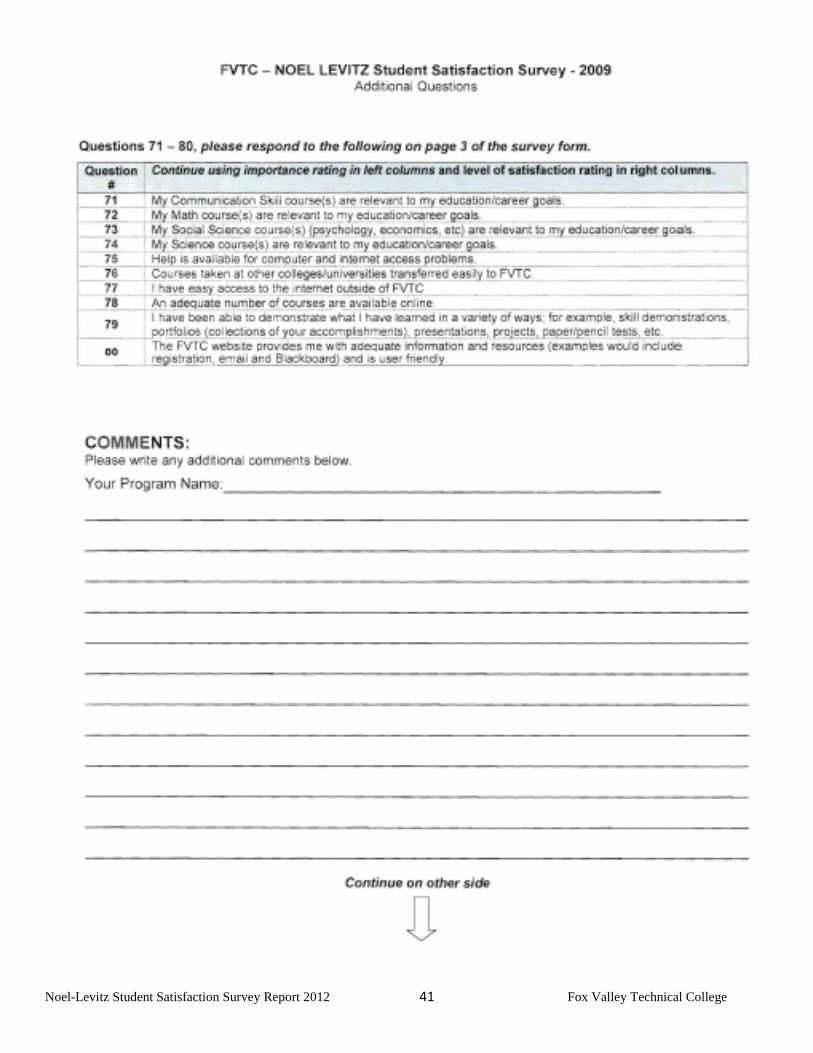
Noel Levitz Student Satisfaction Survey Additional Questions 2009 ....................... 41
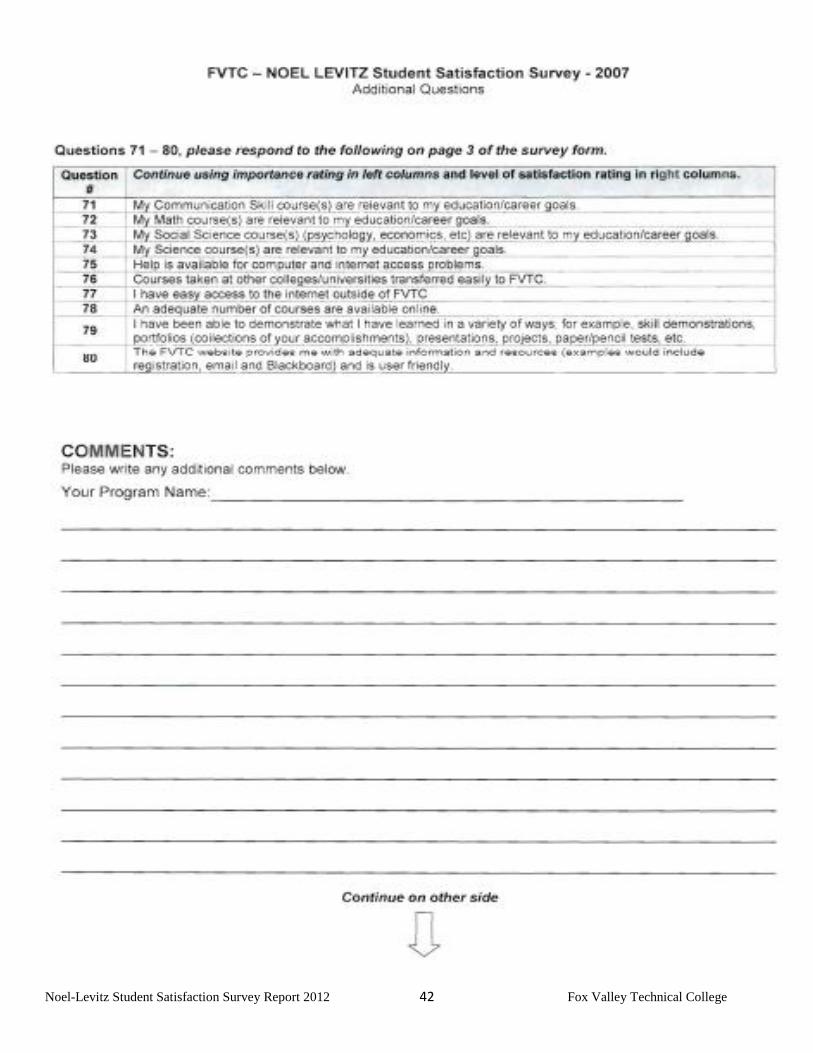
Noel Levitz Student Satisfaction Survey Additional Questions 2007 ....................... 42
Noel-Levitz Student Satisfaction Survey Report 2012 ii Fox Valley Technical College
Executive Summary
Fox Valley Technical College conducted the Noel-Levitz Student Satisfaction Inventory (SSI) in
November 2011 to evaluate academic, instructional and student support services from the students’
point of view. Program instructors distributed 2,432 paper copies within classrooms and 1,773 (72%)
completed the paper survey. Electronic invitations were emailed to 247 active students with 37
students (14%) completing the questionnaire online. A total of 1,810 responses provided an overall SSI
response rate of 68%. This report highlights the results of the SSI survey including college
participation and representation, key demographic longitudinal comparisons and key findings. The
results and findings will be used for student success initiatives, strategic planning and continuous
improvement.
College Participation and Representation
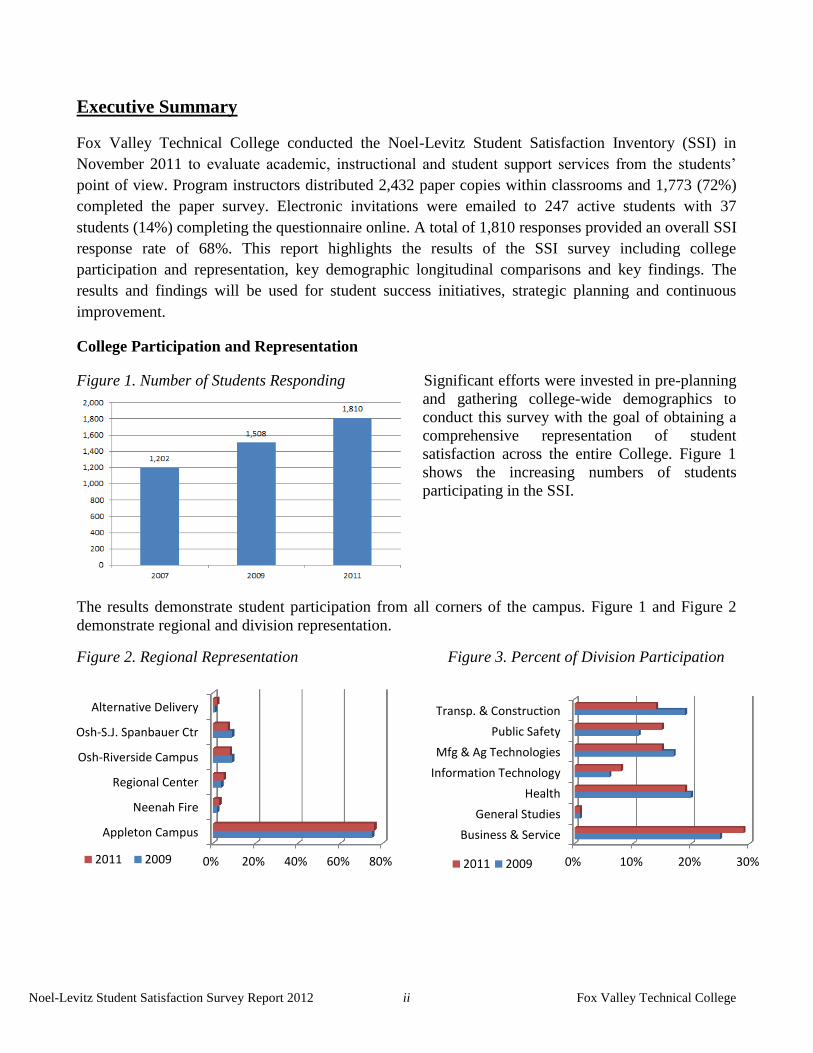
Figure 1. Number of Students Responding Significant efforts were invested in pre-planning
and gathering college-wide demographics to
conduct this survey with the goal of obtaining a
comprehensive representation of student
satisfaction across the entire College. Figure 1
shows the increasing numbers of students
participating in the SSI.
The results demonstrate student participation from all corners of the campus. Figure 1 and Figure 2
demonstrate regional and division representation.
Figure 2. Regional Representation Figure 3. Percent of Division Participation
0% 20% 40% 60% 80%
Appleton Campus
Neenah Fire
Regional Center
Osh-Riverside Campus
Osh-S.J. Spanbauer Ctr
Alternative Delivery
2011 2009 0% 10% 20% 30%
Business & Service
General Studies
Health
Information Technology
Mfg & Ag Technologies
Public Safety
Transp. & Construction
2011 2009
Noel-Levitz Student Satisfaction Survey Report 2012 iii Fox Valley Technical College
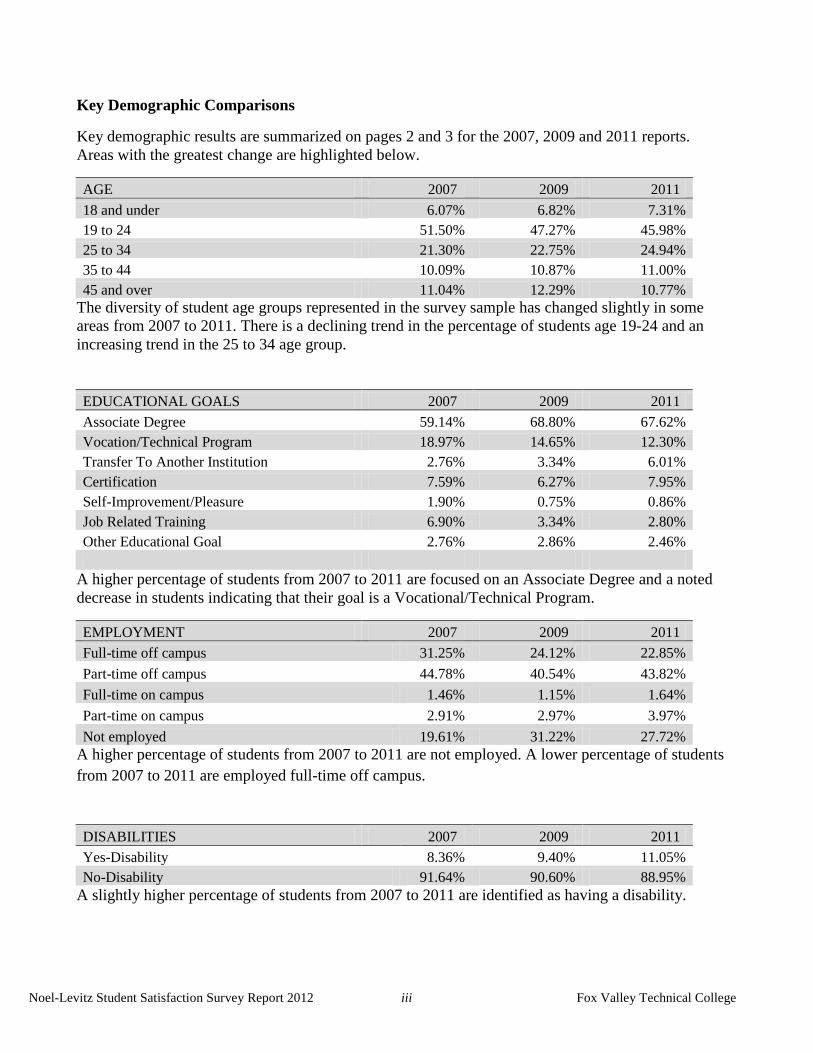
Key Demographic Comparisons
Key demographic results are summarized on pages 2 and 3 for the 2007, 2009 and 2011 reports.
Areas with the greatest change are highlighted below.
AGE 2007 2009 2011
18 and under 6.07% 6.82% 7.31%
19 to 24 51.50% 47.27% 45.98%
25 to 34 21.30% 22.75% 24.94%
35 to 44 10.09% 10.87% 11.00%
45 and over 11.04% 12.29% 10.77%
The diversity of student age groups represented in the survey sample has changed slightly in some
areas from 2007 to 2011. There is a declining trend in the percentage of students age 19-24 and an
increasing trend in the 25 to 34 age group.
EDUCATIONAL GOALS 2007 2009 2011
Associate Degree 59.14% 68.80% 67.62%
Vocation/Technical Program 18.97% 14.65% 12.30%
Transfer To Another Institution 2.76% 3.34% 6.01%
Certification 7.59% 6.27% 7.95%
Self-Improvement/Pleasure 1.90% 0.75% 0.86%
Job Related Training 6.90% 3.34% 2.80%
Other Educational Goal 2.76% 2.86% 2.46%
A higher percentage of students from 2007 to 2011 are focused on an Associate Degree and a noted
decrease in students indicating that their goal is a Vocational/Technical Program.
EMPLOYMENT 2007 2009 2011
Full-time off campus 31.25% 24.12% 22.85%
Part-time off campus 44.78% 40.54% 43.82%
Full-time on campus 1.46% 1.15% 1.64%
Part-time on campus 2.91% 2.97% 3.97%
Not employed 19.61% 31.22% 27.72%
A higher percentage of students from 2007 to 2011 are not employed. A lower percentage of students
from 2007 to 2011 are employed full-time off campus.
DISABILITIES 2007 2009 2011
Yes-Disability 8.36% 9.40% 11.05%
No-Disability 91.64% 90.60% 88.95%
A slightly higher percentage of students from 2007 to 2011 are identified as having a disability.
Noel-Levitz Student Satisfaction Survey Report 2012 iv Fox Valley Technical College
Key Findings
This report identifies the areas that matter most to students, how satisfied they are in having their
expectations met, and where there is room for improvement. It also highlights how FVTC compares
with the comparison groups of WTCS (Wisconsin Technical College System) and national community
colleges. Key findings include strengths, challenges, benchmarks and trends.
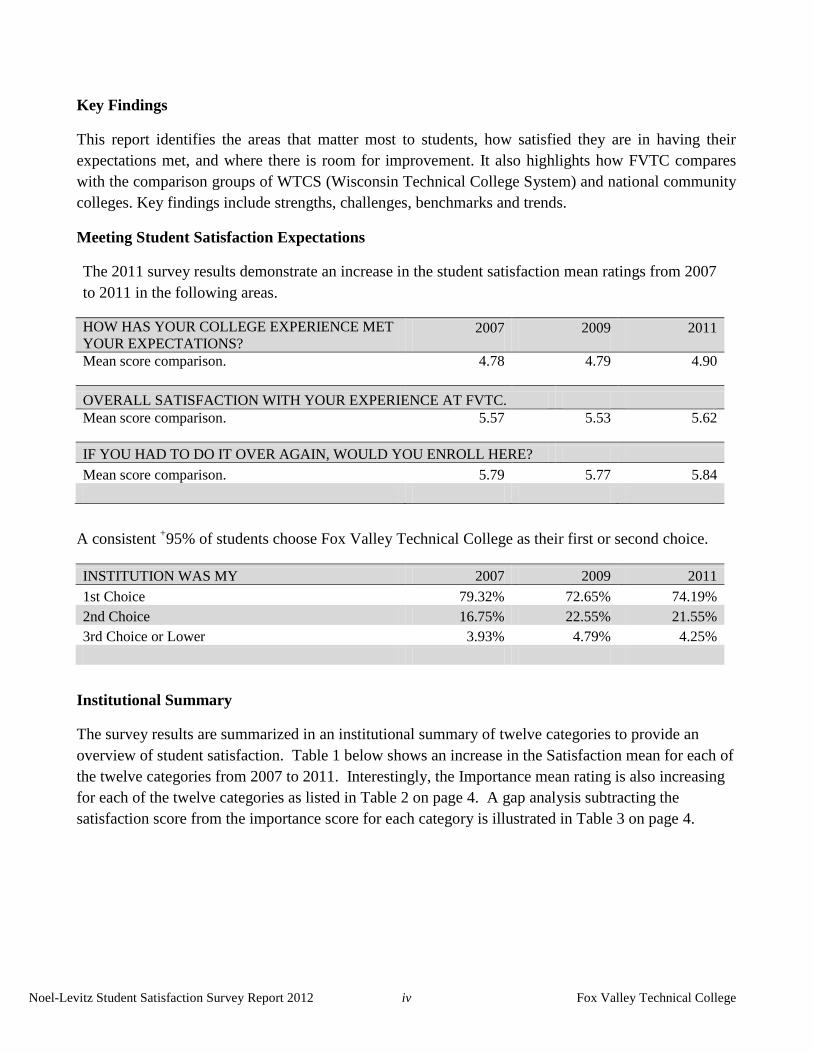
Meeting Student Satisfaction Expectations
The 2011 survey results demonstrate an increase in the student satisfaction mean ratings from 2007
to 2011 in the following areas.
HOW HAS YOUR COLLEGE EXPERIENCE MET
YOUR EXPECTATIONS? 2007 2009 2011
Mean score comparison. 4.78 4.79 4.90
OVERALL SATISFACTION WITH YOUR EXPERIENCE AT FVTC.
Mean score comparison. 5.57 5.53 5.62
IF YOU HAD TO DO IT OVER AGAIN, WOULD YOU ENROLL HERE?
Mean score comparison. 5.79 5.77 5.84
A consistent +95% of students choose Fox Valley Technical College as their first or second choice.
INSTITUTION WAS MY 2007 2009 2011
1st Choice 79.32% 72.65% 74.19%
2nd Choice 16.75% 22.55% 21.55%
3rd Choice or Lower 3.93% 4.79% 4.25%
Institutional Summary
The survey results are summarized in an institutional summary of twelve categories to provide an
overview of student satisfaction. Table 1 below shows an increase in the Satisfaction mean for each of
the twelve categories from 2007 to 2011. Interestingly, the Importance mean rating is also increasing
for each of the twelve categories as listed in Table 2 on page 4. A gap analysis subtracting the
satisfaction score from the importance score for each category is illustrated in Table 3 on page 4.
Noel-Levitz Student Satisfaction Survey Report 2012 v Fox Valley Technical College
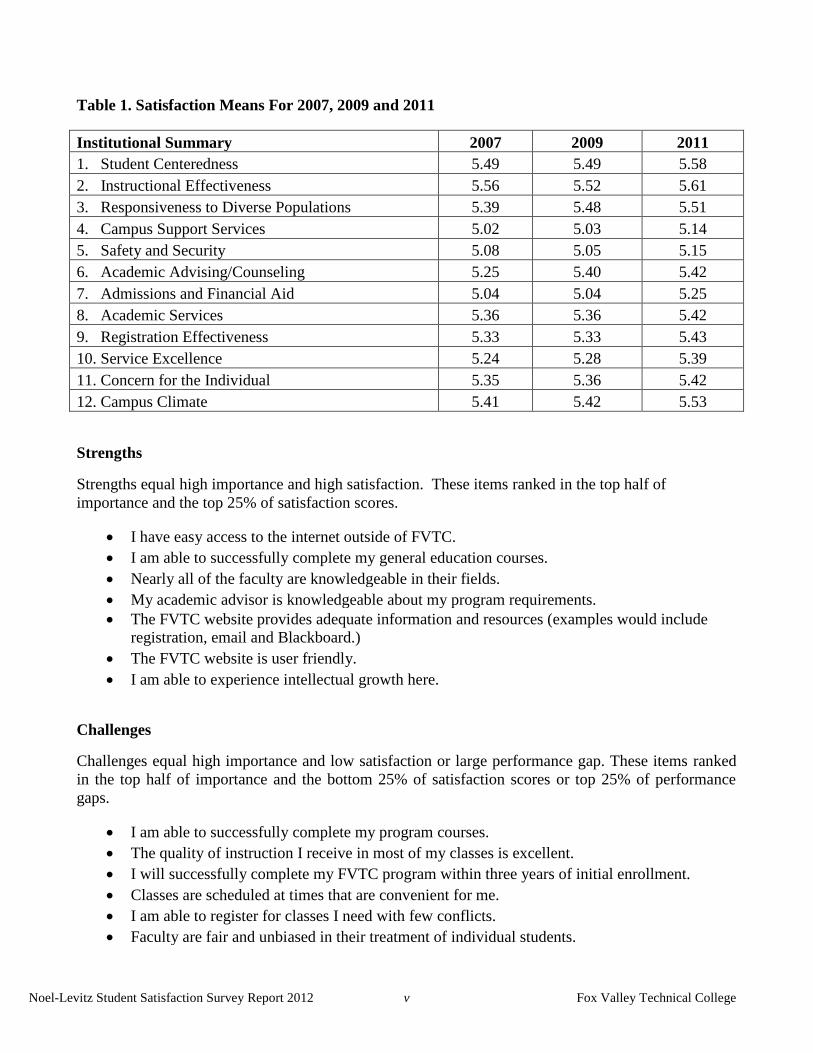
Table 1. Satisfaction Means For 2007, 2009 and 2011
Institutional Summary 2007 2009 2011
1. Student Centeredness 5.49 5.49 5.58
2. Instructional Effectiveness 5.56 5.52 5.61
3. Responsiveness to Diverse Populations 5.39 5.48 5.51
4. Campus Support Services 5.02 5.03 5.14
5. Safety and Security 5.08 5.05 5.15
6. Academic Advising/Counseling 5.25 5.40 5.42
7. Admissions and Financial Aid 5.04 5.04 5.25
8. Academic Services 5.36 5.36 5.42
9. Registration Effectiveness 5.33 5.33 5.43
10. Service Excellence 5.24 5.28 5.39
11. Concern for the Individual 5.35 5.36 5.42
12. Campus Climate 5.41 5.42 5.53
Strengths
Strengths equal high importance and high satisfaction. These items ranked in the top half of
importance and the top 25% of satisfaction scores.
I have easy access to the internet outside of FVTC.
I am able to successfully complete my general education courses.
Nearly all of the faculty are knowledgeable in their fields.
My academic advisor is knowledgeable about my program requirements.
The FVTC website provides adequate information and resources (examples would include
registration, email and Blackboard.)
The FVTC website is user friendly.
I am able to experience intellectual growth here.
Challenges
Challenges equal high importance and low satisfaction or large performance gap. These items ranked
in the top half of importance and the bottom 25% of satisfaction scores or top 25% of performance
gaps.
I am able to successfully complete my program courses.
The quality of instruction I receive in most of my classes is excellent.
I will successfully complete my FVTC program within three years of initial enrollment.
Classes are scheduled at times that are convenient for me.
I am able to register for classes I need with few conflicts.
Faculty are fair and unbiased in their treatment of individual students.
Noel-Levitz Student Satisfaction Survey Report 2012 vi Fox Valley Technical College
Computer labs are adequate and accessible.
This school does whatever it can to help me reach my educational goals.
Faculty provide timely feedback about student progress in a course.
Adequate financial aid is available for most students.
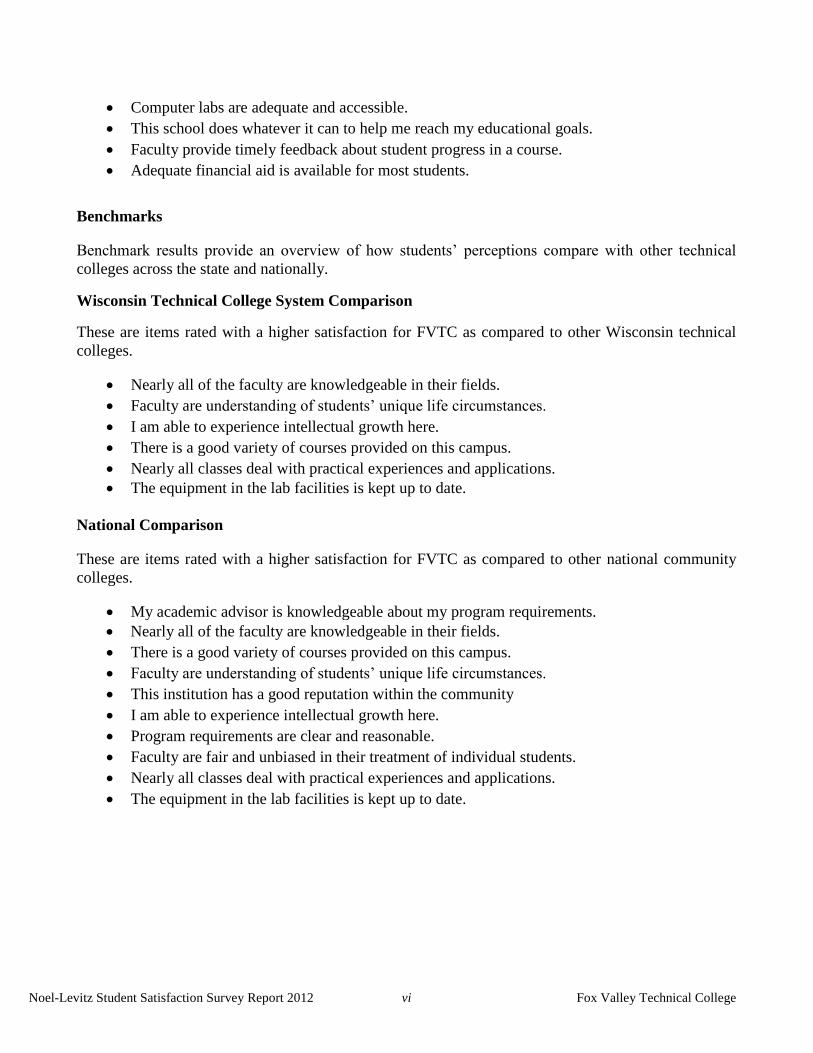
Benchmarks
Benchmark results provide an overview of how students’ perceptions compare with other technical
colleges across the state and nationally.
Wisconsin Technical College System Comparison
These are items rated with a higher satisfaction for FVTC as compared to other Wisconsin technical
colleges.
Nearly all of the faculty are knowledgeable in their fields.
Faculty are understanding of students’ unique life circumstances.
I am able to experience intellectual growth here.
There is a good variety of courses provided on this campus.
Nearly all classes deal with practical experiences and applications.
The equipment in the lab facilities is kept up to date.
National Comparison
These are items rated with a higher satisfaction for FVTC as compared to other national community
colleges.
My academic advisor is knowledgeable about my program requirements.
Nearly all of the faculty are knowledgeable in their fields.
There is a good variety of courses provided on this campus.
Faculty are understanding of students’ unique life circumstances.
This institution has a good reputation within the community
I am able to experience intellectual growth here.
Program requirements are clear and reasonable.
Faculty are fair and unbiased in their treatment of individual students.
Nearly all classes deal with practical experiences and applications.
The equipment in the lab facilities is kept up to date.
Noel-Levitz Student Satisfaction Survey Report 2012 vii Fox Valley Technical College
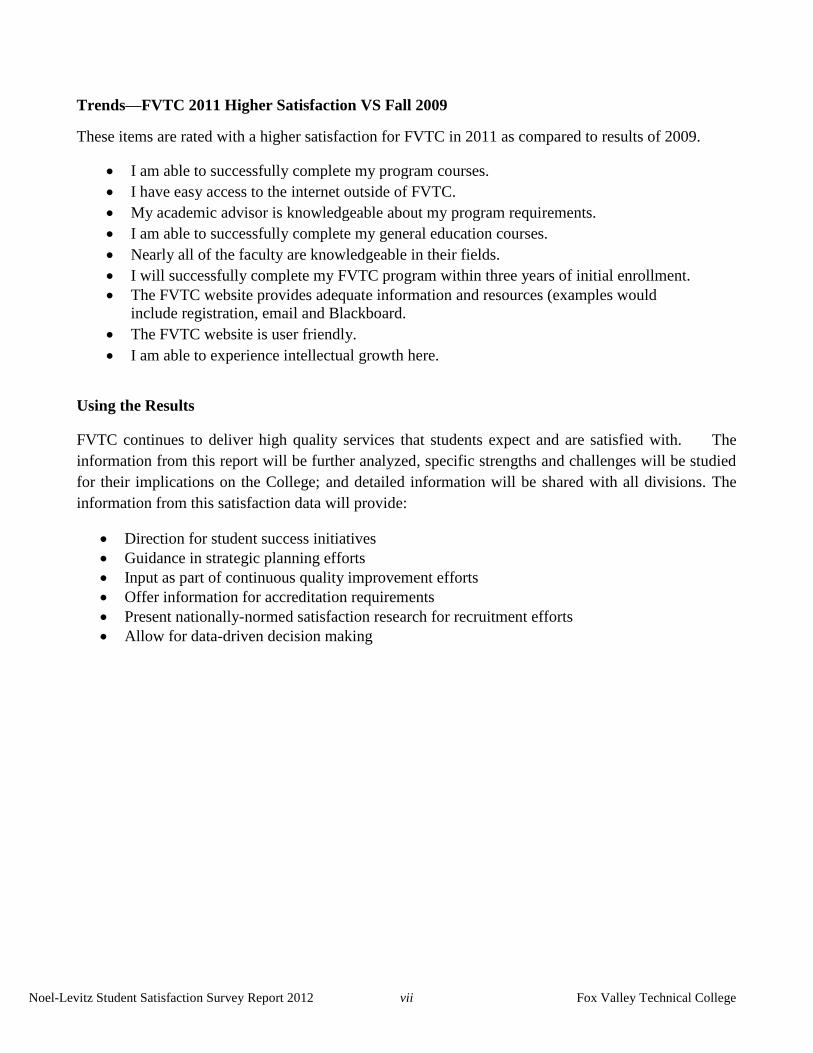
Trends—FVTC 2011 Higher Satisfaction VS Fall 2009
These items are rated with a higher satisfaction for FVTC in 2011 as compared to results of 2009.
I am able to successfully complete my program courses.
I have easy access to the internet outside of FVTC.
My academic advisor is knowledgeable about my program requirements.
I am able to successfully complete my general education courses.
Nearly all of the faculty are knowledgeable in their fields.
I will successfully complete my FVTC program within three years of initial enrollment.
The FVTC website provides adequate information and resources (examples would
include registration, email and Blackboard.
The FVTC website is user friendly.
I am able to experience intellectual growth here.
Using the Results
FVTC continues to deliver high quality services that students expect and are satisfied with. The
information from this report will be further analyzed, specific strengths and challenges will be studied
for their implications on the College; and detailed information will be shared with all divisions. The
information from this satisfaction data will provide:
Direction for student success initiatives
Guidance in strategic planning efforts
Input as part of continuous quality improvement efforts
Offer information for accreditation requirements
Present nationally-normed satisfaction research for recruitment efforts
Allow for data-driven decision making
Noel-Levitz Student Satisfaction Survey Report 2012 viii Fox Valley Technical College
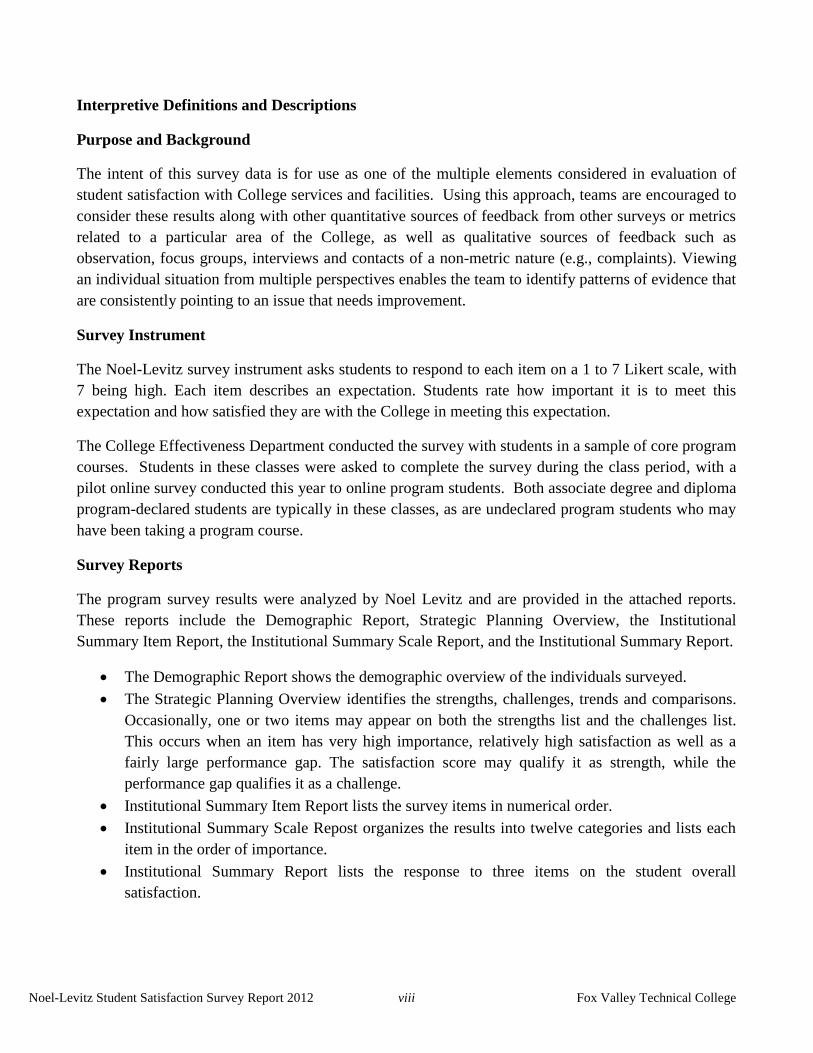
Interpretive Definitions and Descriptions
Purpose and Background
The intent of this survey data is for use as one of the multiple elements considered in evaluation of
student satisfaction with College services and facilities. Using this approach, teams are encouraged to
consider these results along with other quantitative sources of feedback from other surveys or metrics
related to a particular area of the College, as well as qualitative sources of feedback such as
observation, focus groups, interviews and contacts of a non-metric nature (e.g., complaints). Viewing
an individual situation from multiple perspectives enables the team to identify patterns of evidence that
are consistently pointing to an issue that needs improvement.
Survey Instrument
The Noel-Levitz survey instrument asks students to respond to each item on a 1 to 7 Likert scale, with
7 being high. Each item describes an expectation. Students rate how important it is to meet this
expectation and how satisfied they are with the College in meeting this expectation.
The College Effectiveness Department conducted the survey with students in a sample of core program
courses. Students in these classes were asked to complete the survey during the class period, with a
pilot online survey conducted this year to online program students. Both associate degree and diploma
program-declared students are typically in these classes, as are undeclared program students who may
have been taking a program course.
Survey Reports
The program survey results were analyzed by Noel Levitz and are provided in the attached reports.
These reports include the Demographic Report, Strategic Planning Overview, the Institutional
Summary Item Report, the Institutional Summary Scale Report, and the Institutional Summary Report.
The Demographic Report shows the demographic overview of the individuals surveyed.
The Strategic Planning Overview identifies the strengths, challenges, trends and comparisons.
Occasionally, one or two items may appear on both the strengths list and the challenges list.
This occurs when an item has very high importance, relatively high satisfaction as well as a
fairly large performance gap. The satisfaction score may qualify it as strength, while the
performance gap qualifies it as a challenge.
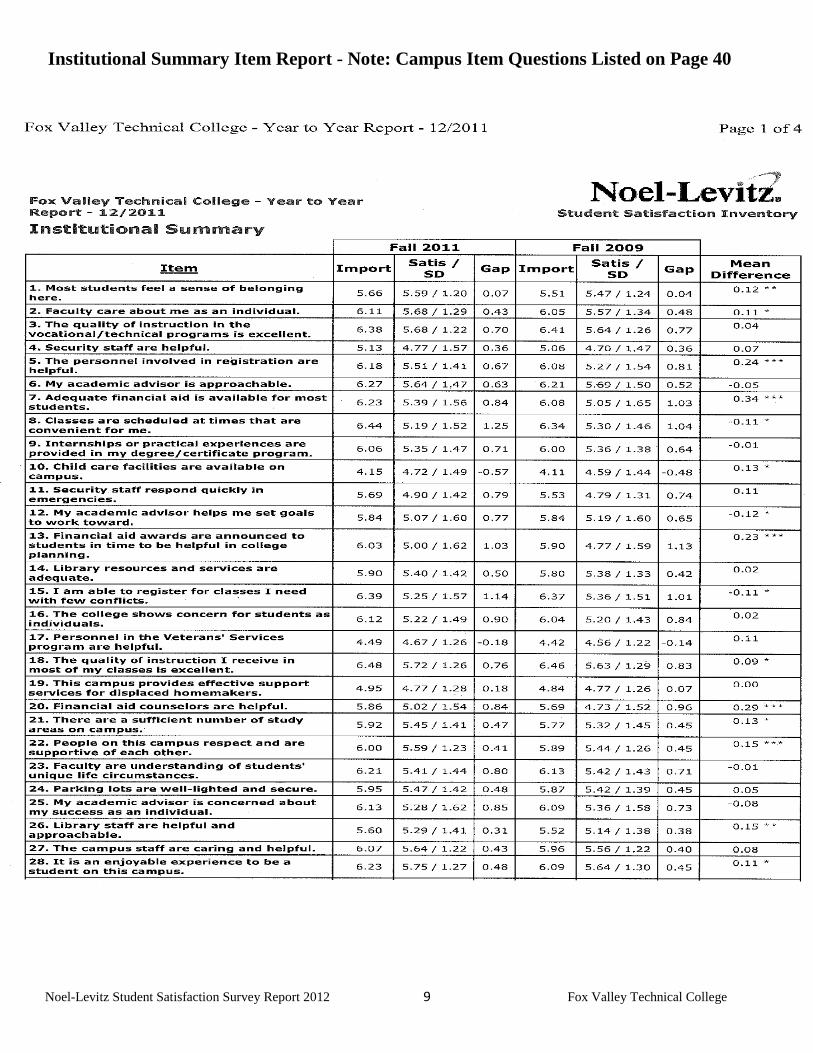
Institutional Summary Item Report lists the survey items in numerical order.
Institutional Summary Scale Repost organizes the results into twelve categories and lists each
item in the order of importance.
Institutional Summary Report lists the response to three items on the student overall
satisfaction.
Noel-Levitz Student Satisfaction Survey Report 2012 ix Fox Valley Technical College
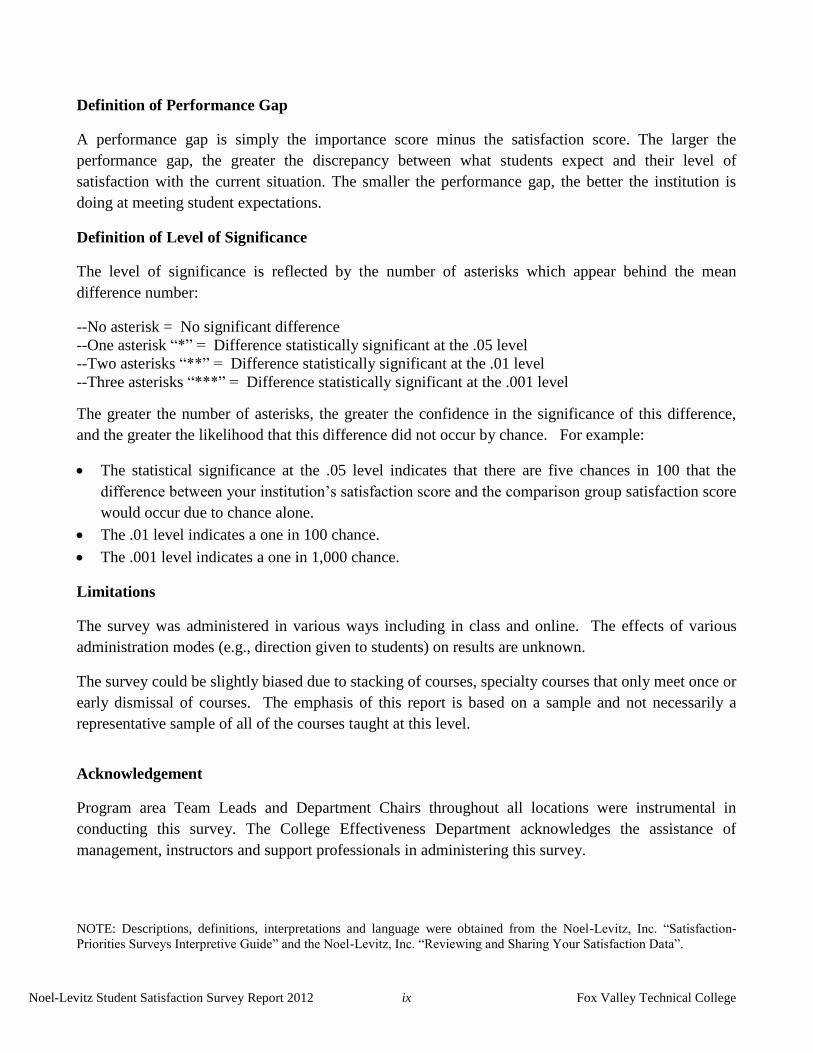
Definition of Performance Gap
A performance gap is simply the importance score minus the satisfaction score. The larger the
performance gap, the greater the discrepancy between what students expect and their level of
satisfaction with the current situation. The smaller the performance gap, the better the institution is
doing at meeting student expectations.
Definition of Level of Significance
The level of significance is reflected by the number of asterisks which appear behind the mean
difference number:
--No asterisk = No significant difference
--One asterisk “*” = Difference statistically significant at the .05 level
--Two asterisks “**” = Difference statistically significant at the .01 level
--Three asterisks “***” = Difference statistically significant at the .001 level
The greater the number of asterisks, the greater the confidence in the significance of this difference,
and the greater the likelihood that this difference did not occur by chance. For example:
The statistical significance at the .05 level indicates that there are five chances in 100 that the
difference between your institution’s satisfaction score and the comparison group satisfaction score
would occur due to chance alone.
The .01 level indicates a one in 100 chance.
The .001 level indicates a one in 1,000 chance.
Limitations
The survey was administered in various ways including in class and online. The effects of various
administration modes (e.g., direction given to students) on results are unknown.
The survey could be slightly biased due to stacking of courses, specialty courses that only meet once or
early dismissal of courses. The emphasis of this report is based on a sample and not necessarily a
representative sample of all of the courses taught at this level.
Acknowledgement
Program area Team Leads and Department Chairs throughout all locations were instrumental in
conducting this survey. The College Effectiveness Department acknowledges the assistance of
management, instructors and support professionals in administering this survey.
NOTE: Descriptions, definitions, interpretations and language were obtained from the Noel-Levitz, Inc. “Satisfaction-
Priorities Surveys Interpretive Guide” and the Noel-Levitz, Inc. “Reviewing and Sharing Your Satisfaction Data”.
Noel-Levitz Student Satisfaction Survey Report 2012 1 Fox Valley Technical College
Fox Valley Technical College
Noel-Levitz Student Satisfaction
2012 Survey Report
FVTC Longitudinal Demographic Summary
FVTC Longitudinal Institutional Summary
Noel-Levitz Student Satisfaction Survey Report 2012 2 Fox Valley Technical College
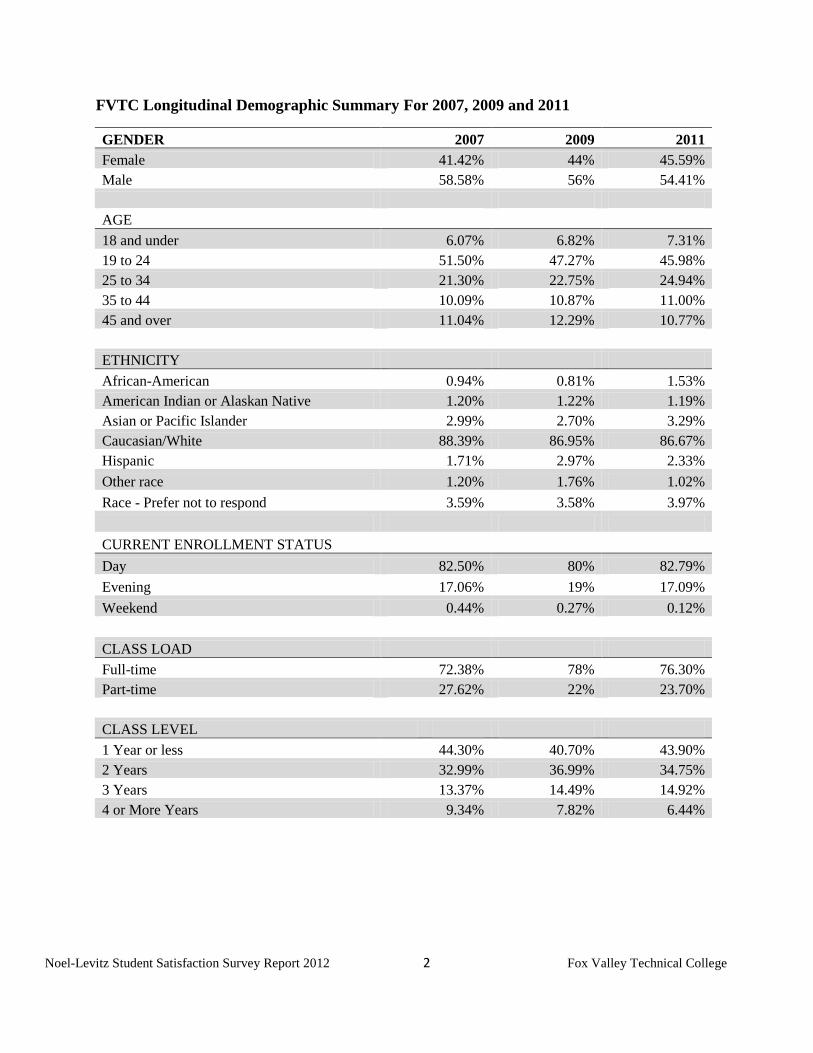
FVTC Longitudinal Demographic Summary For 2007, 2009 and 2011
GENDER 2007 2009 2011
Female 41.42% 44% 45.59%
Male 58.58% 56% 54.41%
AGE
18 and under 6.07% 6.82% 7.31%
19 to 24 51.50% 47.27% 45.98%
25 to 34 21.30% 22.75% 24.94%
35 to 44 10.09% 10.87% 11.00%
45 and over 11.04% 12.29% 10.77%
ETHNICITY
African-American 0.94% 0.81% 1.53%
American Indian or Alaskan Native 1.20% 1.22% 1.19%
Asian or Pacific Islander 2.99% 2.70% 3.29%
Caucasian/White 88.39% 86.95% 86.67%
Hispanic 1.71% 2.97% 2.33%
Other race 1.20% 1.76% 1.02%
Race - Prefer not to respond 3.59% 3.58% 3.97%
CURRENT ENROLLMENT STATUS
Day 82.50% 80% 82.79%
Evening 17.06% 19% 17.09%
Weekend 0.44% 0.27% 0.12%
CLASS LOAD
Full-time 72.38% 78% 76.30%
Part-time 27.62% 22% 23.70%
CLASS LEVEL
1 Year or less 44.30% 40.70% 43.90%
2 Years 32.99% 36.99% 34.75%
3 Years 13.37% 14.49% 14.92%
4 or More Years 9.34% 7.82% 6.44%
Noel-Levitz Student Satisfaction Survey Report 2012 3 Fox Valley Technical College
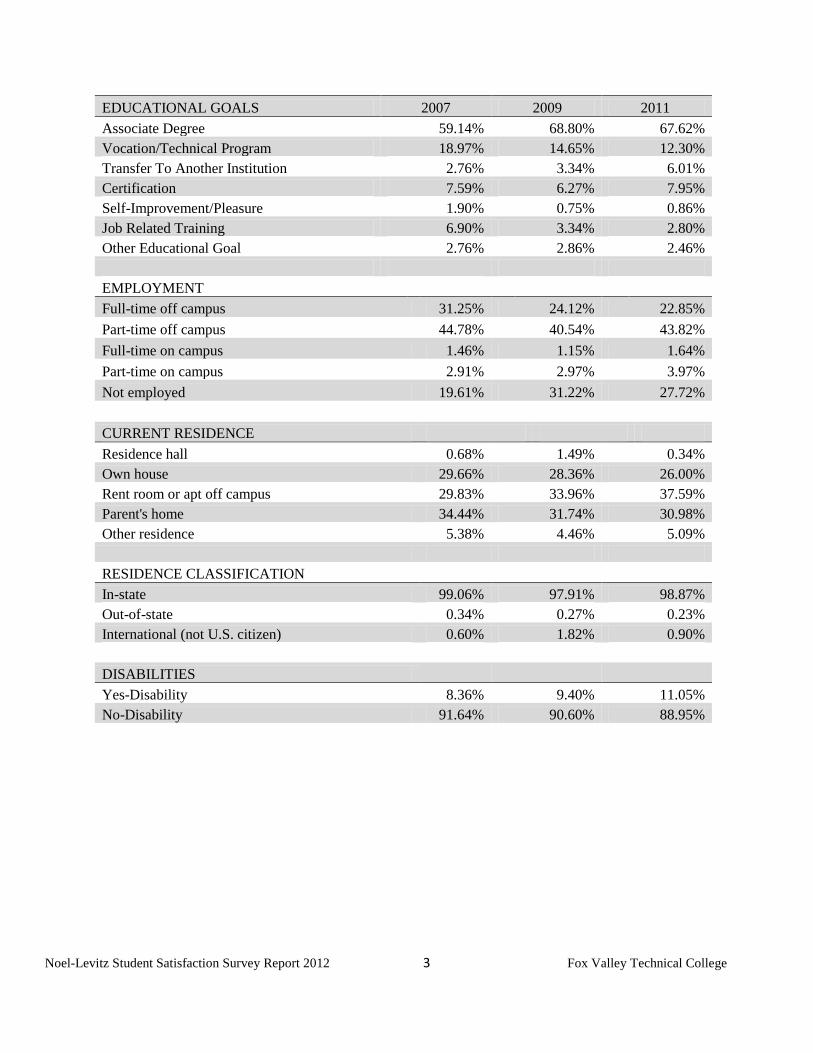
EDUCATIONAL GOALS 2007 2009 2011
Associate Degree 59.14% 68.80% 67.62%
Vocation/Technical Program 18.97% 14.65% 12.30%
Transfer To Another Institution 2.76% 3.34% 6.01%
Certification 7.59% 6.27% 7.95%
Self-Improvement/Pleasure 1.90% 0.75% 0.86%
Job Related Training 6.90% 3.34% 2.80%
Other Educational Goal 2.76% 2.86% 2.46%
EMPLOYMENT
Full-time off campus 31.25% 24.12% 22.85%
Part-time off campus 44.78% 40.54% 43.82%
Full-time on campus 1.46% 1.15% 1.64%
Part-time on campus 2.91% 2.97% 3.97%
Not employed 19.61% 31.22% 27.72%
CURRENT RESIDENCE
Residence hall 0.68% 1.49% 0.34%
Own house 29.66% 28.36% 26.00%
Rent room or apt off campus 29.83% 33.96% 37.59%
Parent's home 34.44% 31.74% 30.98%
Other residence 5.38% 4.46% 5.09%
RESIDENCE CLASSIFICATION
In-state 99.06% 97.91% 98.87%
Out-of-state 0.34% 0.27% 0.23%
International (not U.S. citizen) 0.60% 1.82% 0.90%
DISABILITIES
Yes-Disability 8.36% 9.40% 11.05%
No-Disability 91.64% 90.60% 88.95%
Noel-Levitz Student Satisfaction Survey Report 2012 4 Fox Valley Technical College
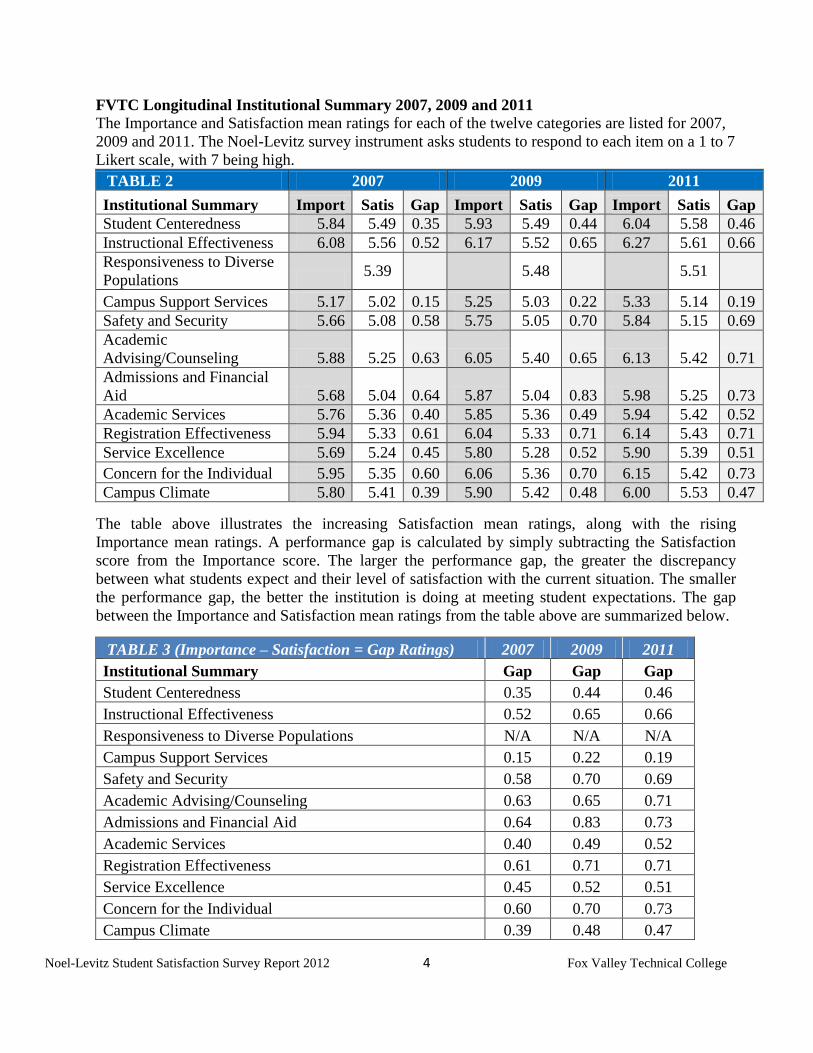
FVTC Longitudinal Institutional Summary 2007, 2009 and 2011
The Importance and Satisfaction mean ratings for each of the twelve categories are listed for 2007,
2009 and 2011. The Noel-Levitz survey instrument asks students to respond to each item on a 1 to 7
Likert scale, with 7 being high.
TABLE 2 2007 2009 2011
Institutional Summary Import Satis Gap Import Satis Gap Import Satis Gap
Student Centeredness 5.84 5.49 0.35 5.93 5.49 0.44 6.04 5.58 0.46
Instructional Effectiveness 6.08 5.56 0.52 6.17 5.52 0.65 6.27 5.61 0.66
Responsiveness to Diverse
Populations 5.39
5.48
5.51
Campus Support Services 5.17 5.02 0.15 5.25 5.03 0.22 5.33 5.14 0.19
Safety and Security 5.66 5.08 0.58 5.75 5.05 0.70 5.84 5.15 0.69
Academic
Advising/Counseling 5.88 5.25 0.63 6.05 5.40 0.65 6.13 5.42 0.71
Admissions and Financial
Aid 5.68 5.04 0.64 5.87 5.04 0.83 5.98 5.25 0.73
Academic Services 5.76 5.36 0.40 5.85 5.36 0.49 5.94 5.42 0.52
Registration Effectiveness 5.94 5.33 0.61 6.04 5.33 0.71 6.14 5.43 0.71
Service Excellence 5.69 5.24 0.45 5.80 5.28 0.52 5.90 5.39 0.51
Concern for the Individual 5.95 5.35 0.60 6.06 5.36 0.70 6.15 5.42 0.73
Campus Climate 5.80 5.41 0.39 5.90 5.42 0.48 6.00 5.53 0.47
The table above illustrates the increasing Satisfaction mean ratings, along with the rising
Importance mean ratings. A performance gap is calculated by simply subtracting the Satisfaction
score from the Importance score. The larger the performance gap, the greater the discrepancy
between what students expect and their level of satisfaction with the current situation. The smaller
the performance gap, the better the institution is doing at meeting student expectations. The gap
between the Importance and Satisfaction mean ratings from the table above are summarized below.
TABLE 3 (Importance – Satisfaction = Gap Ratings) 2007 2009 2011
Institutional Summary Gap Gap Gap
Student Centeredness 0.35 0.44 0.46
Instructional Effectiveness 0.52 0.65 0.66
Responsiveness to Diverse Populations N/A N/A N/A
Campus Support Services 0.15 0.22 0.19
Safety and Security 0.58 0.70 0.69
Academic Advising/Counseling 0.63 0.65 0.71
Admissions and Financial Aid 0.64 0.83 0.73
Academic Services 0.40 0.49 0.52
Registration Effectiveness 0.61 0.71 0.71
Service Excellence 0.45 0.52 0.51
Concern for the Individual 0.60 0.70 0.73
Campus Climate 0.39 0.48 0.47
Noel-Levitz Student Satisfaction Survey Report 2012 5 Fox Valley Technical College
Fox Valley Technical College
Noel-Levitz Student Satisfaction
2012 Survey Report Results
FVTC Fall 2011 to Fall 2009 Comparison Results
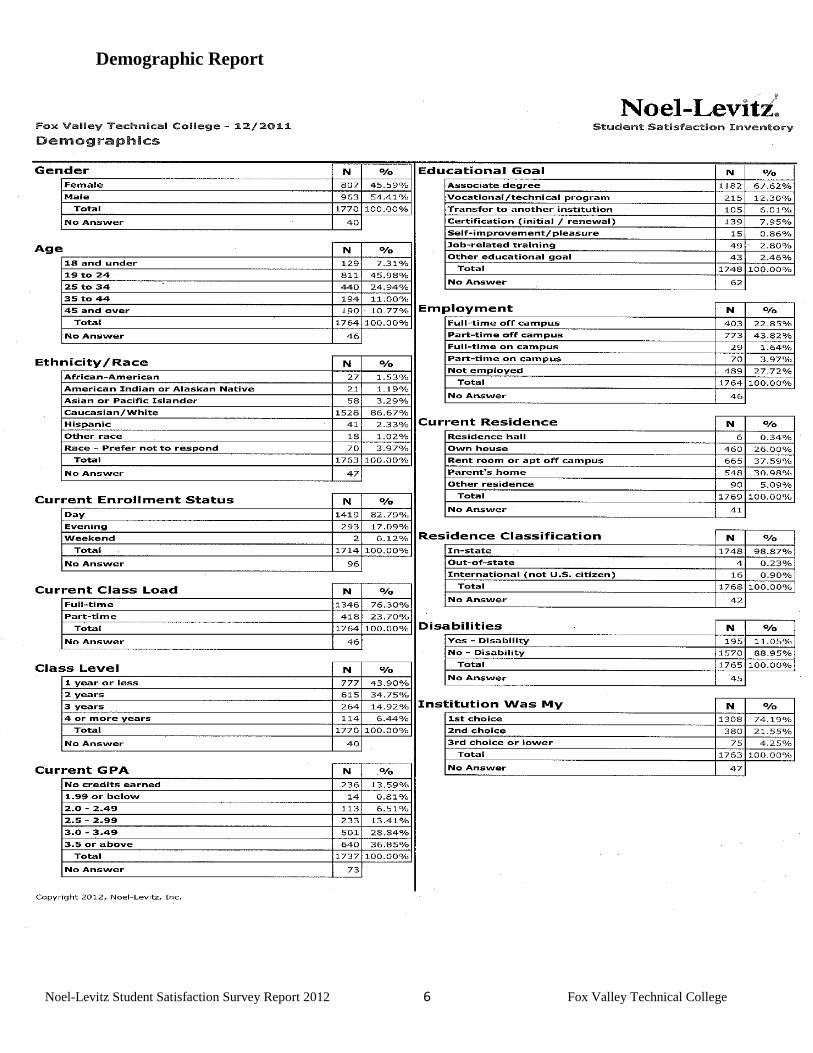
Demographic Report shows the demographic overview of the individuals
surveyed in 2011.
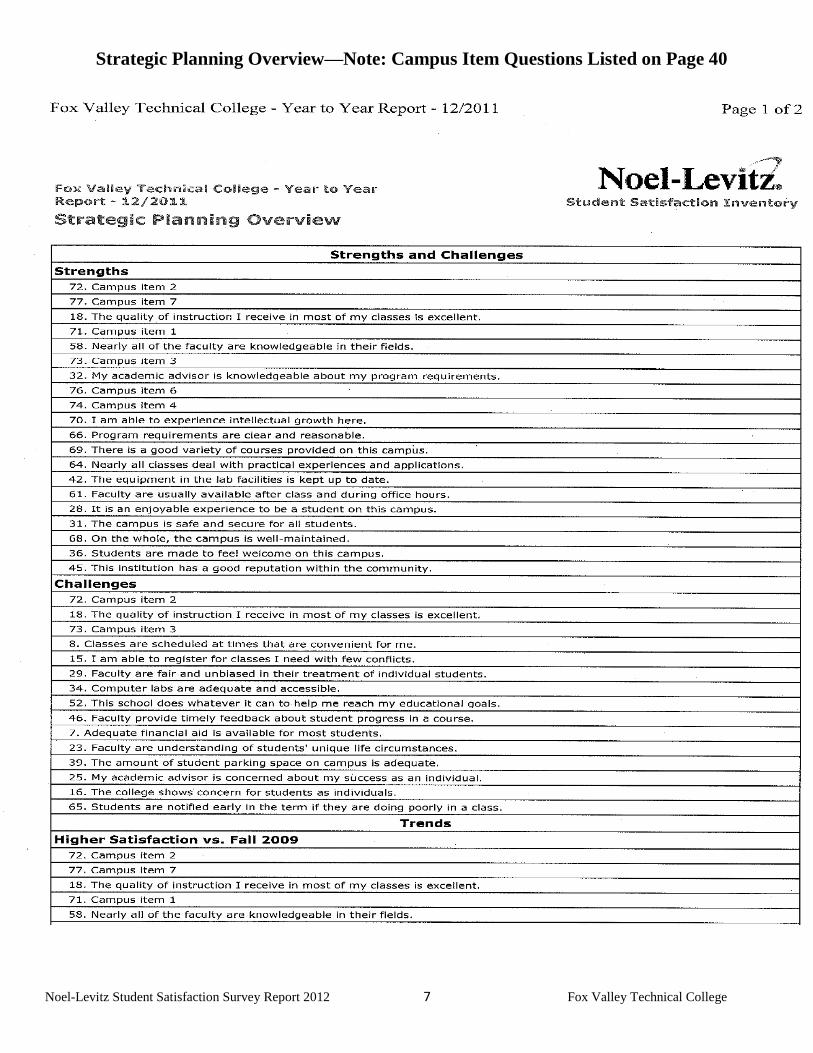
Strategic Planning Overview identifies the strengths, challenges, trends and
comparisons. Occasionally, one or two items may appear on both the strengths list
and the challenges list. This occurs when an item has very high importance,
relatively high satisfaction as well as a fairly large performance gap. The
satisfaction score may qualify it as strength, while the performance gap qualifies it
as a challenge. (Campus Item Questions are listed in the Appendix.)
Institutional Summary Item Report lists the survey items in numerical order.
Institutional Summary Scale Report organizes the results into twelve categories.
Institutional Detail Scale Report lists each item in the order of importance for
each of the twelve categories.
Institutional Summary Report lists the response to three items on the student
overall satisfaction.
Noel-Levitz Student Satisfaction Survey Report 2012 6 Fox Valley Technical College
Demographic Report
Noel-Levitz Student Satisfaction Survey Report 2012 7 Fox Valley Technical College
Strategic Planning Overview—Note: Campus Item Questions Listed on Page 40
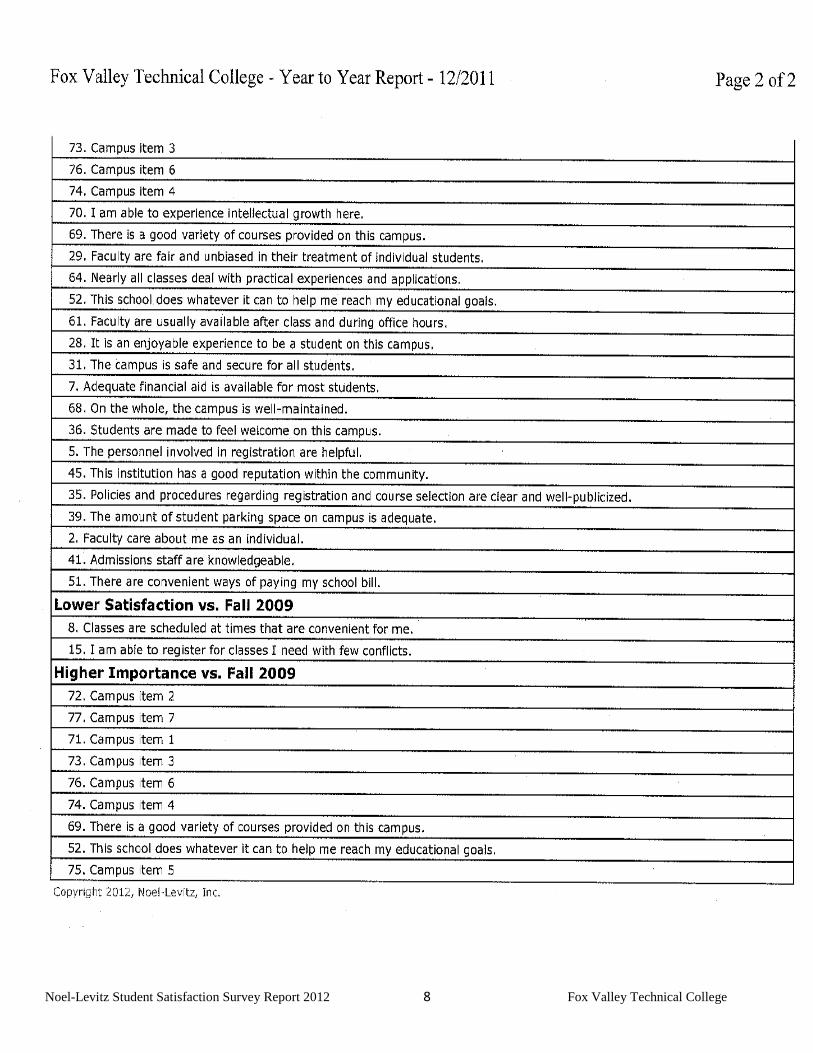
Noel-Levitz Student Satisfaction Survey Report 2012 8 Fox Valley Technical College
Noel-Levitz Student Satisfaction Survey Report 2012 9 Fox Valley Technical College
Institutional Summary Item Report - Note: Campus Item Questions Listed on Page 40
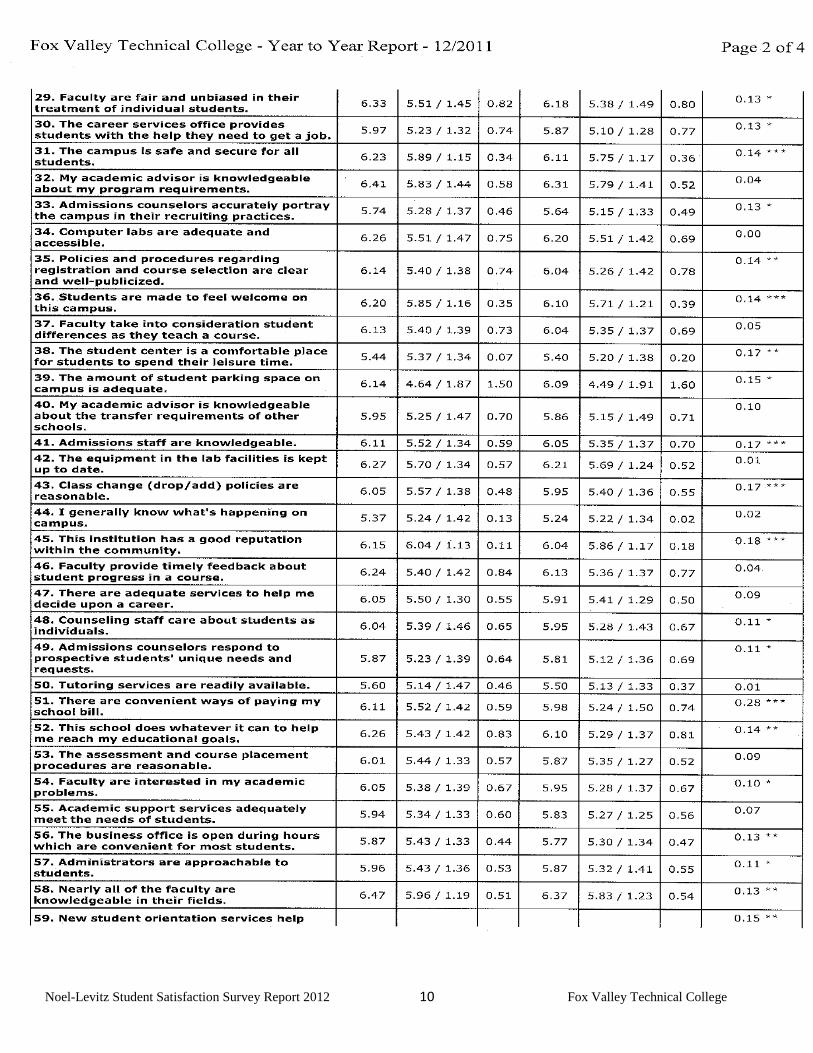
Noel-Levitz Student Satisfaction Survey Report 2012 10 Fox Valley Technical College
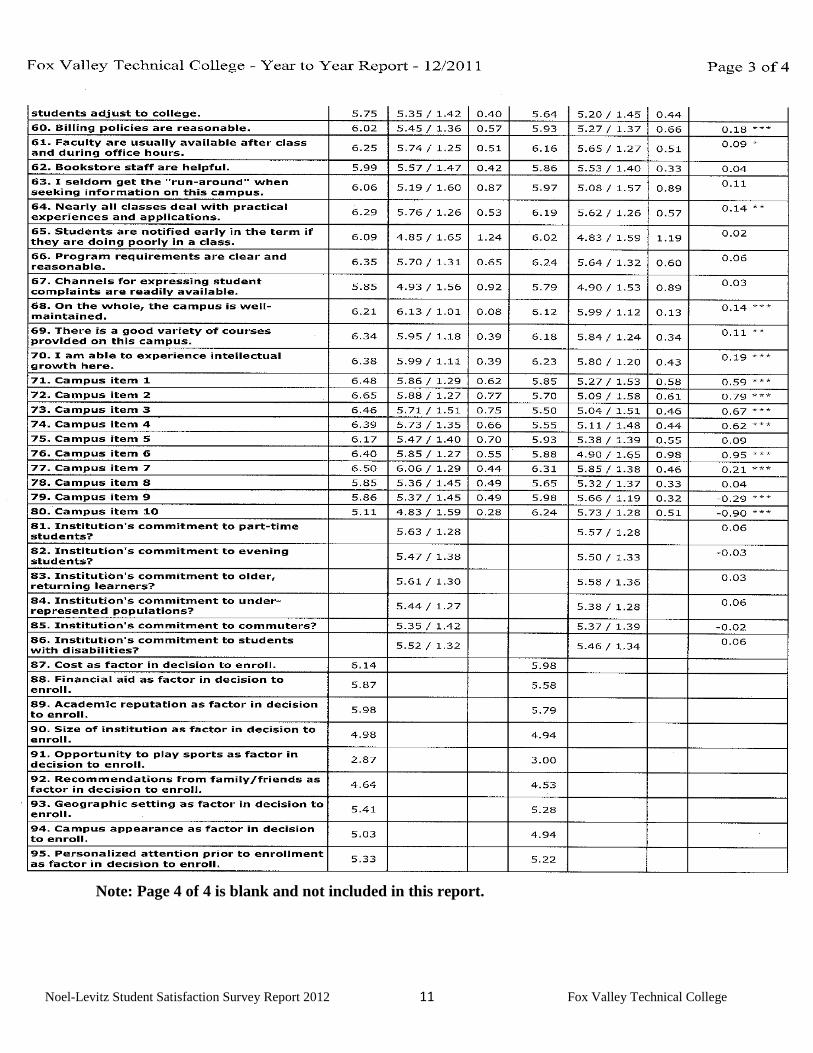
Noel-Levitz Student Satisfaction Survey Report 2012 11 Fox Valley Technical College
Note: Page 4 of 4 is blank and not included in this report.
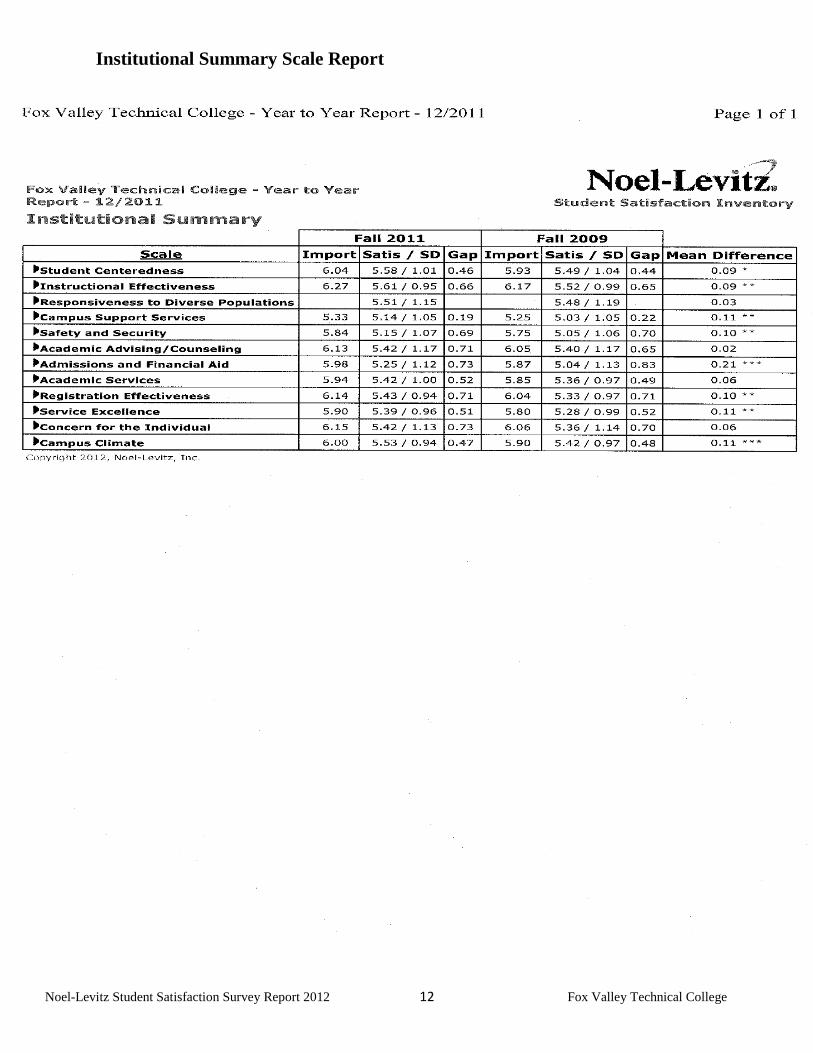
Noel-Levitz Student Satisfaction Survey Report 2012 12 Fox Valley Technical College
Institutional Summary Scale Report
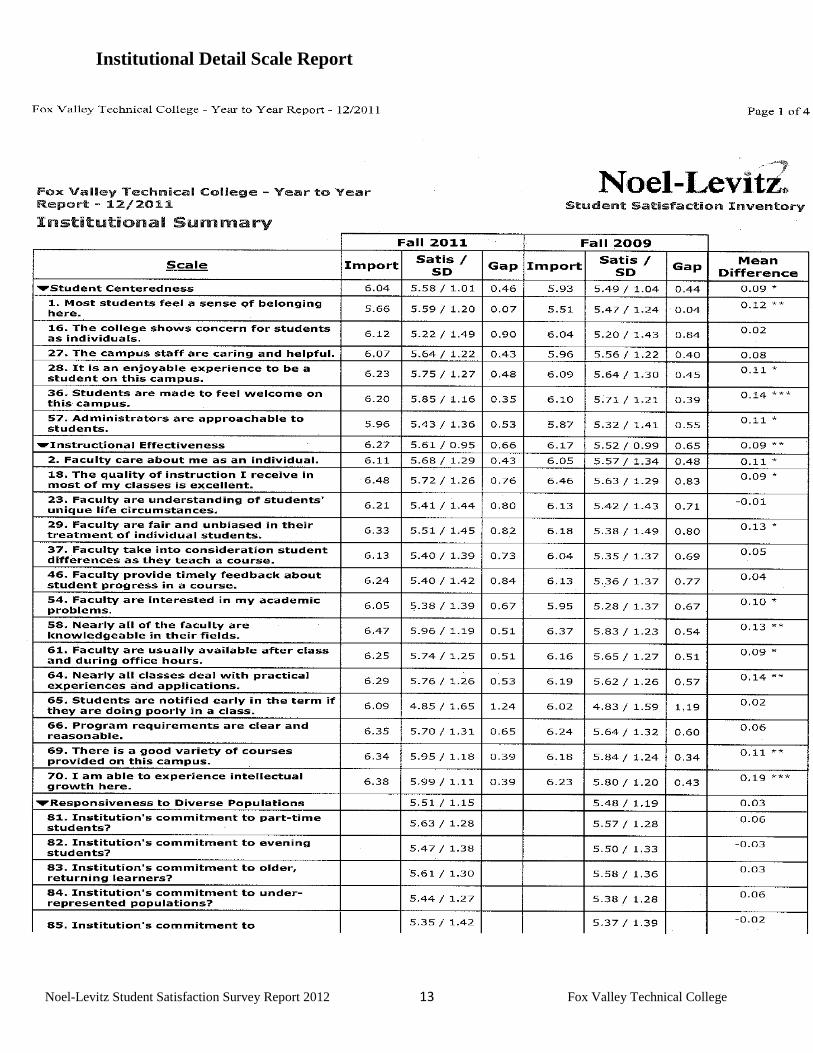
Noel-Levitz Student Satisfaction Survey Report 2012 13 Fox Valley Technical College
Institutional Detail Scale Report
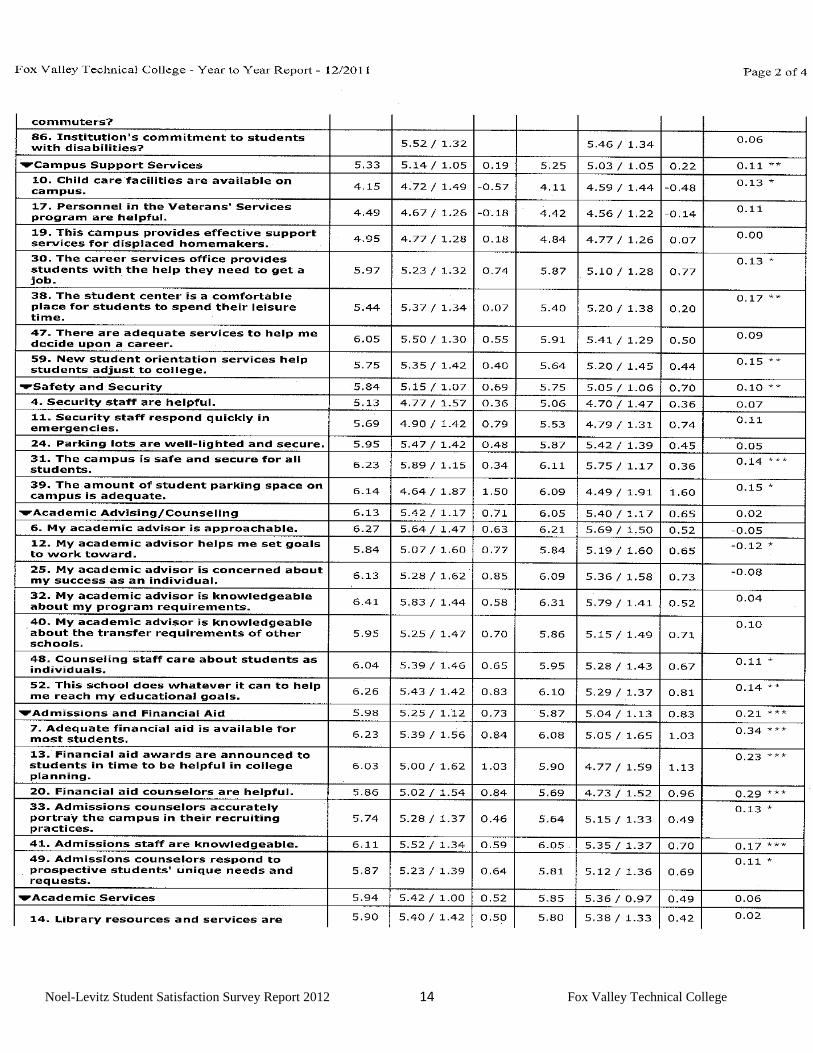
Noel-Levitz Student Satisfaction Survey Report 2012 14 Fox Valley Technical College
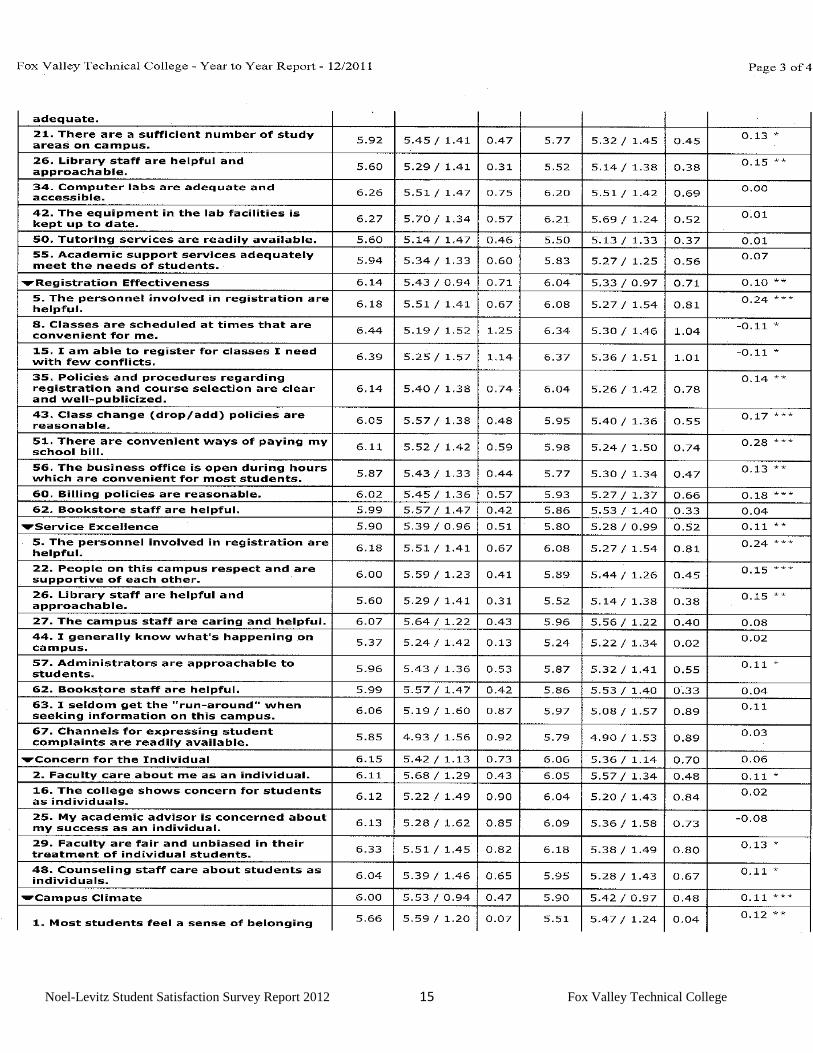
Noel-Levitz Student Satisfaction Survey Report 2012 15 Fox Valley Technical College
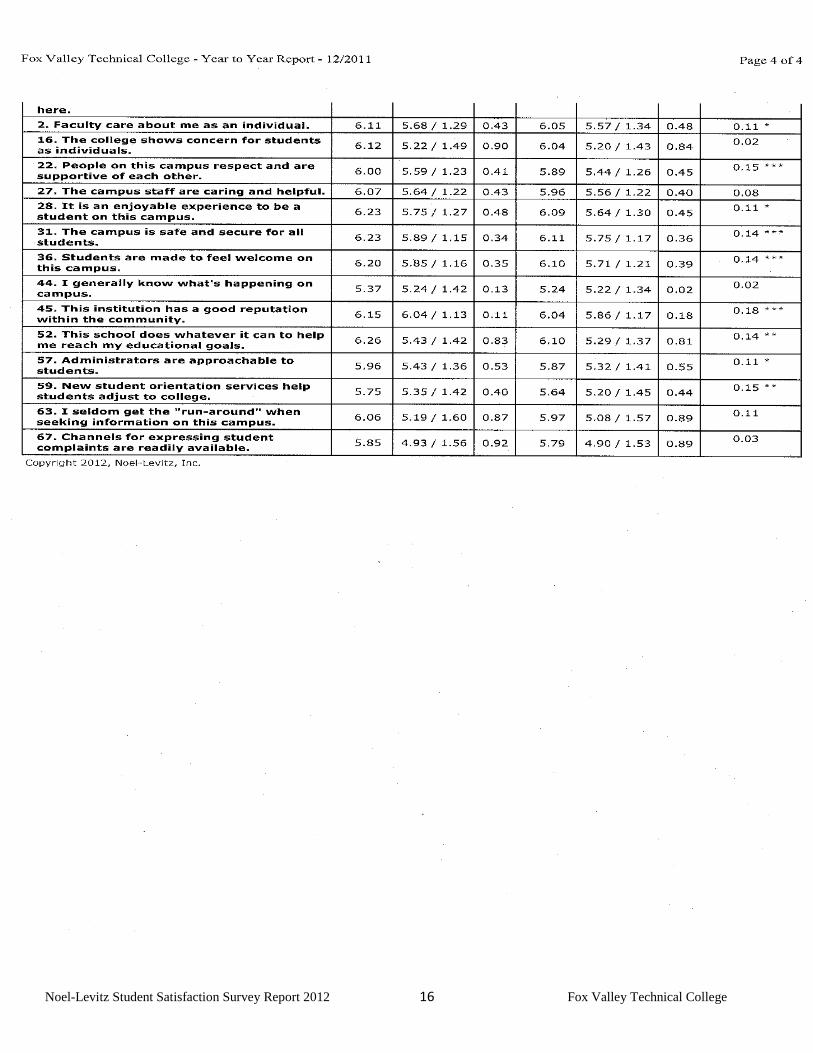
Noel-Levitz Student Satisfaction Survey Report 2012 16 Fox Valley Technical College
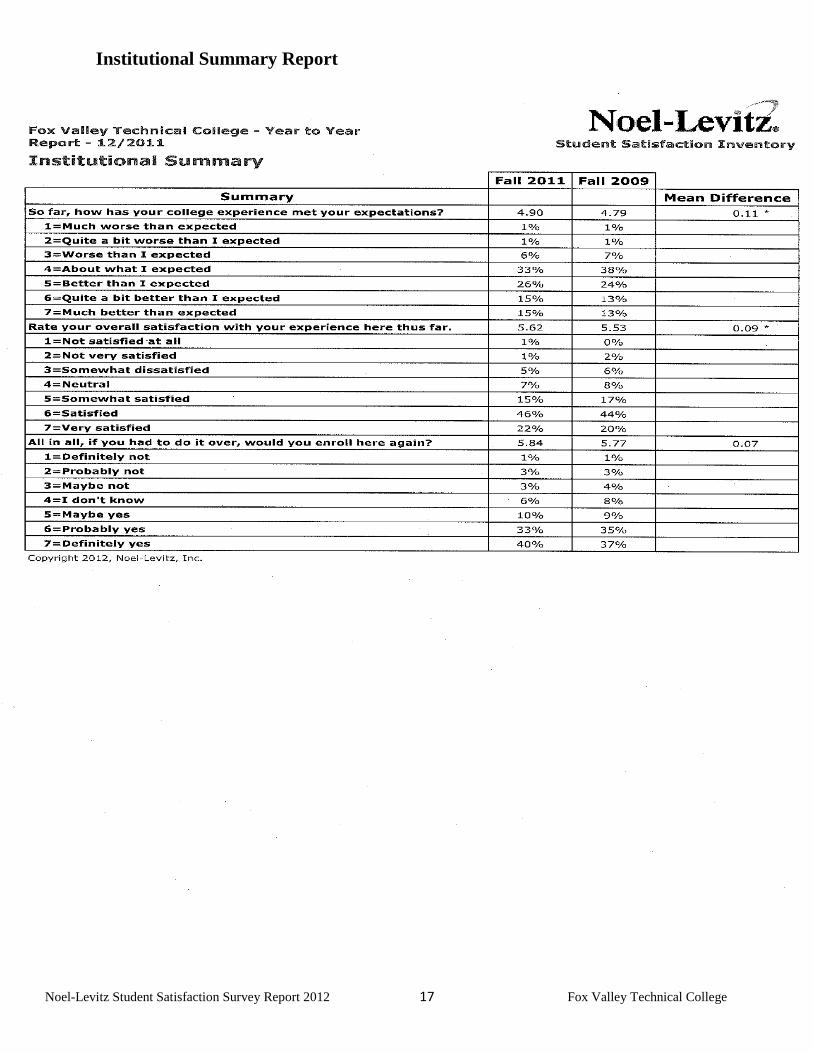
Noel-Levitz Student Satisfaction Survey Report 2012 17 Fox Valley Technical College
Institutional Summary Report
Noel-Levitz Student Satisfaction Survey Report 2012 18 Fox Valley Technical College
Fox Valley Technical College
Noel-Levitz Student Satisfaction
2012 Survey Report Results
2011 FVTC VS Wisconsin Technical College System
Colleges Comparison Results
Strategic Planning Overview identifies the strengths, challenges, trends and
comparisons. Occasionally, one or two items may appear on both the strengths list
and the challenges list. This occurs when an item has very high importance,
relatively high satisfaction as well as a fairly large performance gap. The
satisfaction score may qualify it as strength, while the performance gap qualifies it
as a challenge. (Campus Item Questions are listed in the Appendix.)
Institutional Summary Scale Report organizes the results into twelve categories.
Institutional Detail Scale Report lists each item in the order of importance for
each of the twelve categories.
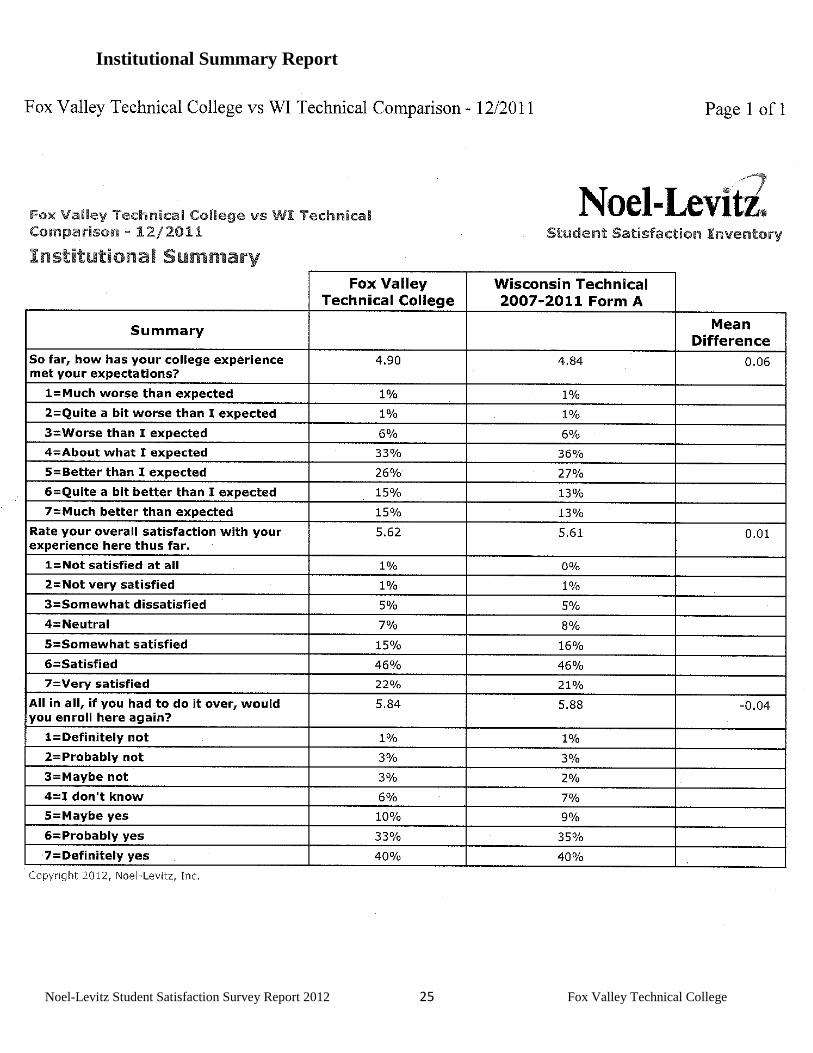
Institutional Summary Report lists the response to three items on the student
overall satisfaction.
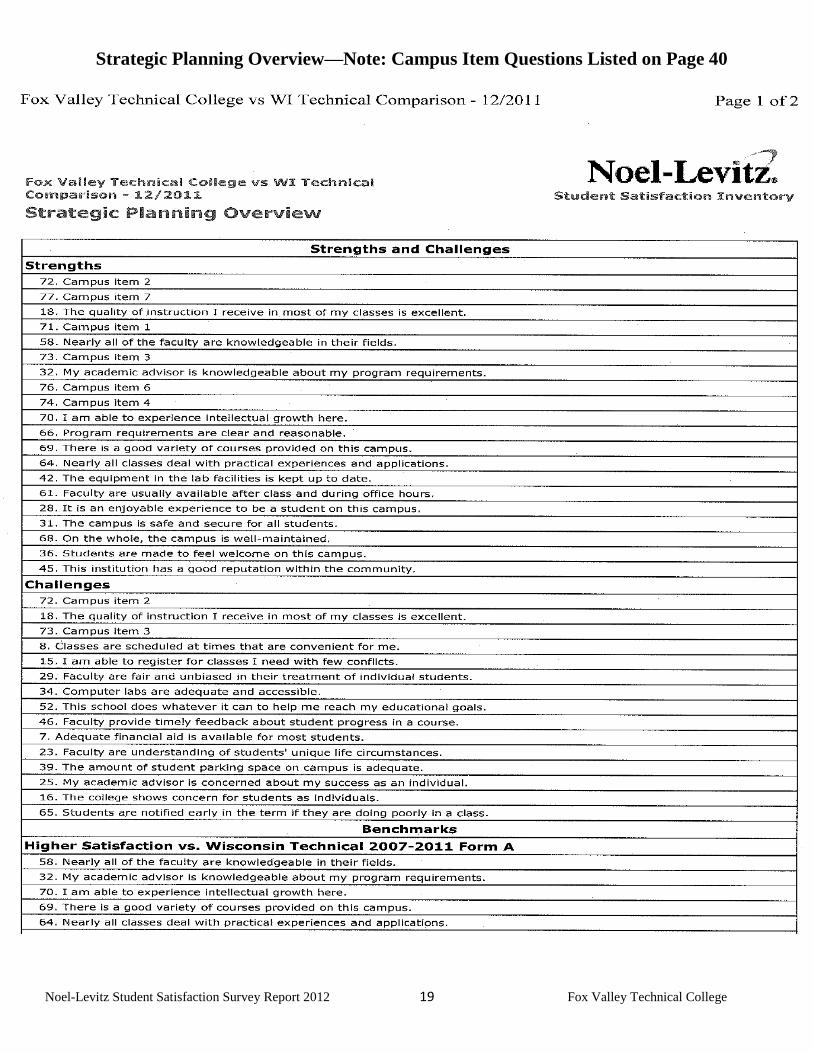
Noel-Levitz Student Satisfaction Survey Report 2012 19 Fox Valley Technical College
Strategic Planning Overview—Note: Campus Item Questions Listed on Page 40
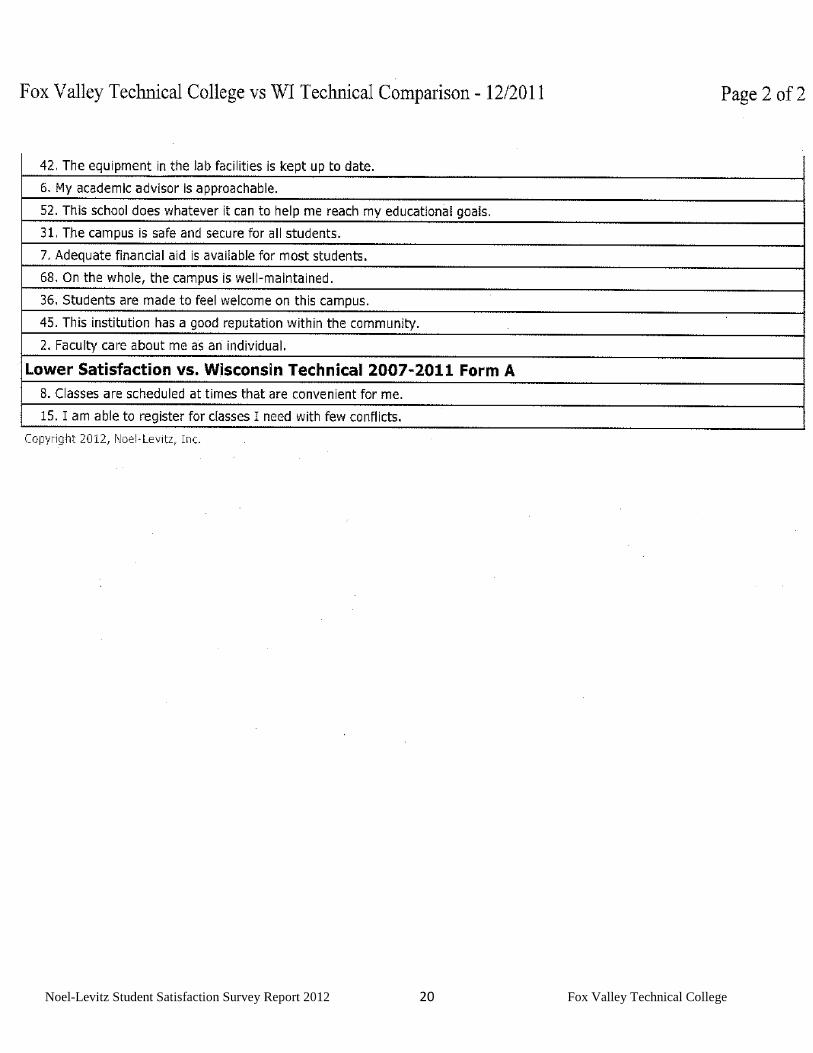
Noel-Levitz Student Satisfaction Survey Report 2012 20 Fox Valley Technical College
Noel-Levitz Student Satisfaction Survey Report 2012 21 Fox Valley Technical College
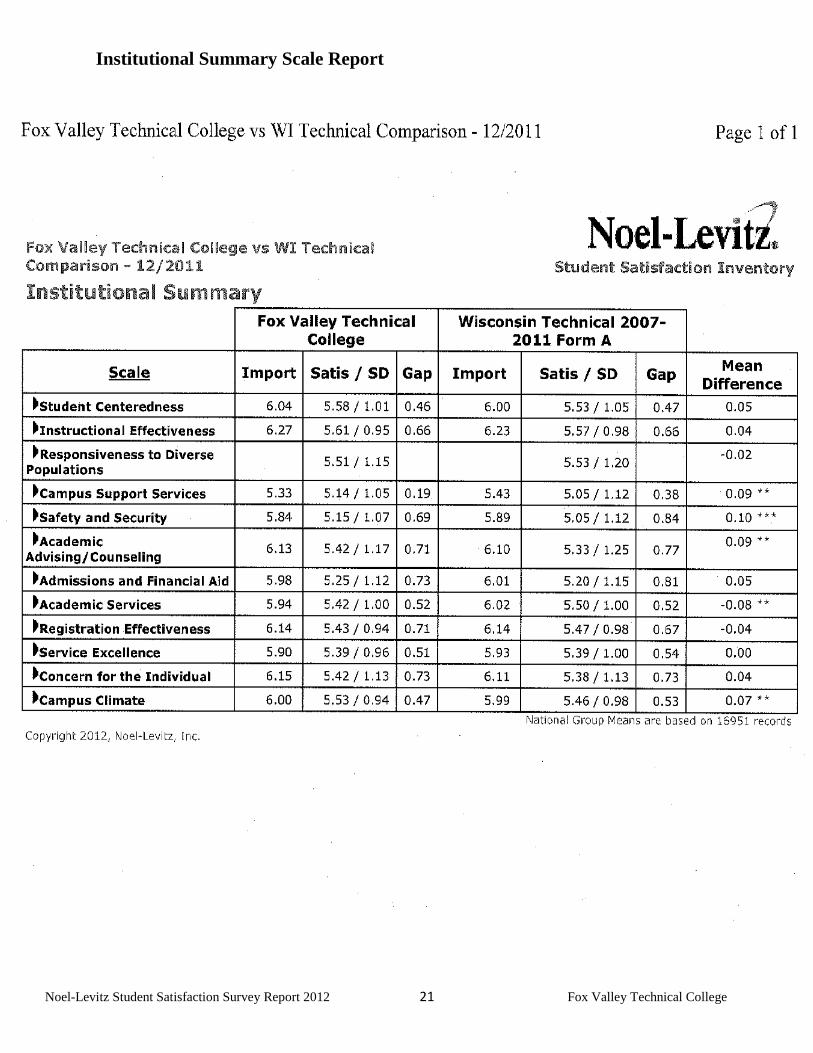
Institutional Summary Scale Report
Noel-Levitz Student Satisfaction Survey Report 2012 22 Fox Valley Technical College
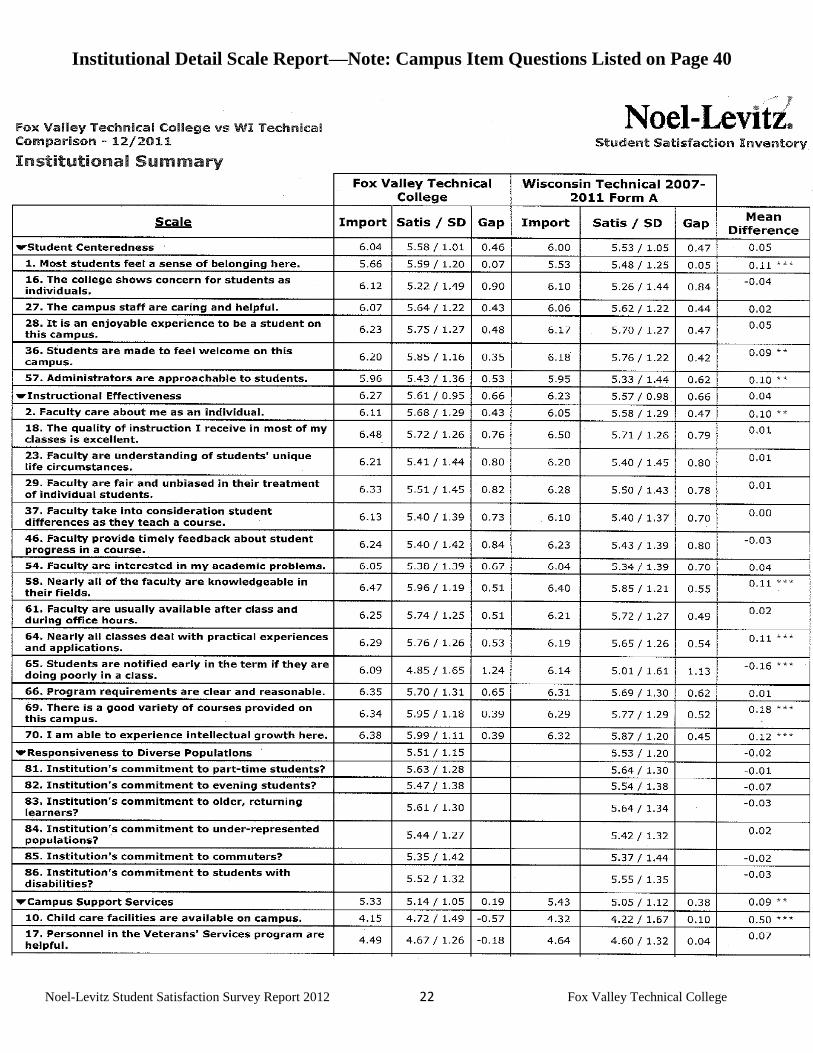
Institutional Detail Scale Report—Note: Campus Item Questions Listed on Page 40
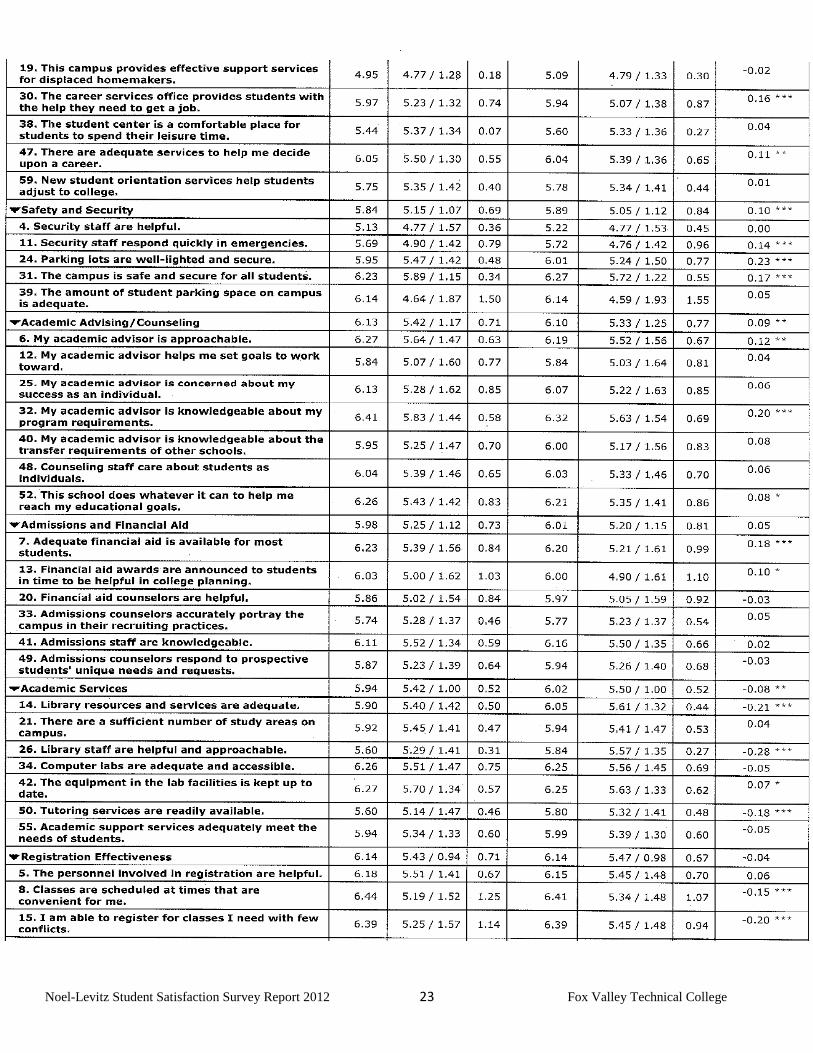
Noel-Levitz Student Satisfaction Survey Report 2012 23 Fox Valley Technical College
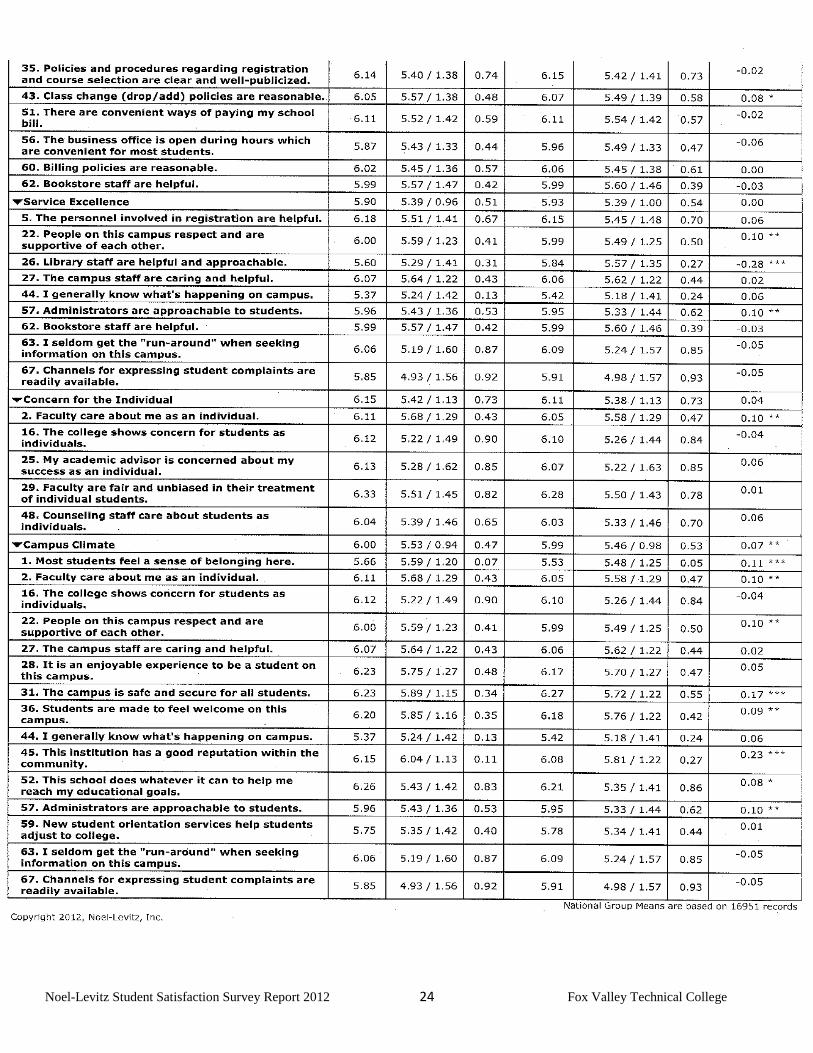
Noel-Levitz Student Satisfaction Survey Report 2012 24 Fox Valley Technical College
Noel-Levitz Student Satisfaction Survey Report 2012 25 Fox Valley Technical College
Institutional Summary Report
Noel-Levitz Student Satisfaction Survey Report 2012 26 Fox Valley Technical College
Fox Valley Technical College
Noel-Levitz Student Satisfaction
2012 Survey Report Results
2011 FVTC VS National Community College Colleges
Comparison Results
Strategic Planning Overview identifies the strengths, challenges, trends and
comparisons. Occasionally, one or two items may appear on both the strengths list
and the challenges list. This occurs when an item has very high importance,
relatively high satisfaction as well as a fairly large performance gap. The
satisfaction score may qualify it as strength, while the performance gap qualifies it
as a challenge. (Campus Item Questions are listed in the Appendix.)
Institutional Summary Scale Report organizes the results into twelve categories.
Institutional Detail Scale Report lists each item in the order of importance for
each of the twelve categories.
Institutional Summary Report lists the response to three items on the student
overall satisfaction.
Noel-Levitz Student Satisfaction Survey Report 2012 27 Fox Valley Technical College
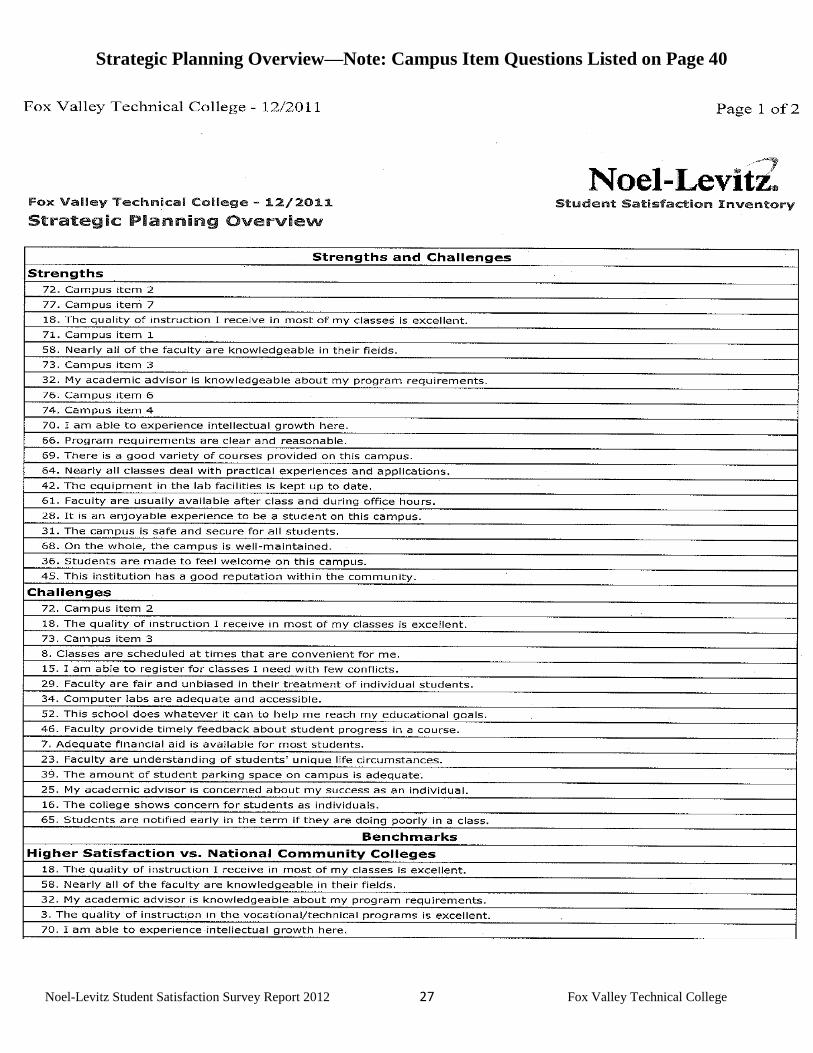
Strategic Planning Overview—Note: Campus Item Questions Listed on Page 40
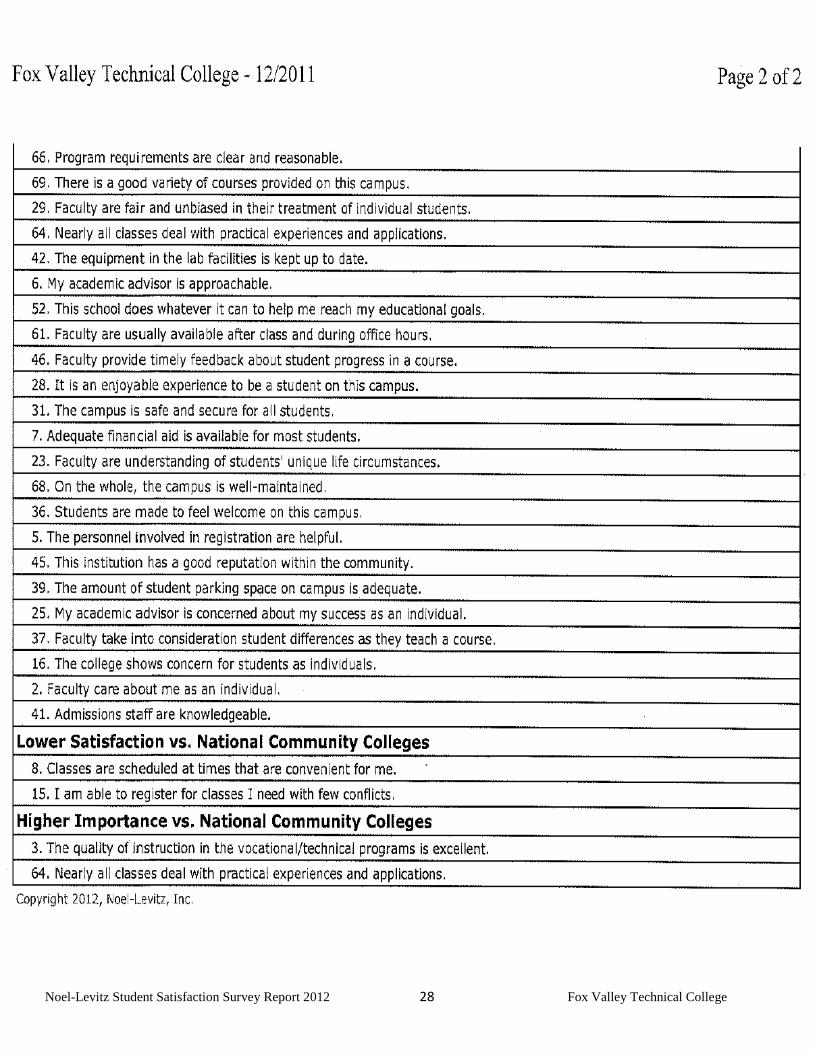
Noel-Levitz Student Satisfaction Survey Report 2012 28 Fox Valley Technical College
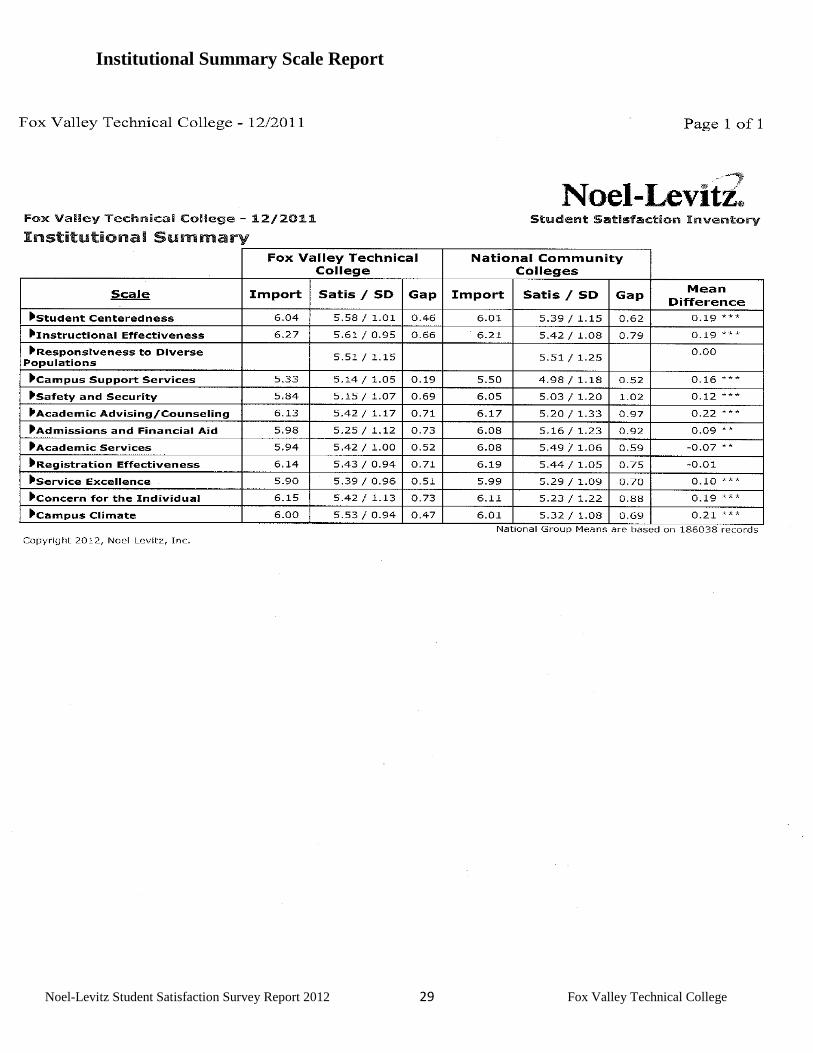
Noel-Levitz Student Satisfaction Survey Report 2012 29 Fox Valley Technical College
Institutional Summary Scale Report
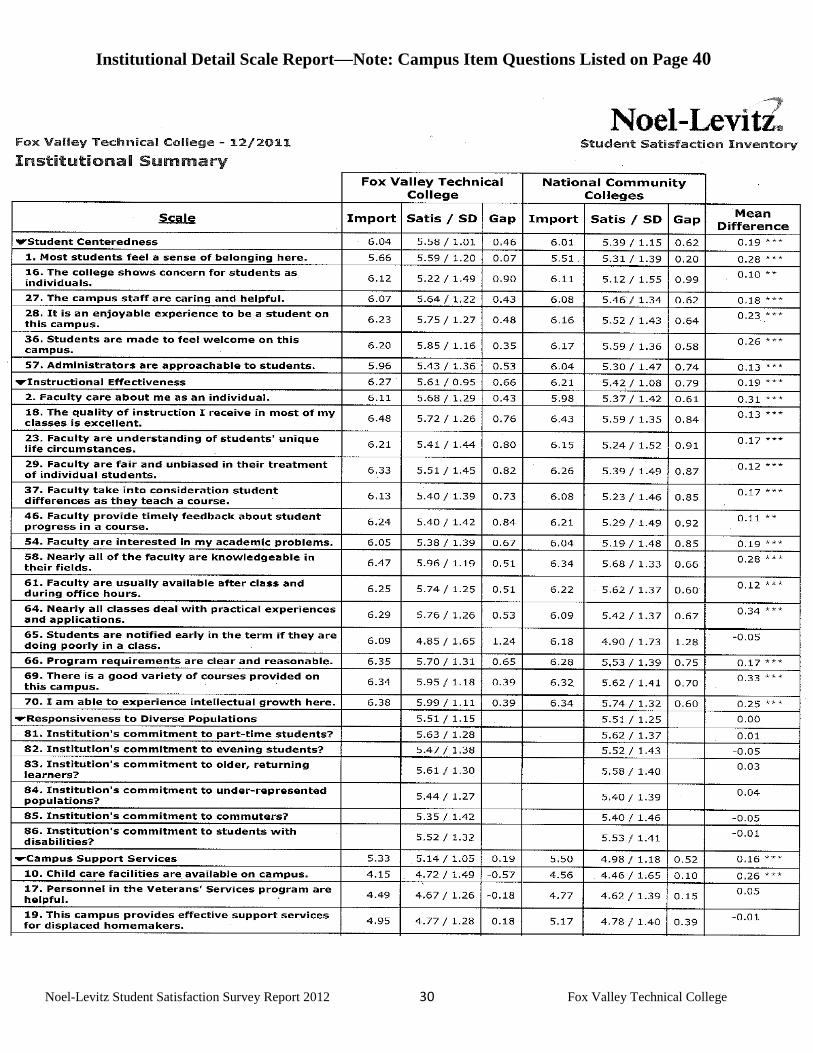
Noel-Levitz Student Satisfaction Survey Report 2012 30 Fox Valley Technical College
Institutional Detail Scale Report—Note: Campus Item Questions Listed on Page 40
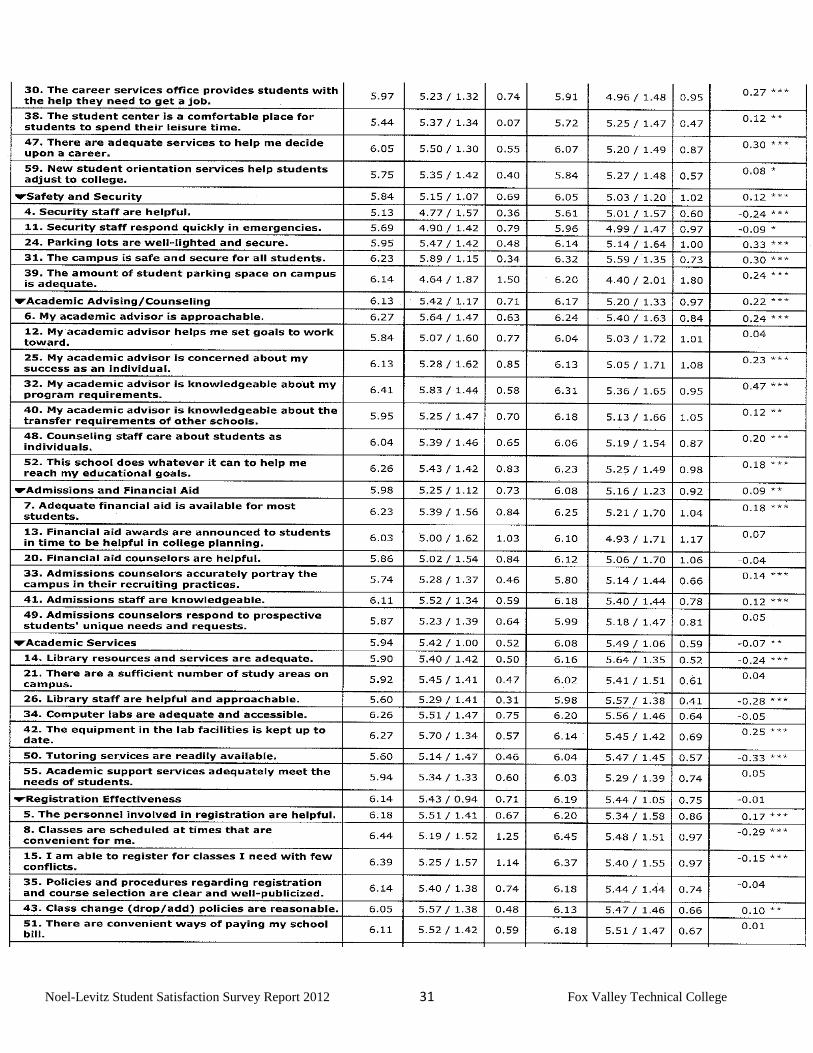
Noel-Levitz Student Satisfaction Survey Report 2012 31 Fox Valley Technical College
Noel-Levitz Student Satisfaction Survey Report 2012 32 Fox Valley Technical College
Noel-Levitz Student Satisfaction Survey Report 2012 33 Fox Valley Technical College
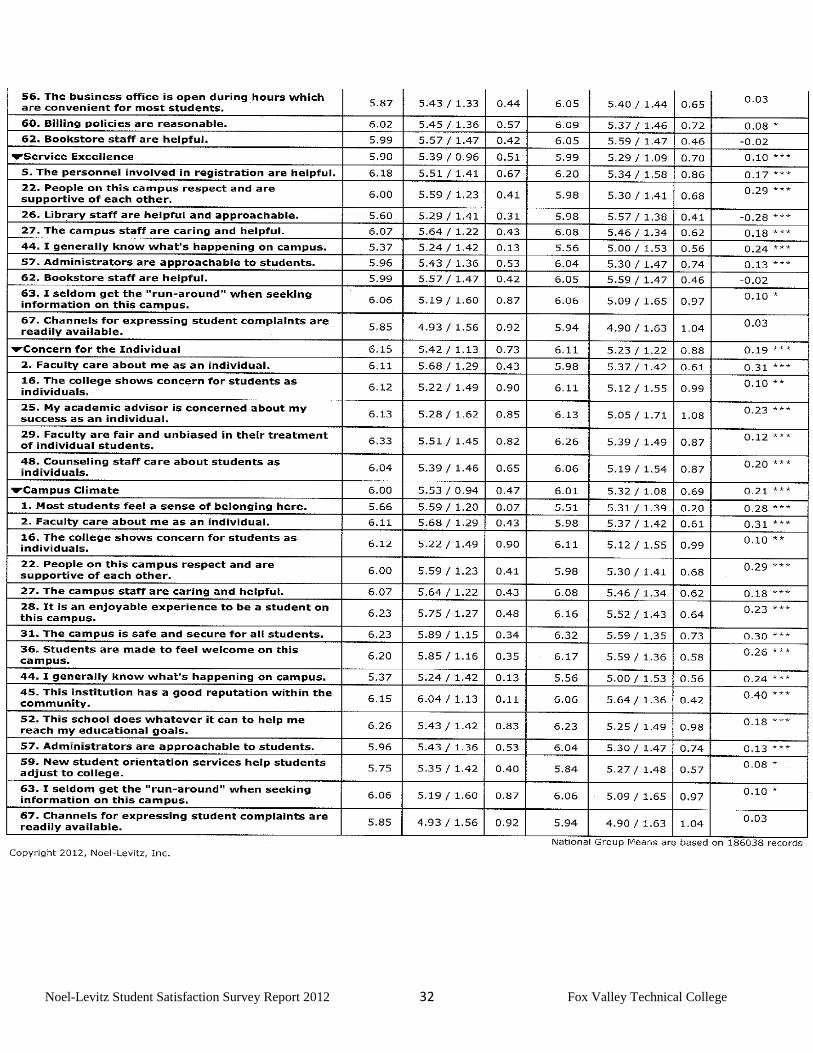
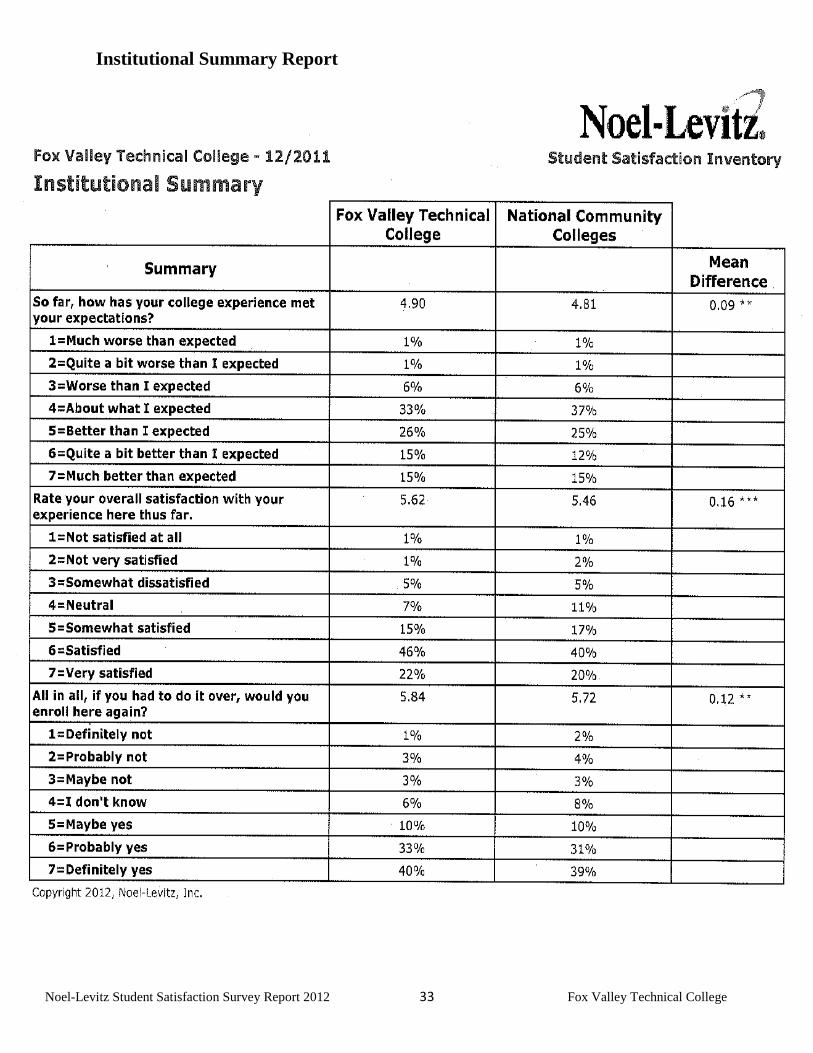
Institutional Summary Report
Noel-Levitz Student Satisfaction Survey Report 2012 34 Fox Valley Technical College
Fox Valley Technical College
Noel-Levitz Student Satisfaction
2012 Survey Report
APPENDIX
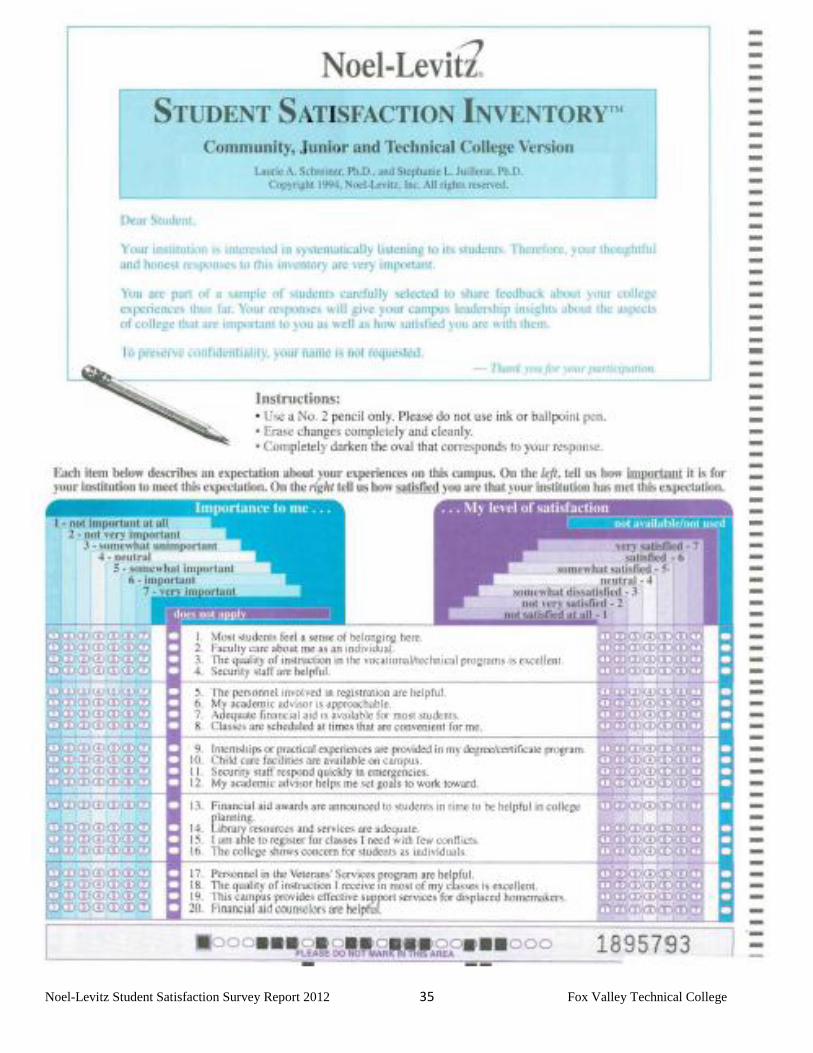
Noel-Levitz Student Satisfaction Survey Report 2012 35 Fox Valley Technical College
Noel-Levitz Student Satisfaction Survey Report 2012 36 Fox Valley Technical College
Noel-Levitz Student Satisfaction Survey Report 2012 37 Fox Valley Technical College
Noel-Levitz Student Satisfaction Survey Report 2012 38 Fox Valley Technical College
Noel-Levitz Student Satisfaction Survey Report 2012 39 Fox Valley Technical College
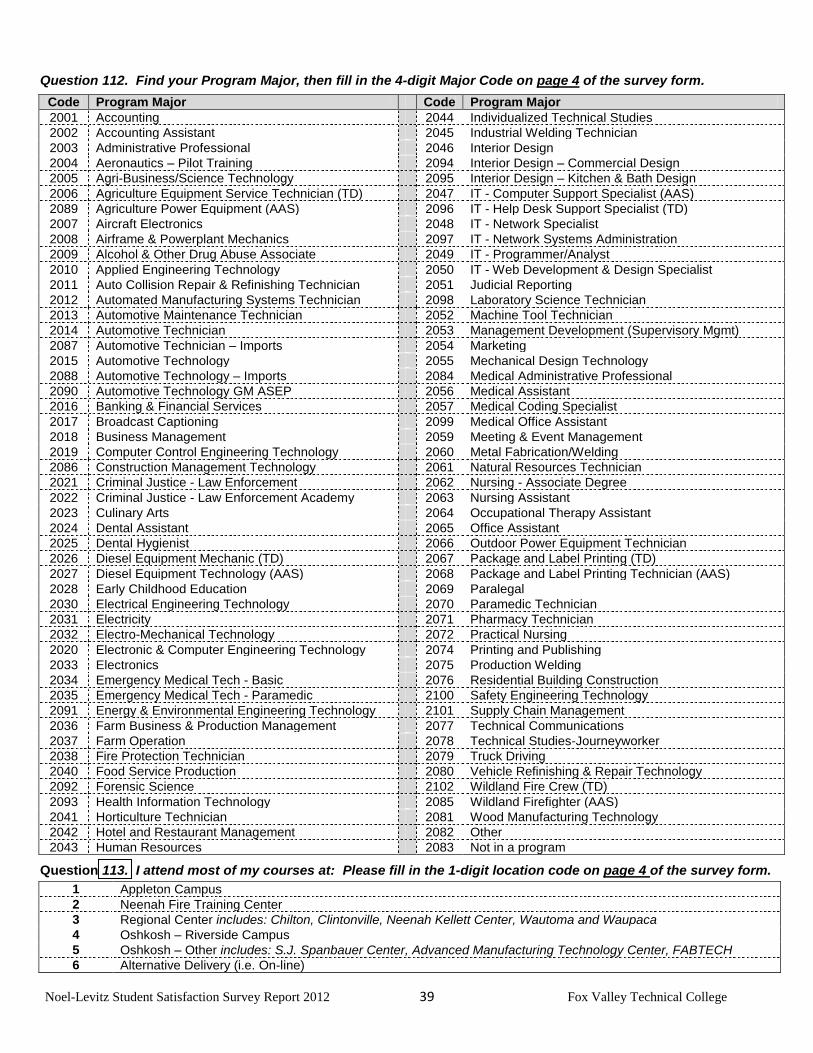
Question 112. Find your Program Major, then fill in the 4-digit Major Code on page 4 of the survey form.
Code Program Major Code Program Major
2001 Accounting 2044 Individualized Technical Studies
2002 Accounting Assistant 2045 Industrial Welding Technician
2003 Administrative Professional 2046 Interior Design
2004 Aeronautics – Pilot Training 2094 Interior Design – Commercial Design
2005 Agri-Business/Science Technology 2095 Interior Design – Kitchen & Bath Design
2006 Agriculture Equipment Service Technician (TD) 2047 IT - Computer Support Specialist (AAS)
2089 Agriculture Power Equipment (AAS) 2096 IT - Help Desk Support Specialist (TD)
2007 Aircraft Electronics 2048 IT - Network Specialist
2008 Airframe & Powerplant Mechanics 2097 IT - Network Systems Administration
2009 Alcohol & Other Drug Abuse Associate 2049 IT - Programmer/Analyst
2010 Applied Engineering Technology 2050 IT - Web Development & Design Specialist
2011 Auto Collision Repair & Refinishing Technician 2051 Judicial Reporting
2012 Automated Manufacturing Systems Technician 2098 Laboratory Science Technician
2013 Automotive Maintenance Technician 2052 Machine Tool Technician
2014 Automotive Technician 2053 Management Development (Supervisory Mgmt)
2087 Automotive Technician – Imports 2054 Marketing
2015 Automotive Technology 2055 Mechanical Design Technology
2088 Automotive Technology – Imports 2084 Medical Administrative Professional
2090 Automotive Technology GM ASEP 2056 Medical Assistant
2016 Banking & Financial Services 2057 Medical Coding Specialist
2017 Broadcast Captioning 2099 Medical Office Assistant
2018 Business Management 2059 Meeting & Event Management
2019 Computer Control Engineering Technology 2060 Metal Fabrication/Welding
2086 Construction Management Technology 2061 Natural Resources Technician
2021 Criminal Justice - Law Enforcement 2062 Nursing - Associate Degree
2022 Criminal Justice - Law Enforcement Academy 2063 Nursing Assistant
2023 Culinary Arts 2064 Occupational Therapy Assistant
2024 Dental Assistant 2065 Office Assistant
2025 Dental Hygienist 2066 Outdoor Power Equipment Technician
2026 Diesel Equipment Mechanic (TD) 2067 Package and Label Printing (TD)
2027 Diesel Equipment Technology (AAS) 2068 Package and Label Printing Technician (AAS)
2028 Early Childhood Education 2069 Paralegal
2030 Electrical Engineering Technology 2070 Paramedic Technician
2031 Electricity 2071 Pharmacy Technician
2032 Electro-Mechanical Technology 2072 Practical Nursing
2020 Electronic & Computer Engineering Technology 2074 Printing and Publishing
2033 Electronics 2075 Production Welding
2034 Emergency Medical Tech - Basic 2076 Residential Building Construction
2035 Emergency Medical Tech - Paramedic 2100 Safety Engineering Technology
2091 Energy & Environmental Engineering Technology 2101 Supply Chain Management
2036 Farm Business & Production Management 2077 Technical Communications
2037 Farm Operation 2078 Technical Studies-Journeyworker
2038 Fire Protection Technician 2079 Truck Driving
2040 Food Service Production 2080 Vehicle Refinishing & Repair Technology
2092 Forensic Science 2102 Wildland Fire Crew (TD)
2093 Health Information Technology 2085 Wildland Firefighter (AAS)
2041 Horticulture Technician 2081 Wood Manufacturing Technology
2042 Hotel and Restaurant Management 2082 Other
2043 Human Resources 2083 Not in a program
Question 113. I attend most of my courses at: Please fill in the 1-digit location code on page 4 of the survey form.
1 Appleton Campus
2 Neenah Fire Training Center
3 Regional Center includes: Chilton, Clintonville, Neenah Kellett Center, Wautoma and Waupaca
4 Oshkosh – Riverside Campus
5 Oshkosh – Other includes: S.J. Spanbauer Center, Advanced Manufacturing Technology Center, FABTECH
6 Alternative Delivery (i.e. On-line)
Noel-Levitz Student Satisfaction Survey Report 2012 40 Fox Valley Technical College
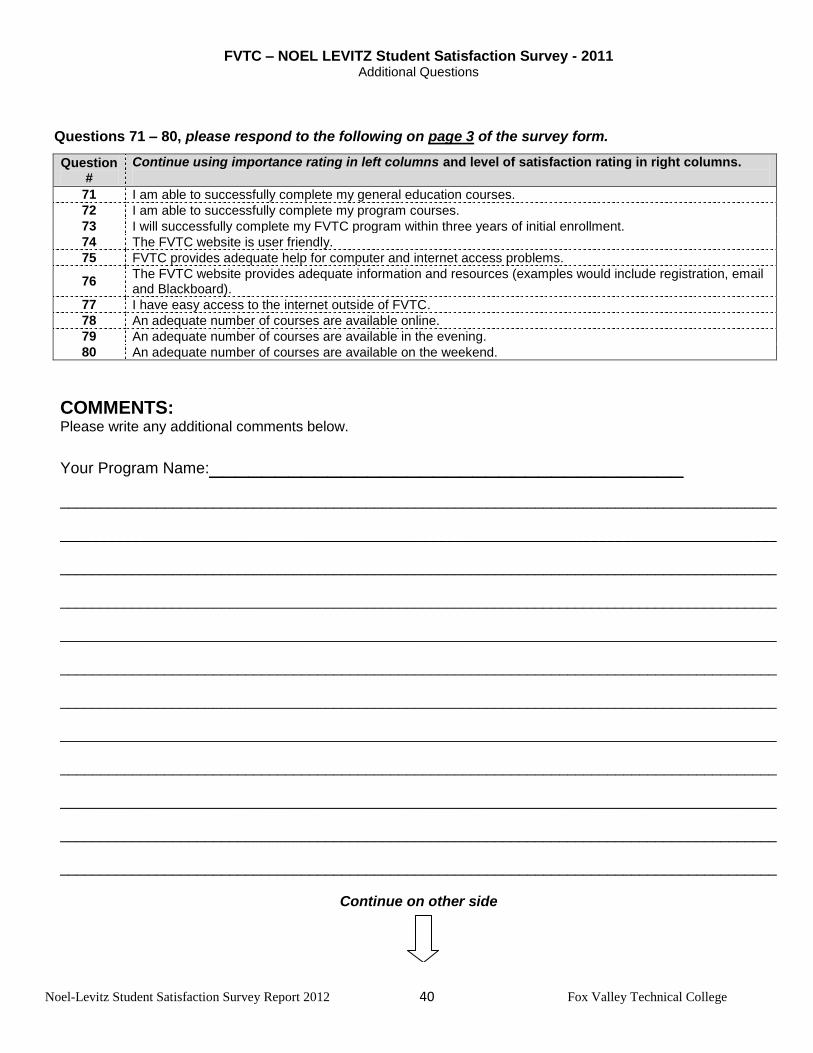
FVTC – NOEL LEVITZ Student Satisfaction Survey - 2011 Additional Questions
Questions 71 – 80, please respond to the following on page 3 of the survey form.
Question #
Continue using importance rating in left columns and level of satisfaction rating in right columns.
71 I am able to successfully complete my general education courses.
72 I am able to successfully complete my program courses.
73 I will successfully complete my FVTC program within three years of initial enrollment.
74 The FVTC website is user friendly.
75 FVTC provides adequate help for computer and internet access problems.
76 The FVTC website provides adequate information and resources (examples would include registration, email and Blackboard).
77 I have easy access to the internet outside of FVTC.
78 An adequate number of courses are available online.
79 An adequate number of courses are available in the evening.
80 An adequate number of courses are available on the weekend.
COMMENTS: Please write any additional comments below.
Your Program Name:____________________________________
_________________________________________________________________________________________
_________________________________________________________________________________________
_________________________________________________________________________________________
_________________________________________________________________________________________
_________________________________________________________________________________________
_________________________________________________________________________________________
_________________________________________________________________________________________
_________________________________________________________________________________________
_________________________________________________________________________________________
_________________________________________________________________________________________
_________________________________________________________________________________________
_________________________________________________________________________________________
Continue on other side
Noel-Levitz Student Satisfaction Survey Report 2012 41 Fox Valley Technical College
Noel-Levitz Student Satisfaction Survey Report 2012 42 Fox Valley Technical College