Embed Size (px)
Citation preview

Node.jsInflux
Grafana


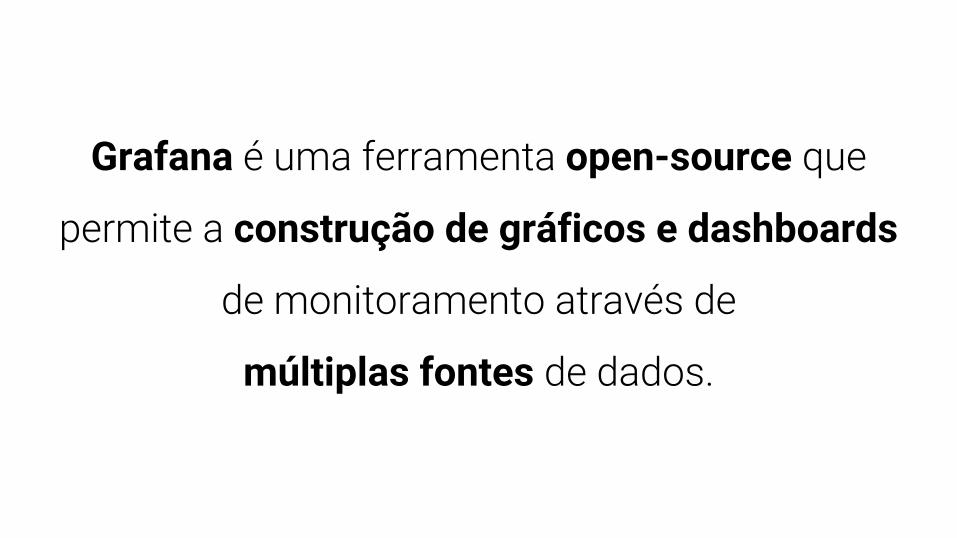
Grafana open-source
construção de gráficos e dashboards
múltiplas fontes

InfluxDB banco de dados
time-series

Talk isthe code!

github.com/lucasinocente/influx-grafana-docker-tdc2018
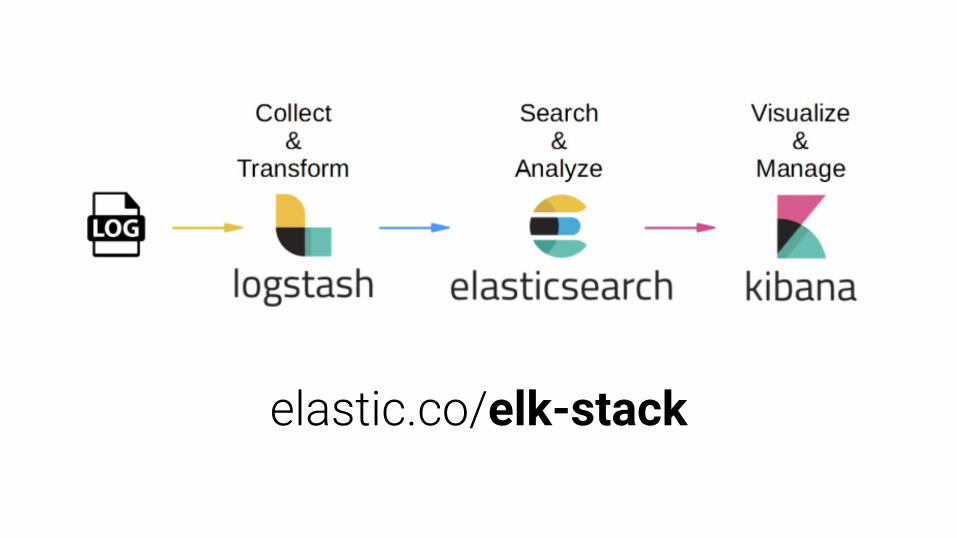
elk-stack

35.170.200.233:3000USER: admin PASS: tdc2018

vlw