Embed Size (px)
Citation preview

Nobina AB Group
Investor Presentation Q2 Jun – Aug 2011/2012

This presentation includes statements regarding current expectations going forward, but subject to risks and uncertainties. Examples of risks and uncertainties include economic conditions, product demand, competition, government regulation, financial resources, and certain litigation. Our financial statements and latest annual report provide a more detailed view of financials as well as risks and uncertainties.
Please note that all figures in this presentation are based on IFRS accounting standards.
2

Business highlights
Large start-ups of new contracts and
close-downs of expired contracts are
all implemented
100th anniversary of Nobina´s first bus
journey was celebrated on June 23rd
Continued revenue decrease in
Interregional traffic - Swebus
PTA reorganization in Sweden creates
changes in public transport decision-
making
Nobina Board member Jan Sundling
appointed Chairman of Swedish Rail,
(SJ) and resigns from Nobina Board
3

Presentation, namn på talare
4
Financial highlights Q2
Sales increased by 9.9% to MSEK 1,739
(1,582) due to contract overlap
EBIT of MSEK 67 (90); Regional traffic
affected by large contract migration,
lower revenue in Interregional traffic,
inefficiency in Norway
Net earnings of MSEK -18 (45), affected
by negative F/X MSEK -20 (13)
Earnings per share were SEK -0.74 (1.81)
Cash flow from operations of MSEK 80 (76)
4

Financial highlights YTD
5
Sales increased by 7.3% to MSEK 3,553
(3,311)
EBIT of MSEK 127 (138); positive effects
and large contract migration in Regional
traffic, lower revenue in Interregional
traffic
Net earnings of MSEK -30 (46), affected
by negative F/X MSEK -25(24)
Earnings per share were SEK -1.21 (1.85)
Cash flow from operations of MSEK 224(221)
Market development
Limited announcements of tenders in Q2. Pending:
Sweden: Skåne, Jönköping and Uppland
Norway: Hordaland, Buskerud and Hedmark
The EU has decided that ESA made an incorrect decision concerning the municipality loan in 2004 to a publicly owned bus operator
Nobina has turned to the EU on the subject of continuing injection of taxpayers’ money into the public owned Finnish bus operator HELB
Ongoing structural changes due to new Swedish public transport legislation taking effect on 1 Jan 2012:
The organization of public transport in Sweden continues to be debated and changes in decision-making will be one consequence.
Being active in both regional and interregional traffic, Nobina will benefit from the new legislation.
A Nobina “100 year anniversary tour” has made stops in five Swedish cities, including workshops on future public transport
6
Operations – regional traffic
Large contract migration in the Swedish market in Q2, were all implemented:
start-ups in Norrtälje, Norrköping, Helsingborg, Gothenburg
close-downs in Nacka and Huddinge
Statistics continue to show further passenger increase in public transport in the Nordic market. E.g. Norway showed a 4.4% increase in public transport trips in 2010
Solid performance in Sweden, Finland and Denmark. Norway became the biggest operator in bus-for-rail this summer leading to enormous extra traffic. Norway continues to focus on its’ high cost base
Three former managers of Nobina were appointed Heads of PTAs during the last year, which we regard as a credit to our organization
7
Operations – interregional traffic
Weak demand in Swedish interregional bus and rail market:
stronger household finances
increased competition from low price air travel, new commercial rail operators and PTA interregional traffic
Strong summer for Swebus’ airport shuttle (Stockholm-Arlanda) with an increasing market share reaching ~10%
Improved payment solutions are tested, as bank card security complicates travelers ticket purchasing
Ongoing focus on increased operational efficiency and cost-flexibility
8
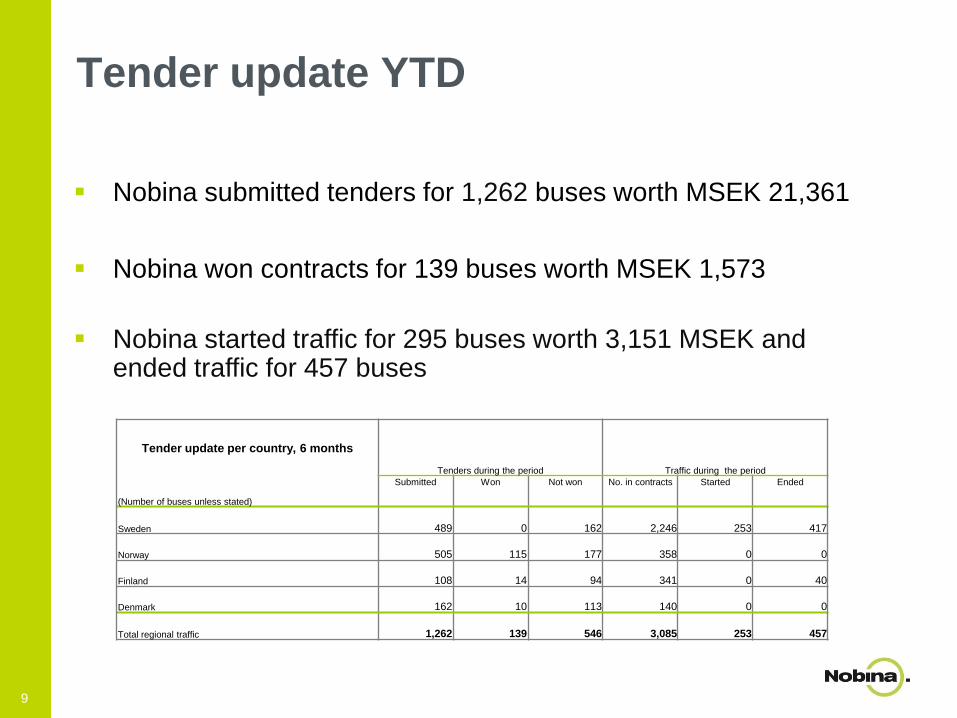
Tender update YTD
9
Nobina submitted tenders for 1,262 buses worth MSEK 21,361
Nobina won contracts for 139 buses worth MSEK 1,573
Nobina started traffic for 295 buses worth 3,151 MSEK and ended traffic for 457 buses
Tender update per country, 6 months
Tenders during the period Traffic during the period
(Number of buses unless stated)
Submitted Won Not won No. in contracts Started Ended
Sweden 489 0 162 2,246 253 417
Norway 505 115 177 358 0 0
Finland 108 14 94 341 0 40
Denmark 162 10 113 140 0 0
Total regional traffic 1,262 139 546 3,085 253 457
Thank you!
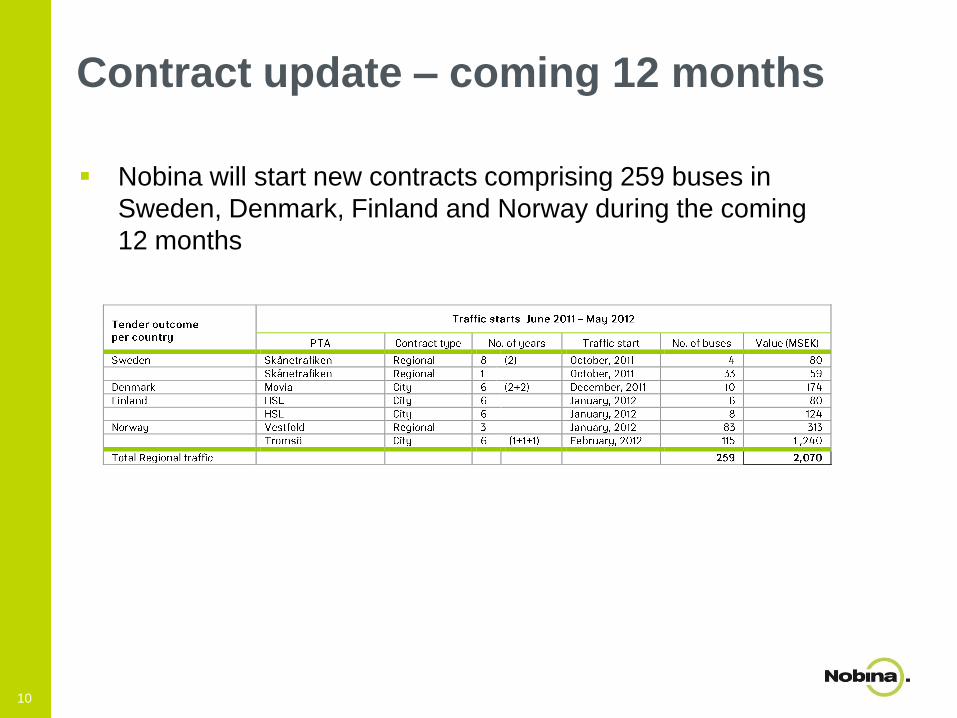
Contract update – coming 12 months
Nobina will start new contracts comprising 259 buses in
Sweden, Denmark, Finland and Norway during the coming
12 months
10
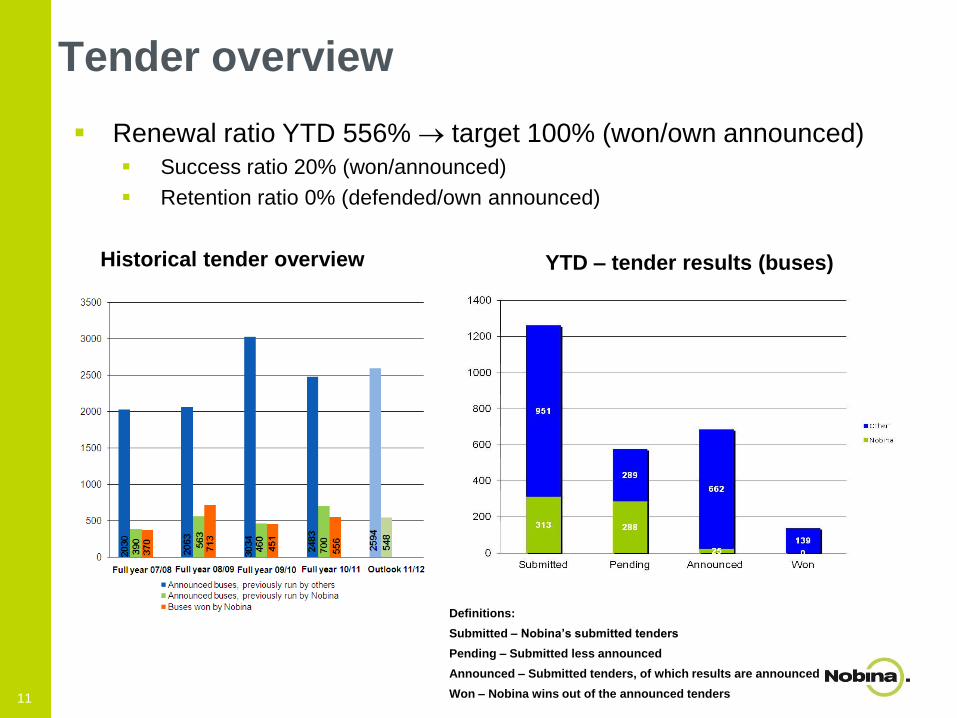
Tender overview
Renewal ratio YTD 556% target 100% (won/own announced)
Success ratio 20% (won/announced)
Retention ratio 0% (defended/own announced)
11
Definitions:
Submitted – Nobina’s submitted tenders
Pending – Submitted less announced
Announced – Submitted tenders, of which results are announced
Won – Nobina wins out of the announced tenders
YTD – tender results (buses)Historical tender overview
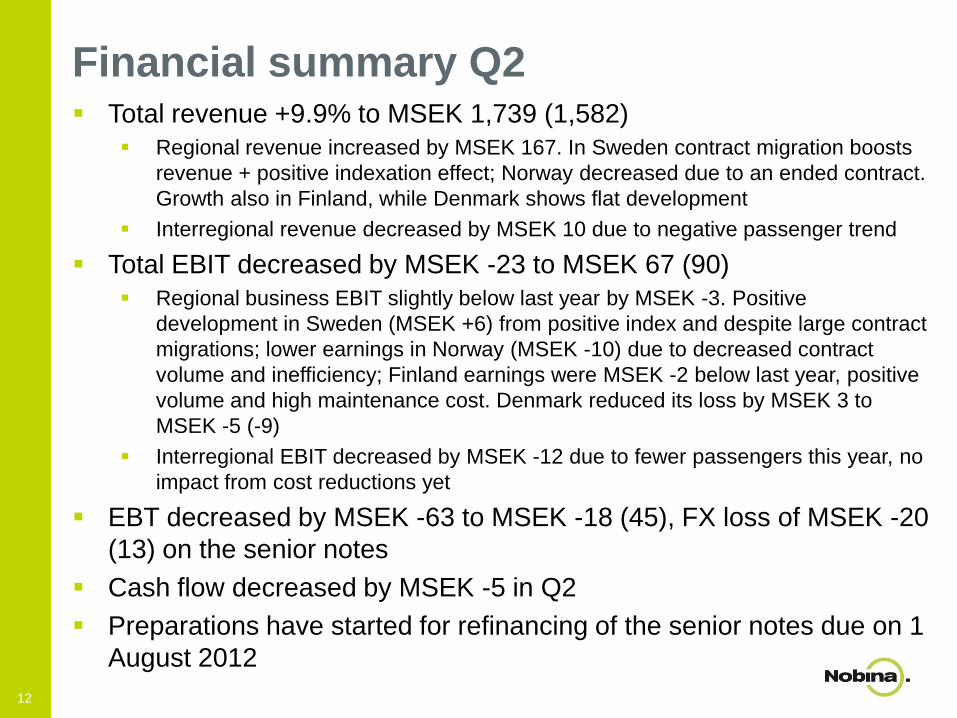
Financial summary Q2 Total revenue +9.9% to MSEK 1,739 (1,582)
Regional revenue increased by MSEK 167. In Sweden contract migration boosts
revenue + positive indexation effect; Norway decreased due to an ended contract.
Growth also in Finland, while Denmark shows flat development
Interregional revenue decreased by MSEK 10 due to negative passenger trend
Total EBIT decreased by MSEK -23 to MSEK 67 (90)
Regional business EBIT slightly below last year by MSEK -3. Positive
development in Sweden (MSEK +6) from positive index and despite large contract
migrations; lower earnings in Norway (MSEK -10) due to decreased contract
volume and inefficiency; Finland earnings were MSEK -2 below last year, positive
volume and high maintenance cost. Denmark reduced its loss by MSEK 3 to
MSEK -5 (-9)
Interregional EBIT decreased by MSEK -12 due to fewer passengers this year, no
impact from cost reductions yet
EBT decreased by MSEK -63 to MSEK -18 (45), FX loss of MSEK -20
(13) on the senior notes
Cash flow decreased by MSEK -5 in Q2
Preparations have started for refinancing of the senior notes due on 1
August 2012
12
13
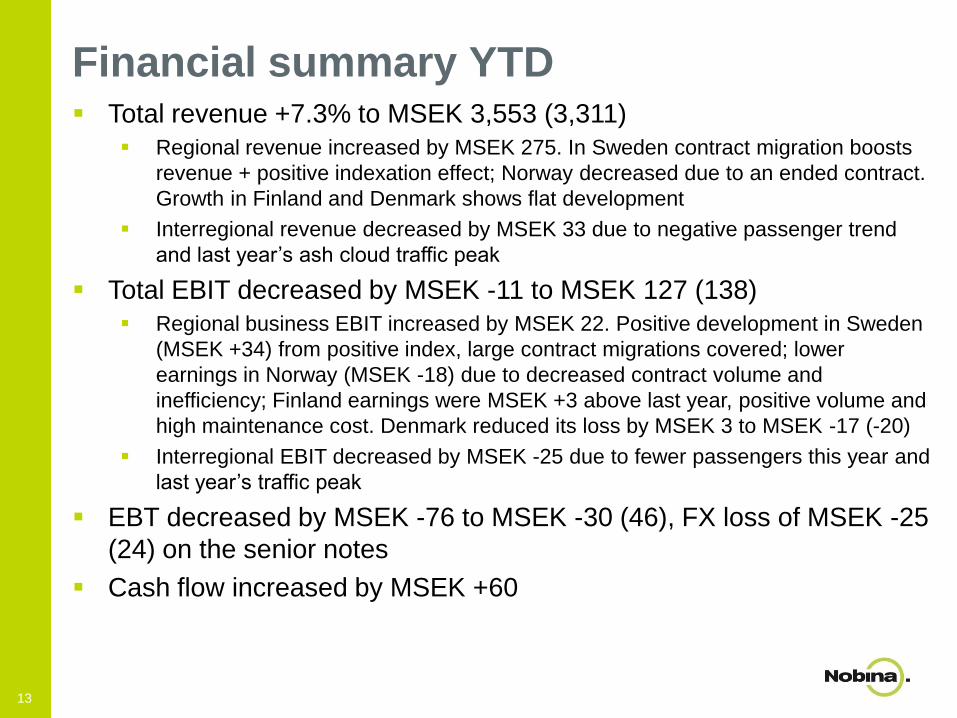
Financial summary YTD Total revenue +7.3% to MSEK 3,553 (3,311)
Regional revenue increased by MSEK 275. In Sweden contract migration boosts
revenue + positive indexation effect; Norway decreased due to an ended contract.
Growth in Finland and Denmark shows flat development
Interregional revenue decreased by MSEK 33 due to negative passenger trend
and last year’s ash cloud traffic peak
Total EBIT decreased by MSEK -11 to MSEK 127 (138)
Regional business EBIT increased by MSEK 22. Positive development in Sweden
(MSEK +34) from positive index, large contract migrations covered; lower
earnings in Norway (MSEK -18) due to decreased contract volume and
inefficiency; Finland earnings were MSEK +3 above last year, positive volume and
high maintenance cost. Denmark reduced its loss by MSEK 3 to MSEK -17 (-20)
Interregional EBIT decreased by MSEK -25 due to fewer passengers this year and
last year’s traffic peak
EBT decreased by MSEK -76 to MSEK -30 (46), FX loss of MSEK -25
(24) on the senior notes
Cash flow increased by MSEK +60
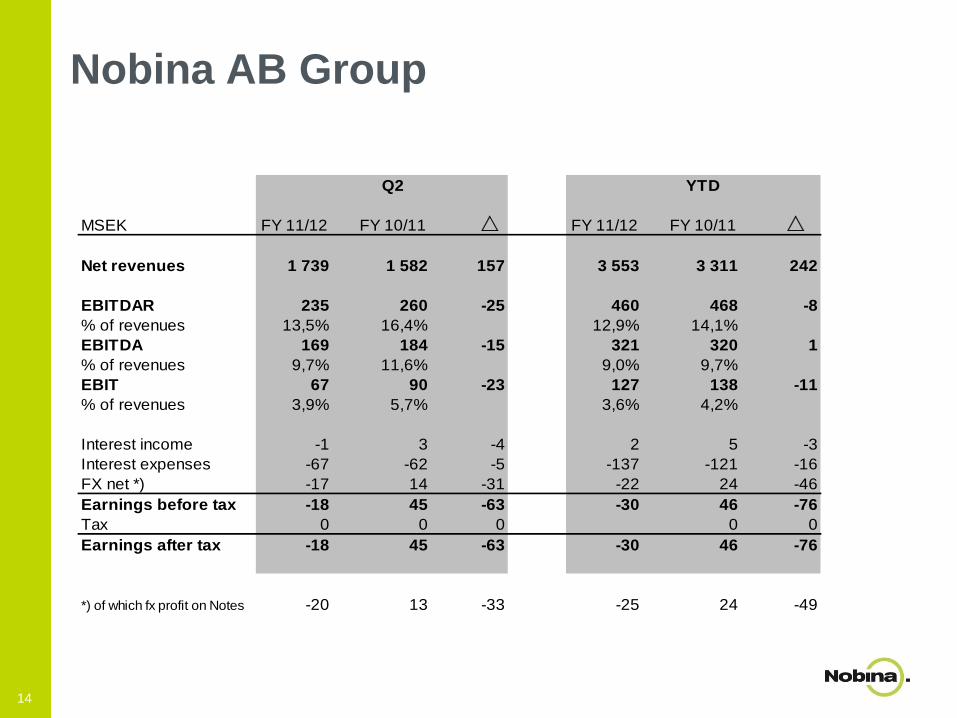
Nobina AB Group
Q2 YTD
MSEK FY 11/12 FY 10/11 FY 11/12 FY 10/11
Net revenues 1 739 1 582 157 3 553 3 311 242
EBITDAR 235 260 -25 460 468 -8
% of revenues 13,5% 16,4% 12,9% 14,1%
EBITDA 169 184 -15 321 320 1
% of revenues 9,7% 11,6% 9,0% 9,7%
EBIT 67 90 -23 127 138 -11
% of revenues 3,9% 5,7% 3,6% 4,2%
Interest income -1 3 -4 2 5 -3
Interest expenses -67 -62 -5 -137 -121 -16
FX net *) -17 14 -31 -22 24 -46
Earnings before tax -18 45 -63 -30 46 -76
Tax 0 0 0 0 0
Earnings after tax -18 45 -63 -30 46 -76
*) of which fx profit on Notes -20 13 -33 -25 24 -49
14
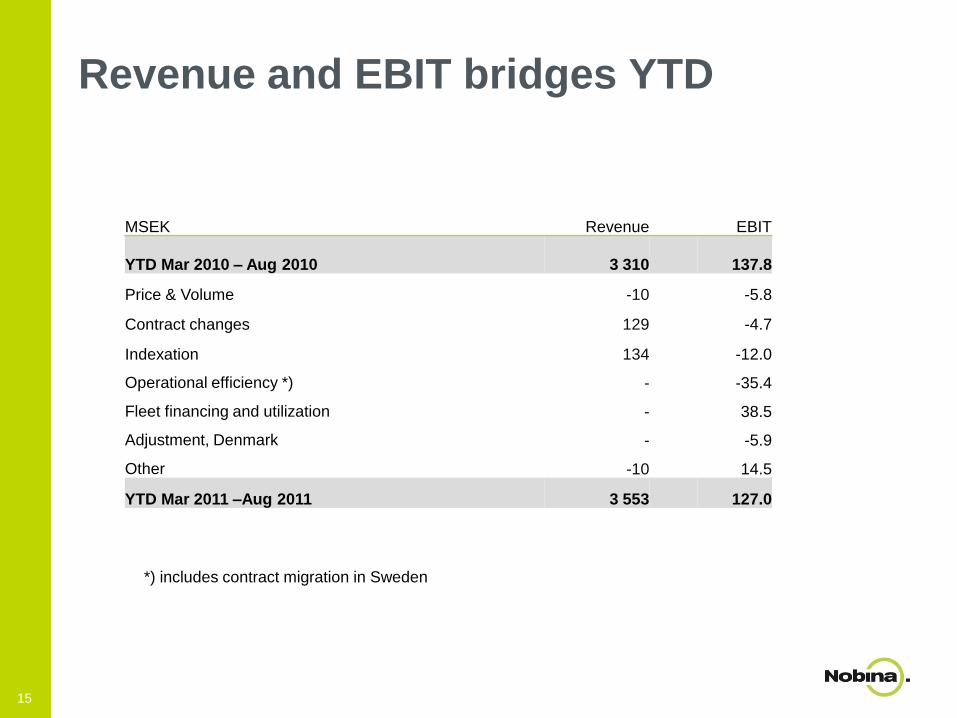
Revenue and EBIT bridges YTD
MSEK Revenue EBIT
YTD Mar 2010 – Aug 2010 3 310 137.8
Price & Volume -10 -5.8
Contract changes 129 -4.7
Indexation 134 -12.0
Operational efficiency *) - -35.4
Fleet financing and utilization - 38.5
Adjustment, Denmark - -5.9
Other -10 14.5
YTD Mar 2011 –Aug 2011 3 553 127.0
15
*) includes contract migration in Sweden
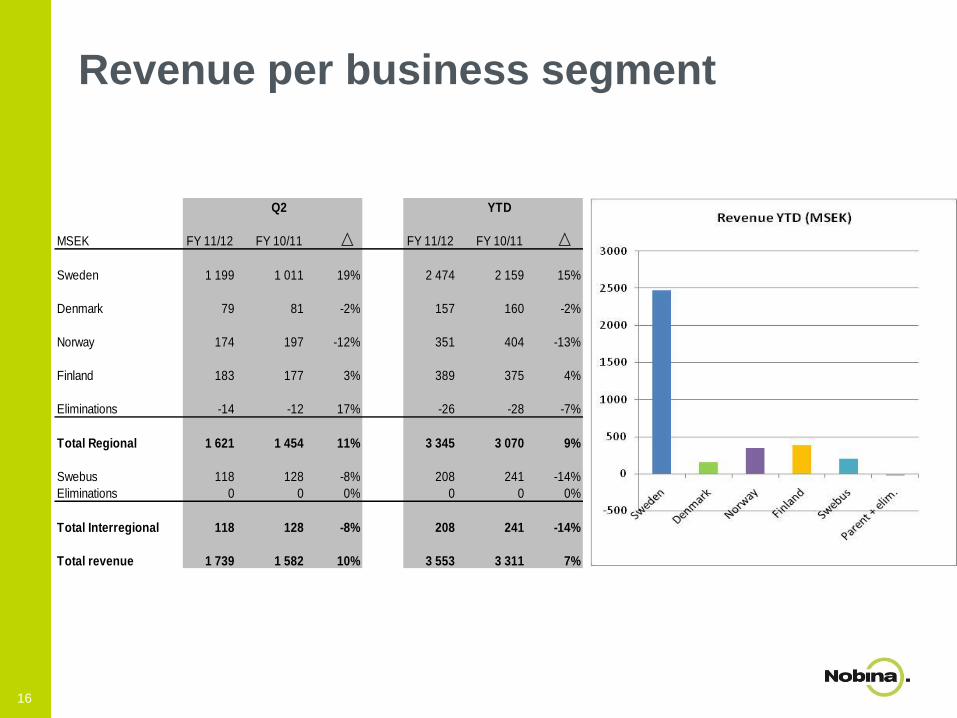
Revenue per business segment
Q2 YTD
MSEK FY 11/12 FY 10/11 FY 11/12 FY 10/11
Sweden 1 199 1 011 19% 2 474 2 159 15%
Denmark 79 81 -2% 157 160 -2%
Norway 174 197 -12% 351 404 -13%
Finland 183 177 3% 389 375 4%
Eliminations -14 -12 17% -26 -28 -7%
Total Regional 1 621 1 454 11% 3 345 3 070 9%
Swebus 118 128 -8% 208 241 -14%
Eliminations 0 0 0% 0 0 0%
Total Interregional 118 128 -8% 208 241 -14%
Total revenue 1 739 1 582 10% 3 553 3 311 7%
16

Q2 YTD
MSEK FY 11/12 FY 10/11 FY 11/12 FY 10/11
Sweden 61 55 6 139 105 34
Denmark -5 -8 3 -17 -20 3
Norway 6 16 -10 5 23 -18
Finland 0 2 -2 6 3 3
Total Regional 62 65 -3 133 111 22
Interregional 15 27 -12 13 38 -25
HQ and other -10 -2 -8 -19 -11 -8
EBIT 67 90 -23 127 138 -11
Financial net -85 -45 -40 -157 -92 -65
PBT -18 45 -63 -30 46 -76
EBIT per business segment
17
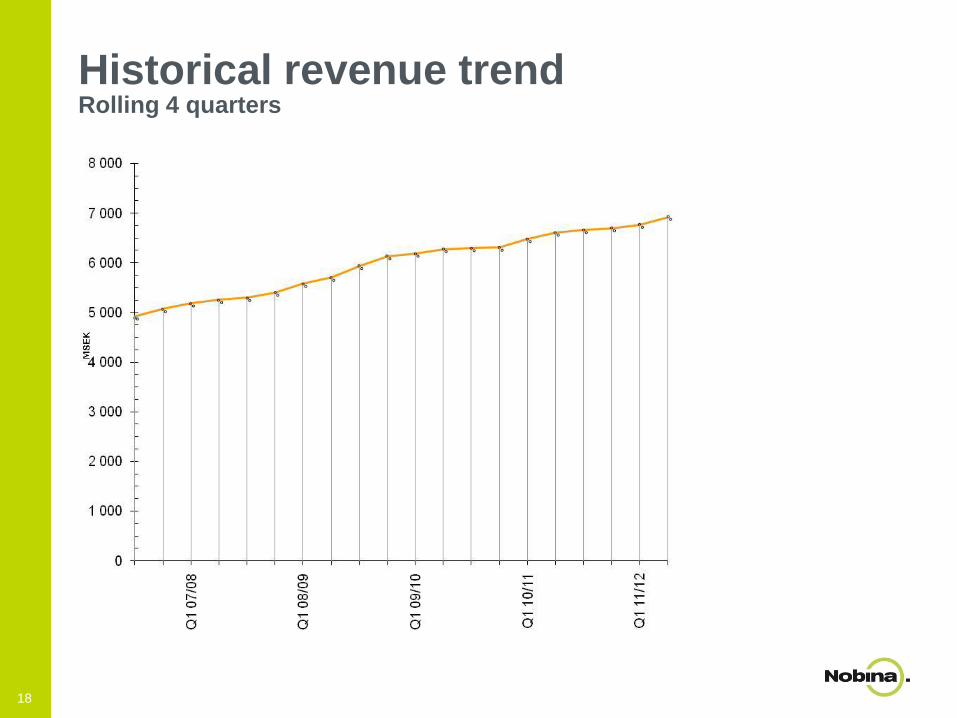
Historical revenue trendRolling 4 quarters
18

Historical earnings trend Rolling 4 quarters
*) Excluding one-offs and non-recurring
*)
19

Cash flow
Q2 YTD
MSEK FY 11/12 FY 10/11 FY 11/12 FY 10/11
Cash flow from operations before
changes in working capital 171 178 -7 324 318 6
Change in working capital -91 -102 11 -100 -97 -3
Cash flow from operations 80 76 4 224 221 3
Cash flow from investing activities -21 -30 9 66 -42 108
Cash flow from financing activities -275 -257 -18 -396 -345 -51
Cash flow for the period -216 -211 -5 -106 -166 60
Available cash *) 124 160 -36 124 160 -36
*) Restricted cash of MSEK 109 (144) not included
20
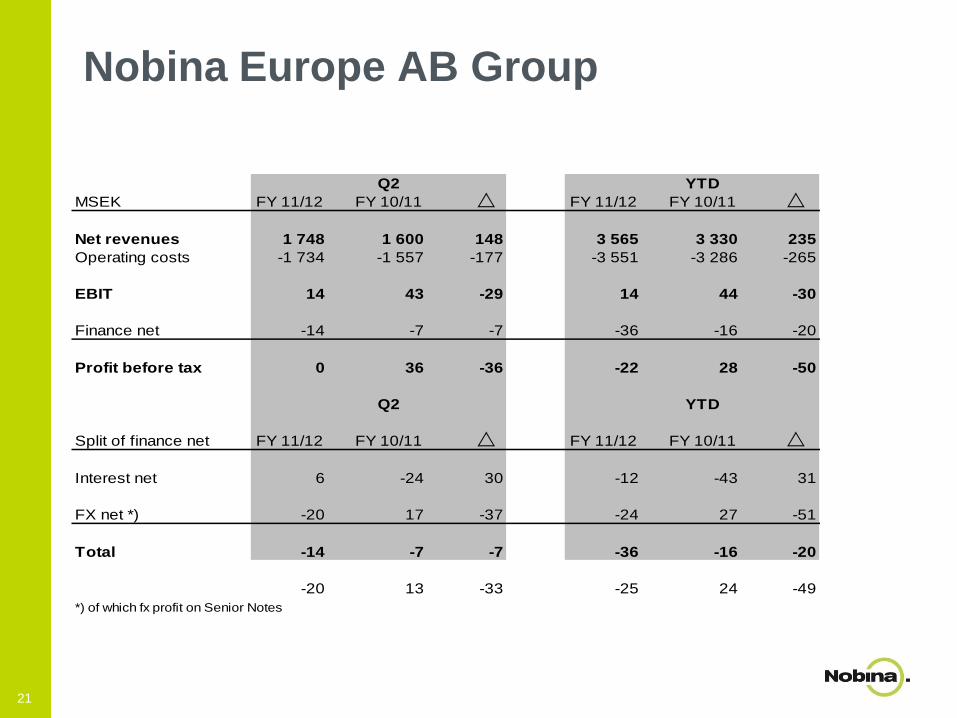
Nobina Europe AB Group
Q2 YTD
MSEK FY 11/12 FY 10/11 FY 11/12 FY 10/11
Net revenues 1 748 1 600 148 3 565 3 330 235
Operating costs -1 734 -1 557 -177 -3 551 -3 286 -265
EBIT 14 43 -29 14 44 -30
Finance net -14 -7 -7 -36 -16 -20
Profit before tax 0 36 -36 -22 28 -50
Q2 YTD
Split of finance net FY 11/12 FY 10/11 FY 11/12 FY 10/11
Interest net 6 -24 30 -12 -43 31
FX net *) -20 17 -37 -24 27 -51
Total -14 -7 -7 -36 -16 -20
-20 13 -33 -25 24 -49
*) of which fx profit on Senior Notes
21
Conclusions
Q2 EBIT was affected by planned regional contract migrations and
weaker demand in interregional traffic
Few tender decisions in Q2 pushing large volumes into Q3
As a consequence of new legislation which enters into force on 1
Jan 2012 in Swedish public transport, decision-making will be
changed
Preparations have started for refinancing of outstanding senior
notes
22
23
Armégatan 38, 171 54 Solna, Sweden
Telephone: +46 8 4106 5000
Fax: +46 8 272303
www.nobina.com