Embed Size (px)
Citation preview
LIVE INTERACTIVE LEARNING @ YOUR DESKTOP
September 14, 2011
NOAA: Interactive Visualization Tools for Climate
Presented by: LuAnn Dahlman and Bart Merrick
Interactive Visualization Tools for Climate
NSTA Webinar — September 14, 2011
LuAnn DahlmanClimate Program Office
Bart MerrickEnvironmental Science Training Center
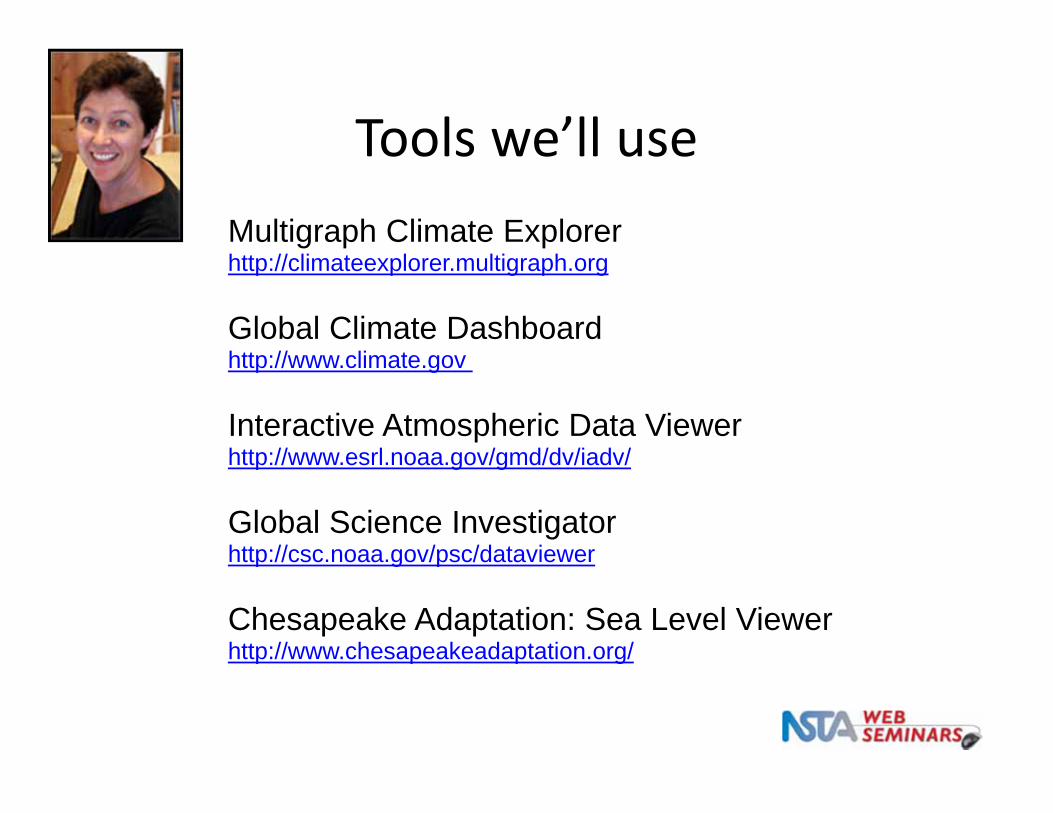
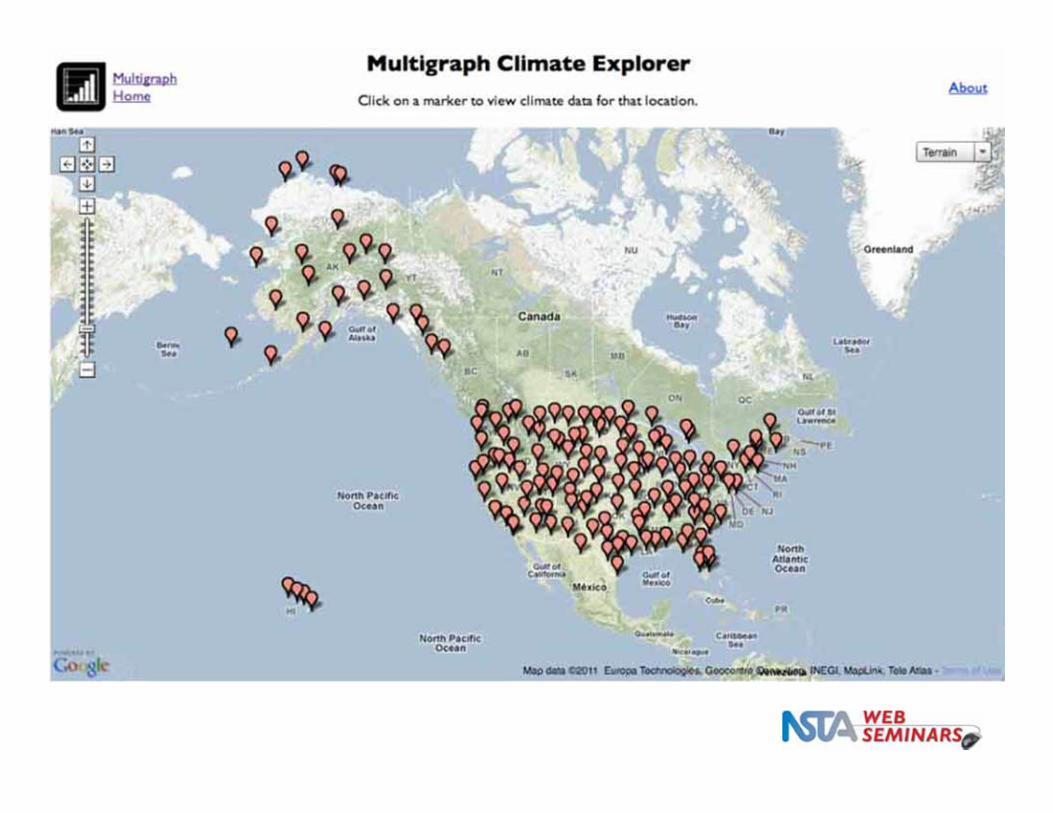
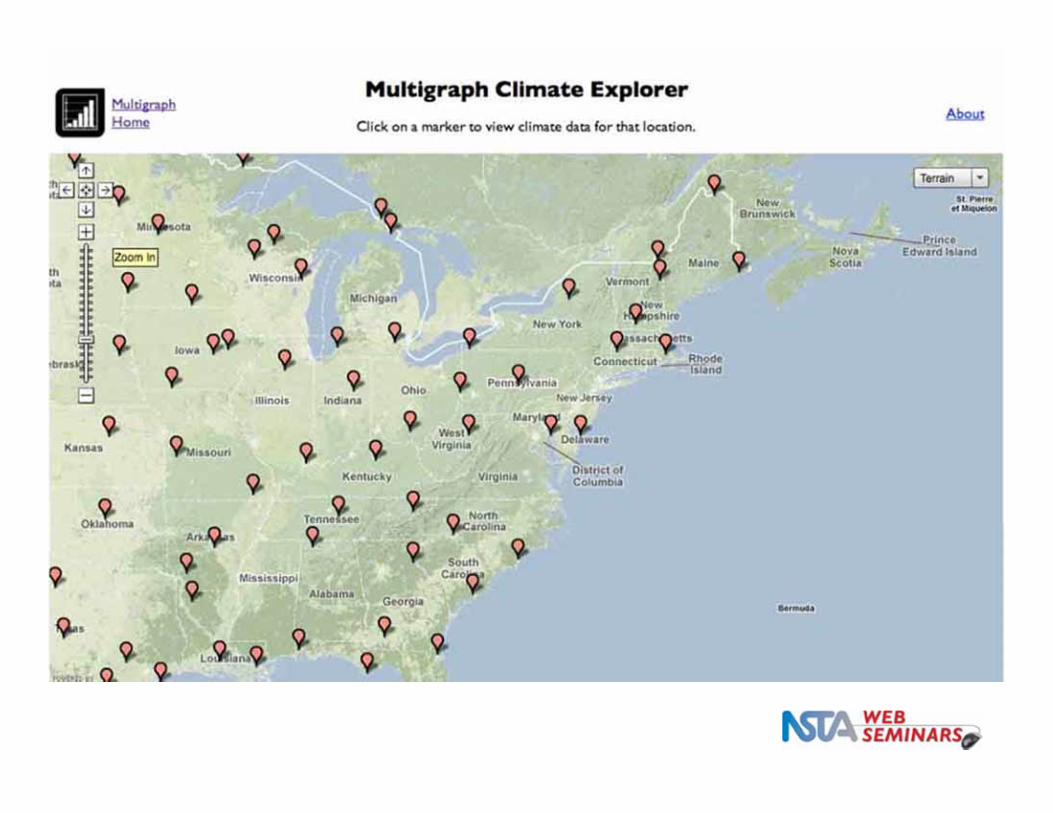
Tools we’ll useMultigraph Climate Explorerhttp://climateexplorer.multigraph.org
Global Climate Dashboardhttp://www.climate.gov
Interactive Atmospheric Data Viewerhttp://www.esrl.noaa.gov/gmd/dv/iadv/
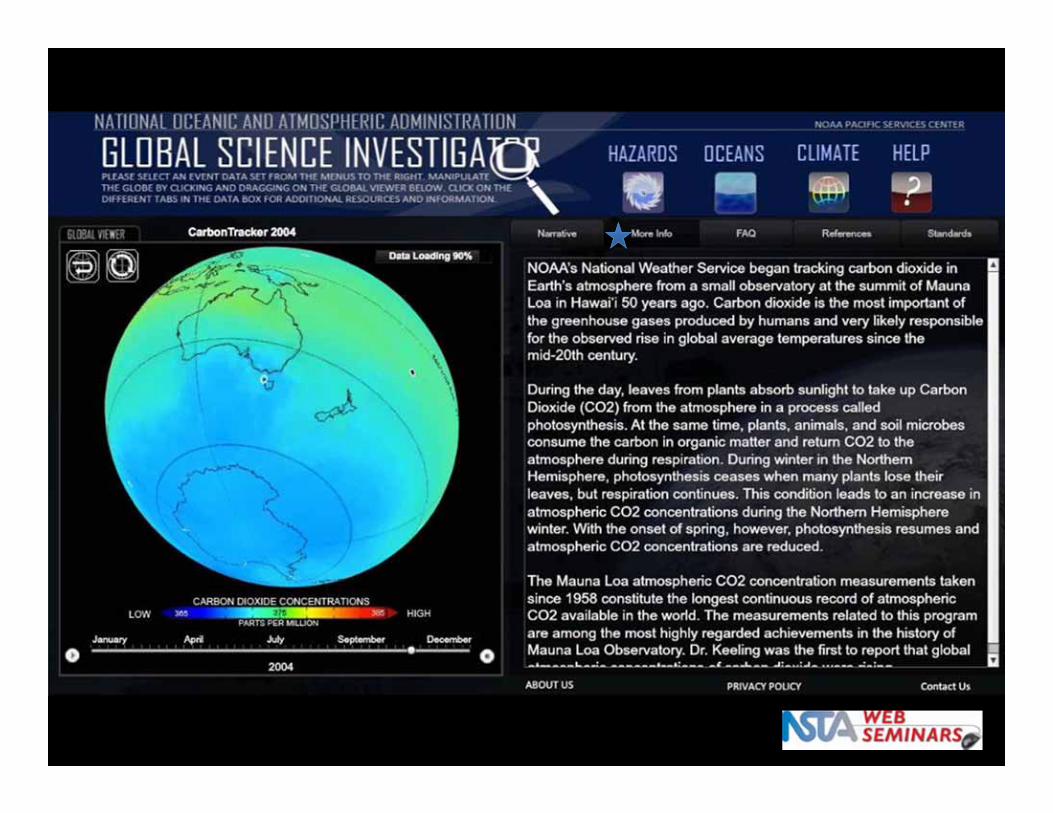
Global Science Investigatorhttp://csc.noaa.gov/psc/dataviewer
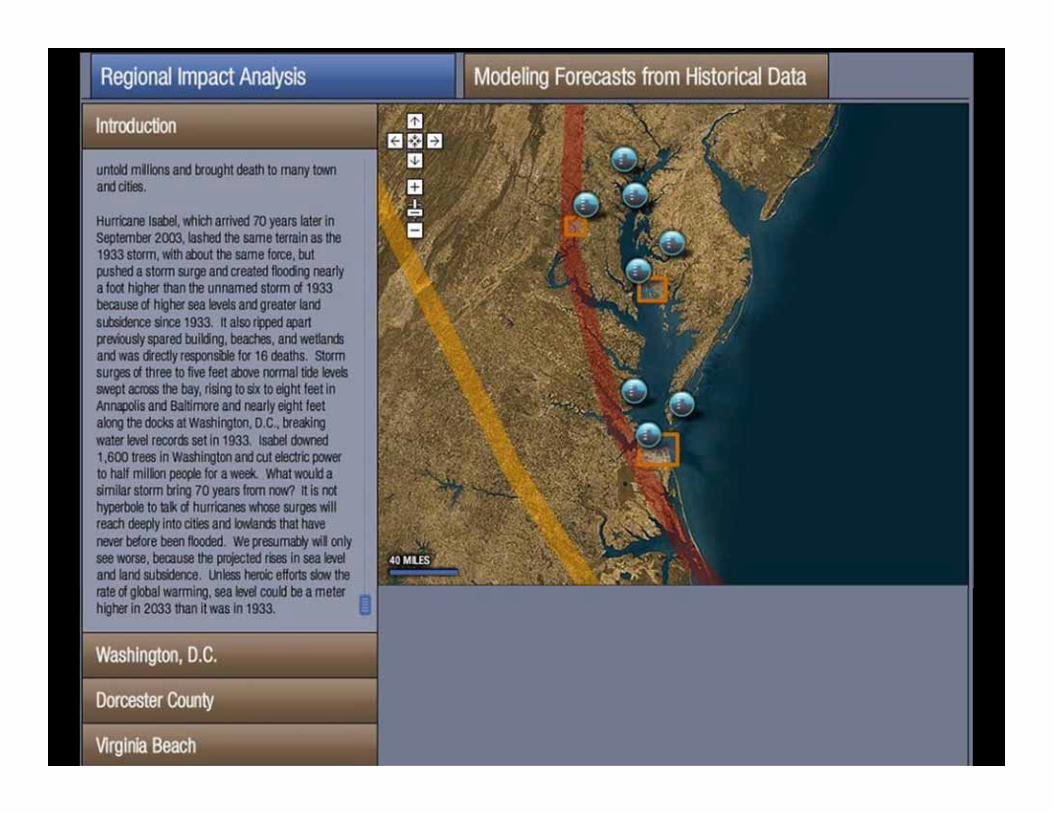
Chesapeake Adaptation: Sea Level Viewerhttp://www.chesapeakeadaptation.org/

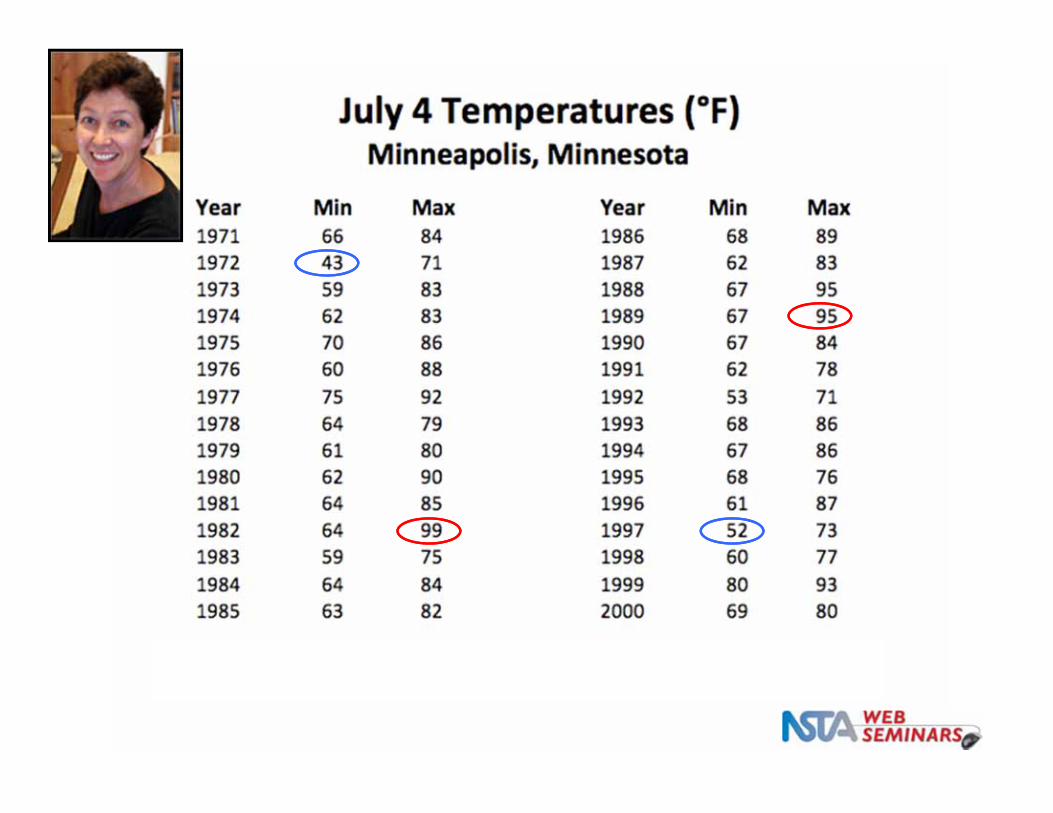
1971 — Annual 4th of July Picnic —Minneapolis, Minnesota

1972 — Annual 4th of July Picnic —Minneapolis, Minnesota


1980 — Annual 4th of July Picnic —Minneapolis, Minnesota

1990 — Annual 4th of July Picnic —Minneapolis, Minnesota

2000 — Annual 4th of July Picnic —Minneapolis, Minnesota
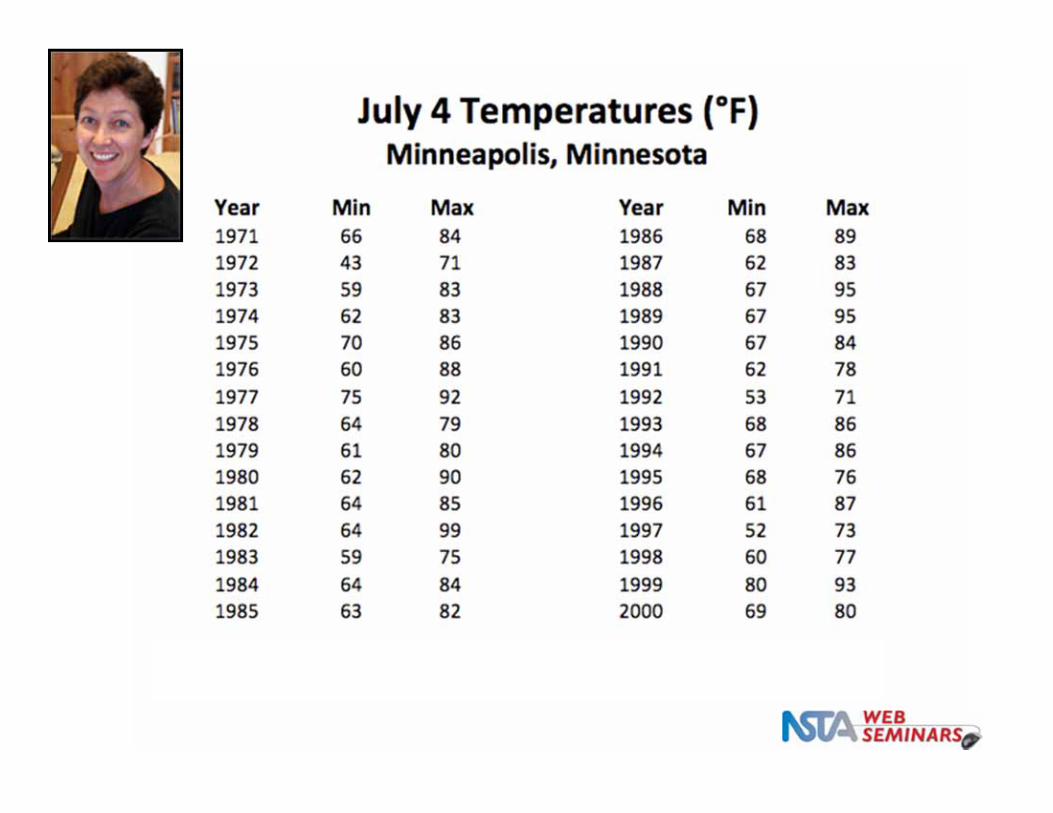
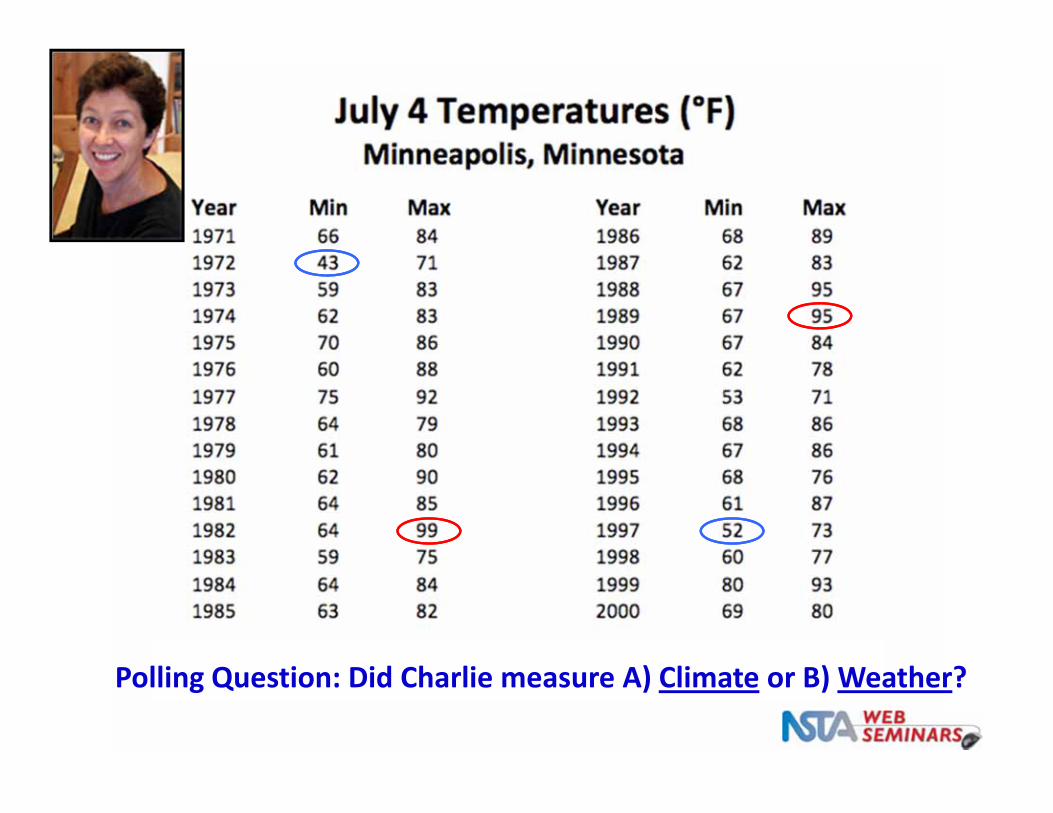
Polling Question: Did Charlie measure A) Climate or B) Weather?

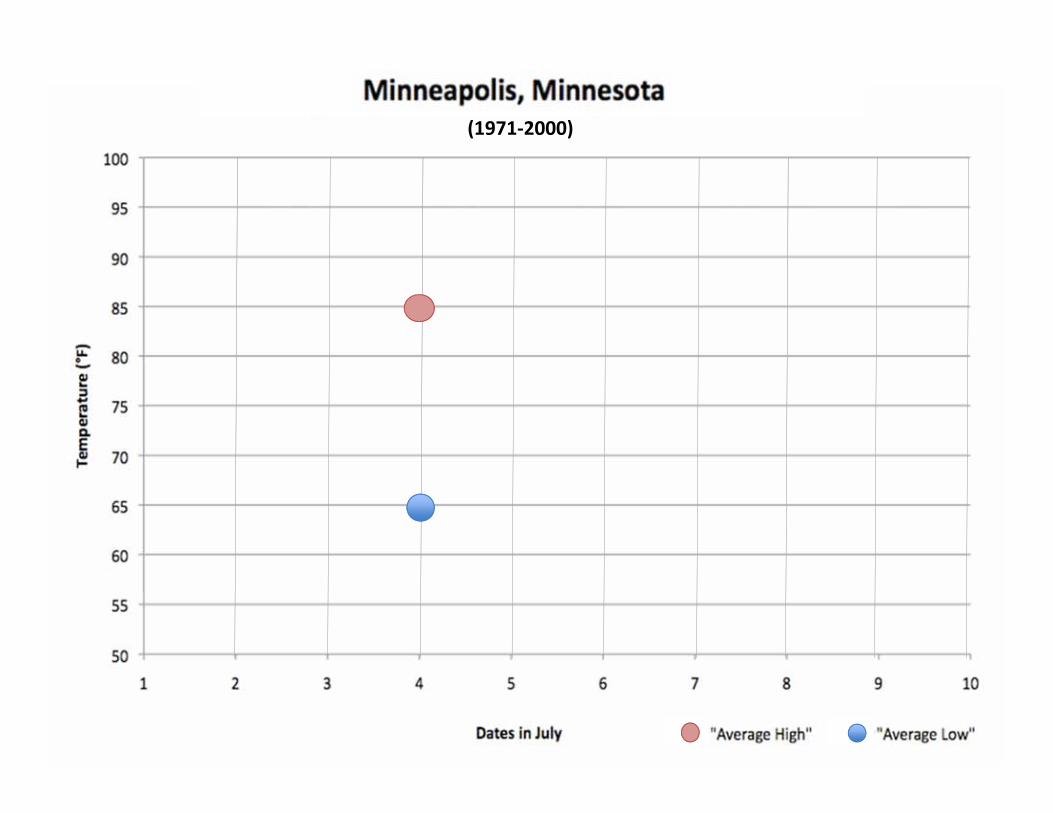
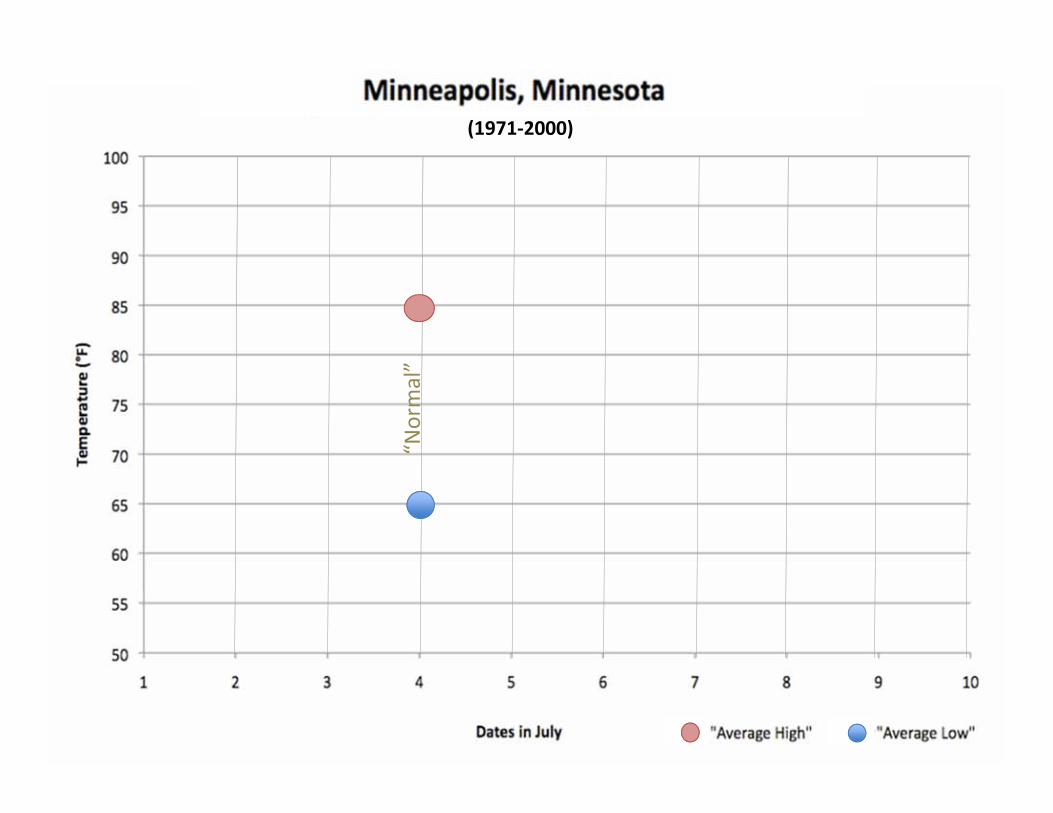
(1971‐2000)
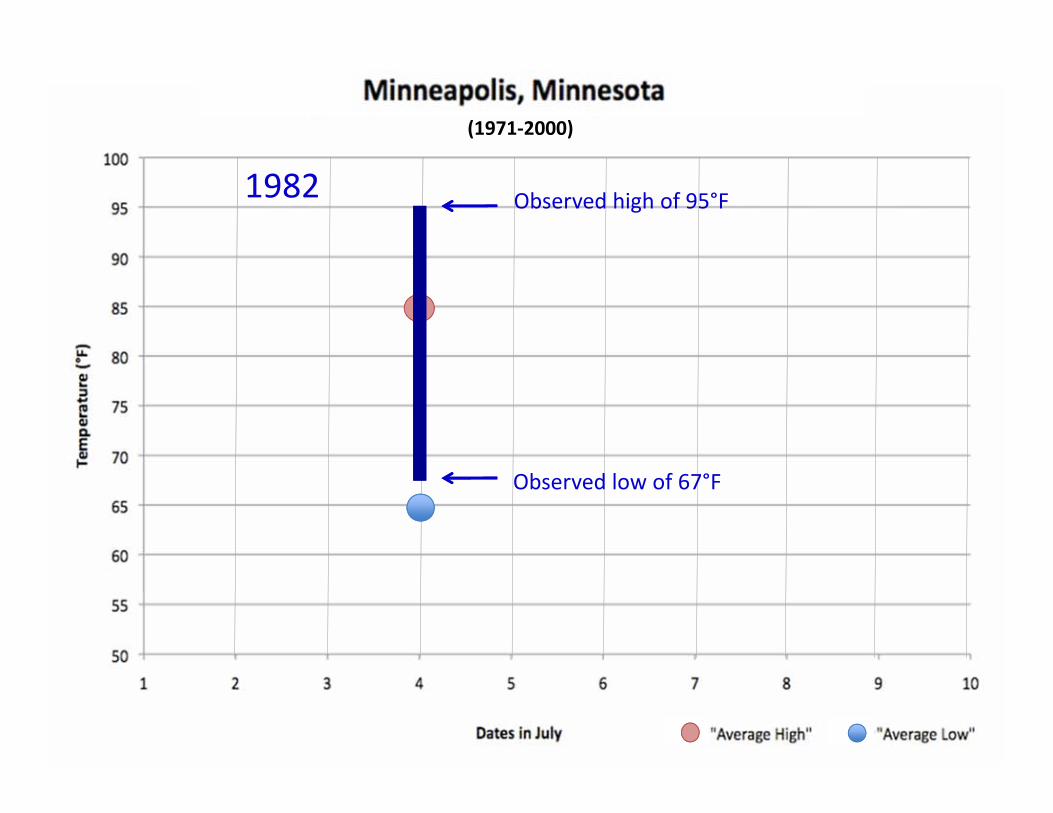
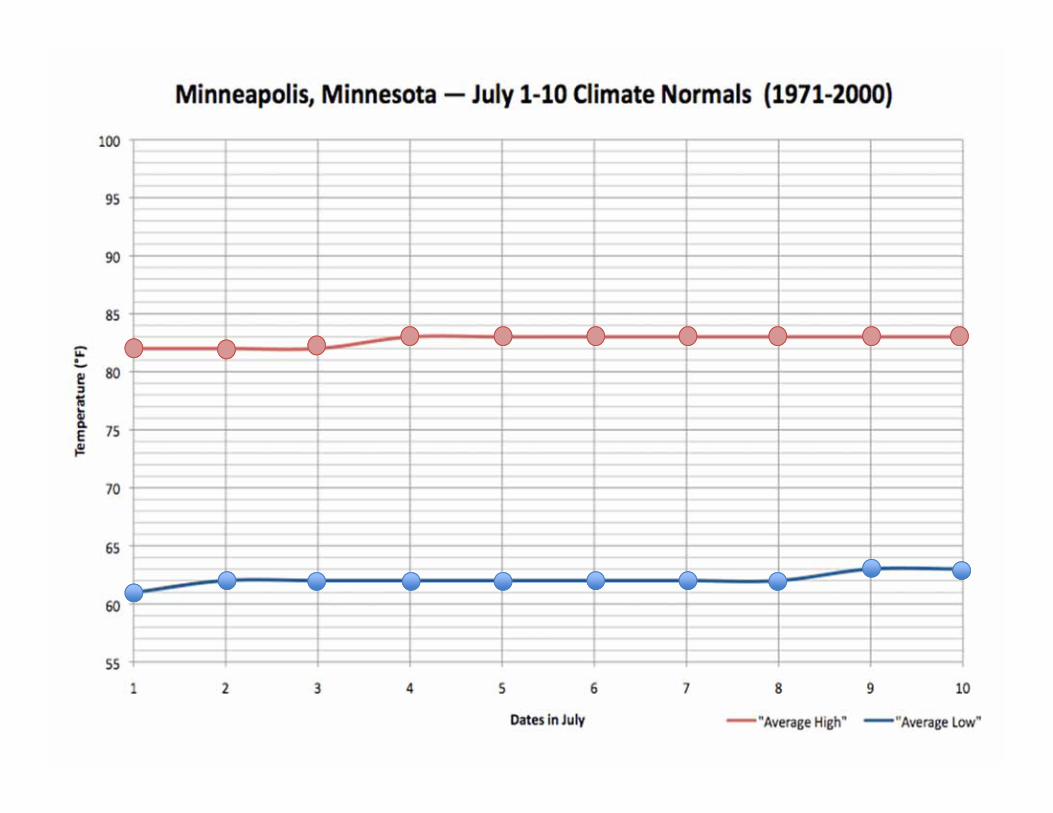
(1971‐2000)
Observed high of 95°F
Observed low of 67°F
1982

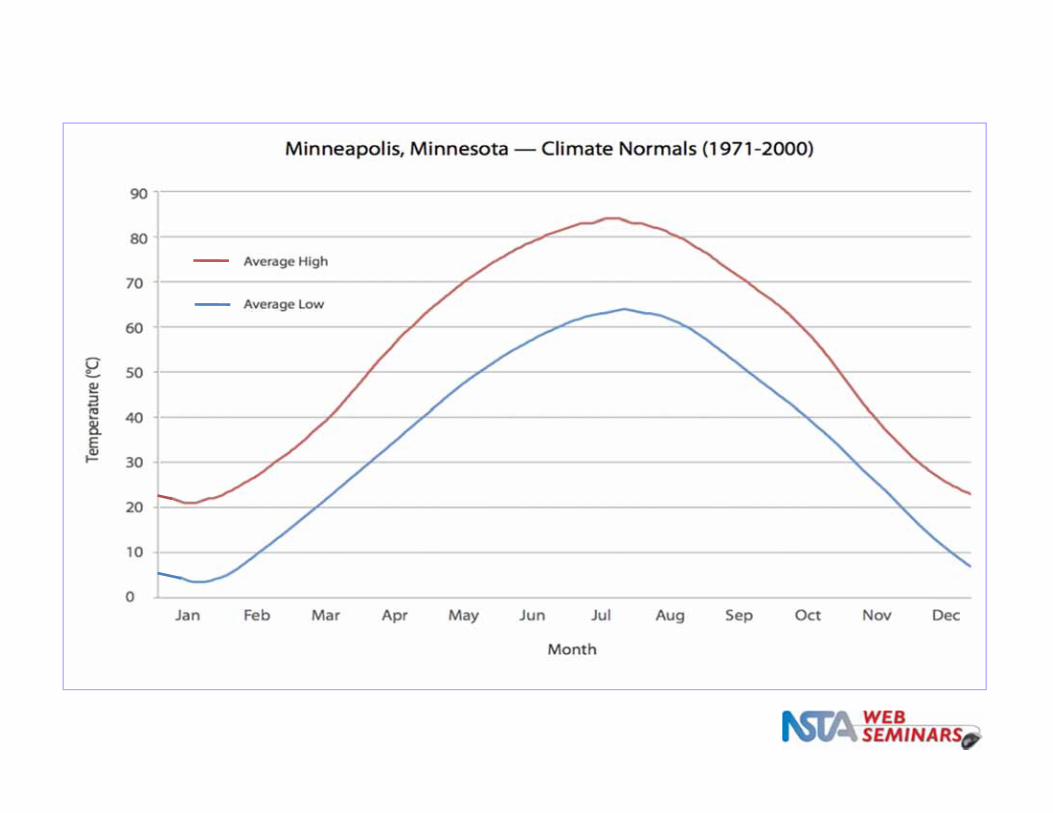
(1971‐2000)
Observed high of 73°F
Observed low of 52°F
1997
(1971‐2000)
“Normal”

Let’s pause for questions from the audience
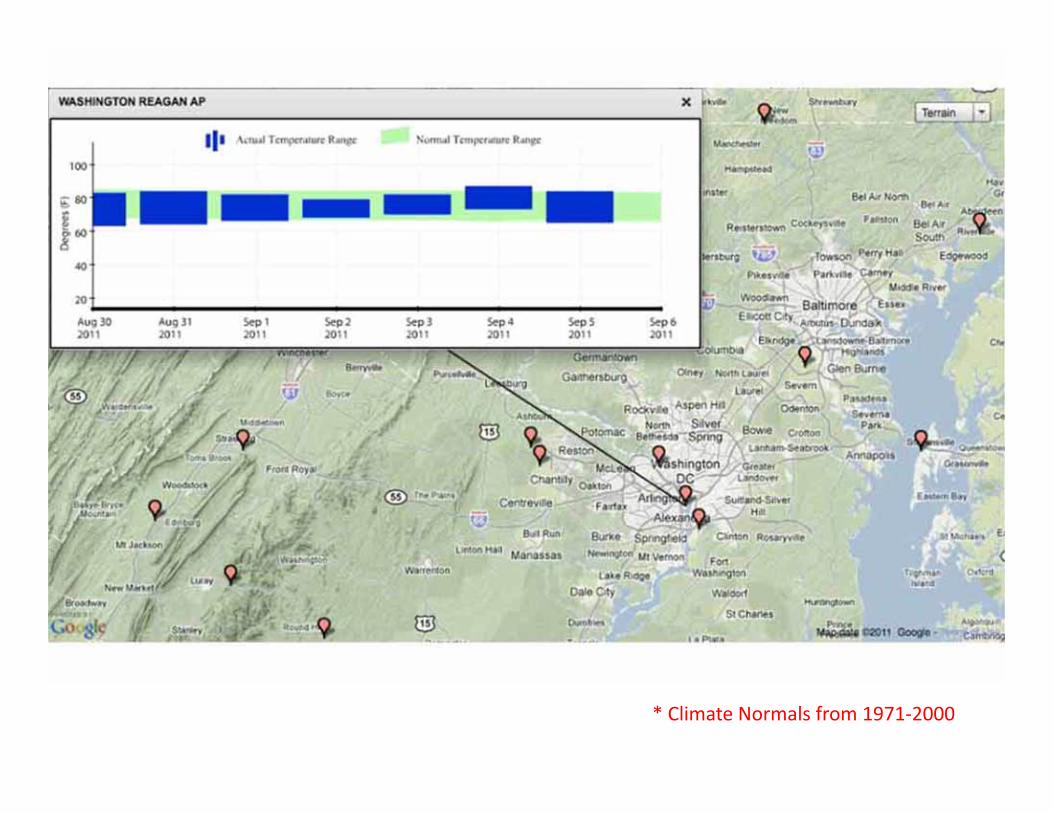
*
* Climate Normals from 1971‐2000

Roll over x axis, hold your Shift key down, then click and drag
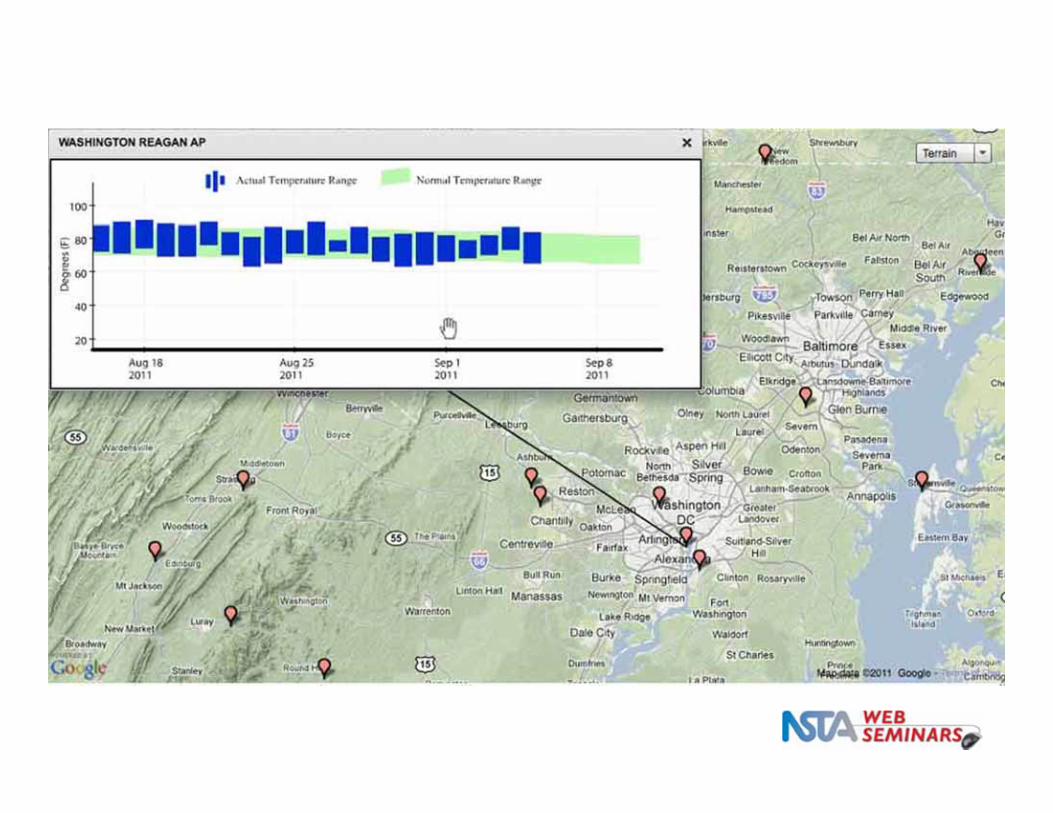
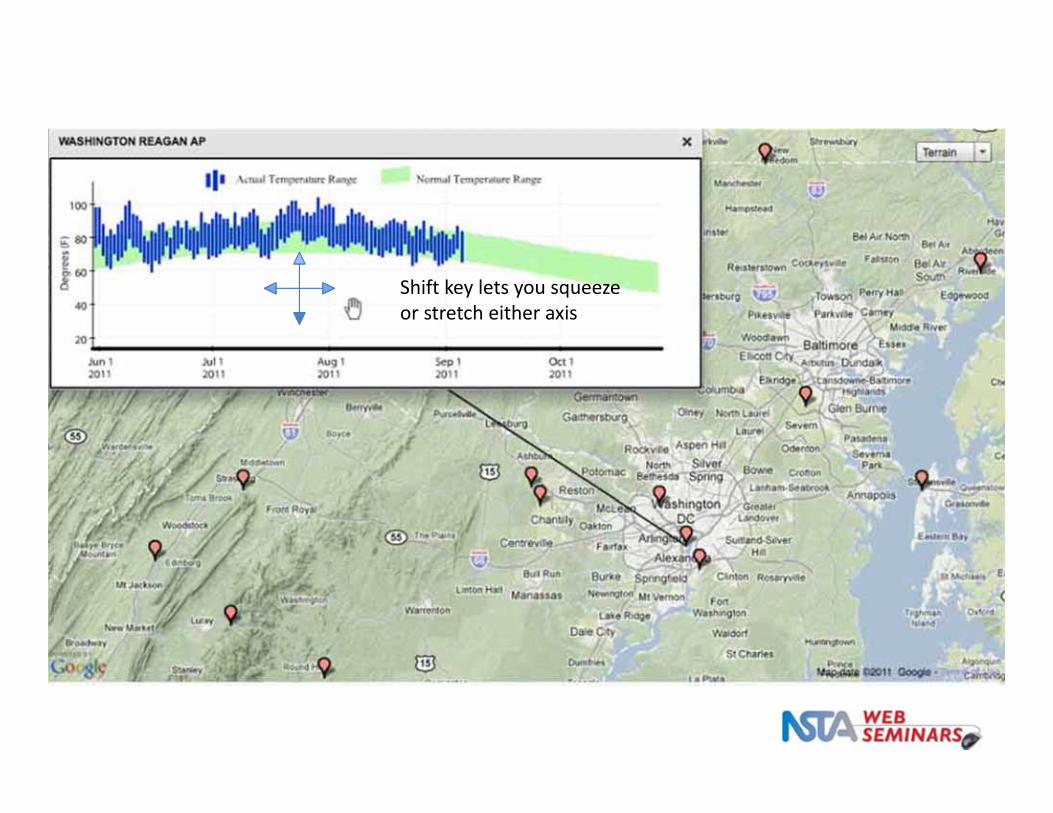
Shift key lets you squeeze or stretch either axis
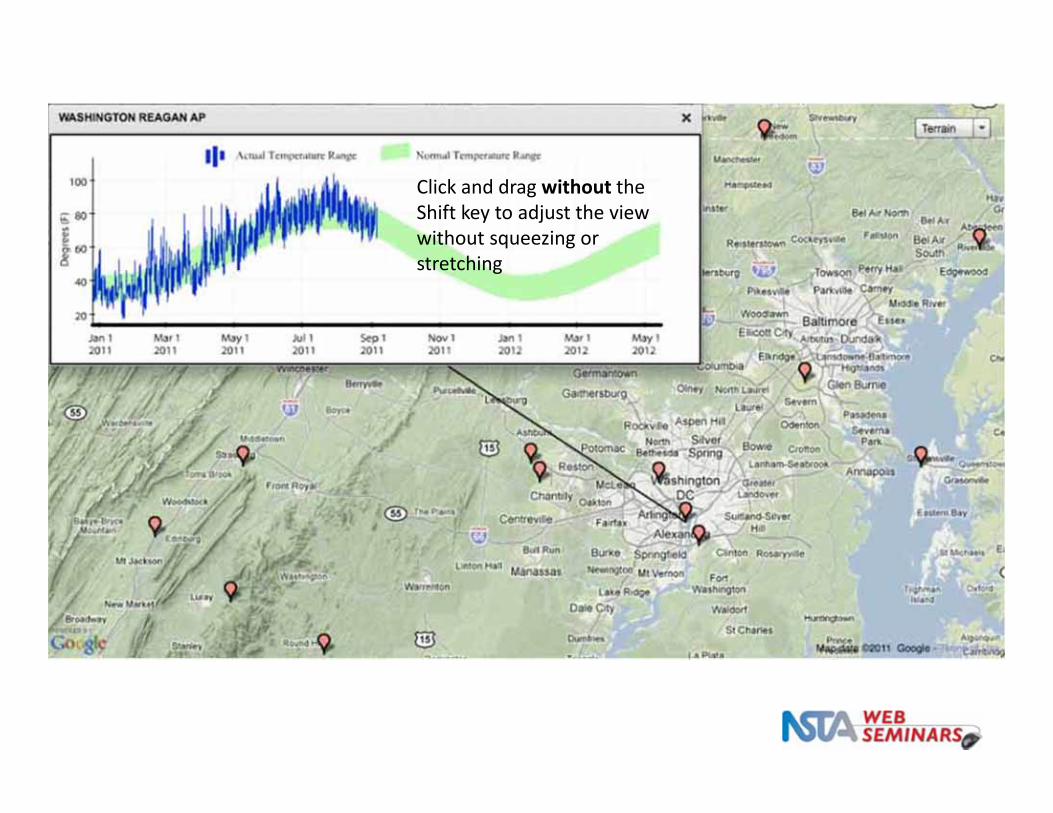
Click and drag without the Shift key to adjust the view without squeezing or stretching
Any questions about what these graphs
show?
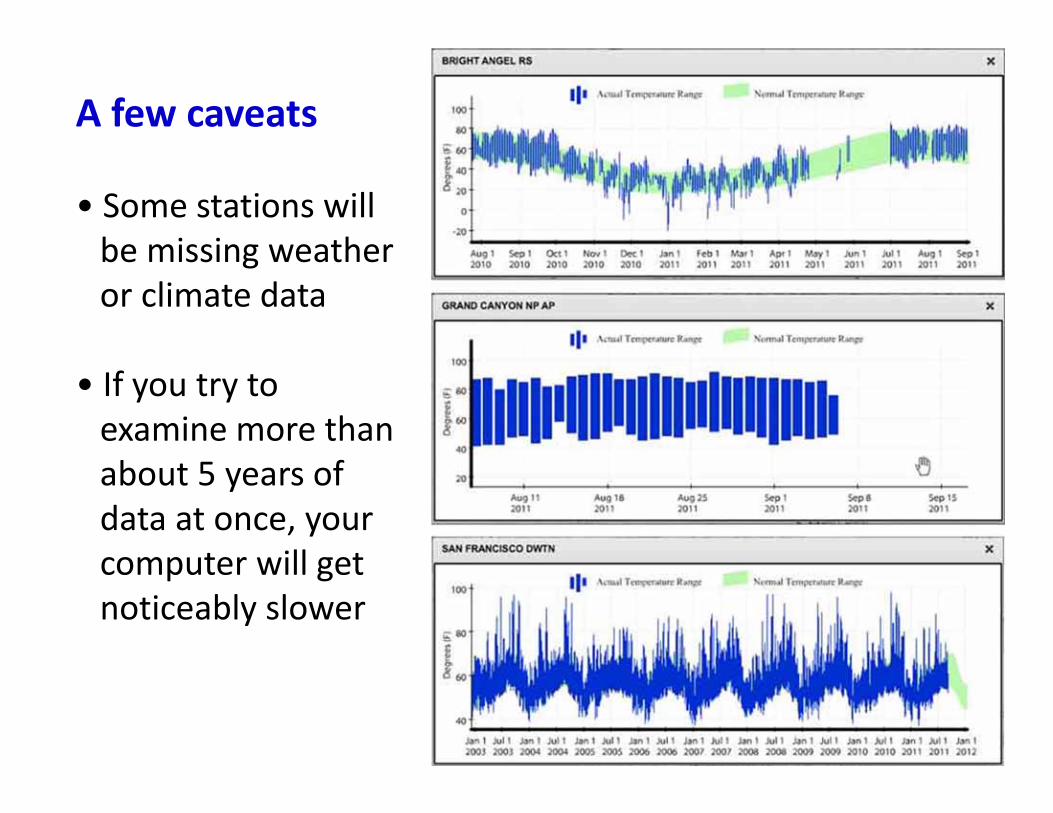
A few caveats
• Some stations will be missing weather or climate data
• If you try to examine more than about 5 years of data at once, your computer will get noticeably slower

Your turn! Start Web Tour of http://climateexplorer.multigraph.org
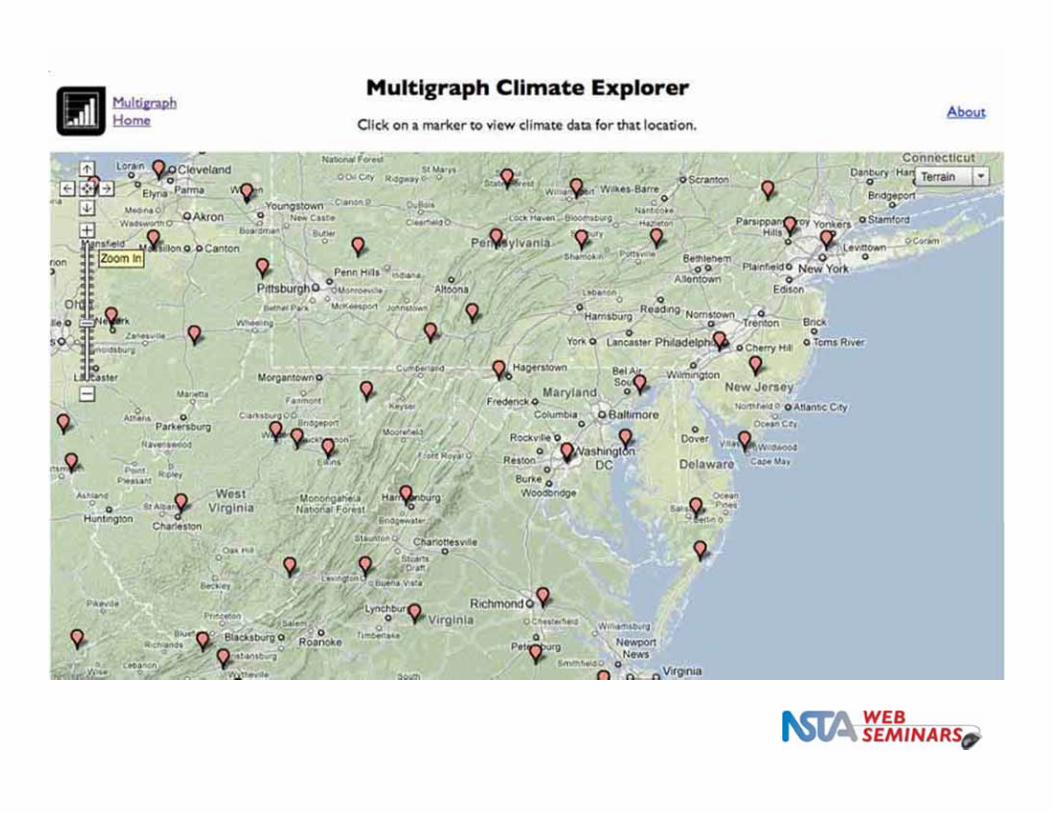
• Zoom in to a station of interest
• Check out the graph
• Post a comment in the chat window comparing climate and weather
• What else can you discover?
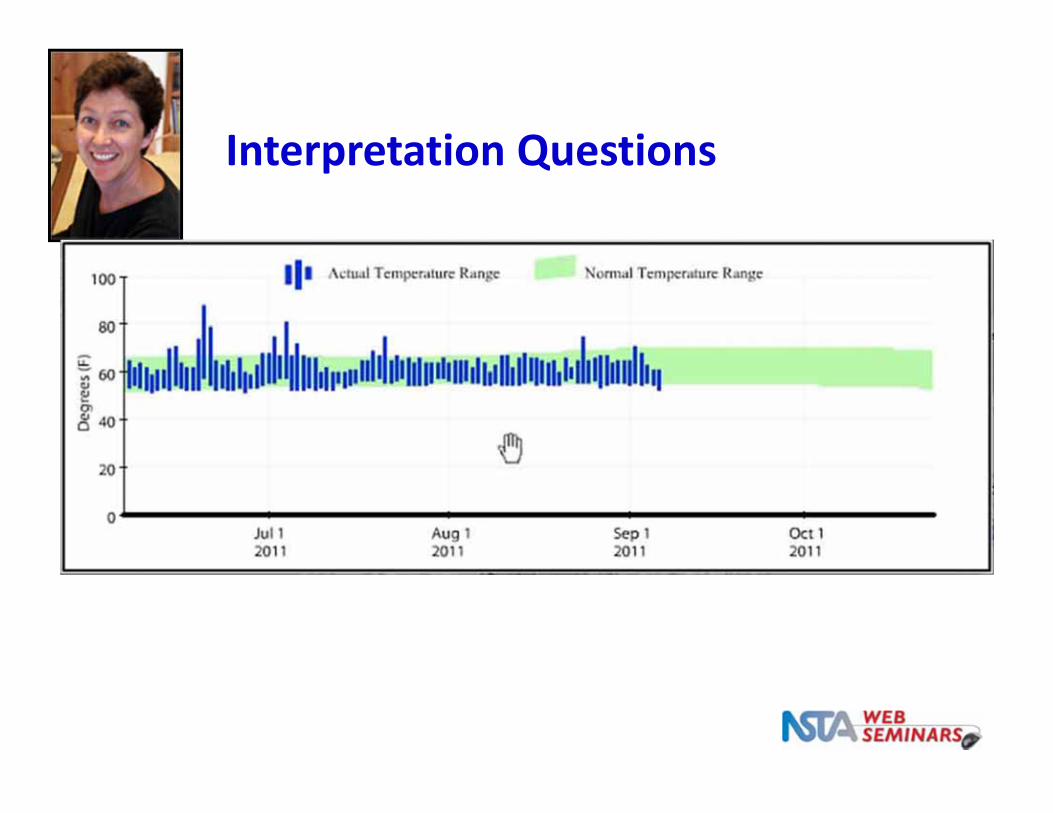
Interpretation Questions
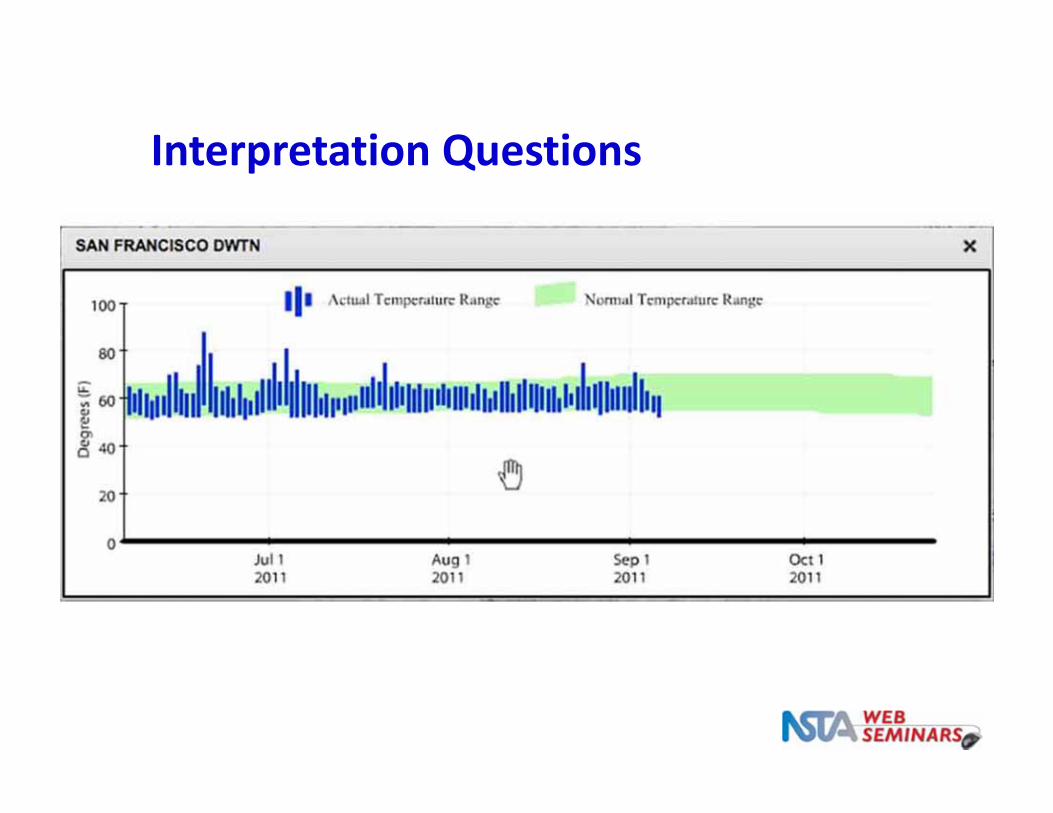
Interpretation Questions
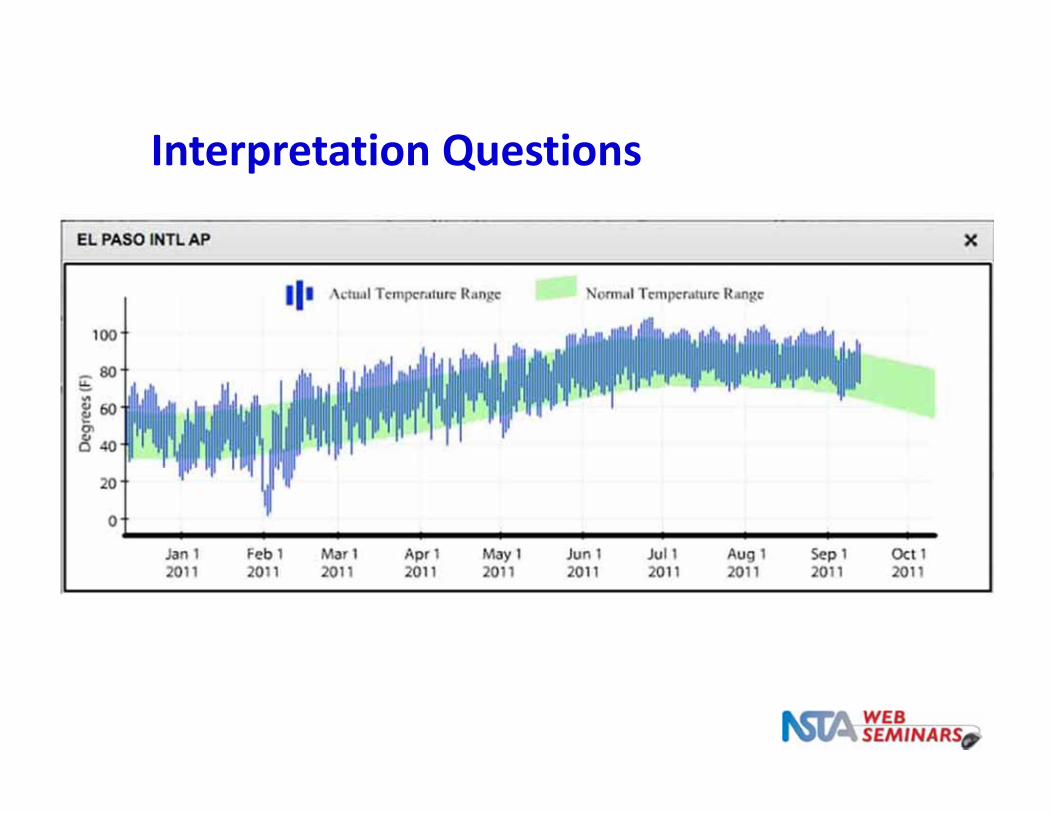
Interpretation Questions
Questions?
Note that the 1981‐2010 Climate Normals have recently been released
Fact Sheet from NCDC
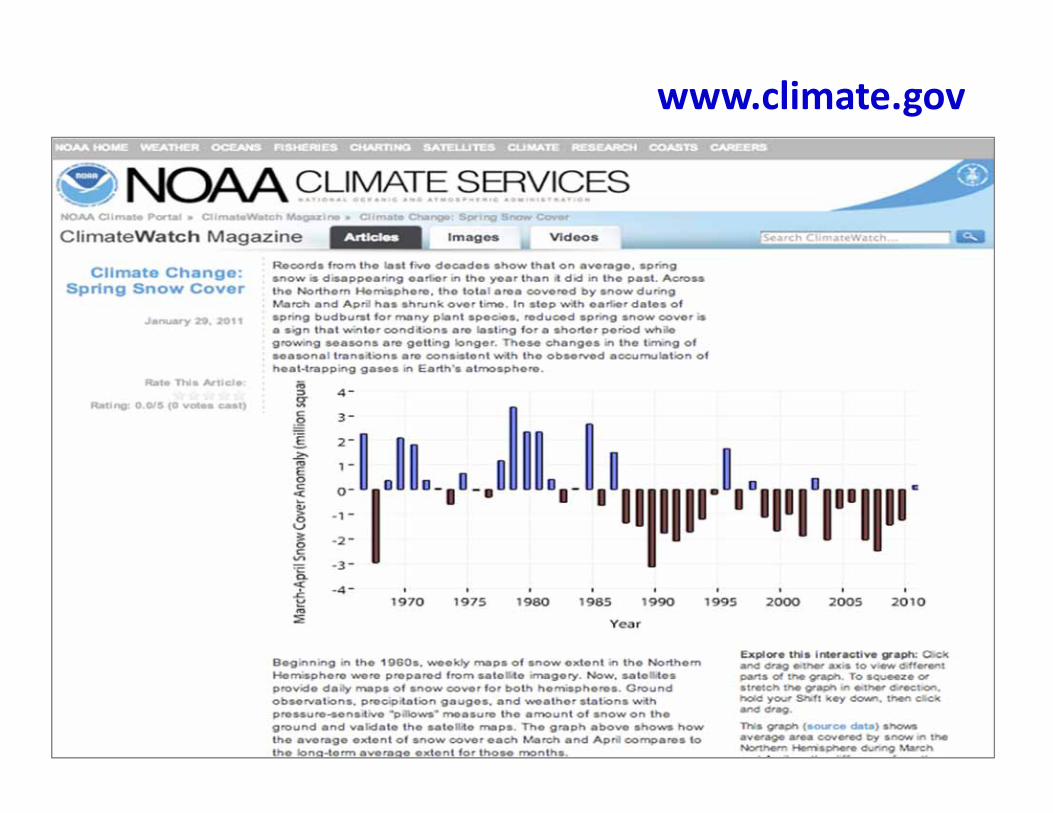
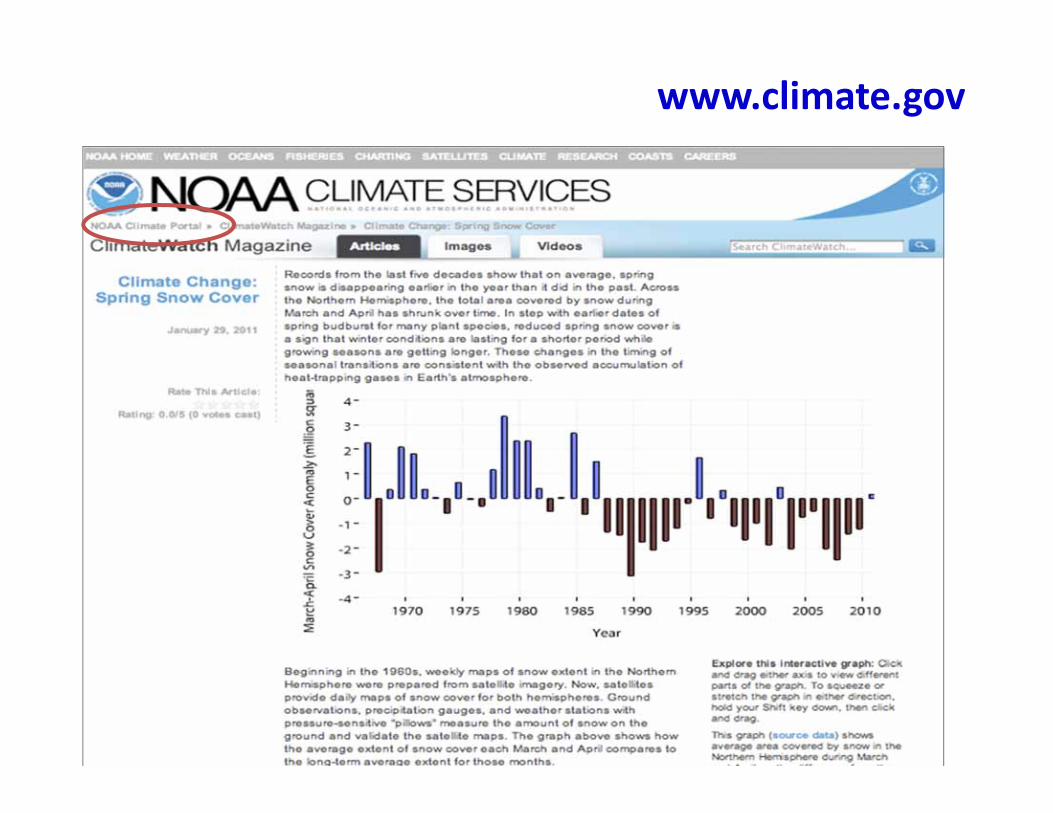
Article from ClimateWatch
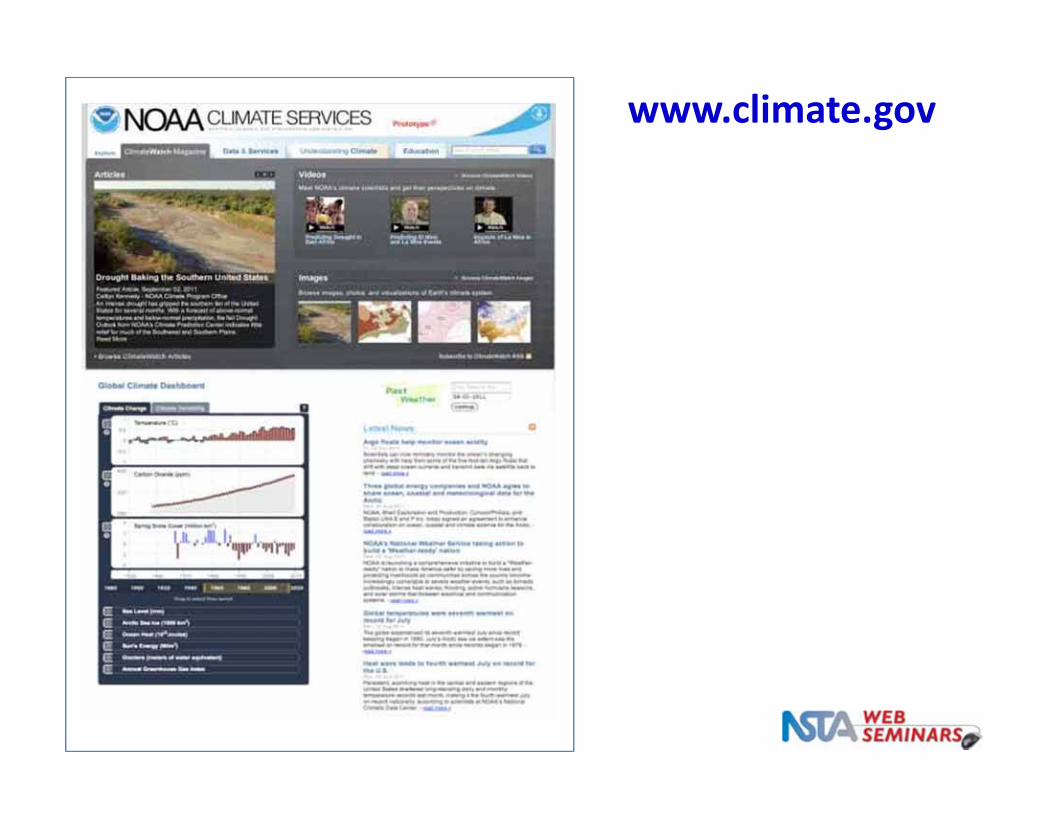
www.climate.gov
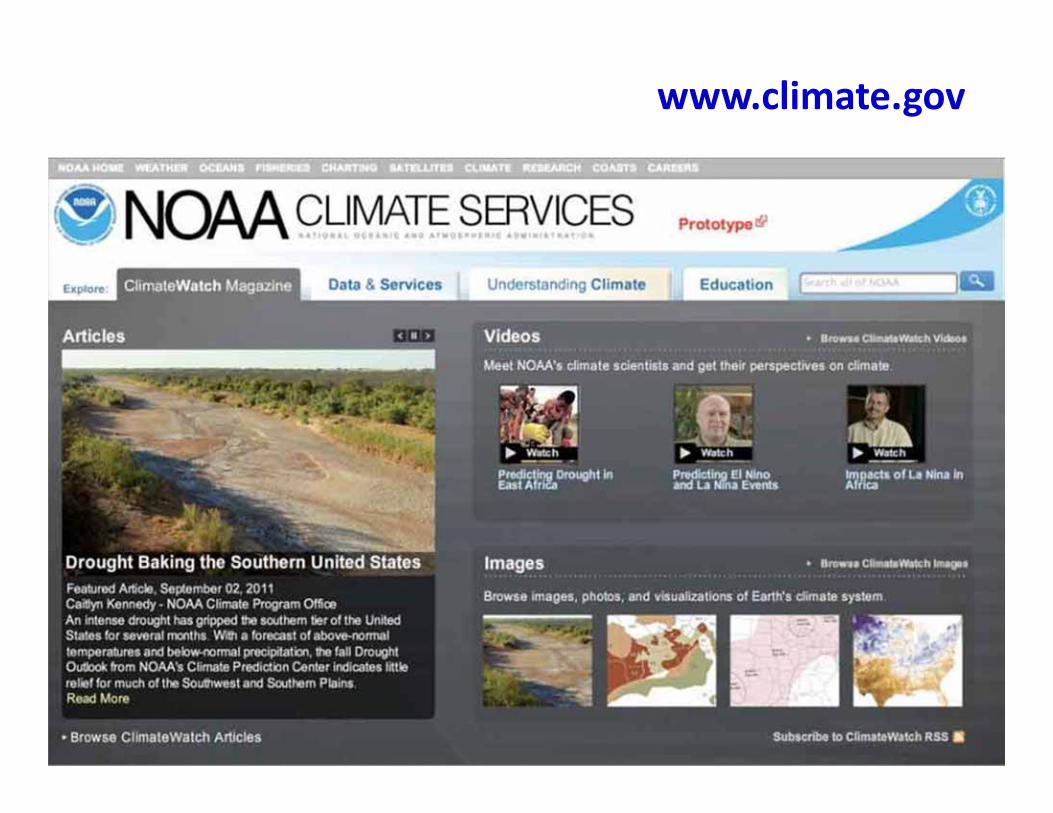
www.climate.gov
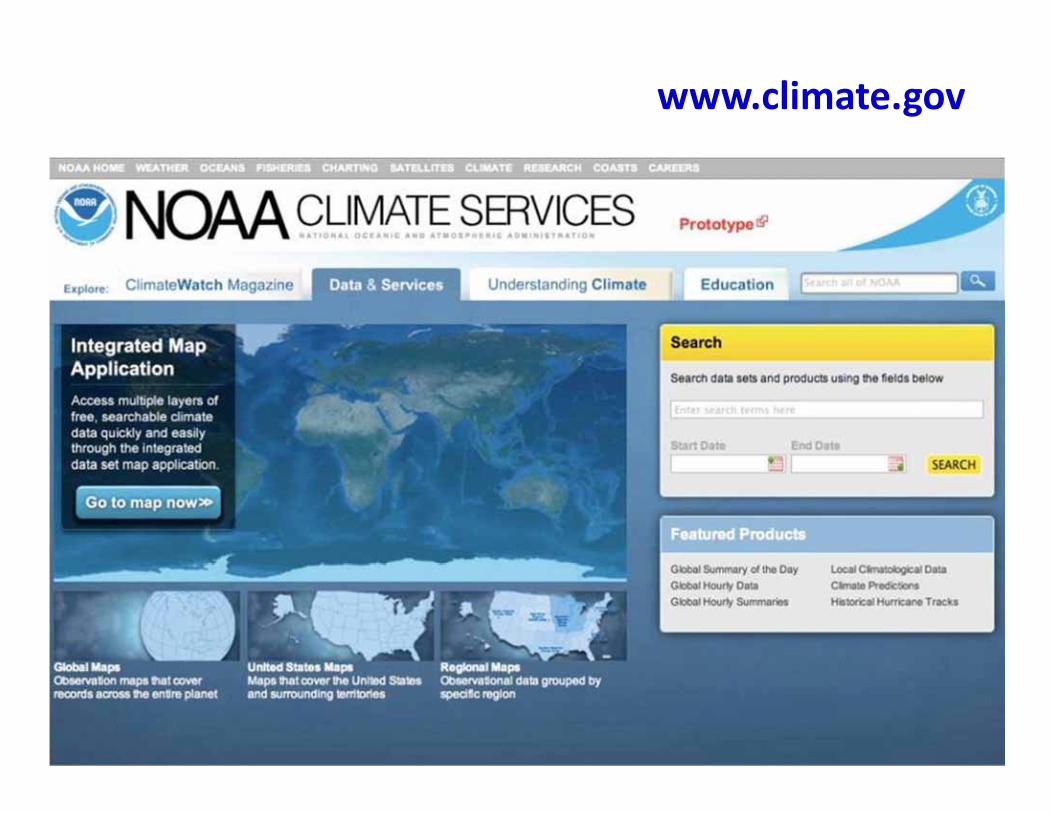
www.climate.gov
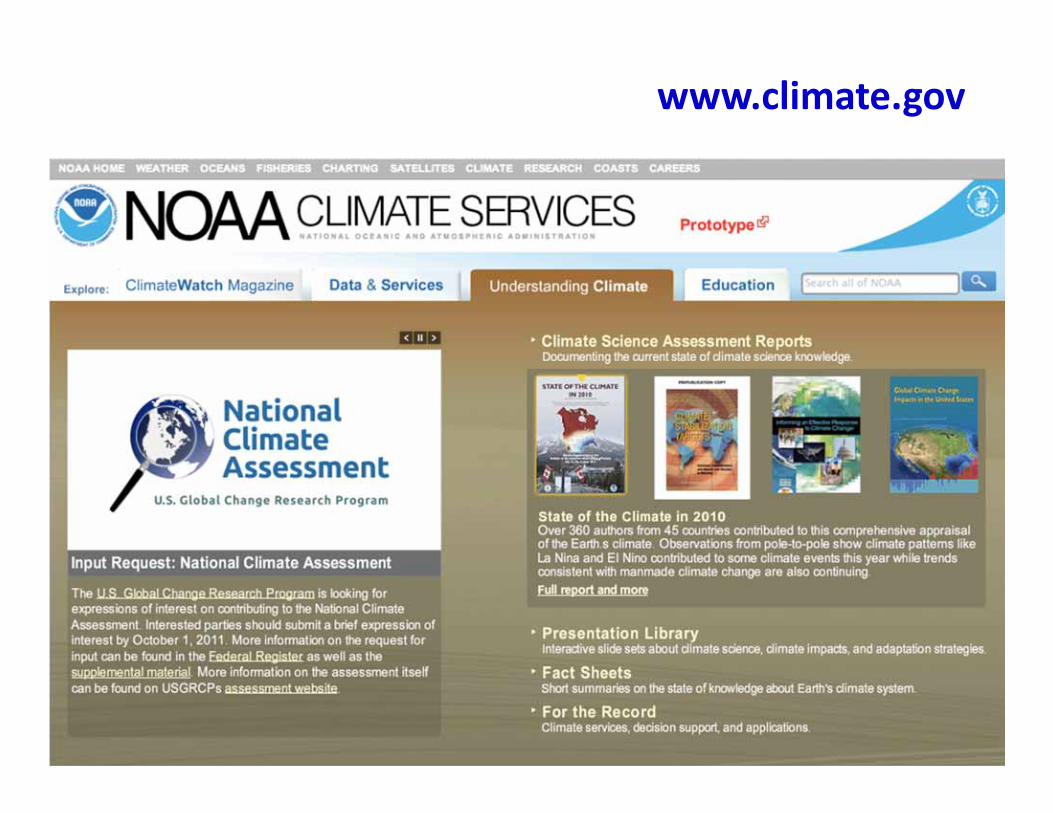
www.climate.gov
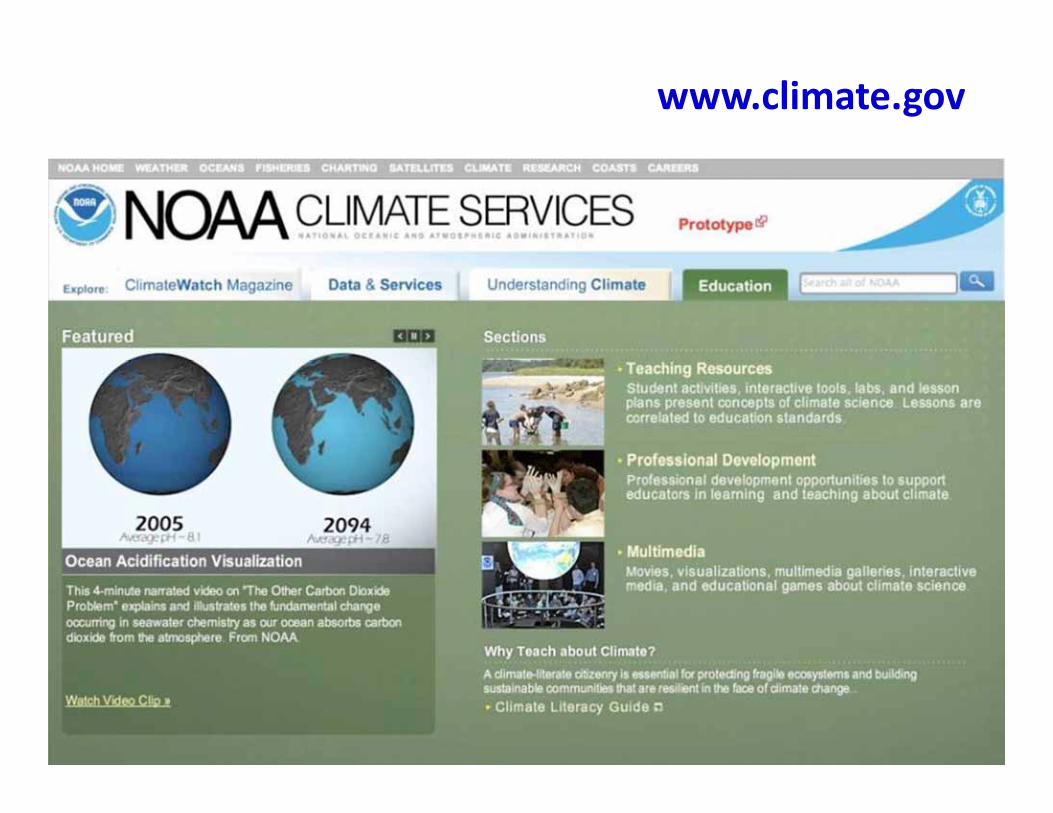
www.climate.gov
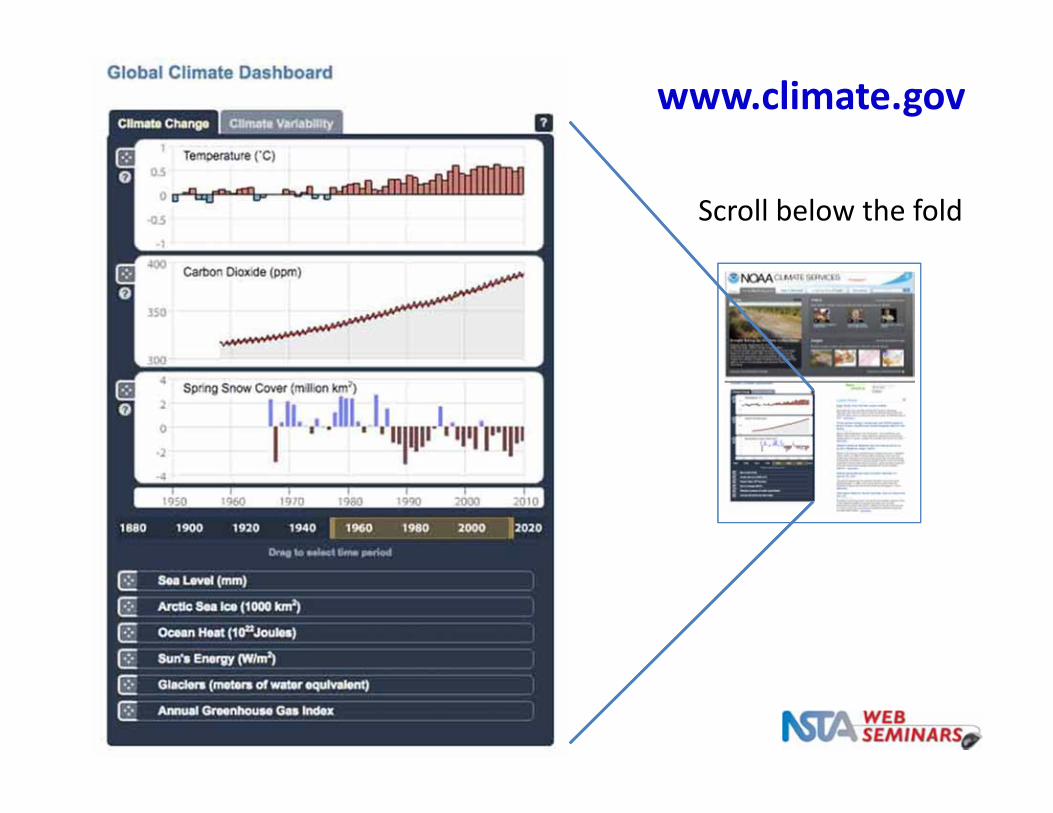
Scroll below the fold
www.climate.gov
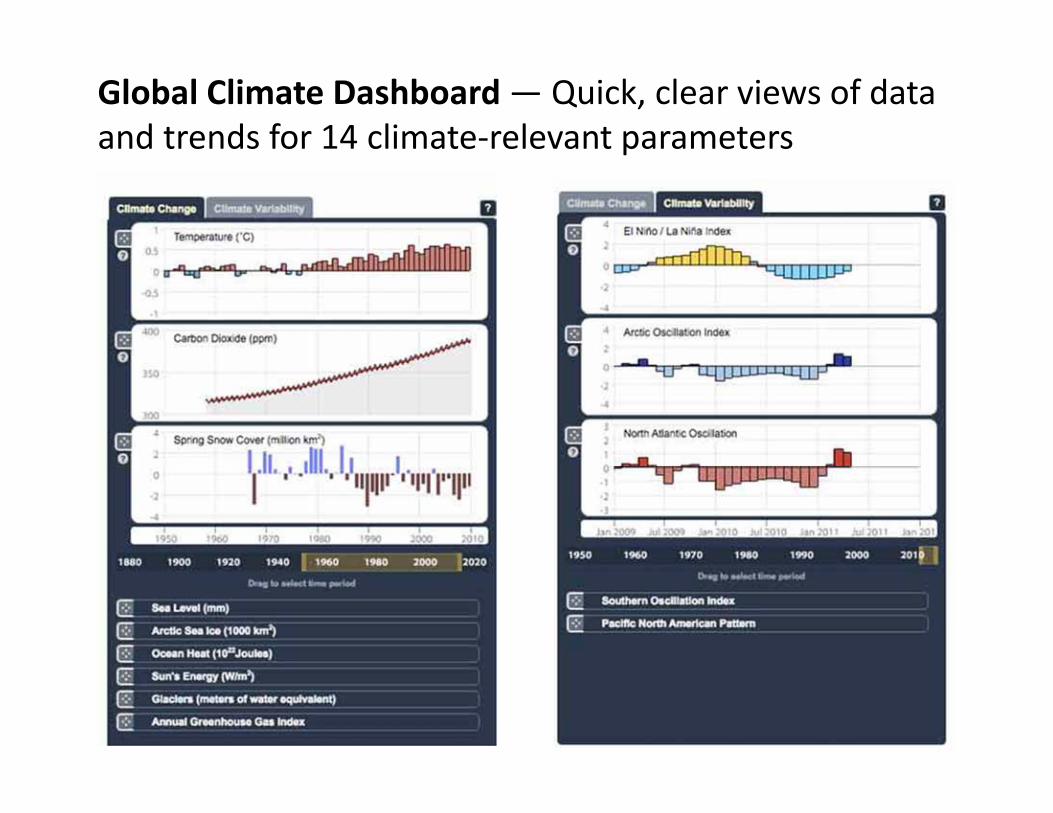
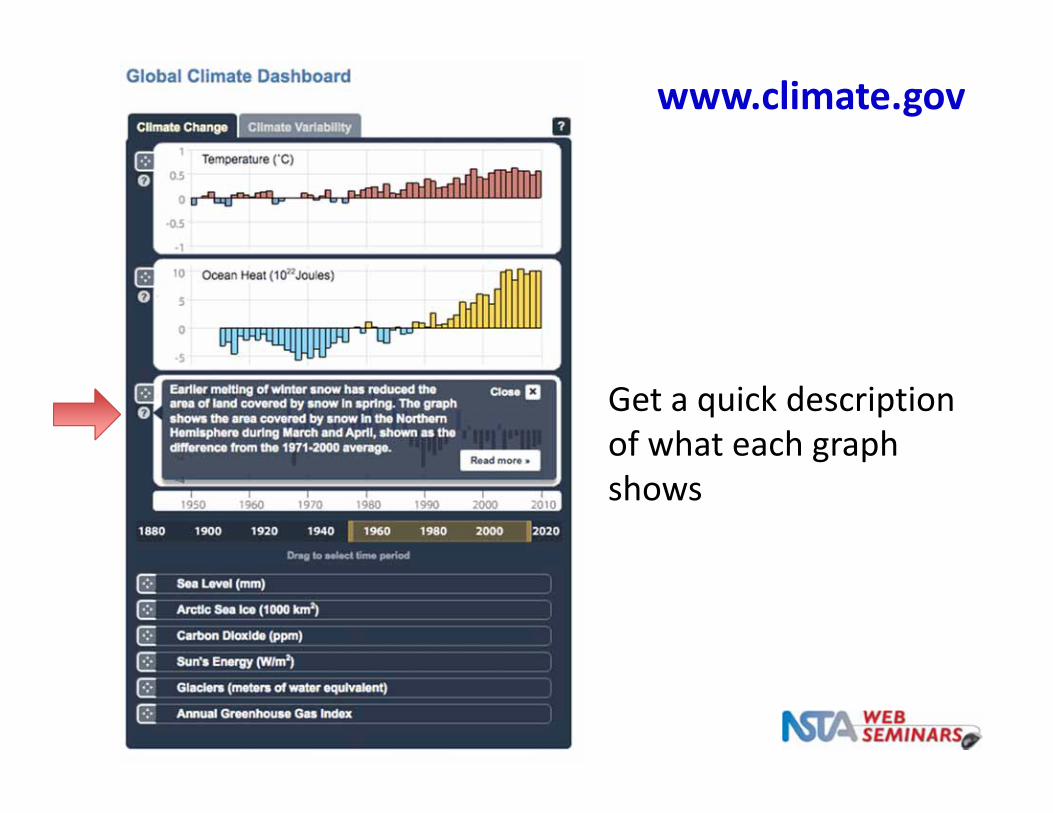
Global Climate Dashboard—Quick, clear views of data and trends for 14 climate‐relevant parameters
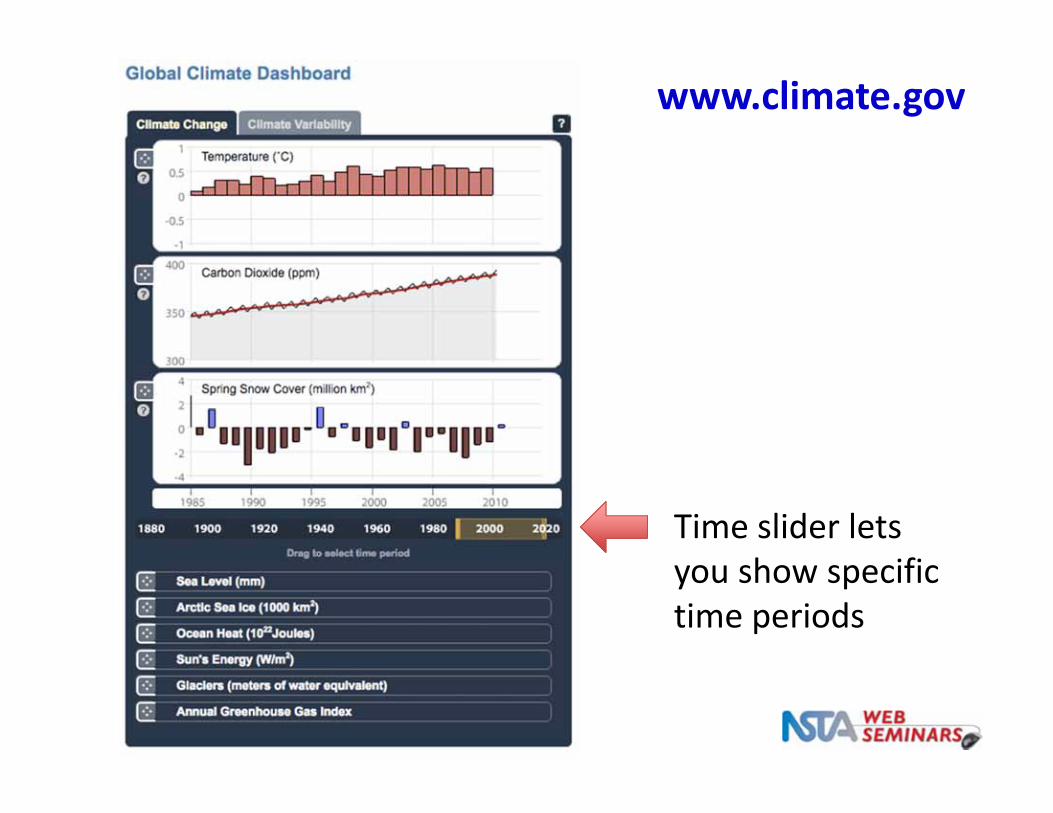
www.climate.gov
Time slider lets you show specific time periods
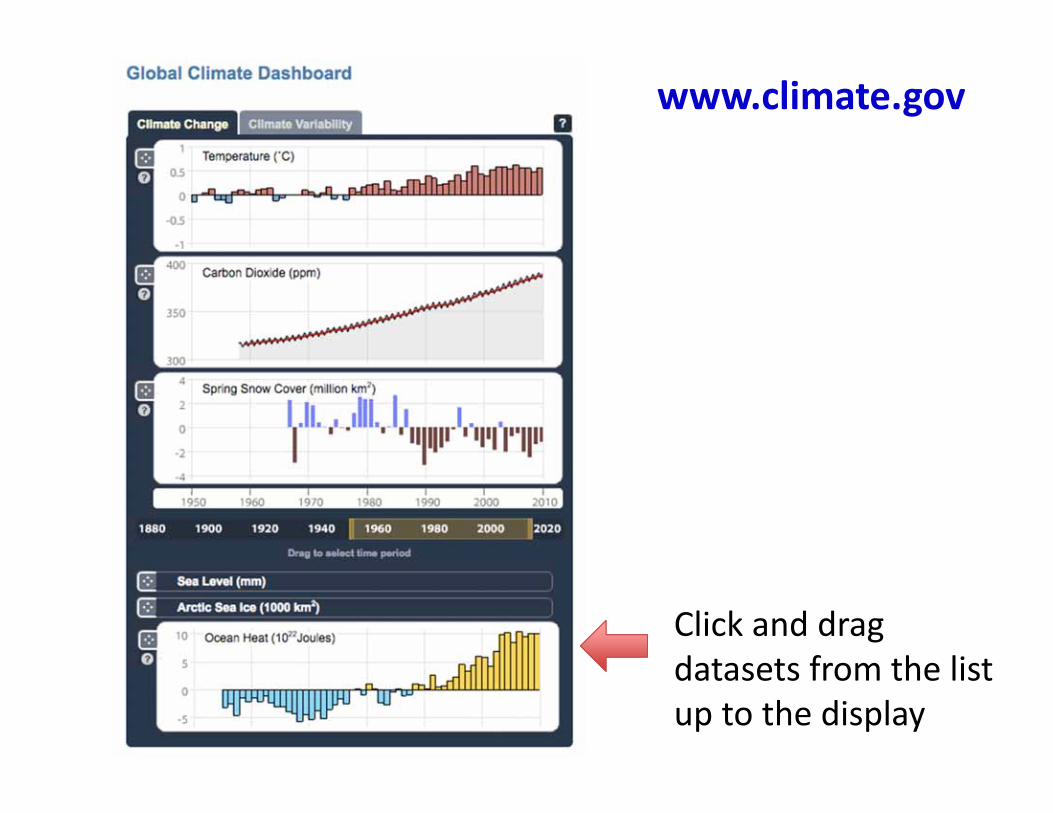
www.climate.gov
Click and drag datasets from the list up to the display
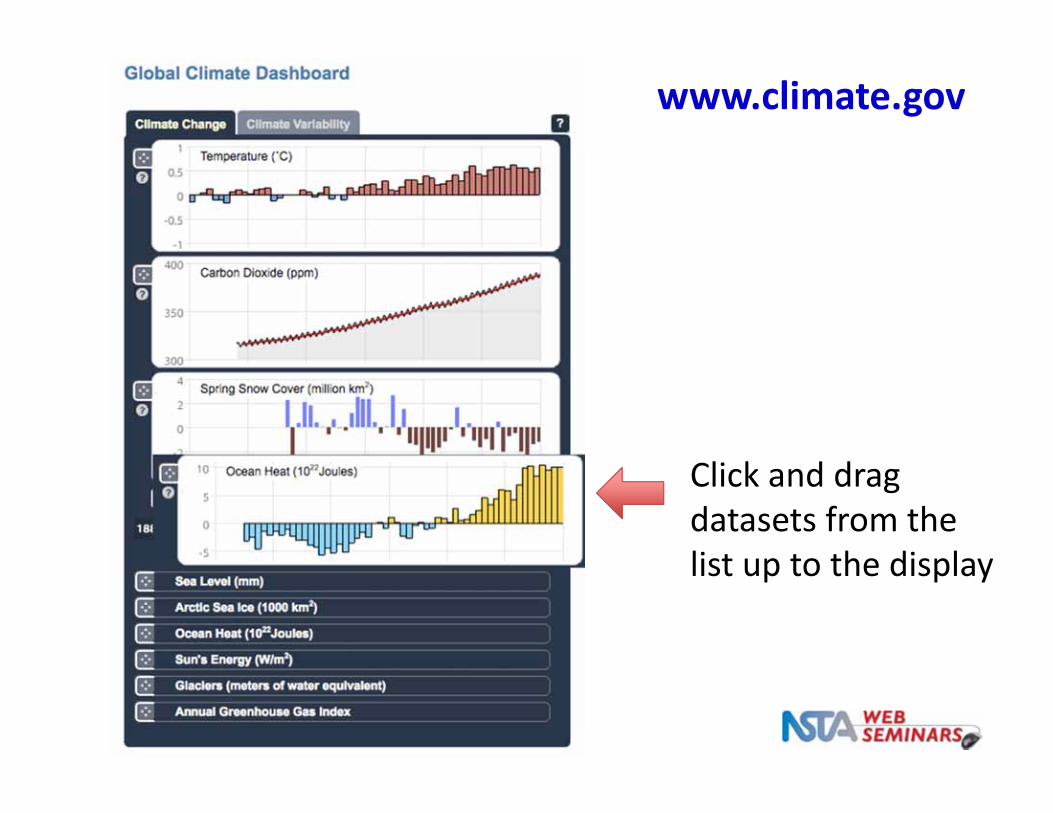
www.climate.gov
Click and drag datasets from the list up to the display

www.climate.gov
Click and drag datasets from the list up to the display
www.climate.gov
Get a quick description of what each graph shows
www.climate.gov
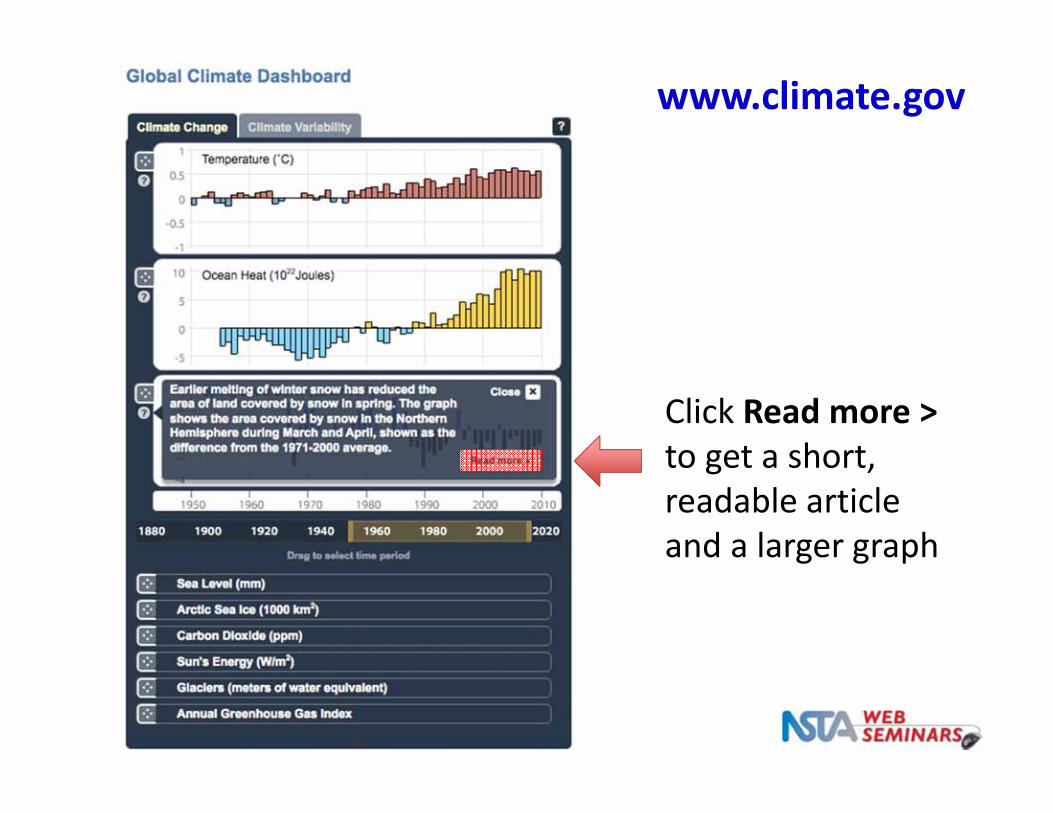
Click Read more >to get a short, readable article and a larger graph
www.climate.gov
www.climate.gov
Your turn! Start Web Tour of http://www.climate.gov
• Take a look at the Dashboard
• Check out some of the features to see what you can learn
• Post a note in the Chat Window describing how you might use this tool or what would make it more useful

Let’s pause for questions from the audience
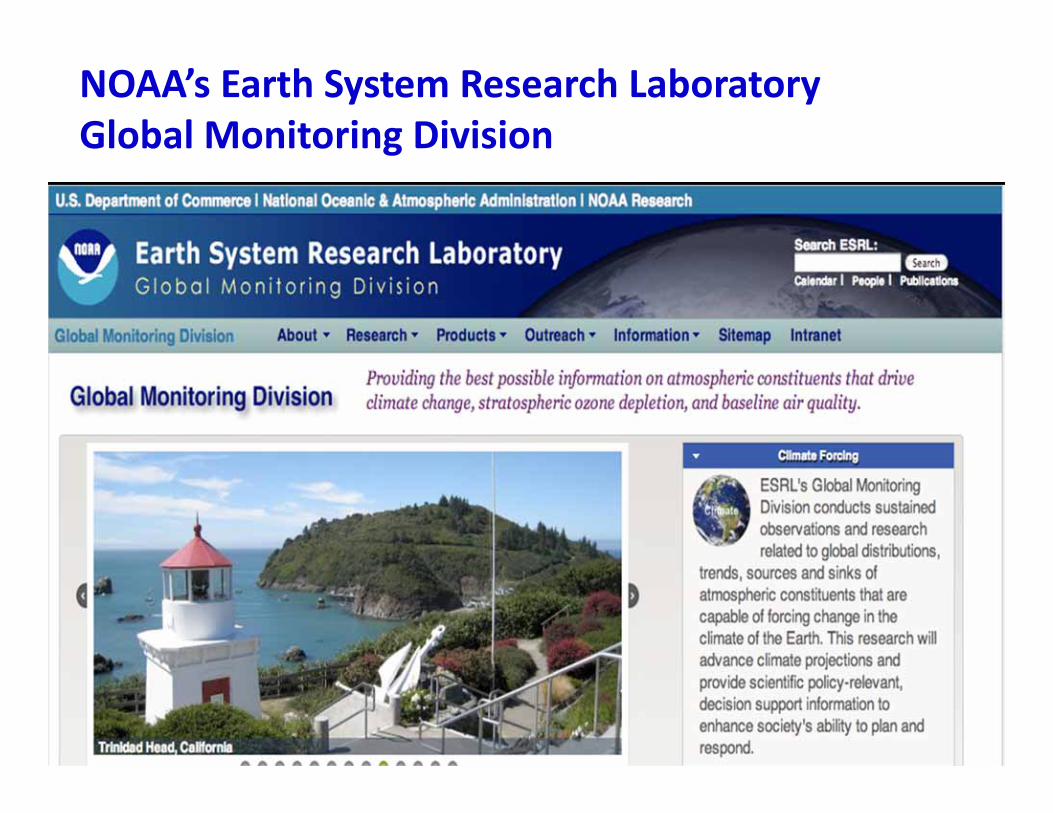
NOAA’s Earth System Research LaboratoryGlobal Monitoring Division
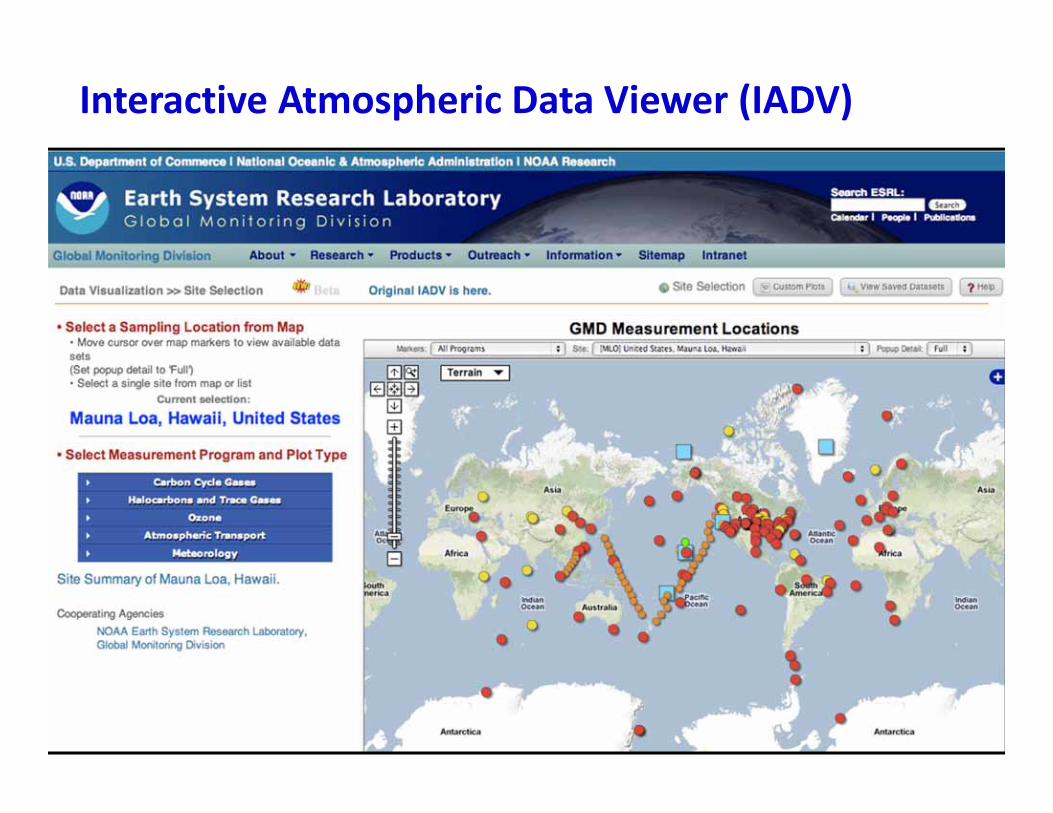
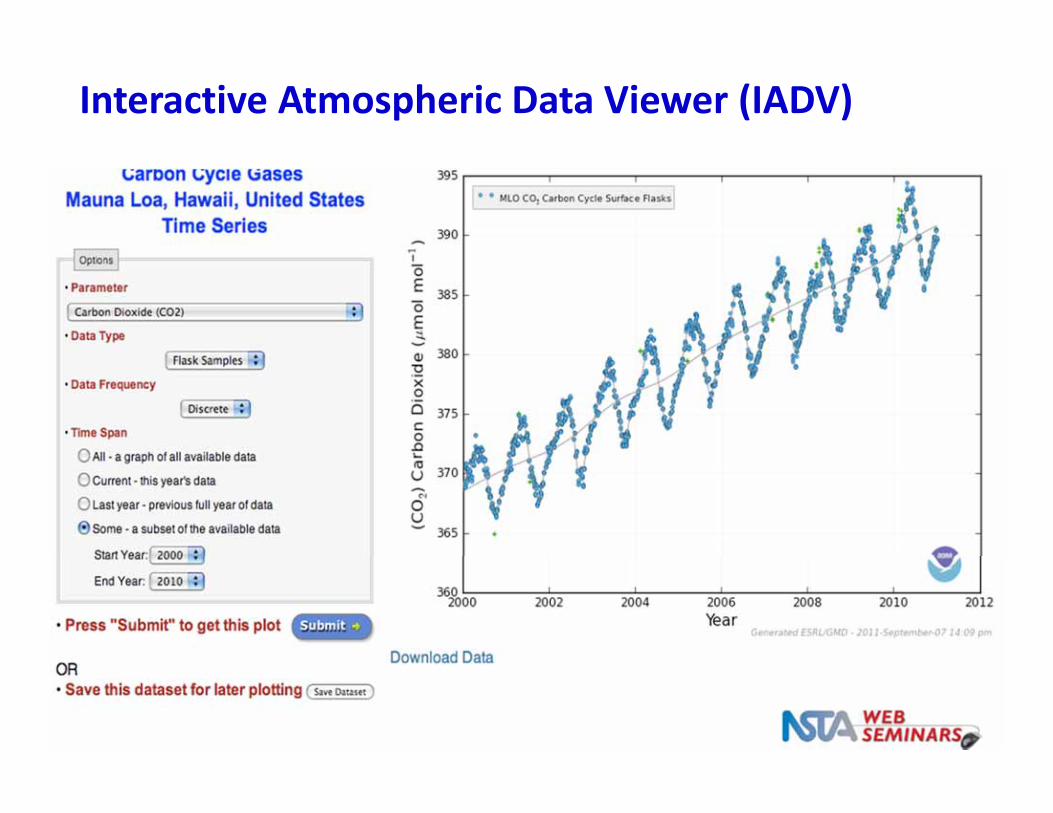
Interactive Atmospheric Data Viewer (IADV)
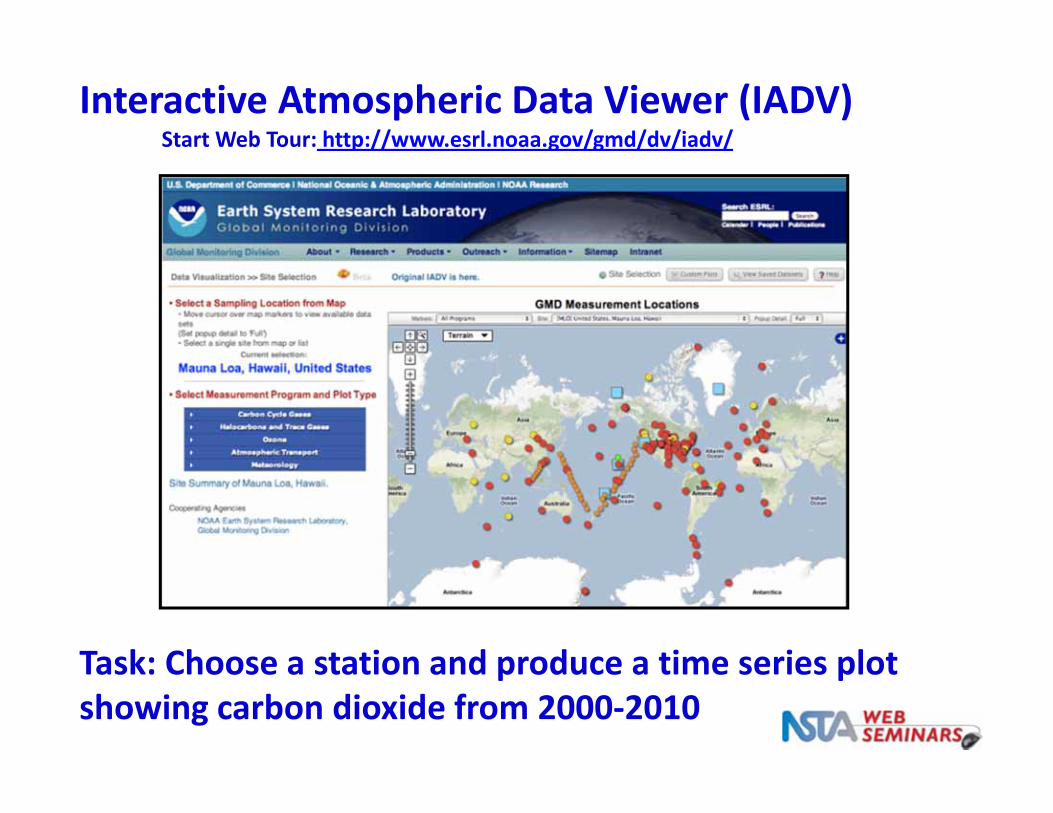
Interactive Atmospheric Data Viewer (IADV)Start Web Tour: http://www.esrl.noaa.gov/gmd/dv/iadv/
Task: Choose a station and produce a time series plot showing carbon dioxide from 2000‐2010
Interactive Atmospheric Data Viewer (IADV)
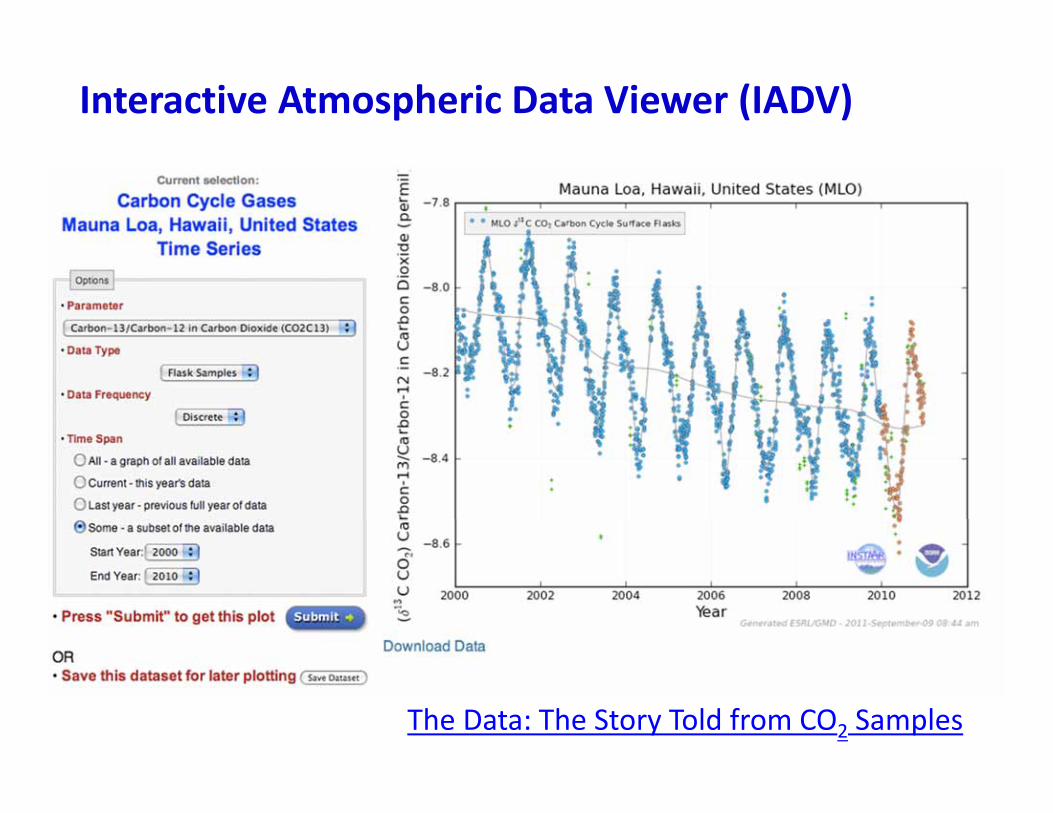
Interactive Atmospheric Data Viewer (IADV)
The Data: The Story Told from CO2 Samples
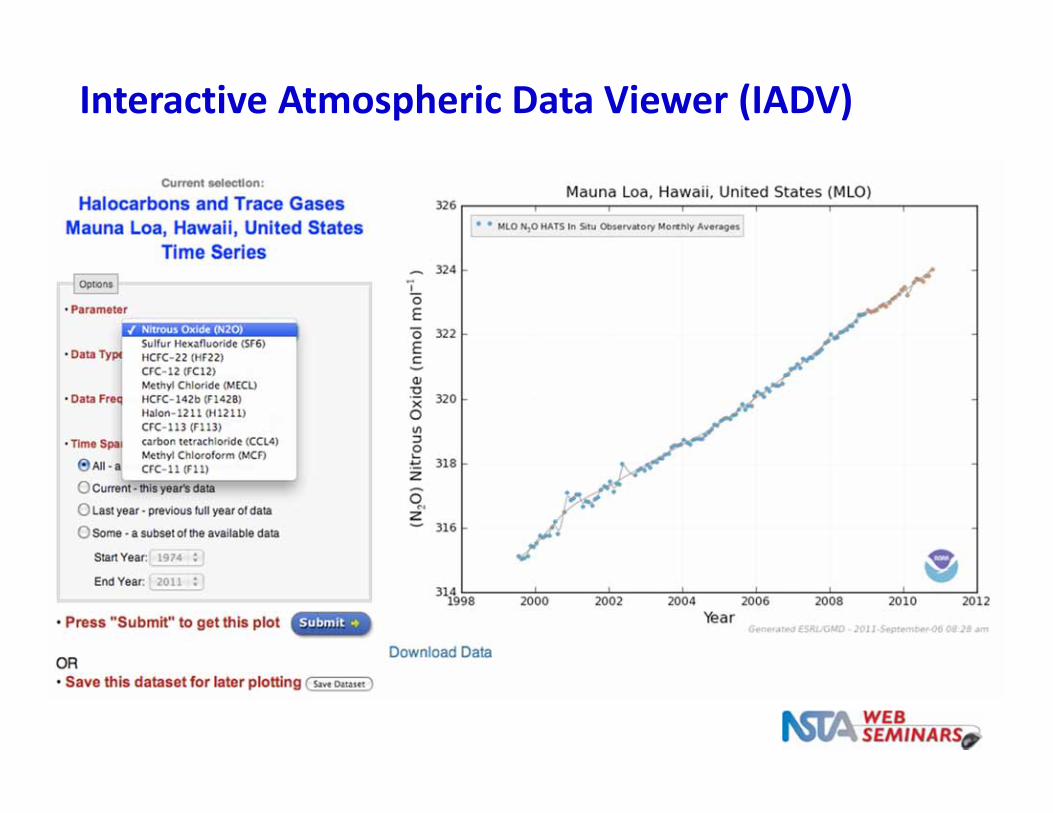
Interactive Atmospheric Data Viewer (IADV)
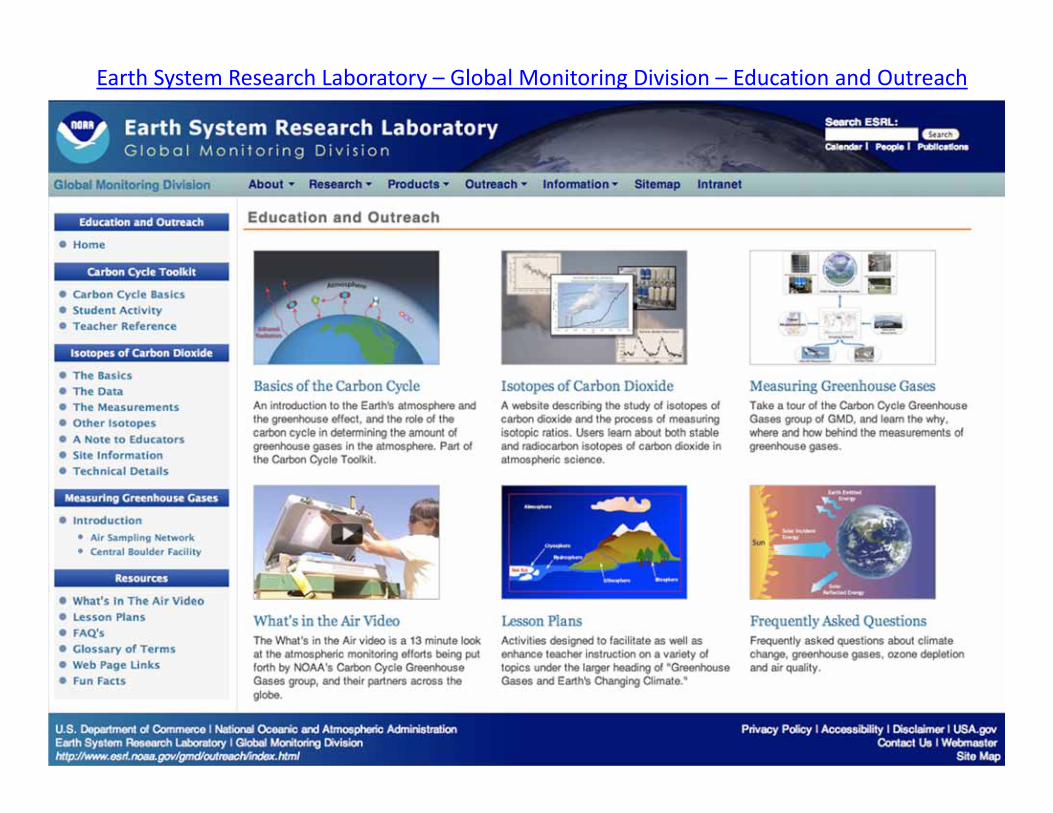
Earth System Research Laboratory – Global Monitoring Division – Education and Outreach
Let’s pause for questions from the audience
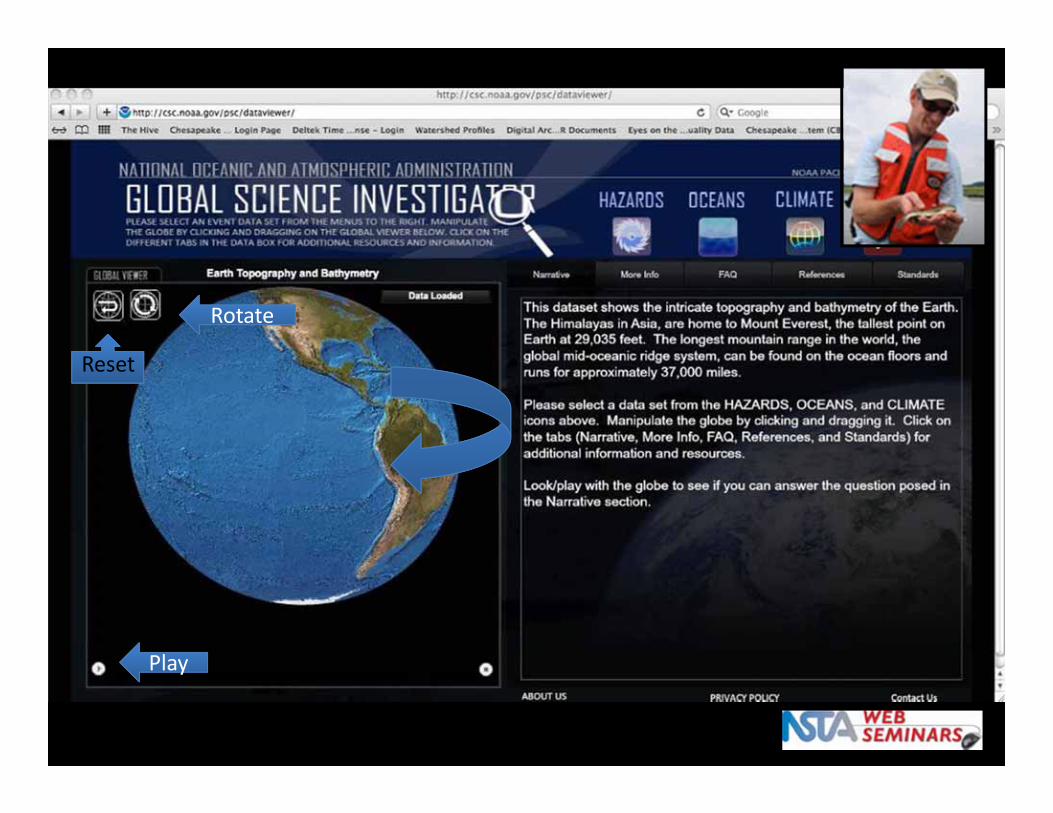
PlayPlay
RotateRotate
Reset
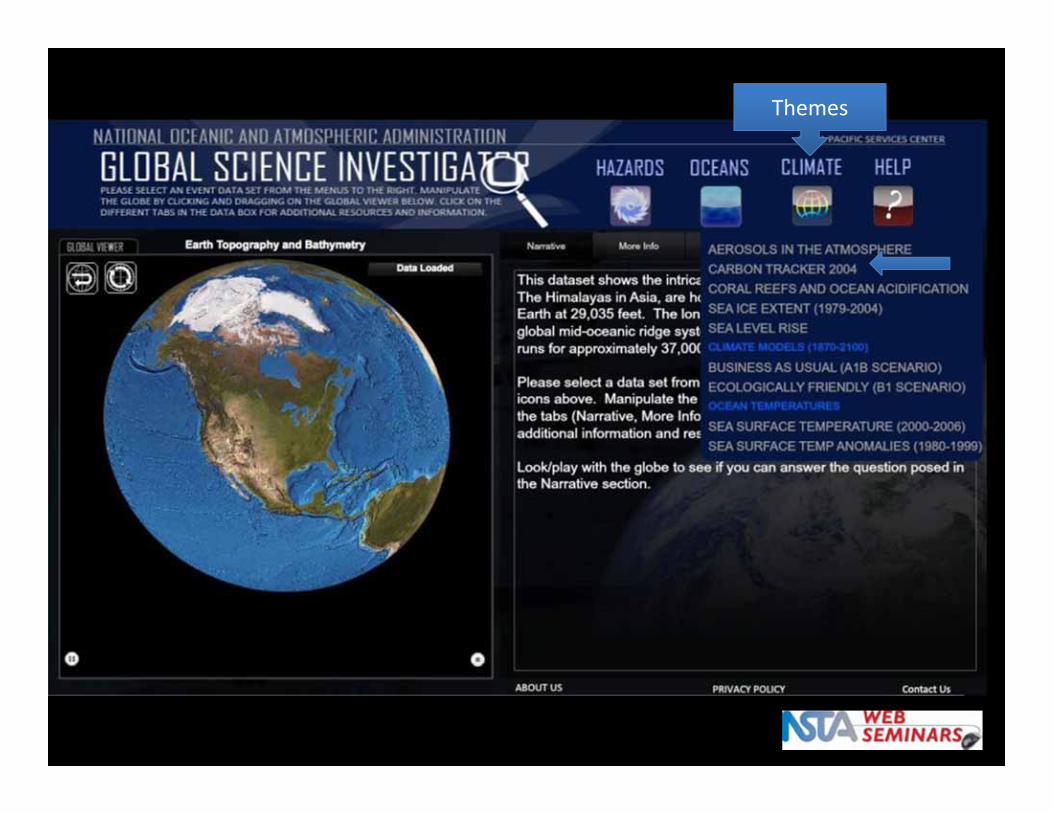
Themes
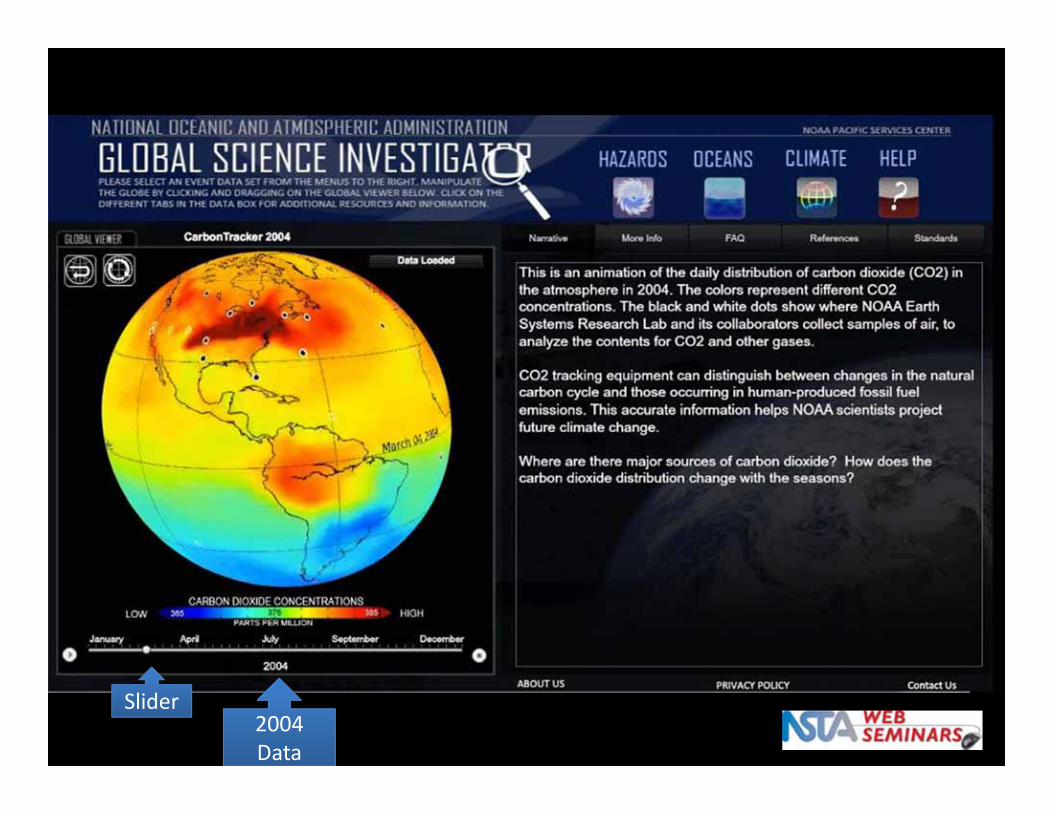
2004 2004 Data
Slider
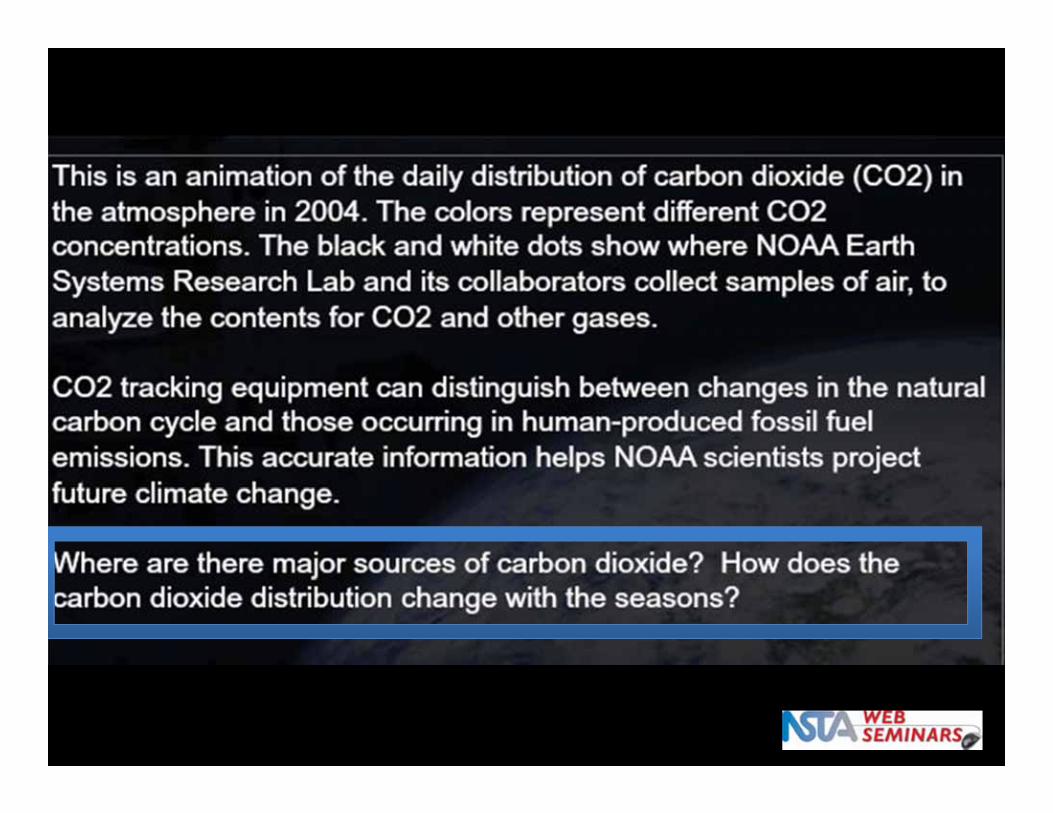
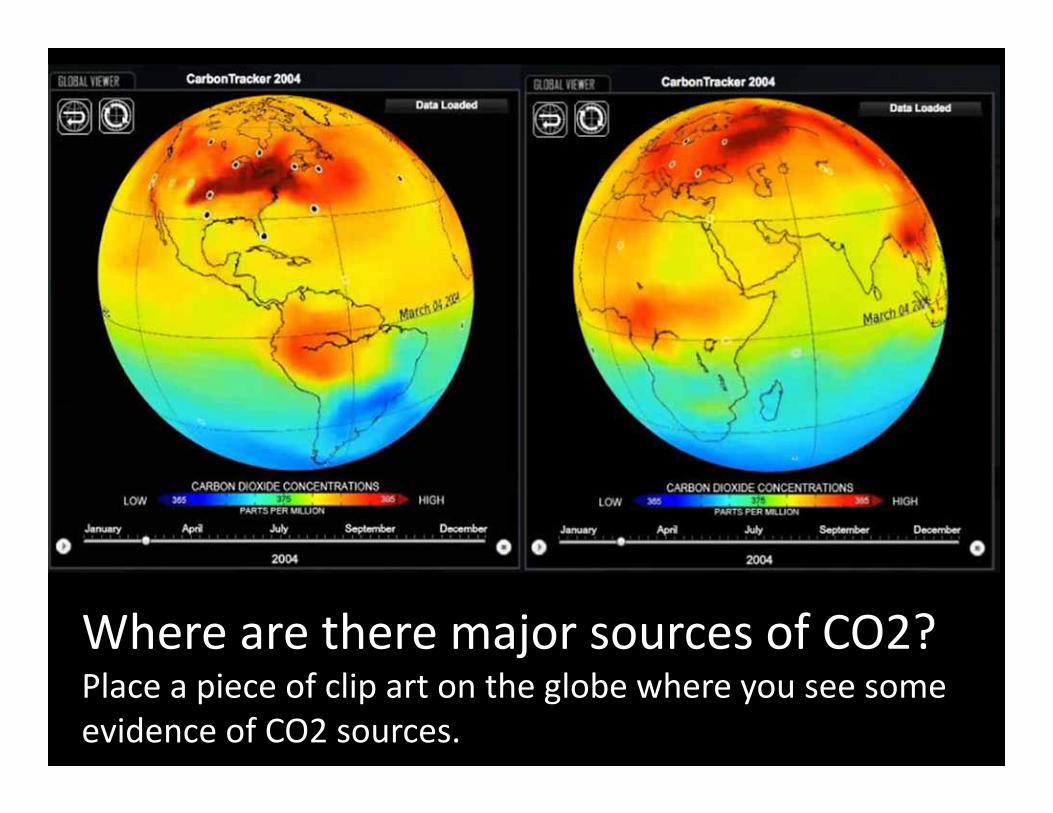
Where are there major sources of CO2?Place a piece of clip art on the globe where you see some evidence of CO2 sources.
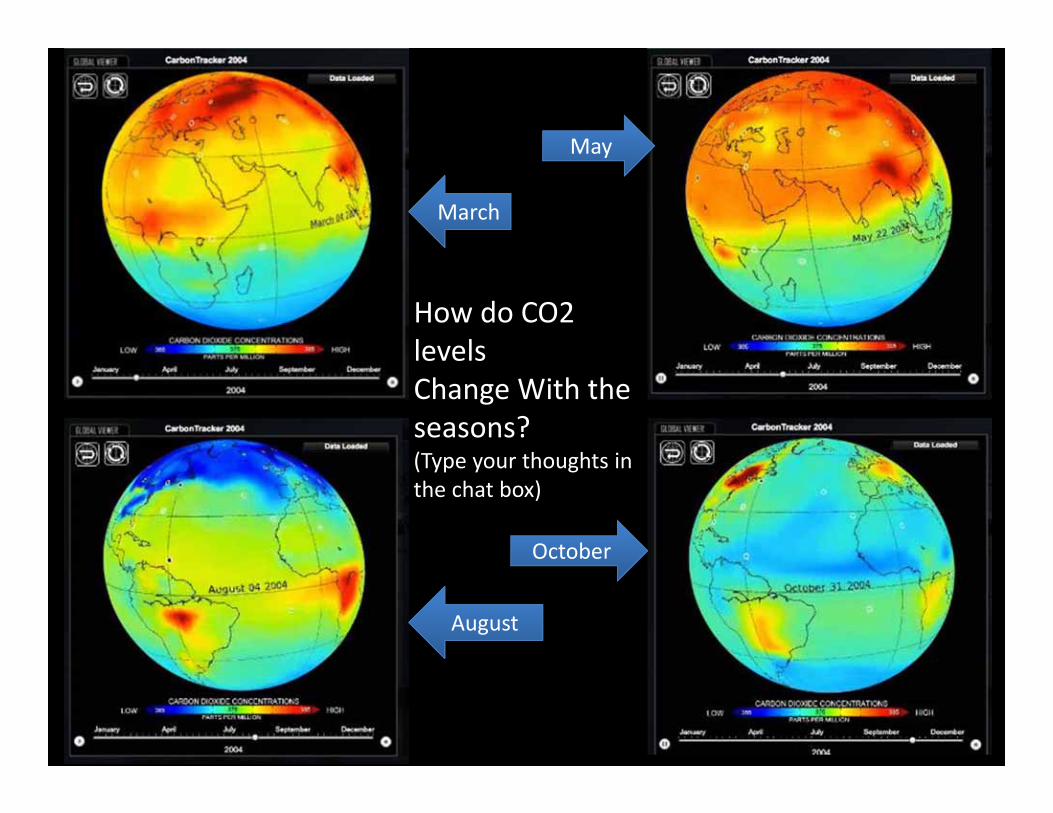
March
August
May
October
How do CO2 levels Change With the seasons?(Type your thoughts in the chat box)

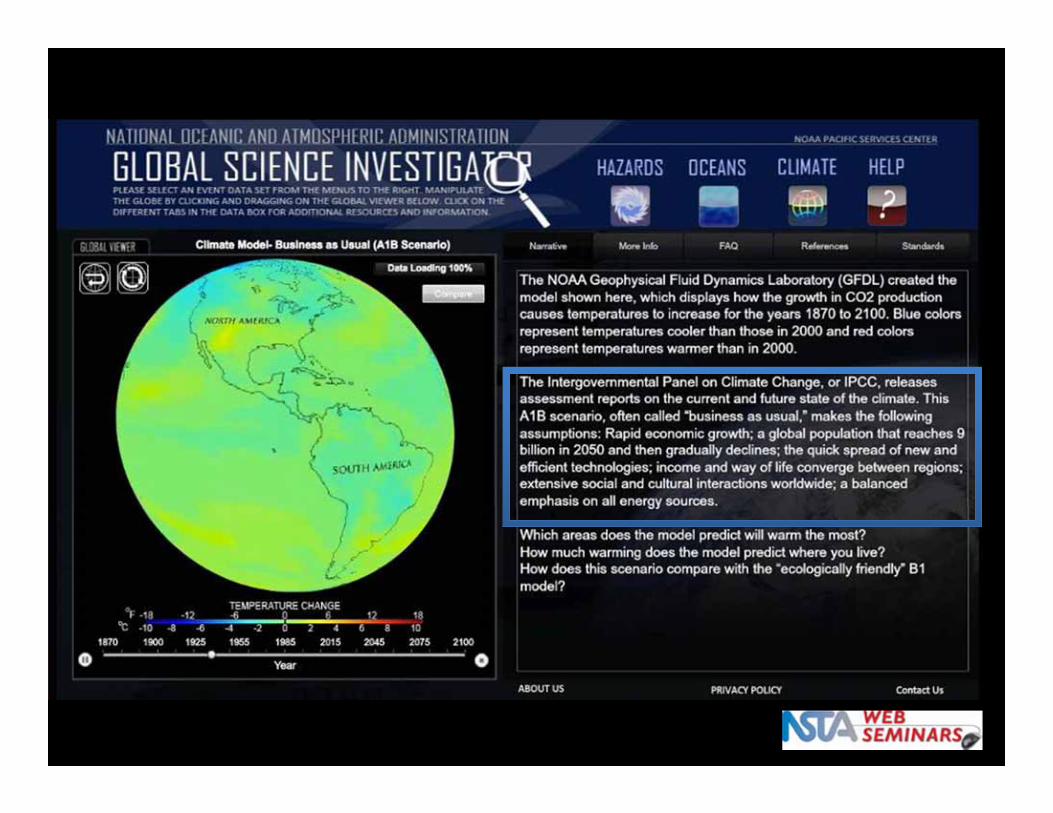


When do the projected temperature changes in the different models begin to diverge (What modeled year)?a.) 2025 b.) 2050c.) 2075 d.) 2100
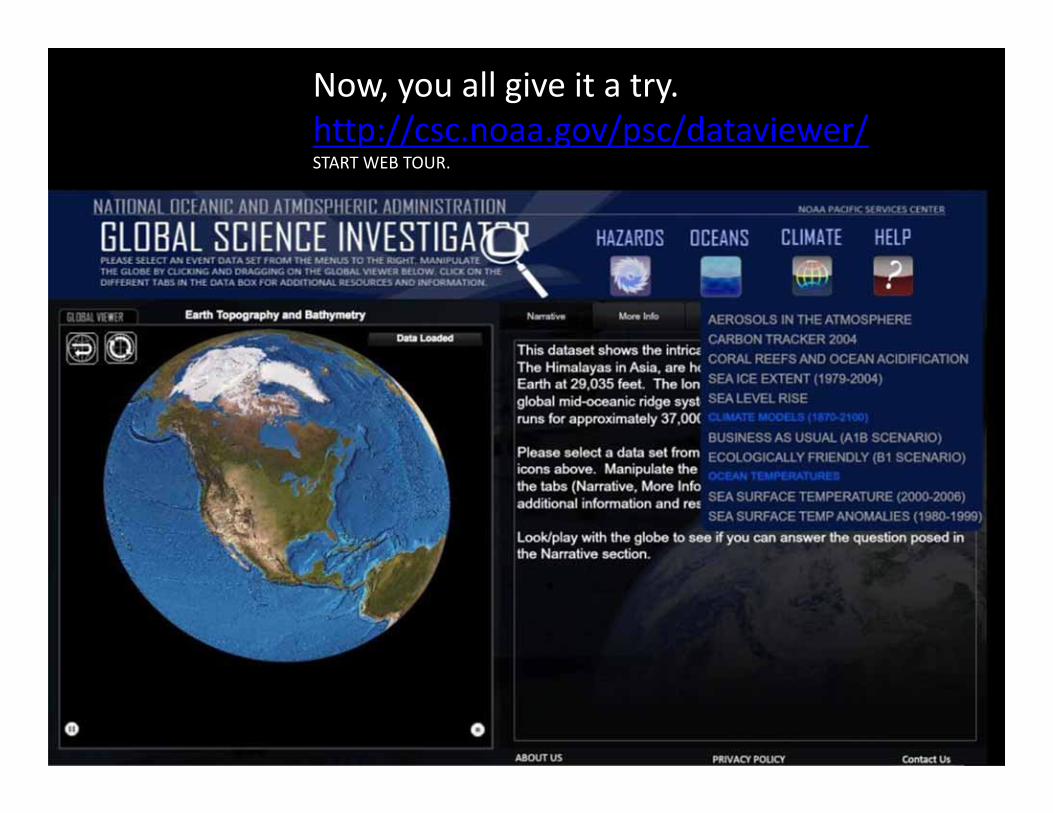
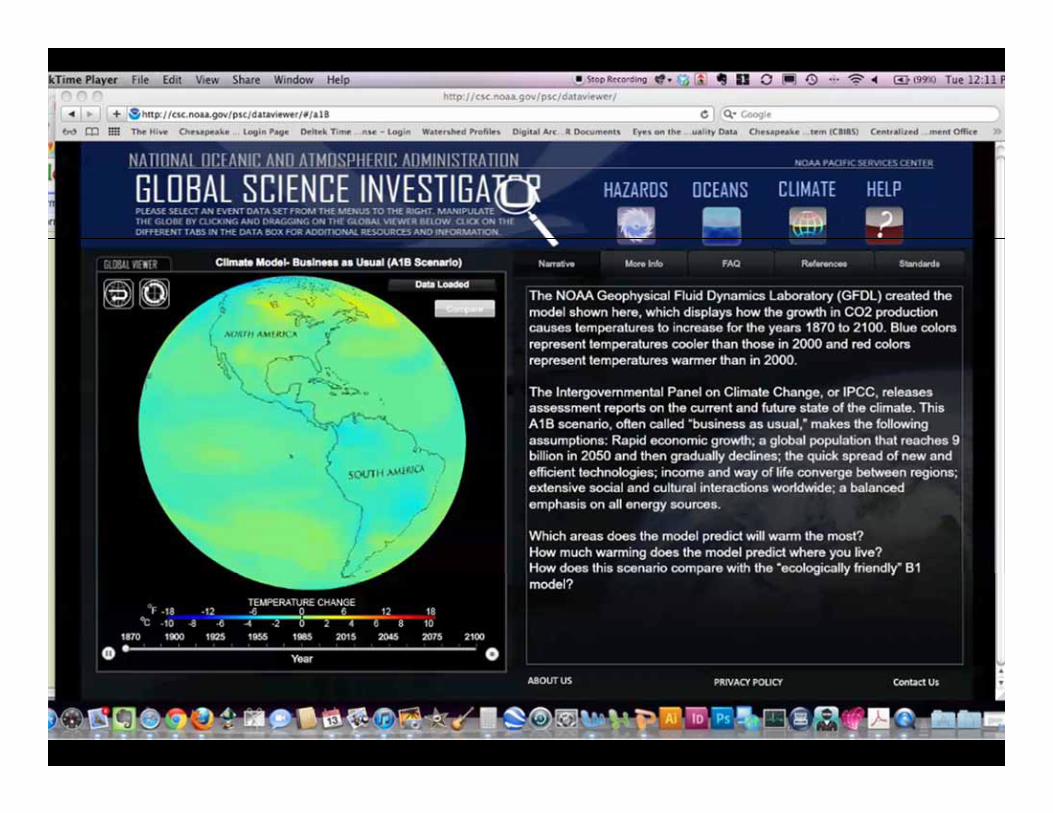
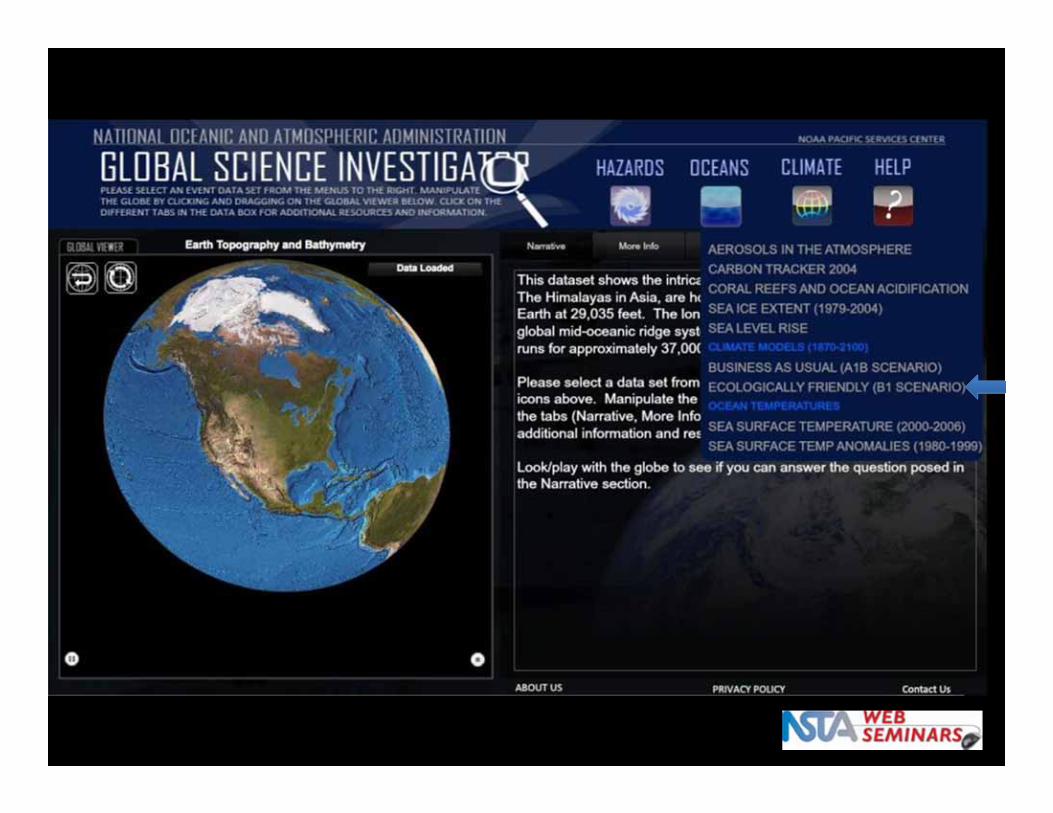
Now, you all give it a try.http://csc.noaa.gov/psc/dataviewer/START WEB TOUR.
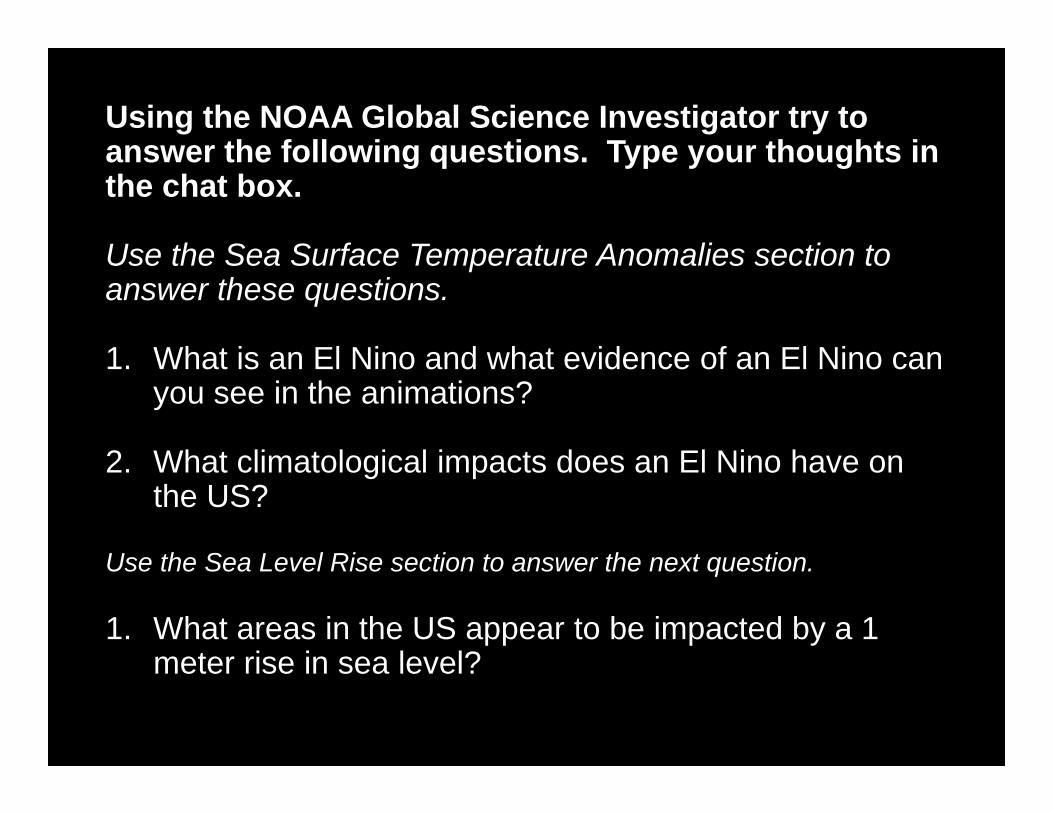
Using the NOAA Global Science Investigator try to answer the following questions. Type your thoughts in the chat box.
Use the Sea Surface Temperature Anomalies section to answer these questions.
1. What is an El Nino and what evidence of an El Nino can you see in the animations?
2. What climatological impacts does an El Nino have on the US?
Use the Sea Level Rise section to answer the next question.
1. What areas in the US appear to be impacted by a 1 meter rise in sea level?

What do you think?
How could you use this tool with your audience?
What suggestions do you have that would make this tool even better?
Please put suggestions in the chat box.
Let’s pause for questions from the audience
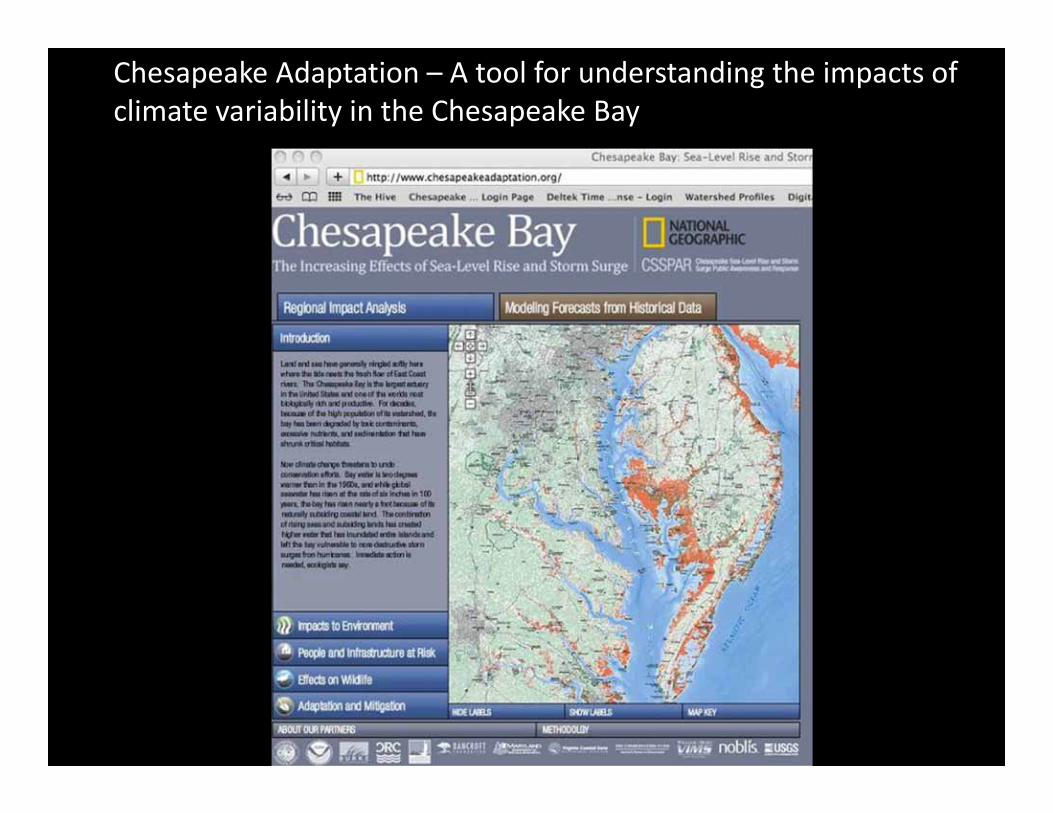
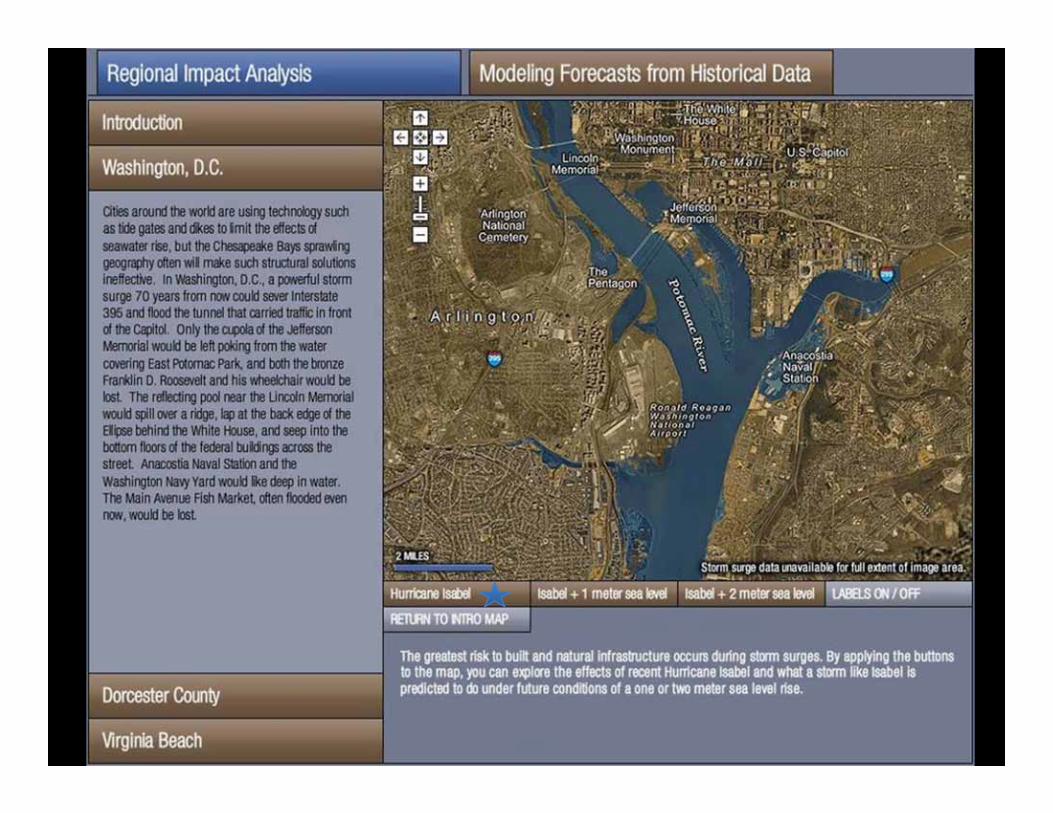
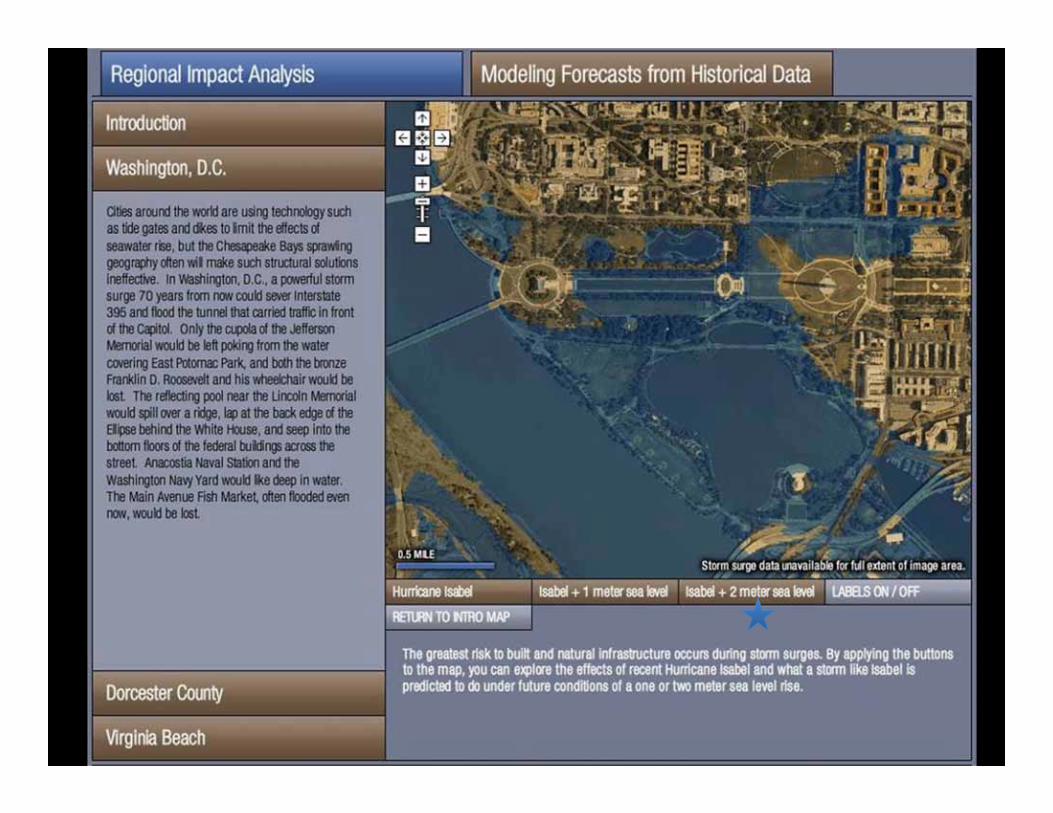
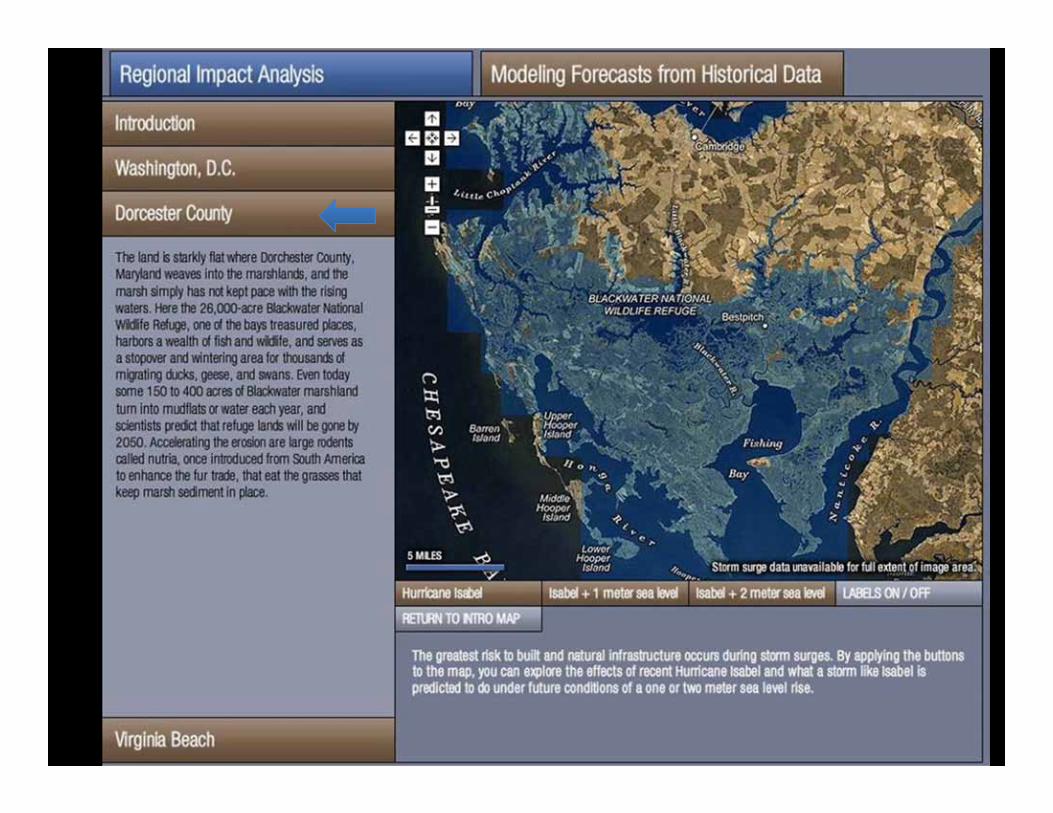
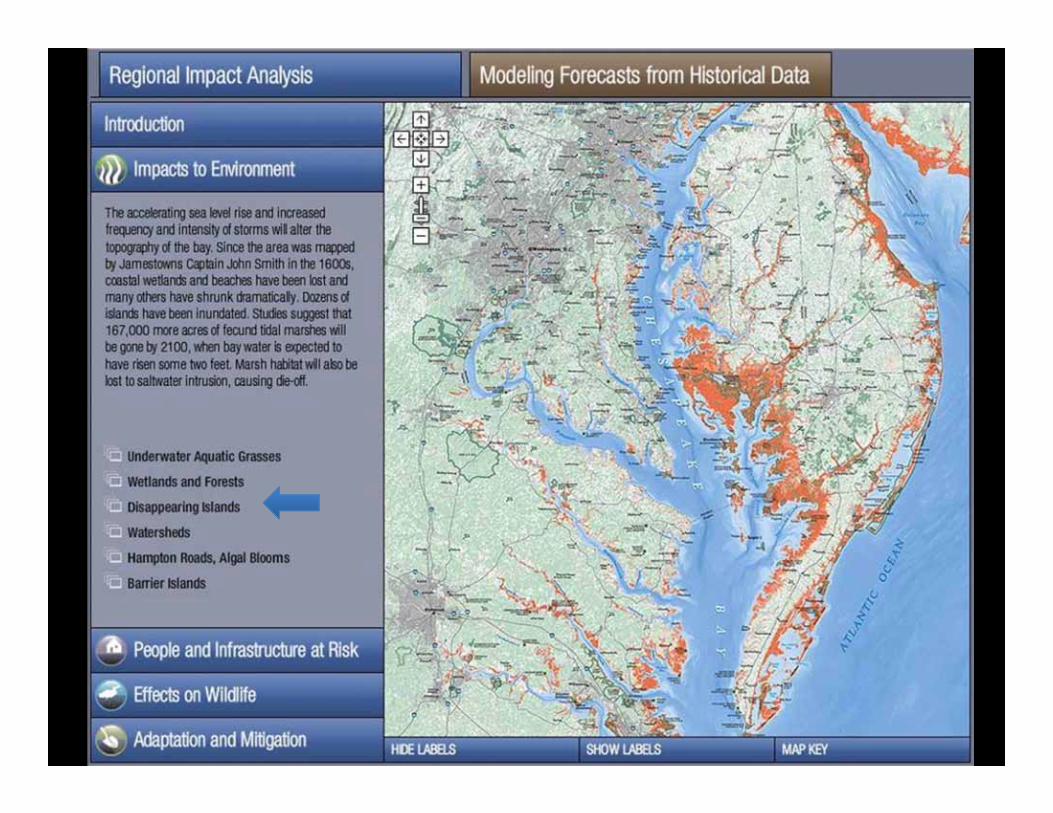
Chesapeake Adaptation – A tool for understanding the impacts of climate variability in the Chesapeake Bay
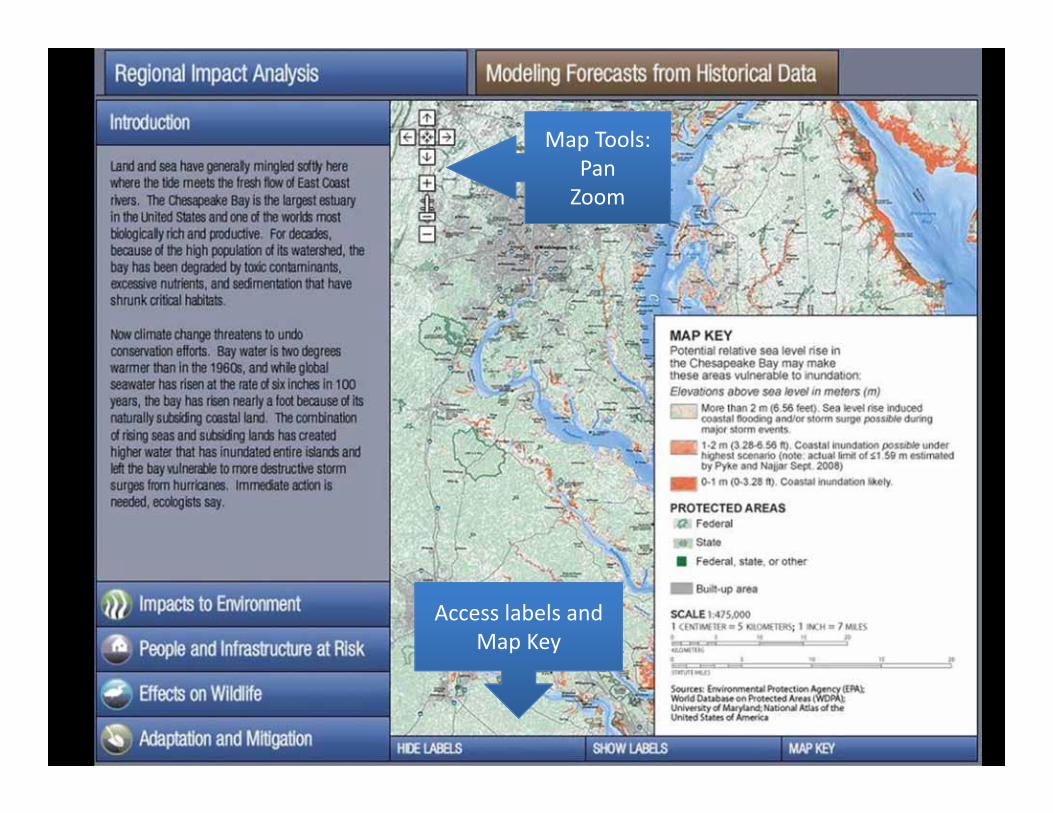
Map Tools:Pan Zoom
Access labels and Map Key
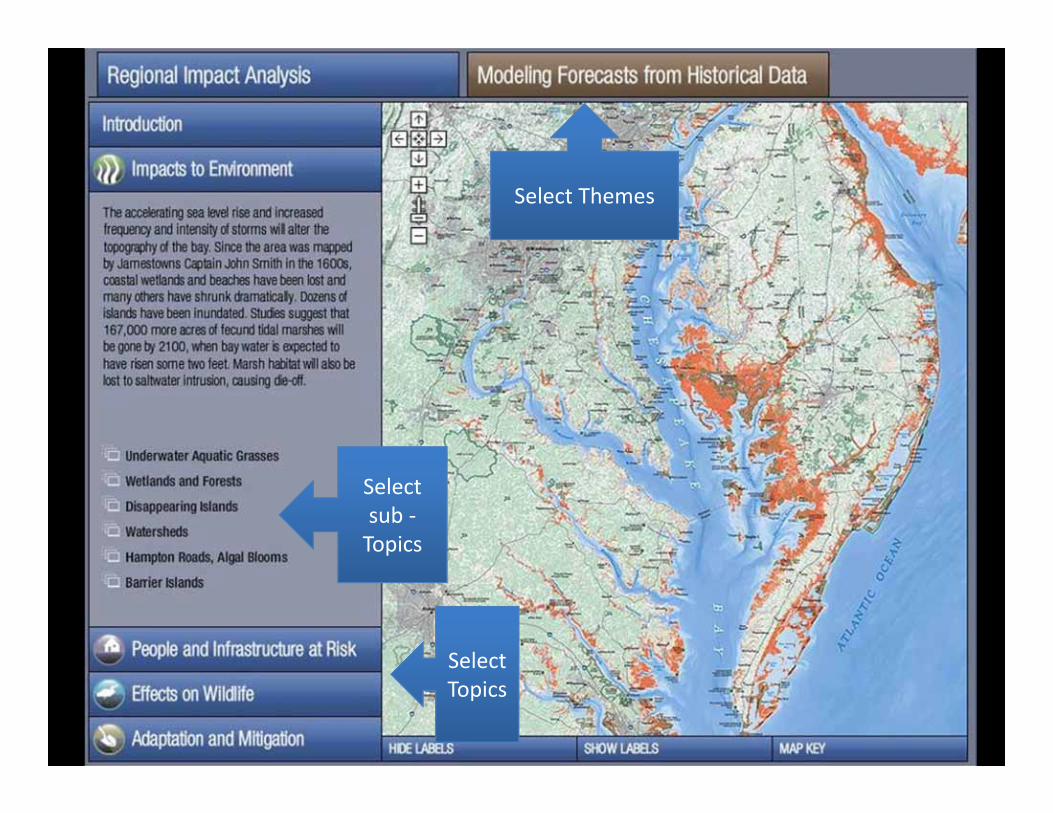
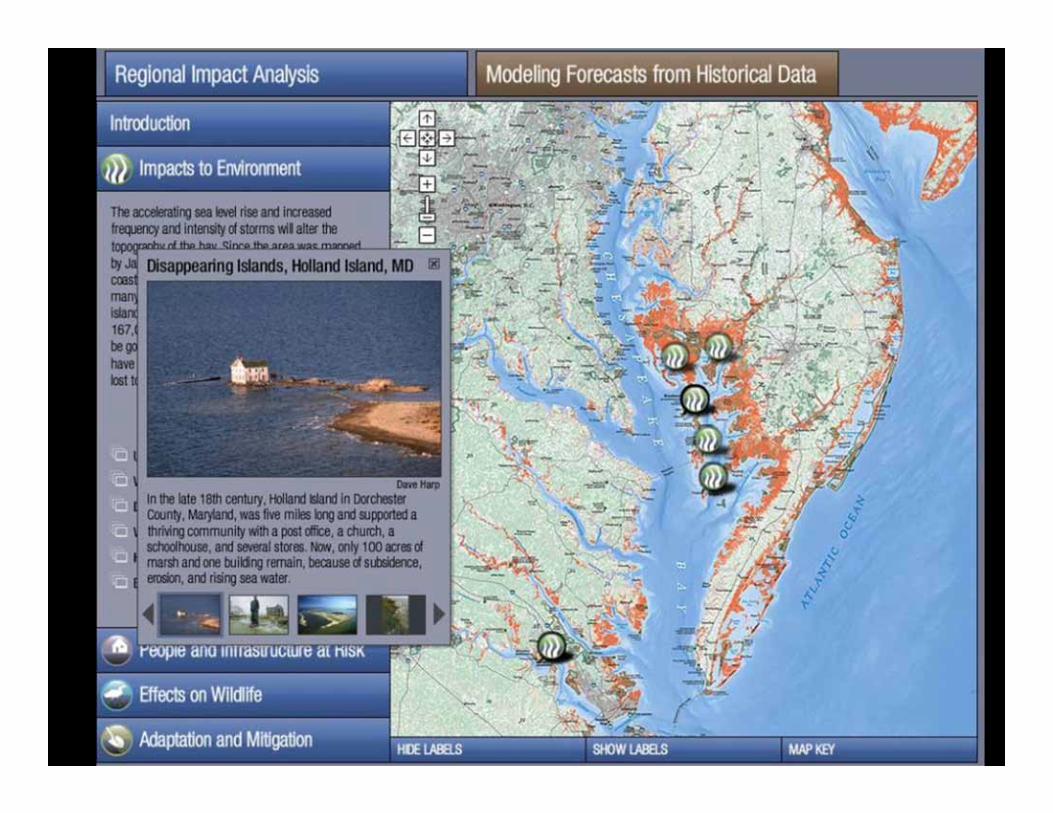
Select Topics
Select sub ‐Topics
Select Themes
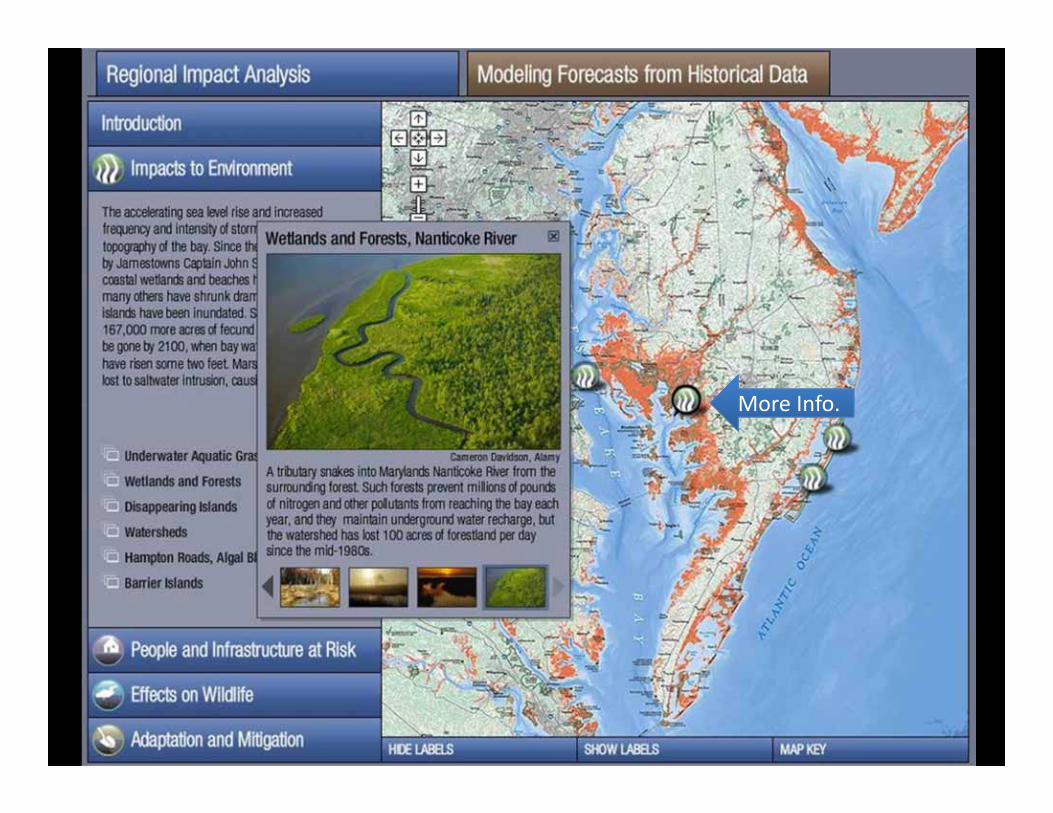
More Info.More Info.


What is your favorite monument in Washington D.C.?

Now, you all give it a try.http://www.chesapeakeadaptation.org/
Using the Chesapeake Adaptation tool,
What are some strategies for adapting to and mitigating the impacts of sea level rise?
What do you think?
How could you use this tool with your audience?
What suggestions do you have that would make this tool even better?
Please put suggestions in the chat box.

Thank You(This presentation will be archived on NSTA,
and please do not hesitate to contact us regarding the use of these tools)
LuAnn DahlmanClimate Program [email protected]
Bart MerrickEnvironmental Science Training Center
Thank you to the sponsor of tonight's Web Seminar:
This web seminar contains information about programs, products, and services offered by third parties, as well as links to third-party websites. The presence of a listing or such information does not constitute an endorsement by NSTA of a
particular company or organization, or its programs, products, or services.
http://learningcenter.nsta.org
National Science Teachers AssociationDr. Francis Q. Eberle, Executive Director
Zipporah Miller, Associate Executive Director Conferences and Programs
Al Byers, Assistant Executive Director e-Learning
LIVE INTERACTIVE LEARNING @ YOUR DESKTOP
NSTA Web SeminarsPaul Tingler, Director
Jeff Layman, Technical Coordinator