Embed Size (px)
Citation preview
1
Environmental Kuznets Curve and the Role of Energy Consumption in Pakistan
Muhammad Shahbaz
Department of Management Sciences,
COMSATS Institute of Information Technology,
Defense Road, Off Raiwind Road, Lahore, Pakistan
[email protected], [email protected]
Hooi Hooi Lean*
Economics Program
School of Social Sciences
Universiti Sains Malaysia
Muhammad Shahbaz Shabbir
Department of Management Sciences,
COMSATS Institute of Information Technology,
Defense Road, Off Raiwind Road, Lahore, Pakistan
* Corresponding author: Dr. Hooi Hooi Lean, School of Social Sciences, Universiti
Sains Malaysia 11800 USM, Penang, Malaysia. Tel: 604-653 2663; Fax: 604-657
0918 Email: [email protected]
2
Abstract
The paper is an effort to fill the gap in the energy literature with a comprehensive
country study for Pakistan. We investigate the relationship between CO2 emissions,
energy consumption, economic growth and trade openness for Pakistan over the
period of 1971-2009. ARDL model for cointegration and Granger causality tests are
employed for the analysis. The result suggests that there exists long run relationship
among the variables. The EKC hypothesis is supported in the country. Furthermore,
we find one-way causal relationship running from income to CO2 emissions. Energy
consumption increases CO2 emissions both in short and long run. Openness to trade
reduces CO2 emissions in long run but it is insignificant in short run.
3
1. Introduction
In any economy, sustainable economic development can be achieved by
sustainable environment development. The government of Pakistan launched an
environmental policy in 2005 to control environmental degradation with sustained
level of economic growth. The main objective of the National Environmental Policy
(NEP) is to protect, conserve and restore Pakistan's environment in order to improve
the quality of life of the citizens through sustainable development. Meanwhile, the
economic growth is stimulated by all sectors of economy including agricultural,
industrial and services. The rising growth rate in Pakistan is lead by industrial sector
generally and manufacturing sector particularly in contributing the national accounts1.
This industrial-led growth increases energy demand and resulting environmental
pollutants increase in the country. In 2002-2003, industrial sector consumed 36% of
total energy consumption while 33% is consumed by transportation. Even though total
energy consumption is declined to 29% in 2008-2009, but the consumption by
industrial sector has increased to 43% over the period2.
For the case of Pakistan, high usage of petroleum to meet transportation
demand is a major reason of CO2 emissions3. A considerable share of CO2 emissions
is coming from natural gas mainly by the electricity production and coal consumption
produces more than 50% of CO2 emissions of natural gas. In 2005, 0.4% of the world
total CO2 emissions were produced by Pakistan and this “contribution” is worsening
day by day. While the income per capita has increased from PRS 32,599 to PRS
1 In 2009, economic growth rate is 2% due to poor performance of the industrial and manufacturing sectors (Economic Survey of Pakistan, 2008-2009). 2 Economic Survey of Pakistan, 2008-2009, p. 226. 3 The nature of transportation has been converted to compressed gas consumption after hike in petroleum prices.

4
36,305 over 2006-2009, the usage of energy per capita was increased from 489.36 (kg
of oil equivalent) in 2006 to 522.66 (kg of oil equivalent) in 2009. This has led CO2
emissions per capita rise from 0.7657 metric tons to 1.026 metric tons over the period
of 2006-2009.
The theory of environmental Kuznets curve (EKC) reveals that environmental
degradation increases at initial level of sustainable development and starts to decline
as economy achieves high level of economic development. This relationship between
environmental degradation and economic growth is term as inverted U-shaped curve.
The estimable relationship between environmental degradation and income per capita
has been empirically investigated to some extent but no study is found for the case of
Pakistan.
On the other hand, globalization leads to greater integration of economies and
societies (Agenor, 2003). Thus, new trade routes have been discovered and technology
of transport has been improved to obtain benefits from openness. The Hecksher-Ohlin
(Hecksher, 1919 and Ohlin, 1933) model posits that differences in labour productivity
lead to produce different goods in different economies. Trade is a main engine that
provides a way to enhance production intensively by utilizing abundant domestic
resources efficiently. Trade openness also provides a way for mobilizing factors of
production freely between the countries. However, movement of factors of production
may also move dirty industries from home countries to developing economies where
laws and regulations about environment is just formality. For example, Feridun et al.
(2006) documented that trade openness harms the environmental quality in less
developed economies like Nigeria.
5
Antweiler et al. (2001) examined effect of trade on environmental quality.
They introduced composition, scale and technological effects by decomposing the
trade model. Their study concluded that trade openness is beneficial for environment
if the technological effect is greater than the composition effect and scale effect. This
shows that increasing trade will improve the income level of developing nations which
induce them to import less polluting techniques to enhance the production. Copeland
and Taylor (2005) supported that international trade is beneficial to environmental
quality through environmental regulations and capital-labor channels. The authors
documented that free trade declines CO2 emissions. The main reason is international
trade will shift the production of pollution-intensive goods from developing countries
to the developed nations and hence declines CO2 emissions of the world. Managi et
al. (2008) found that quality of environment is improved if environmental regulation
effect is stronger than capital labour effect. Similarly, McCarney and Adamowicz
(2006) suggested that trade openness improves environmental quality depending on
government policies. The local government can reduce CO2 emissions through the
environmental policies.
The present study is an effort to fill the gap in the energy literature because
there is lack of comprehensive study for Pakistan. Single country study helps policy
making authorities in making comprehensive policy to control environmental
degradation. This study contributes to energy literature with a case study of Pakistan
using time series data for the period of 1971-2009. Moreover, an important variable,
trade openness is taken into account for its impact on environmental pollution. The
rest of the paper is organized as following: Literature review is explained in section 2.
6
Section 3 describes theoretical and estimable model. The empirical results are reported
in section 4 and finally, conclusion and policy implication are drawn in section 5.
2. Literature review
The relevant literature shows two strands of link between energy consumption
and CO2 emissions i.e. economic growth and CO2 emissions and, economic growth
and energy consumption. The dominating relationship between economic growth and
CO2 emissions has been achieved great attention of researchers. The relationship
between CO2 emissions and economic growth is termed as EKC4. The association
between economic growth and CO2 emissions reveals that economic growth is linked
with high CO2 emissions initially and CO2 emissions tends to decrease as an
economy achieves turning point or threshold level of economic growth.
The empirical studies of EKC started by Grossman and Krueger (1991) and
followed by Lucas et al. (1992), Wyckoff and Roop (1994), Suri and Chapman
(1998), Heil and Selden (1999), Friedl and Getzner (2003), Stern (2004), Nohman and
Antrobus (2005), Dinda and Coondoo (2006) and Coondoo and Dinda (2008).
Existing studies seem to present mixed empirical evidences on the validity of EKC.
Song et al. (2008), Dhakal (2009), Jalil and Mahmud (2009) and, Zhang and Cheng
(2009) supported the existence of EKC in China. The findings of Fodha and Zaghdoud
(2010) revealed the existence of EKC between the SO2 emissions and economic
growth but not for the CO2 emissions in Tunisia. In contrast, Akbostanci et al. (2009)
4 The relationship is described by the linear and non-linear terms of GDP per capita in the model.

7
did not support the existence of EKC in Turkey. They argued that CO2 emissions are
automatically reduced due to the rapid pace of economic growth.
On the other hand, the relationship of energy consumption and economic
growth has been investigated extensively as well. For example, Kraft and Kraft (1978)
for USA, Masih and Masih (1997) for Taiwan and Korea, Aqeel and Butt (2001) for
Pakistan, Wolde-Rufael (2006) for African, Narayan and Singh (2007) for Fiji,
Reynolds and Kolodzieji (2008) for Soviet Union, Chandran et al. (2009) for
Malaysia, Narayan and Smyth (2009) for Middle Eastern and Yoo and Kwak (2010)
for South American concluded that energy consumption causes economic growth.
Opposite causality is also found running from economic growth to energy
consumption by Altinay and Karagol (2004) and Halicioglu (2009) for Turkey, Squalli
(2006) for OPEC, Yuan et al. (2007) for China and Odhiambo (2009) for Tanzania.
Bivariate causality between energy consumption and economic growth is also
documented by Asafu-Adjaye (2000) for Thailand and Philippines.
Recent literature documented alliance of economic growth with energy
consumption and environmental pollution to investigate the validity of EKC. The
relationship between economic growth, energy consumption and CO2 emissions have
also been researched extensively both in the country case and panel studies. Ang
(2007) found stable long run relationship between economic growth, energy
consumption and CO2 emissions for French economy while Ang (2008) also got
similar result for Malaysia. Ang (2007) showed that causality is running from
economic growth to energy consumption and CO2 emissions in the long run but
energy consumption causes economic growth in short run. In the case of Malaysia,
8
Ang (2008) reported that output increases CO2 emissions and energy consumption.
Ghosh (2010) documented that no long run causality between economic growth and
CO2 emissions and bivariate short run causality in India.
For the panel studies, Apergis and Payne (2009) investigated this alliance
relationship for six Central American economies using panel VECM. It is evident that
energy consumption is positively linked with CO2 emissions and EKC hypothesis has
been confirmed. Lean and Smyth (2010) and Apergis and Payne (2010) reached the
same conclusion for the case of ASEAN countries and Commonwealth of Independent
States respectively. Narayan and Narayan’s (2010) empirical evidence also validates
the EKC hypothesis for 43 low income countries. In addition, Lean and Smyth (2010)
noted long run causality running from energy consumption and CO2 emissions to
economic growth but in the short span of time, energy consumption causes CO2
emissions. On the other hand, Apergis and Payne (2010) found that energy
consumption and economic growth Granger causes CO2 emissions while bivariate
causality is found between energy consumption and economic growth; and between
energy consumption and CO2 emissions.
The relationship between international trade and environment has also been
investigated empirically. Grossman and Krueger (1991) argued that environmental
effect of international trade depend on the policies of an economy. There are two
schools of thought about the impact of international trade on CO2 emissions. One
argued that trade openness provides an offer to each country to have access to
international market which enhances the market share among countries. This leads the
competition among the countries and increases the efficiency of using scarce
9
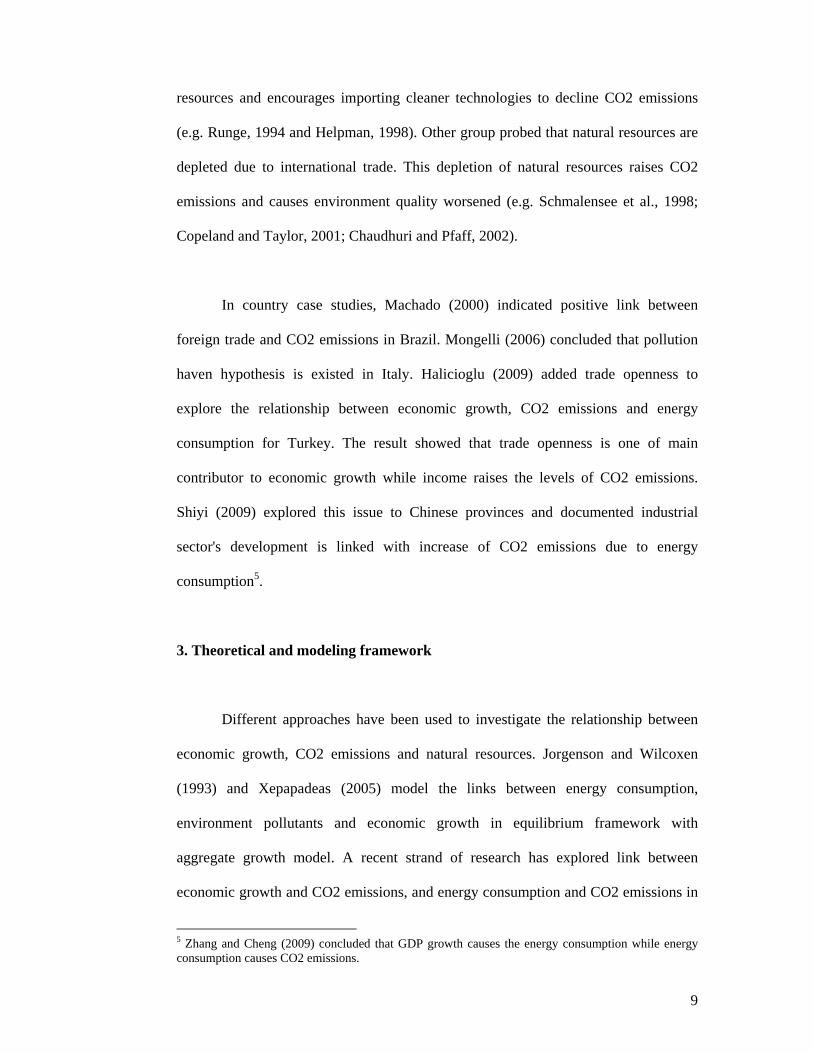
resources and encourages importing cleaner technologies to decline CO2 emissions
(e.g. Runge, 1994 and Helpman, 1998). Other group probed that natural resources are
depleted due to international trade. This depletion of natural resources raises CO2
emissions and causes environment quality worsened (e.g. Schmalensee et al., 1998;
Copeland and Taylor, 2001; Chaudhuri and Pfaff, 2002).
In country case studies, Machado (2000) indicated positive link between
foreign trade and CO2 emissions in Brazil. Mongelli (2006) concluded that pollution
haven hypothesis is existed in Italy. Halicioglu (2009) added trade openness to
explore the relationship between economic growth, CO2 emissions and energy
consumption for Turkey. The result showed that trade openness is one of main
contributor to economic growth while income raises the levels of CO2 emissions.
Shiyi (2009) explored this issue to Chinese provinces and documented industrial
sector's development is linked with increase of CO2 emissions due to energy
consumption5.
3. Theoretical and modeling framework
Different approaches have been used to investigate the relationship between
economic growth, CO2 emissions and natural resources. Jorgenson and Wilcoxen
(1993) and Xepapadeas (2005) model the links between energy consumption,
environment pollutants and economic growth in equilibrium framework with
aggregate growth model. A recent strand of research has explored link between
economic growth and CO2 emissions, and energy consumption and CO2 emissions in
5 Zhang and Cheng (2009) concluded that GDP growth causes the energy consumption while energy consumption causes CO2 emissions.
10
single equation model (Ang, 2007, 2008 and Soytas et al., 2007). The present study
follows the methodology applied by Ang (2007, 2008), Soytas et al. (2007),
Halicioglu (2009) and Jalil and Mahmud (2009)6.
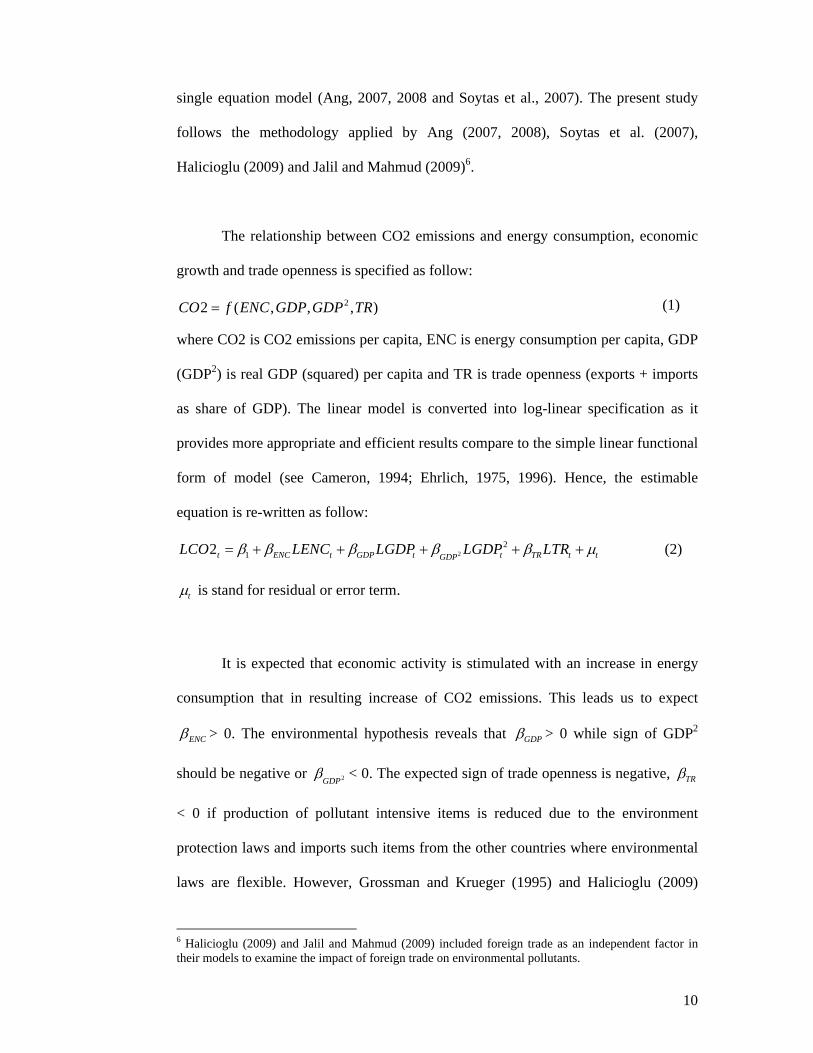
The relationship between CO2 emissions and energy consumption, economic
growth and trade openness is specified as follow:
(1)
where CO2 is CO2 emissions per capita, ENC is energy consumption per capita, GDP
(GDP2) is real GDP (squared) per capita and TR is trade openness (exports + imports
as share of GDP). The linear model is converted into log-linear specification as it
provides more appropriate and efficient results compare to the simple linear functional
form of model (see Cameron, 1994; Ehrlich, 1975, 1996). Hence, the estimable
equation is re-written as follow:
22
12t ENC t GDP t t TR t tGDPLCO LENC LGDP LGDP LTR (2)
t
is stand for residual or error term.
It is expected that economic activity is stimulated with an increase in energy
consumption that in resulting increase of CO2 emissions. This leads us to expect
ENC > 0. The environmental hypothesis reveals that GDP > 0 while sign of GDP2
should be negative or 2GDP< 0. The expected sign of trade openness is negative, TR
< 0 if production of pollutant intensive items is reduced due to the environment
protection laws and imports such items from the other countries where environmental
laws are flexible. However, Grossman and Krueger (1995) and Halicioglu (2009)
6 Halicioglu (2009) and Jalil and Mahmud (2009) included foreign trade as an independent factor in their models to examine the impact of foreign trade on environmental pollutants.
22 ( , , , )CO f ENC GDP GDP TR
11
argued that sign of TR
is positive if dirty industries of developing economies are busy
to produce heavy share of CO2 emissions with production.
Pesaran et al. (2001) established an advanced approach to examine
cointegration among variables. This approach is termed as Autoregressive Distributive
Lag (ARDL) bounds test. The ARDL model can be applied without investigating the
order of integration (Pesaran and Pesaran, 1997). Most macroeconomic variables are
integrated at I(0) or I(1). Haug (2002) argued that ARDL approach for cointegration
presents better results for small sample data set as compared to other techniques for
cointegration such as Engle and Granger (1987), Johansen (1990) and Philips and
Hansen (1990).
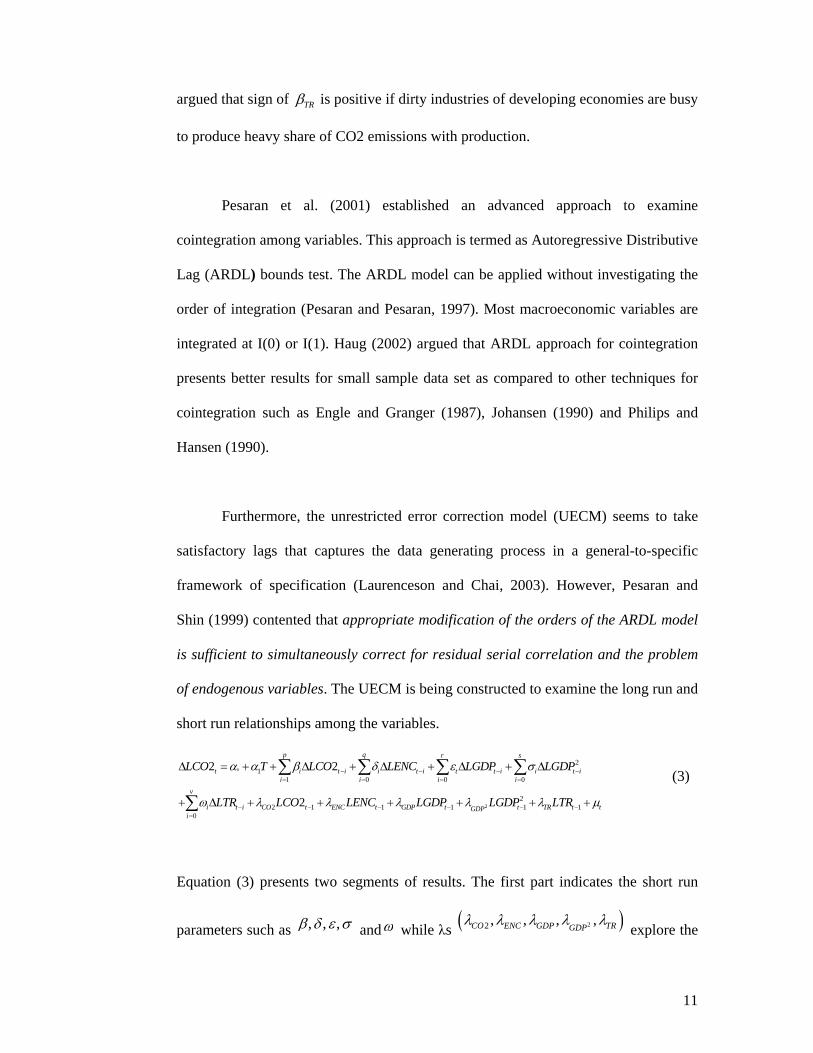
Furthermore, the unrestricted error correction model (UECM) seems to take
satisfactory lags that captures the data generating process in a general-to-specific
framework of specification (Laurenceson and Chai, 2003). However, Pesaran and
Shin (1999) contented that appropriate modification of the orders of the ARDL model
is sufficient to simultaneously correct for residual serial correlation and the problem
of endogenous variables. The UECM is being constructed to examine the long run and
short run relationships among the variables.
2
21
1 0 0 0
22 1 1 1 1 1
0
2 2
2
p q r s
t i t i i t i t t i i t ii i i i
v
i t i CO t ENC t GDP t t TR t tGDPi
LCO T LCO LENC LGDP LGDP
LTR LCO LENC LGDP LGDP LTR
(3)
Equation (3) presents two segments of results. The first part indicates the short run
parameters such as ,,, and
while s 22 , , , ,CO ENC GDP TRGDP
explore the
12
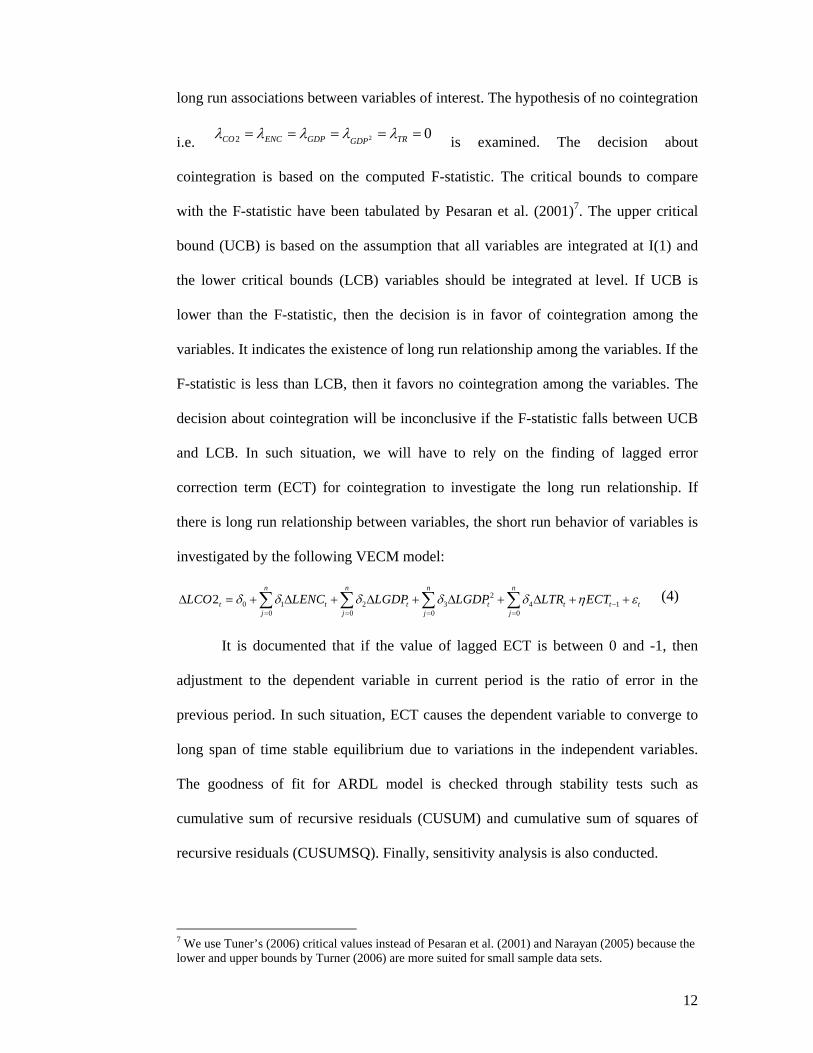
long run associations between variables of interest. The hypothesis of no cointegration
i.e. 022 TRGDPGDPENCCO
is examined. The decision about
cointegration is based on the computed F-statistic. The critical bounds to compare
with the F-statistic have been tabulated by Pesaran et al. (2001)7. The upper critical
bound (UCB) is based on the assumption that all variables are integrated at I(1) and
the lower critical bounds (LCB) variables should be integrated at level. If UCB is
lower than the F-statistic, then the decision is in favor of cointegration among the
variables. It indicates the existence of long run relationship among the variables. If the
F-statistic is less than LCB, then it favors no cointegration among the variables. The
decision about cointegration will be inconclusive if the F-statistic falls between UCB
and LCB. In such situation, we will have to rely on the finding of lagged error
correction term (ECT) for cointegration to investigate the long run relationship. If
there is long run relationship between variables, the short run behavior of variables is
investigated by the following VECM model:
20 1 2 3 4 1
0 0 0 0
2n n n n
t t t t t t tj j j j
LCO LENC LGDP LGDP LTR ECT (4)
It is documented that if the value of lagged ECT is between 0 and -1, then
adjustment to the dependent variable in current period is the ratio of error in the
previous period. In such situation, ECT causes the dependent variable to converge to
long span of time stable equilibrium due to variations in the independent variables.
The goodness of fit for ARDL model is checked through stability tests such as
cumulative sum of recursive residuals (CUSUM) and cumulative sum of squares of
recursive residuals (CUSUMSQ). Finally, sensitivity analysis is also conducted.
7 We use Tuner’s (2006) critical values instead of Pesaran et al. (2001) and Narayan (2005) because the lower and upper bounds by Turner (2006) are more suited for small sample data sets.
13
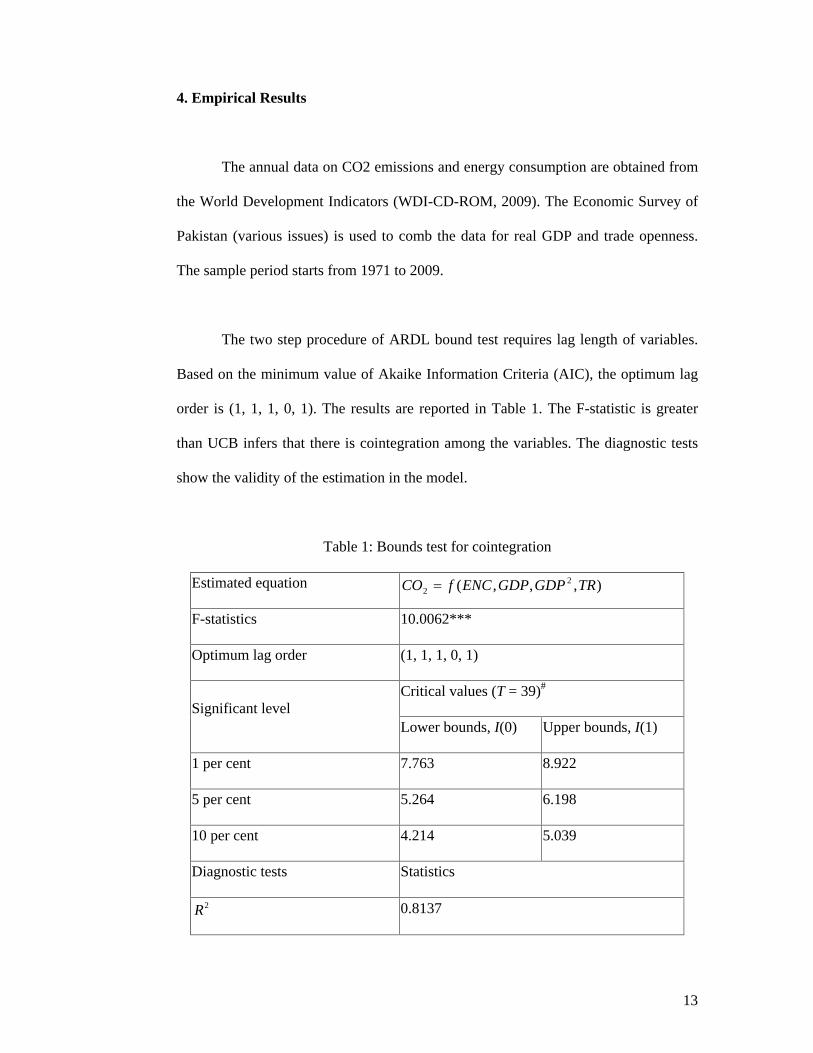
4. Empirical Results
The annual data on CO2 emissions and energy consumption are obtained from
the World Development Indicators (WDI-CD-ROM, 2009). The Economic Survey of
Pakistan (various issues) is used to comb the data for real GDP and trade openness.
The sample period starts from 1971 to 2009.
The two step procedure of ARDL bound test requires lag length of variables.
Based on the minimum value of Akaike Information Criteria (AIC), the optimum lag
order is (1, 1, 1, 0, 1). The results are reported in Table 1. The F-statistic is greater
than UCB infers that there is cointegration among the variables. The diagnostic tests
show the validity of the estimation in the model.
Table 1: Bounds test for cointegration
Estimated equation
F-statistics 10.0062***
Optimum lag order (1, 1, 1, 0, 1)
Critical values (T = 39)#
Significant level Lower bounds, I(0) Upper bounds, I(1)
1 per cent 7.763 8.922
5 per cent 5.264 6.198
10 per cent 4.214 5.039
Diagnostic tests Statistics
2R
0.8137
),,,( 22 TRGDPGDPENCfCO

14
Adjusted- 2R
0.6952
J-B Normality 0.9537 (0.6207)
Breusch-Godfrey LM 0.5885 (0.4515)
ARCH LM 0.0094 (0.9232)
Ramsey RESET 0.3780 (0.5452)
Note: The asterisks *** denote the significant at 1 per cent level. # Critical values bounds are computed by surface response procedure by Turner (2006).
The long run marginal impact of economic growth, energy consumption and
trade openness on CO2 emissions is reported in Table 2. The results reveal that
increase in energy consumption will increase CO2 emissions. It is documented that 1
percent rise in energy consumption raises CO2 emissions by 0.86 percent. The
findings are in line with the literature such as Hamilton and Turton (2002), Friedl and
Getzner (2003), Liu (2005), Ang and Liu (2005), Say and Yücel (2006), Ang (2008),
Halicioglu (2009), Jalil and Mehmud (2009).
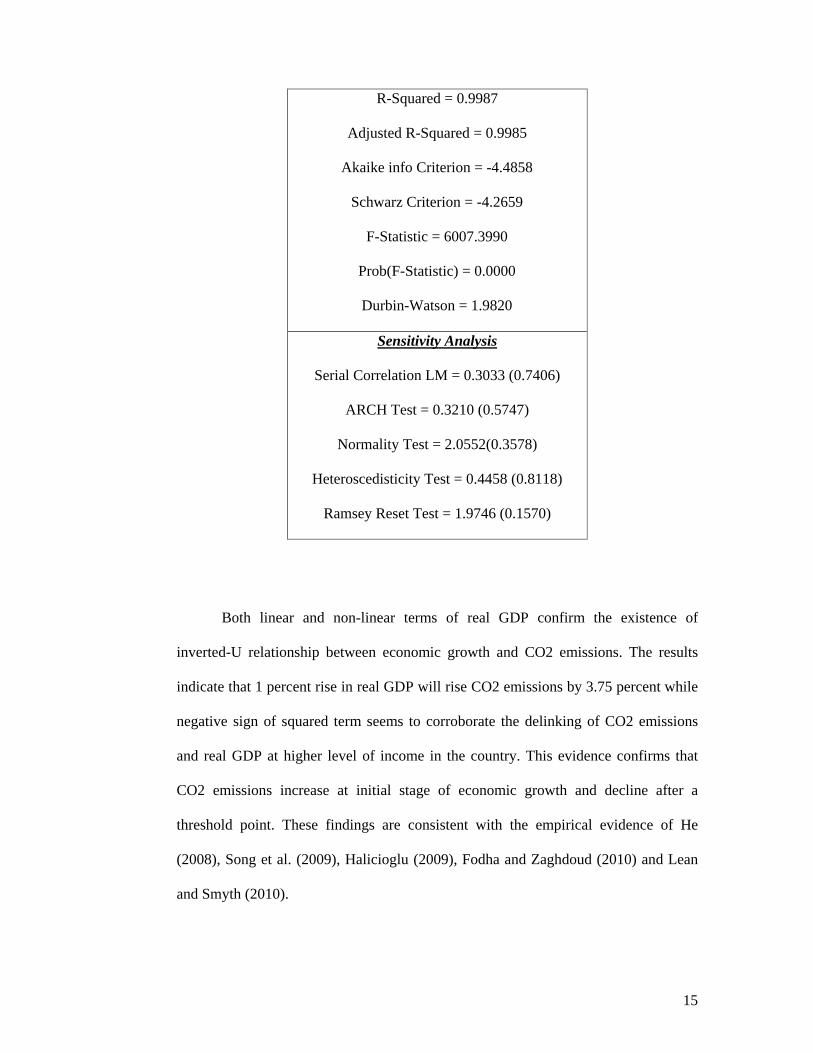
Table 2: Long run relationship
Dependent Variable = LCO2
Variable Coefficient
T-Statistic Probability
Constant
-59.5359 -4.4192 0.0001
LENC 0.8644 4.6376 0.0001
LGDP 3.7483 3.9443 0.0004
LGDP2 -0.0506 -3.0698 0.0044
LTR -0.0855 -1.7927 0.0828
15
R-Squared = 0.9987
Adjusted R-Squared = 0.9985
Akaike info Criterion = -4.4858
Schwarz Criterion = -4.2659
F-Statistic = 6007.3990
Prob(F-Statistic) = 0.0000
Durbin-Watson = 1.9820
Sensitivity Analysis
Serial Correlation LM = 0.3033 (0.7406)
ARCH Test = 0.3210 (0.5747)
Normality Test = 2.0552(0.3578)
Heteroscedisticity Test = 0.4458 (0.8118)
Ramsey Reset Test = 1.9746 (0.1570)
Both linear and non-linear terms of real GDP confirm the existence of
inverted-U relationship between economic growth and CO2 emissions. The results
indicate that 1 percent rise in real GDP will rise CO2 emissions by 3.75 percent while
negative sign of squared term seems to corroborate the delinking of CO2 emissions
and real GDP at higher level of income in the country. This evidence confirms that
CO2 emissions increase at initial stage of economic growth and decline after a
threshold point. These findings are consistent with the empirical evidence of He
(2008), Song et al. (2009), Halicioglu (2009), Fodha and Zaghdoud (2010) and Lean
and Smyth (2010).
16
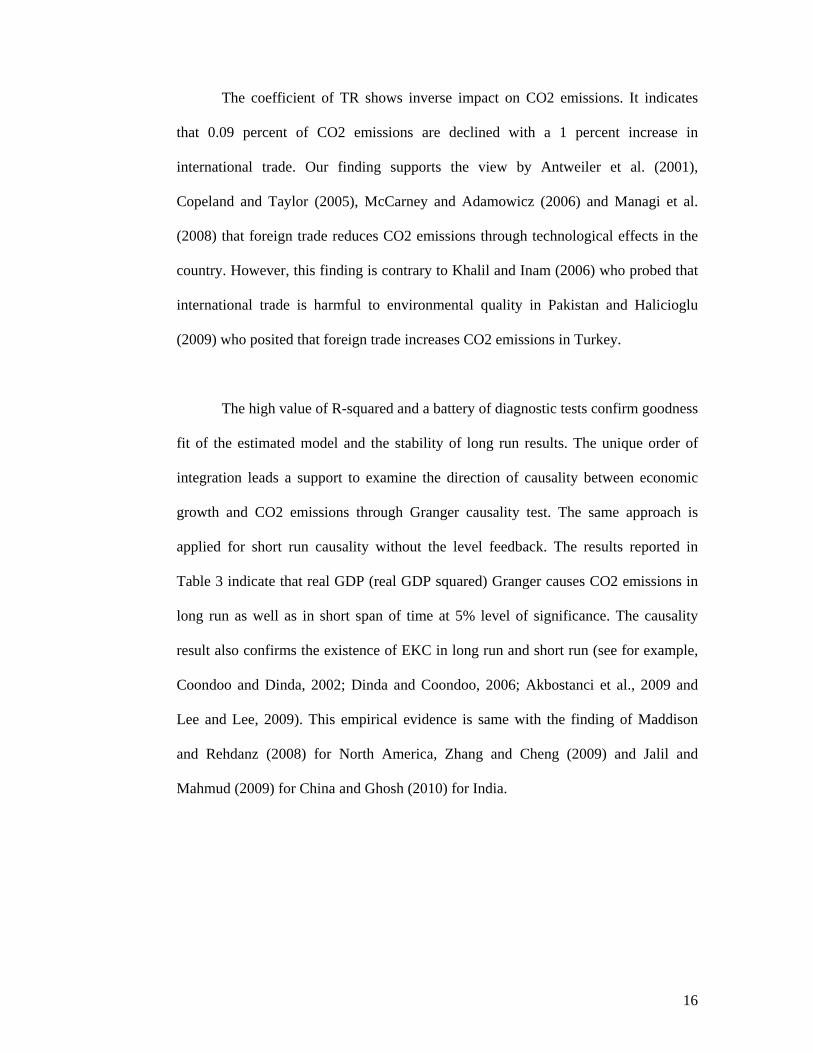
The coefficient of TR shows inverse impact on CO2 emissions. It indicates
that 0.09 percent of CO2 emissions are declined with a 1 percent increase in
international trade. Our finding supports the view by Antweiler et al. (2001),
Copeland and Taylor (2005), McCarney and Adamowicz (2006) and Managi et al.
(2008) that foreign trade reduces CO2 emissions through technological effects in the
country. However, this finding is contrary to Khalil and Inam (2006) who probed that
international trade is harmful to environmental quality in Pakistan and Halicioglu
(2009) who posited that foreign trade increases CO2 emissions in Turkey.
The high value of R-squared and a battery of diagnostic tests confirm goodness
fit of the estimated model and the stability of long run results. The unique order of
integration leads a support to examine the direction of causality between economic
growth and CO2 emissions through Granger causality test. The same approach is
applied for short run causality without the level feedback. The results reported in
Table 3 indicate that real GDP (real GDP squared) Granger causes CO2 emissions in
long run as well as in short span of time at 5% level of significance. The causality
result also confirms the existence of EKC in long run and short run (see for example,
Coondoo and Dinda, 2002; Dinda and Coondoo, 2006; Akbostanci et al., 2009 and
Lee and Lee, 2009). This empirical evidence is same with the finding of Maddison
and Rehdanz (2008) for North America, Zhang and Cheng (2009) and Jalil and
Mahmud (2009) for China and Ghosh (2010) for India.
17
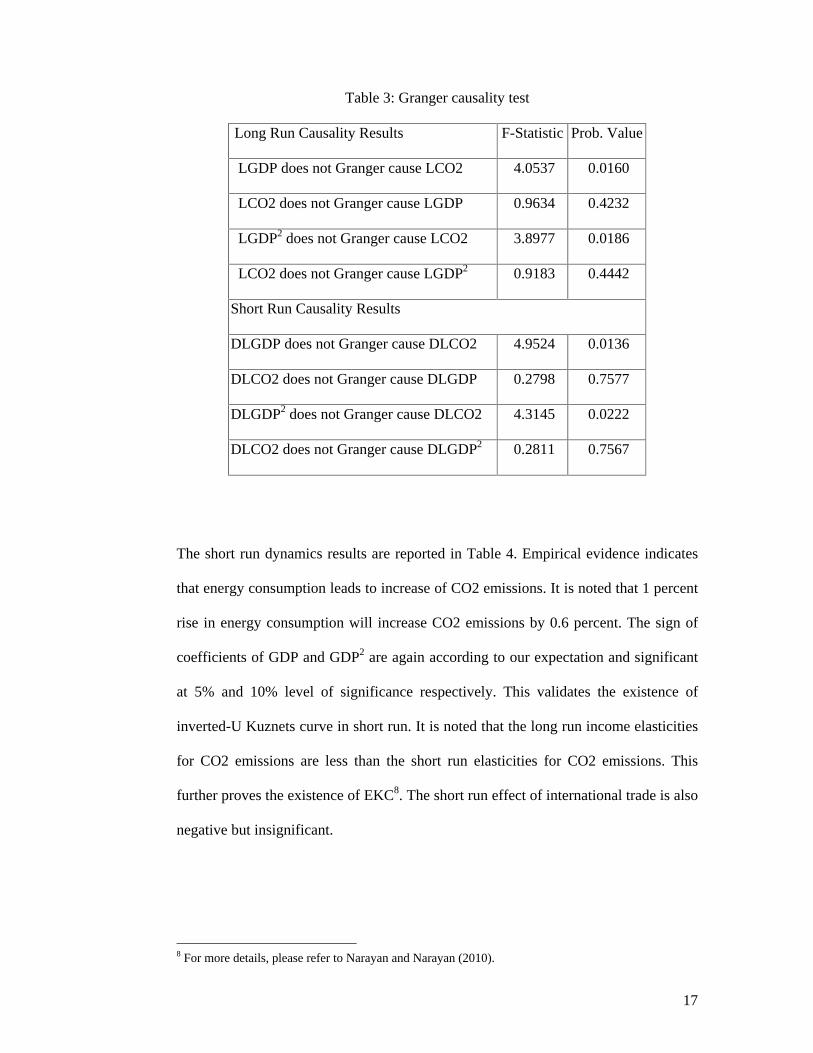
Table 3: Granger causality test
Long Run Causality Results F-Statistic
Prob. Value
LGDP does not Granger cause LCO2 4.0537 0.0160
LCO2 does not Granger cause LGDP 0.9634 0.4232
LGDP2 does not Granger cause LCO2 3.8977 0.0186
LCO2 does not Granger cause LGDP2 0.9183 0.4442
Short Run Causality Results
DLGDP does not Granger cause DLCO2 4.9524 0.0136
DLCO2 does not Granger cause DLGDP 0.2798 0.7577
DLGDP2 does not Granger cause DLCO2 4.3145 0.0222
DLCO2 does not Granger cause DLGDP2 0.2811 0.7567
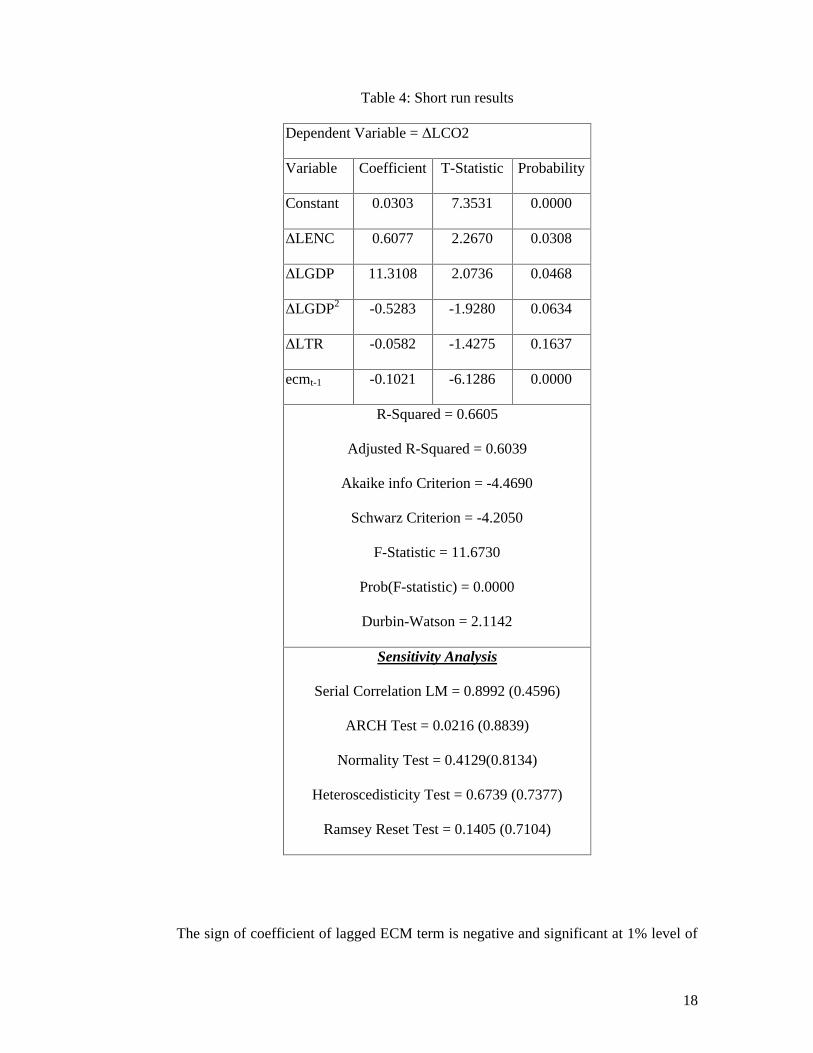
The short run dynamics results are reported in Table 4. Empirical evidence indicates
that energy consumption leads to increase of CO2 emissions. It is noted that 1 percent
rise in energy consumption will increase CO2 emissions by 0.6 percent. The sign of
coefficients of GDP and GDP2 are again according to our expectation and significant
at 5% and 10% level of significance respectively. This validates the existence of
inverted-U Kuznets curve in short run. It is noted that the long run income elasticities
for CO2 emissions are less than the short run elasticities for CO2 emissions. This
further proves the existence of EKC8. The short run effect of international trade is also
negative but insignificant.
8 For more details, please refer to Narayan and Narayan (2010).
18
Table 4: Short run results
Dependent Variable = LCO2
Variable Coefficient
T-Statistic Probability
Constant 0.0303 7.3531 0.0000
LENC 0.6077 2.2670 0.0308
LGDP 11.3108 2.0736 0.0468
LGDP2 -0.5283 -1.9280 0.0634
LTR -0.0582 -1.4275 0.1637
ecmt-1 -0.1021 -6.1286 0.0000
R-Squared = 0.6605
Adjusted R-Squared = 0.6039
Akaike info Criterion = -4.4690
Schwarz Criterion = -4.2050
F-Statistic = 11.6730
Prob(F-statistic) = 0.0000
Durbin-Watson = 2.1142
Sensitivity Analysis
Serial Correlation LM = 0.8992 (0.4596)
ARCH Test = 0.0216 (0.8839)
Normality Test = 0.4129(0.8134)
Heteroscedisticity Test = 0.6739 (0.7377)
Ramsey Reset Test = 0.1405 (0.7104)
The sign of coefficient of lagged ECM term is negative and significant at 1% level of
19
significance. This corroborates the established long run relationship among the
variables. Furthermore, the value of lagged ECM term entails that change in CO2
emissions from short run to long span of time is corrected by almost 10 percent over
each year with high significance.
The diagnostic tests such as LM test for serial correlation, ARCH test,
normality test of residual term, White heteroskedasticity and model specification test
for short run model have also been conducted. The results are reported in Table 4. The
empirical findings show that the short run model passes all diagnostic tests
successfully. The evidence indicates no serial correlation, the residual term is
normally distributed and the functional form of the model is well specified. There is
no evidence of autoregressive conditional heteroskedasticity and White
heteroskedasticity.
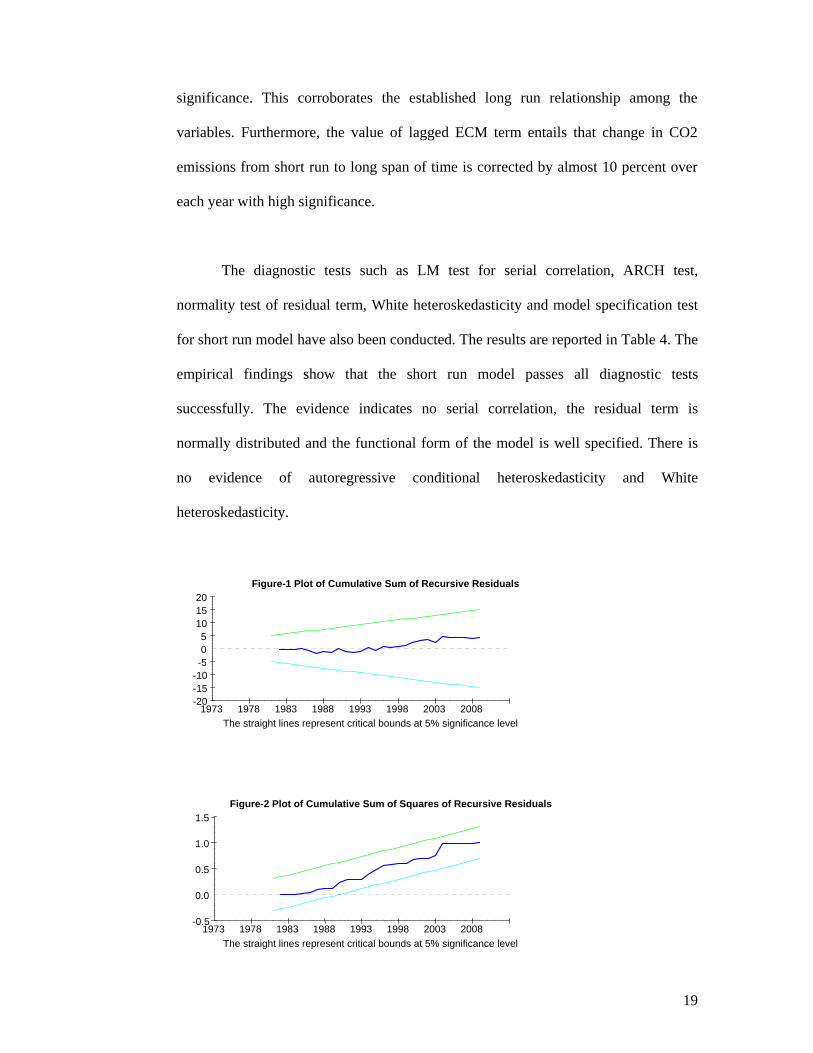
Figure-1 Plot of Cumulative Sum of Recursive Residuals
The straight lines represent critical bounds at 5% significance level
-5-10-15-20
0
5
101520
1973
1978
1983
1988
1993
1998 2003
2008
Figure-2 Plot of Cumulative Sum of Squares of Recursive Residuals
The straight lines represent critical bounds at 5% significance level
-0.5
0.0
0.5
1.0
1.5
1973
1978
1983
1988
1993
1998
2003
2008

20
Cumulative sum (CUSUM) and cumulative sum of squares (CUSUMSQ) tests
have been employed to investigate the stability of long and short run parameters.
Pesaran et al. (1999, 2001) suggested estimating the stability of long and short run
estimate through CUSUM and CUSUMSQ tests. Figures 1 and 2 specify that plots for
CUSUM and CUSUMSQ are between the critical boundaries at 5 % level of
significance. This confirms the accuracy of long and short run parameters in the
model.
5. Conclusion and policy implications
The aim of this paper is to investigate the relationship between CO2 emissions,
energy consumption, economic growth and trade openness for Pakistan over the
period of 1971-2009. The EKC hypothesis has been tested by applying ARDL model
for cointegration. The result suggests that there exists long run relationship among the
variables. The positive sign of linear and negative sign of non-linear GDP indicate that
EKC hypothesis is supported in the country. The results of Granger causality tests
show one-way causal relationship running from income to CO2 emissions. Energy
consumption increases CO2 emissions both in short and long run. Openness to trade
reduces CO2 emissions in long run but it is insignificant in short run.
The significant existence of EKC shows the country's effort to condense CO2
emissions. This indicates the reasonable achievement of controlling environmental
degradation in Pakistan. However, this empirical evidence which is in aggregate data
may not able to show the pattern of four provinces of Pakistan individually. The
21
implementation of NEP itself is not enough. Effective enforcement of environmental
laws and regulation is necessary not only at the federal level but also at the provincial
level. Furthermore, research and development activities regarding environmental
degradation which are important to attain sustainable development are still remaining
unattainable in Pakistan. Therefore, to curb CO2 emissions, there is a need to
implement environment taxes such as green tax.
Moreover, trade openness has beneficial effect on environmental quality in
Pakistan. This supports the view by Antweiler et al. (2001) that international trade
does not harm environment if the country uses cleaner technology for production after
achieving a sustainable level of development. Our finding suggests that Pakistan must
give her attention to import cleaner technology to develop her industrial sector. This
not only enhances the production level but also becomes a safety valve against
environmental degradation. The import of advance technology lowers environmental
cost and develops the industrial sector. Keeping the composition effect constant, scale
effect stimulates economic growth which raises production that increases industrial
pollution. Industrial pollution can be reduced if government checks on scale effect by
importing cleaner technology for industrial sector to attain maximum gains from
international trade in the country.
The limitation of our study is the growth pattern of four provinces of Pakistan
is different. For future, study can be focus on the provincial level to attain
comprehensive impact of economic growth on CO2 emissions which will provide new
insights for policy making authorities for controlling environmental degradation at
provincial level.
22
References
Agenor, P. R., 2003. Does globalization hurt the poor? World Bank Policy Research,
Working Paper, No. 2922, Washington.
AkbostancI, E., Türüt-AsIk, S., Ipek., T. G, 2009. The relationship between income
and environment in Turkey: is there an environmental Kuznets curve? Energy Policy
37, 861-867.
Altinay, G., Karagol., G, 2004. Structural break, unit root and causality between
energy consumption and GDP in Turkey. Energy Economics 26, 985-994.
Ang, B. W., Liu, F. L., 2001. A new energy decomposition method: perfect in
decomposition and consistent in Aggregation. Energy 26, 537-548.
Ang, J. B., 2007. CO2 emissions, energy consumption, and output in France. Energy
Policy 35, 4772-4778.
Ang, J. B., 2008. Economic development, pollutant emissions and energy
consumption in Malaysia. Journal of Policy Modeling 30, 271-278.
Antweiler, W., Copeland, R. B., Taylor, M.S., 2001. Is free trade good for the
emissions: 1950-2050. The Review of Economics and Statistics 80, 15-27.
Apergis, N., Payne, J. E., 2010. Energy consumption and economic growth: evidence
from the commonwealth of independent states. Energy Economics 31, 641-647.
Apergis, N., Payne, J. E., 2010. The emissions, energy consumption, and growth
nexus: evidence from the commonwealth of independent states. Energy Policy 38,
650-655.
Aqeel, A., Butt, M. S., 2001. The relationship between energy consumption and
economic growth in Pakistan. Asia Pacific Development Journal 8, 101-110.
23
Asafu-Adjaye, J., 2000. The relationship between energy consumption, energy prices
and economic growth: time series evidence from Asian Developing Countries. Energy
Economics, 22, 615-625.
Cameron, S., 1994. A review of the econometric evidence on the effects of capital
punishment. Journal of Socio-economics 23, 197-214.
Chandran, V. G. R., Sharma, S., Madhavan, K., 2009. Electricity consumption–
growth nexus: The case of Malaysia. Energy Policy 38, 606-612.
Chaudhuri, S., Pfaff, A., 2002. Economic Growth and the Environment: What Can We
Learn from Household Data? Working Paper, Columbia University, USA.
Coondoo, D., Dinda, S., 2008. The carbon dioxide emission and income: a temporal
analysis of cross-country distributional patterns. Ecological Economics 65, 375-385.
Copeland, B. R., Taylor, M. S., 2005. Free trade and global warming: a trade theory
view of the Kyoto Protocol. Journal of Environmental Economics and Management
49, 205-234.
Copeland, B., Taylor, M. S., 2001. International trade and the environment: a
framework for analysis, NBER Working Paper, No. 8540, Washington.
Dhakal, S., 2009. Urban energy use and carbon emissions from cities in China and
policy implications. Energy Policy 37, 4208-4219.
Dinda, S., Coondoo, D., 2006. Income and emission: a panel data-based cointegration
analysis. Ecological Economics 57, 167-181.
Ehrlich, I., 1975. The deterrent effect of capital punishment – a question of life and
death. American Economic Review 65, 397-417.
Ehrlich, I., 1996. Crime, punishment and the market for offences. Journal of
Economic Perspectives 10, 43-67.

24
Engle, R. F., Granger, C. W. J., 1987. Cointegration and error correction
representation: estimation and testing. Econometrica 55, 251-276.
Feridun, M., Ayadi, F. S., Balouga, J., 2006. Impact of trade liberalization on the
environment in developing countries: The case of Nigeria. Journal of Developing
Societies 22, 39-56.
Fodha, M., Zaghdoud, O., 2010. Economic growth and pollutant emissions in Tunisia:
an empirical analysis of the environmental Kuznets curve. Energy Policy 38, 1150-
1156.
Friedl, B., Getzner, M., 2003. Determinants of CO2 emissions in a small open
economy. Ecological Economics 45, 133-148.
Ghosh, S., 2010. Examining carbon emissions-economic growth nexus for India: a
multivariate cointegration approach. Energy Policy 38, 2613-3130.
Grossman, G. M., Helpman, E., 1995. The politics of free-trade agreements. American
Economic Review 85, 667-690.
Grossman, G. M., Krueger, A. B., 1991. Environmental impacts of a North American
Free Trade Agreement, NBER Working Paper, No. 3914, Washington.
Grossman, G. M., Krueger, A. B., 1993. Environmental impacts of a North American
Free Trade Agreement. The Mexico-U.S. Free Trade Agreement”, edited by P. Garber.
Cambridge, MA: MIT Press.
Halicioglu, F., 2009. An econometric study of CO2 emissions, energy consumption,
income and foreign trade in Turkey. Energy Policy 37, 1156-1164.
Hamilton, C., Turton, H., 2002. Determinants of emissions growth in OECD
countries. Energy Policy 30, 63-71.
Haug, A., 2002. Temporal aggregation and the power of cointegration tests: a monte
carlo study. Oxford Bulletin of Economics and Statistics 64, 399-412.
25
He, J., 2008. China's industrial SO2 emissions and its economic determinants: EKC's
reduced vs. structural model and the role of international trade. Environment and
Development Economics 14, 227-262.
Heckscher, E., 1919. The effect of foreign trade on the distribution of income.
Ekonomisk Tidskriff, 497-512. Translated as chapter 13 in American Economic
Association.
Heil, M. T., Selden, T. M., 1999. Panel stationarity with structural breaks: carbon
emissions and GDP. Applied Economics Letters 6, 223-225.
Helpman, E., 1998. Explaining the structure of foreign trade: where do we stand?
Review of World Economics 134, 573-589.
Jalil, A., Mahmud, S., 2009. Environment Kuznets curve for CO2 emissions: a
cointegration analysis for China. Energy Policy 37, 5167-5172.
Johansen, S., Juselius, K., 1990. Maximum likelihood estimation and inference on
cointegration with applications to the demand for money. Oxford Bulletin of
Economics and Statistics 52, 169-210.
Jorgenson, D. W., Wilcoxen, P. J., 1993. Reducing U.S. carbon dioxide emissions: an
assessment of different instruments. Journal of Policy Modeling 15, 491-520.
Khalil, S., Inam, Z., 2006. Is trade good for environment? a unit root cointegration
analysis? The Pakistan Development Review 45, 1187-1196.
Kraft, J., Kraft, A., 1978. On the relationship between energy and GNP. Journal of
Energy Development 3, 401-403.
Laurenceson, J., Chai, J. C. H., 2003. Financial reforms and economic development in
China. Cheltenham, UK, Edward Elgar.
Lean, H. H., Smyth, R., 2010. CO2 emissions, electricity consumption and output in
ASEAN. Applied Energy 87, 1858-1864.
26
Lee, C-C., Lee, J-D., 2009. Income and CO2 emissions: evidence from panel unit root
and cointegration tests. Energy Policy 37, 413-423.
Liu, Q., 2005. Impacts of oil price fluctuation to China economy. Quantitative and
Technical Economics (3), 17-28.
Lucas, G., Wheeler, N., Hettige, R., 1992. The Inflexion Point of Manufacture
Industries: International trade and environment, World Bank Discussion Paper, No.
148, Washington.
Machado, G. V., 2000. Energy use, CO2 emissions and foreign trade: an IO approach
applied to the Brazilian case. Thirteenth International Conference on Input–Output
Techniques, Macerata, Italy (2000) 21-25 Aug.
Maddison, D., Rehdanz, K., 2008. Carbon emissions and economic growth:
homogeneous causality in heterogeneous panels. Kiel Working Papers, No: 1437, Kiel
Institute for the World Economy.
Managi, S., Hibiki, A., Tetsuya, T., 2008. Does trade liberalization reduce pollution
emissions? Discussion papers 08013, Research Institute of Economy, Trade and
Industry (RIETI).
Masih, A. M. M., Masih, R., 1997. On temporal causal relationship between energy
consumption, real income and prices: some new evidence from Asian energy
dependent NICs based on a multivariate cointegration vector error correction
approach. Journal of Policy Modeling 19, 417-440.
McCarney, G., Adamowicz, V., 2006. The effects of trade liberalization of the
environment: an empirical study. International Association of Agricultural
Economists, 2006 Annual Meeting, August 12-18, 2006, Queensland, Australia.
27
Mongelli, I., Tassielli, G., Notarnicola, B., 2006. Global warming agreements,
international trade and energy/carbon embodiments: an input-output approach to the
Italian case. Energy Policy 34, 88–100.
Narayan, P. K., 2005. The saving and investment nexus for China: evidence from co-
integration tests. Applied Economics 37, 1979-1990.
Narayan, P. K., Narayan, S., 2010. Carbon dioxide emissions and economic growth:
panel data evidence from developing countries. Energy Policy 38, 661-666.
Narayan, P.K., Singh, B., 2007. The electricity consumption and GDP nexus for the
Fiji islands. Energy Economics 29, 1141-1150.
Narayan, P.K., Smyth, R., 2009. Multivariate granger causality between electricity
consumption, exports and GDP: evidence from a panel of Middle Eastern countries.
Energy Policy 37, 229-236.
Nohman, A., Antrobus, G., 2005. Trade and the environmental Kuznets curve: is
Southern Africa a pollution heaven? South African Journal of Economics 73, 803-814.
Odhiambo, N. M., 2009. Energy consumption and economic growth nexus in
Tanzania: an ARDL bounds testing approach. Energy Policy 37, 617-622.
Ohlin, B., (1933). Interregional and International Trade. Cambridge, Mass: Harvard.
Pesaran, M. H., Shin, Y., 1999. An autoregressive distributed lag modeling approach
to cointegration analysis. Chapter 11 in Econometrics and Economic Theory in the
20th Century: The Ragnar Frisch Centennial Symposium, Strom S (ed.). Cambridge
University Press: Cambridge.
Pesaran, M. H., Shin, Y., Smith, R. J., 2001. Bounds testing approaches to the analysis
of level relationships. Journal of Applied Econometrics 16, 289-326.
Phillips, P. C. B., Hansen, B. E., 1990. Statistical inference in instrumental variables
regression with I(1) processes. Review of Economic Studies 57, 99-125.

28
Reynolds, D. B., Kolodziej, M., 2008. Former Soviet Union oil production and GDP
decline: granger causality and the multi-cycle Hubbert curve. Energy Economics 30,
271-289.
Runge, C.F., 1994. Freer trade, protected environment: balancing trade liberalization
with environmental interests. Council on Foreign Relations Books.
Say, N.P., M, Yucel., 2006. Energy consumption and CO2 emissions in Turkey:
empirical analysis and future projection based on an economic growth. Energy Policy
34, 3870-3876.
Schmalensee, R., Stoker, T. M., Judson, R. A., 1998. World carbon dioxide emissions:
1950-2050. The Review of Economics and Statistics 80, 15-27.
Shiyi, C., 2009. Engine or drag: can high energy consumption and CO2 emission
derive the sustainable development of Chinese industry. Frontiers of Economic in
China 4(4), 548-571.
Song, T., Zheng, T., Tong, L., 2008. An empirical test of the environmental Kuznets
curve in China: a panel cointegration approach. China Economic Review 19, 381-392.
Soytas, U., Sari, U., Ewing, B. T., 2007. Energy consumption, income and carbon
emissions in the United States. Ecological Economics 62, 482-489.
Sqauli, J., 2007. Electricity consumption and economic growth: bounds and causality
analyses of OPEC members. Energy Economics 29, 1192-1205.
Stern, D. I., 2004. The rise and fall of the environmental Kuznets curve. World
Development 32, 1419-1439.
Suri, V., Chapman, D., 1998. Economic growth, trade and the energy: implications for
the environmental Kuznets curve. Ecological Economics 25, 195-208.
Turner, P., 2006. Response surfaces for an F-test for cointegration. Applied
Economics Letters 13, 479-482.
29
Wolde-Rufael, Y., 2009. Electricity consumption and economic growth: a time series
experience for 17 African countries, Energy Policy 34, 1106-1114.
Wyckoff, A. W., Roop, J. M., 1994. The embodiment of carbon in imports of
manufactured products: implications for international agreements on greenhouse gas
emissions. Energy Policy 22, 187-194.
Xepapadeas, A., 2005. Regulation and evolution of compliance in common pool
resources. Scandinavian Journal of Economics 107, 583-599.
Yoo, S-H., Kwak, S-Y., 2010. Electricity consumption and economic growth in seven
South American countries. Energy Policy 38, 181-188.
Yuan, J., Zhao, C.., Yu, S., Hu, Z., 2007. Electricity consumption and economic
growth in China: cointegration and co-feature collection. Energy Economics 29, 1179-
1191.
Economic Survey of Pakistan (2008-09), publishes by Finance Ministry of Pakistan,
Islamabad, Pakistan
Zhang, X. P., Cheng, X-M., 2009. Energy consumption, carbon emissions and
economic growth in China. Ecological Economics 68, 2706-2712.