Embed Size (px)
Citation preview

Pinellas Environmental Restoration Project
Dewatering Evaluation Reportfor Road Construction andWater Line ReplacementAlong Bryan Dairy and Belcher Roads
June 2008
Office ofLegacy Management
LMS/PIN/N01113
Work Performed Under DOE Contract No.for the U.S. Department of Energy Office of Legacy Management.
DE–AM01–07LM00060
Approved for public release; distribution is unlimited.
Office of Legacy ManagementOffice of Legacy ManagementOffice of Legacy ManagementU.S. Department
of Energy

This page intentionally left blank

LMS/PIN/N01113
Pinellas Environmental Restoration Project
Dewatering Evaluation Report for Road Construction and Water Line Replacement
Along Bryan Dairy and Belcher Roads
June 2008

This page intentionally left blank

U.S. Department of Energy Dewatering Evaluation Report for Road Const. & Water Line Replacement June 2008 Doc. No. N0111300 Page iii
Contents Acronyms and Abbreviations ....................................................................................................... vii Executive Summary....................................................................................................................... ix 1.0 Problem Identification............................................................................................................1 2.0 Background ............................................................................................................................1
2.1 Bryan Dairy Road Construction ...................................................................................1 2.2 Belcher Road Water Line Replacement .......................................................................2 2.3 Building 100 Contaminant Plume ................................................................................3
3.0 Identification of Potential Impacts and Solutions ..................................................................4 3.1 Identification of Potential Impacts of Dewatering........................................................4 3.2 Options to Alleviate Impacts of Dewatering ................................................................5
3.2.1 Option 1: No Action; County Contractor Installs and Operates the System and Manages the Effluent Without DOE Involvement......................................5
3.2.2 Option 2: County Contractor Installs and Operates the System, and DOE Monitors Effluent Discharge to Storm Sewer to Ensure Compliance with Storm Sewer Discharge Criteria ........................................................................5
3.2.3 Option 3: County Contractor Installs and Operates the System and DOE Manages the Effluent .........................................................................................5
3.2.4 Option 4: DOE Installs the System and Manages the Effluent and County Contractor Operates the System.........................................................................6
3.2.5 Option 5: DOE Installs and Operates the System and Manages the Effluent....6 4.0 Groundwater Modeling of Construction Dewatering.............................................................6
4.1 Short-Term Construction Control.................................................................................7 4.2 Numerical Modeling.....................................................................................................7
4.2.1 Dewatering at Drainage Structures S-66 and S-67 North of Bryan Dairy Road ..............................................................................................7
4.2.2 Dewatering at Drainage Structure S-75 North of Bryan Dairy Road ................9 4.2.3 Dewatering North of Bryan Dairy Road for Drain Pipe Installation .................9 4.2.4 Dewatering Between Structures S-70 and S-73 South of Bryan Dairy Road..10 4.2.5 Dewatering Between Drainage Structures S-208 and S-209 West of
Belcher Road....................................................................................................11 4.2.6 Dewatering to Accommodate Drain Pipe Installation West of Belcher Road.12 4.2.7 Dewatering at Drainage Structure S-210 East of Belcher Road ......................12 4.2.8 Dewatering East of Belcher Road to Accommodate Drain Pipe Installation ..13
4.3 Modeling Summary ....................................................................................................13 5.0 Risk Assessment...................................................................................................................14
5.1 Worker Exposure Risk................................................................................................14 5.2 Loss of Plume Control ................................................................................................15 5.3 Improper Management of Contaminated Water .........................................................16 5.4 DOE Liability Risk Management ...............................................................................17
6.0 Dewatering System Options Evaluation ..............................................................................17 6.1 Construction Dewatering ............................................................................................17
6.1.1 Well-point Dewatering Method .......................................................................17 6.1.2 Well-point System Layout Evaluated ..............................................................18 6.1.3 Dewatering Transmission Lines ......................................................................19

Dewatering Evaluation Report for Road Const. & Water Line Replacement U.S. Department of Energy Doc. No. N0111300 June 2008 Page iv
6.1.4 Groundwater Management...............................................................................19 6.1.5 Regulatory Compliance/FDEP Issues..............................................................21 6.1.6 Health and Safety Issues ..................................................................................23
6.2 Option 1: No Action⎯County Contractor Installs and Operates the System and Manages the Effluent Without DOE Involvement .....................................................24
6.3 Option 2: County Contractor Installs and Operates the System, and DOE Monitors Effluent Discharge to Storm Sewer to Ensure Compliance with Storm Sewer Discharge Criteria............................................................................................25 6.3.1 Construction Implementation...........................................................................25 6.3.2 Operations Implementation..............................................................................25 6.3.3 Project Schedule...............................................................................................25
6.4 Option 3: County Contractor Installs and Operates the System, and DOE Manages the Effluent..................................................................................................26 6.4.1 Construction Implementation...........................................................................26 6.4.2 Operations Implementation..............................................................................26 6.4.3 Operations Cost Estimate.................................................................................26 6.4.4 Project Schedule...............................................................................................26
6.5 Option 4: DOE Installs the System and Manages the Effluent, and the County Contractor Operates the System .................................................................................27 6.5.1 Construction Implementation...........................................................................28 6.5.2 Operations Implementation..............................................................................28 6.5.3 Project Schedule...............................................................................................28
6.6 Option 5: DOE Installs and Manages the System and the Effluent............................28 6.6.1 Construction Implementation...........................................................................28 6.6.2 Operations Implementation..............................................................................29 6.6.3 Project Schedule...............................................................................................29
7.0 Summary and Conclusions...................................................................................................31 8.0 References ............................................................................................................................31
Figures Figure 1. Water Line Locations Under Belcher Road ................................................................. 32 Figure 2. Vinyl Chloride Plume at the Building 100 Area .......................................................... 33 Figure 3. Cross Section Showing Vinyl Chloride Concentrations Along the Southern
Property Boundary ....................................................................................................... 34 Figure 4. Cross Section Showing Vinyl Chloride Concentrations Along the Eastern Property
Boundary ...................................................................................................................... 35 Figure 5. Cross Section Showing Vinyl Chloride Concentrations Along the Southern Plume... 36 Figure 6. Cross Section Showing Vinyl Chloride Concentrations Along the Eastern Plume ..... 37 Figure 7. Site-scale View of Model-computed Steady-state Water Levels (ft amsl) due to
Dewatering at Structures S-66 and S-67 North of Bryan Dairy Road ......................... 38 Figure 8. Close-up View of Model-computed Steady-state Water Levels (ft amsl) in Layer 1
due to Dewatering at Structures S-66 and S-67 North of Bryan Dairy Road .............. 39 Figure 9. Close-up View of Model-computed Steady-state Water Levels (ft amsl) in Layer 2
due to Dewatering at Structures S-66 and S-67 North of Bryan Dairy Road .............. 40 Figure 10. Typical Well Point........................................................................................................ 41 Figure 11. Typical Header Pipe and Well Point Installation ......................................................... 41

U.S. Department of Energy Dewatering Evaluation Report for Road Const. & Water Line Replacement June 2008 Doc. No. N0111300 Page v
Figure 12. Overlapping Cone of Depression from Well Points..................................................... 42 Figure 13. Schematic of Dewatering System................................................................................. 43 Figure 14. Option 3 Schedule ........................................................................................................ 45 Figure 15. Option 5 Schedule ........................................................................................................ 46
Tables Table 1. Results for COPCs Detected in the Monitoring Wells Located On-Site Near the
Property Boundary and Off-Site Monitoring Wells. .................................................... 47 Table 2. Summary of Modeling Simulations ............................................................................. 49 Table 3. Worker Exposure Calculations for Groundwater Ingestion ......................................... 49 Table 4. Bryan Dairy Road Dewatering Requirements.............................................................. 50 Table 5. Belcher Road Dewatering Requirements ..................................................................... 50 Table 6. Option 3: Construction Cost Estimate Comparison ..................................................... 51 Table 7. Option 3: Operation Cost Estimate Comparison.......................................................... 51 Table 8. Option 3: Construction and Operation Cost Estimate Comparison ............................. 51 Table 9. Option 4: Operation Cost Estimate Comparison.......................................................... 51 Table 10. Option 4: Construction and Operation Cost Estimate Comparison ............................. 51 Table 11. Option 5: Construction Cost Estimate Comparison ..................................................... 52 Table 12. Option 5: Operation Cost Estimate Comparison.......................................................... 52 Table 13. Option 5: Construction and Operation Cost Estimate Comparison ............................. 52 Table 14. Summary of Belcher and Bryan Dairy Road Dewatering Options .............................. 53
Appendixes Appendix A Description of Groundwater Modeling Appendix B Graphical Results of Additional Groundwater Modeling Appendix C Hydrologic Assessment of Dewatering for Installation of the Belcher Road
Water Transmission Line Appendix D Dewatering Cost Estimate
Plates Plate 1 Proposed Dewatering System Schematic Plate 2 Proposed Dewatering Transmission Line

Dewatering Evaluation Report for Road Const. & Water Line Replacement U.S. Department of Energy Doc. No. N0111300 June 2008 Page vi
End of current text
U.S. Department of Energy Dewatering Evaluation Report for Road Const. & Water Line Replacement June 2008 Doc. No. N0111300 Page vii
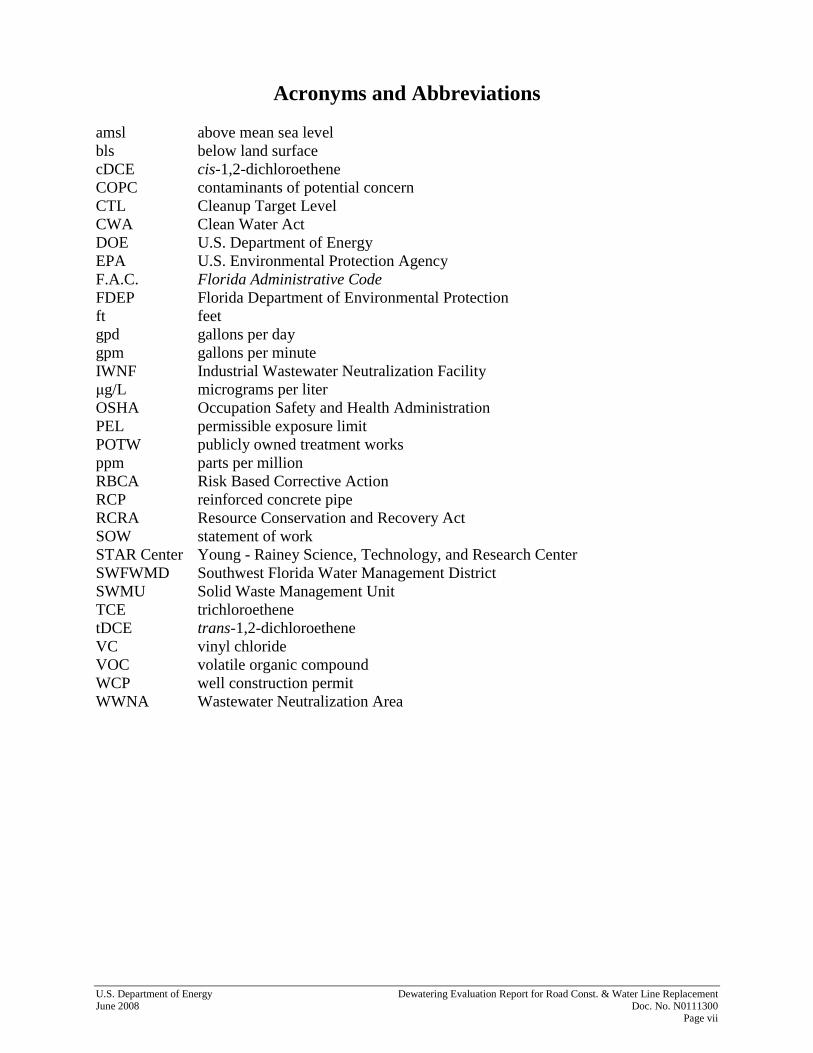
Acronyms and Abbreviations amsl above mean sea level bls below land surface cDCE cis-1,2-dichloroethene COPC contaminants of potential concern CTL Cleanup Target Level CWA Clean Water Act DOE U.S. Department of Energy EPA U.S. Environmental Protection Agency F.A.C. Florida Administrative Code FDEP Florida Department of Environmental Protection ft feet gpd gallons per day gpm gallons per minute IWNF Industrial Wastewater Neutralization Facility μg/L micrograms per liter OSHA Occupation Safety and Health Administration PEL permissible exposure limit POTW publicly owned treatment works ppm parts per million RBCA Risk Based Corrective Action RCP reinforced concrete pipe RCRA Resource Conservation and Recovery Act SOW statement of work STAR Center Young - Rainey Science, Technology, and Research Center SWFWMD Southwest Florida Water Management District SWMU Solid Waste Management Unit TCE trichloroethene tDCE trans-1,2-dichloroethene VC vinyl chloride VOC volatile organic compound WCP well construction permit WWNA Wastewater Neutralization Area

Dewatering Evaluation Report for Road Const. & Water Line Replacement U.S. Department of Energy Doc. No. N0111300 June 2008 Page viii
This page intentionally left blank
U.S. Department of Energy Dewatering Evaluation Report for Road Const. & Water Line Replacement June 2008 Doc. No. N0111300 Page ix
Executive Summary Pinellas County Public Works plans a road construction project to add turn lanes to Belcher and Bryan Dairy Roads at the southeast corner of the Young - Rainey Science, Technology, and Research (STAR) Center. This project will include installation of new storm water drains, associated piping, and other subsurface infrastructure. Groundwater is generally encountered no more than 5 feet below land surface, so dewatering of the surficial aquifer prior to the start of construction activities will be required mainly at shallow depths but with deeper dewatering at a few locations. The plume of dissolved contaminants at the Building 100 Area at the southeast corner of the STAR Center extends into the area that will be dewatered along Bryan Dairy Road and near the area along Belcher Road. The purpose of this report is to evaluate these dewatering activities to determine the potential impacts of the contaminant plume to worker health and water disposal issues and to determine the impact of the dewatering activities on the stability of the contaminant plume. This road construction work, originally scheduled to start in the fall of 2008, has recently been delayed until the fall of 2009. The U.S. Department of Energy (DOE) has recently learned that Pinellas County Utilities plans to replace the 48-inch water line that runs under Belcher Road adjacent to the STAR Center, beginning as early as October 2008. This work will also require dewatering during construction activities, similar to the dewatering associated with the road construction. Therefore, this report also evaluates the water line replacement activities relative to the contaminant plume. Five options were identified to provide different ways of dealing with the uncertainty of what contaminant concentrations will be in the recovered groundwater, and these options are evaluated in detail in this document. This report does not recommend a particular dewatering option; the options are provided so that DOE can make a decision based on an acceptable level of risk.

Dewatering Evaluation Report for Road Const. & Water Line Replacement U.S. Department of Energy Doc. No. N0111300 June 2008 Page x
End of current text

U.S. Department of Energy Dewatering Evaluation Report for Road Const. & Water Line Replacement June 2008 Doc. No. N0111300 Page 1
1.0 Problem Identification The U.S. Department of Energy (DOE) Office of Legacy Management formerly owned and operated the facility now known as the Young - Rainey Science, Technology, and Research (STAR) Center in Largo, Florida. Building 100, located at the corner of Belcher Road and Bryan Dairy Road, housed administration offices and a major portion of the industrial activities at the site. As a result of past DOE operations at Building 100 between the 1950s and the 1990s, a chemical contaminant plume is present in the groundwater beneath Building 100 and extending to the eastern and southern property boundaries near this roadway intersection. DOE recently learned that the Pinellas County Public Works Transportation Engineering Division is planning road construction at the intersection that has the potential to impact, or be impacted by, the contaminated groundwater. Specifically, dewatering activities associated with the construction may draw contaminated groundwater into the construction area, and construction workers may be exposed to contaminated water or vapor. This document has been written to evaluate these potential impacts and to determine the options to alleviate the impacts, if necessary. First, the potential impacts associated with road construction activities are identified, followed by identification of the various options for alleviating the impacts (Section 3). Groundwater modeling, a risk evaluation, and an engineering design and cost estimate are then used to evaluate the options (Sections 4, 5, and 6). Section 7 is a summary of the results of the evaluation process. Evaluating the options for long-term plume containment is not within the scope of this document. However, the potential for long-term groundwater pumping will be considered during the design of the short-term shallow groundwater pumping system. For example, the piping used to transfer water from the potential short-term construction dewatering system to the disposal area at the wastewater neutralization facility will be designed such that it could accommodate water from a hypothetical long-term pumping system.
2.0 Background Section 2.1 describes Pinellas County’s road construction activities, Section 2.2 describes the Belcher Road water line replacement activity, and Section 2.3 describes the contaminant plume in the vicinity of those activities. 2.1 Bryan Dairy Road Construction Pinellas County has plans underway to make improvements to Bryan Dairy Road and Belcher Road adjacent to the STAR Center. The project is referred to as “Bryan Dairy Road, Starkey Road to 72nd Street North, P. I. D. No. 920588.” The improvements will consist of widening the road and adding turning lanes and acceleration lanes at the intersection of Bryan Dairy Road and Belcher Road. The improvements for Bryan Dairy Road will commence at Starkey Road and continue east to 72nd Street North. Improvements on Belcher Road will commence 1,400 feet (ft) south of the intersection and continue to approximately 2,000 ft north of the intersection.

Dewatering Evaluation Report for Road Const. & Water Line Replacement U.S. Department of Energy Doc. No. N0111300 June 2008 Page 2
The Pinellas County Public Works (Clearwater, Florida) is administering work on the project. The county will prepare construction plans and specifications, and it will publicly advertise for construction of the project. Construction is expected to start in the fall of 2009, and the entire project will be completed in 2 years. The work in the vicinity of the STAR Center will last approximately 4 to 5 months. Construction areas sequencing is unknown, since the county does not dictate this to the contractor, but rather allows the contractor to present a schedule that shows which road areas and which sides will be constructed in sequence. It is anticipated that only one side of a road will be constructed at once to allow traffic flowing in both directions to be detoured to the opposite side of the street from where the work will be done. This traffic side sequencing breaks the areas of concern into four distinct areas: Bryan Dairy Road⎯north and south sides, and Belcher Road⎯east and west sides. As part of the road improvements, changes and modifications will need to be made to the road infrastructure. Existing storm-drain catch basins along the road will need to be removed and new ones constructed farther along the new road edge. Either associated storm-drain piping will be extended from the existing storm piping, or new storm-drain piping will be installed. Because storm-drain structures operate on gravity flow, the structures will be placed 5 to 7 ft below land surface (bls). As part of the new road widening, a drainage trench will be installed that parallels the road and protects the road’s structural base from a high water table. The drainage trench also works on gravity, but is shallower, with depths ranging from 2 to 4 ft. Several utility lines, including fiber-optic, telephone, and gas lines, will need to be adjusted to accommodate the changes in road infrastructure, but these utilities are typically located at shallow depths. The addition of traffic-control light masts is also included in the improvements. The mast foundations will be concrete and placed in augered holes 22 ft into the ground. The roadway structure will consist of new subgrade, base course, and asphalt surfacing, none of which will extend below the top 2 ft of the ground surface. Pinellas County construction specifications require that road infrastructure be constructed on dry soil. Because many of the infrastructure items mentioned above will be constructed at depths below the water table, dewatering will be required. The specifications do not stipulate a dewatering method; that detail is left to the construction contractor to determine and manage. Typically, one of two methods is used, either a sump method or a well point method. With the sump method, a sump is excavated adjacent to and deeper than the construction excavation. A trash pump is placed in the sump and water is pumped out, thereby lowering the water table adjacent to the construction work. With the well point method, well points are installed adjacent to the excavation and plumbed to a header pipe to which a vacuum pump is connected. The vacuum from the pump lifts water from wells, forces it into the header pipe, and discharges it through the pump. Section 5.1 provides a detailed description of well-point dewatering systems. In both cases, water is usually discharged to an adjacent storm drain. 2.2 Belcher Road Water Line Replacement As a separate project from the road construction activities, Pinellas County Utilities has plans underway to replace an existing 48-inch buried water line with a new 42-inch water line. The existing water line is located in the Belcher Road roadway, and the new one will parallel it
U.S. Department of Energy Dewatering Evaluation Report for Road Const. & Water Line Replacement June 2008 Doc. No. N0111300 Page 3
(Figure 1). The water line replacement will commence approximately 2 miles north of the STAR Center and extend to the Bryan Dairy Road area. The Pinellas County Utilities (Clearwater, Florida) is administering work on the project. The county will prepare construction plans and specifications, and it will publicly advertise for construction of the project. Construction is expected to start in October 2008, but it is not known whether the work will commence at the north end or the south end. Dewatering concerns for this work will be similar to those of the roadway construction work and are addressed in Appendix C. 2.3 Building 100 Contaminant Plume The source of contamination under Building 100 is leaks from unknown locations along chemical drain lines that were located beneath the building’s foundation and from releases from a drum storage pad at the northwest corner of the building. Use of the drum storage pad ceased in 1983 when it was removed, and the known drain leaks occurred in the 1970s and 1980s. Based on the measurement of elevated contaminant concentrations in groundwater, the contaminants released into the subsurface were trichloroethene (TCE), cis-1,2-dichloroethene (cDCE), and possibly trans-1,2-dichloroethene (tDCE). The contaminants of potential concern (COPCs) for groundwater at the building 100 Area are TCE, cDCE, tDCE, 1,1-dichloroethene, vinyl chloride (VC), and arsenic. However, monitoring over the last couple of years has demonstrated that arsenic is not present in groundwater at concentrations above the cleanup level, and monitoring for arsenic is no longer conducted. Arsenic is not discussed further in this document. While most of the previous documents for the Pinellas site have compared groundwater contaminant concentrations to drinking water standards (i.e., maximum contaminant levels), those standards are not the applicable default Cleanup Target Levels (CTLs) for the purpose of evaluating site remediation under Global Risk Based Corrective Action (RBCA). Based on a comprehensive review of background data for the site (DOE 2003a), it has been determined that aluminum and iron levels in the shallow groundwater in the site vicinity are naturally elevated and far exceed State of Florida Secondary Drinking Water Standards (Chapter 62-550, Florida Administrative Code [F.A.C.]). The ambient shallow groundwater in the area is therefore designated as “poor quality” as defined in 62-780.200 (35), F.A.C. Thus, the applicable groundwater CTLs are those for groundwater of “low yield/poor quality” provided in Table 1 of Chapter 62-777, F.A.C. The CTLS are TCE (30 micrograms per liter [μg/L]), cDCE (700 μg/L), tDCE (1,000 μg/L), 1,1-dichloroethene (70 μg/L), and VC (10 μg/L). Numerous monitoring wells located east and south of Building 100 have been used to monitor the contaminant plume since the early to mid-1990s. During October and December 2007, DOE installed 21 new monitoring wells along the southern and eastern property boundaries (Figure 2) to further delineate the on-site plume prior to road construction activities. The new wells, identified as PIN12–0529 through –0549, consist of 1-inch–diameter, pre-packed units that were installed using direct-push technology. The wells were installed in sets of three, with the three wells screened at depths of 10 to 20 ft bls, 20 to 30 ft bls, and 30 to 40 ft bls, providing observation of the entire saturated thickness of the surficial aquifer. These wells are located approximately 5 ft inside the STAR Center property boundary.
Dewatering Evaluation Report for Road Const. & Water Line Replacement U.S. Department of Energy Doc. No. N0111300 June 2008 Page 4
Analytical results for samples collected from these new wells indicated that the contaminant plume could have moved off site, so nine wells were installed off site in the county road right-of-way during February 2008. The nine new wells are PIN12−0550-1, -2, and -3 (located south of Bryan Dairy Road); PIN12−0551-1, -2, -3; and PIN12−0552-1, -2, and -3 (Figure 2). Analytical results for on-site monitoring wells located near the property boundary, and off-site wells are listed in Table 1. Figure 2 is a map showing the VC plume at the southeast corner of the Building 100 Area. The VC plume is defined by the most recent data from the existing wells as of March 2008. The inferred plume boundary is defined by the 10 μg/L CTL; wells containing VC concentrations greater than 10 μg/L are within the plume, and wells containing VC concentrations less than 10 μg/L are outside the plume. VC is the most mobile contaminant and has the lowest CTL, and therefore has the largest plume extent, so plume maps for the other contaminants are not shown. The depth of contamination in the plume is important to the evaluation presented in this document. Figure 3 and Figure 4 are cross sections along the southern and eastern property boundaries showing the VC concentrations in the new monitoring wells and some older monitoring wells. Figure 5 and Figure 6 are cross sections that start adjacent to Building 100 and extend roughly along the direction of plume movement to the off-site wells. For the plume south of Building 100, the shallowest on-site contamination is located at 18−28 ft bls in well PIN12-S68C, but off site south of Bryan Dairy Road, well PIN12−0552-1 contains VC at 13 μg/L in the 9−19 ft bls interval. For the plume east of Building 100, the shallowest contamination is 13 μg/L in well PIN12−S70B; however, the plume is below 20 ft bls in all the other wells in this area. In addition, the plume was not detected off site east of Building 100.
3.0 Identification of Potential Impacts and Solutions 3.1 Identification of Potential Impacts of Dewatering Because groundwater at the Building 100 area is known to be contaminated both on site and off site, there is a concern that workers could be exposed to contamination during both construction and operation of the dewatering system. Water recovered during the dewatering operation has a possibility of being contaminated, though it is not possible to estimate what those contaminant concentrations might be based on available data. Therefore, actual treatment and/or disposal requirements for the recovered groundwater are not known. There is also a possibility that an improperly designed dewatering well network could result in loss of plume control or in further plume movement off site. Typical dewatering operations for road construction activities consist of the installation of a number of well points adjacent to the construction zone with appropriate depths and lateral spacing to dewater the project area. Well-point installation would not involve any water-generating activities. Well points would be driven to the desired depths and linked with tubing to a vacuum pump. Water would be pumped and discharged directly to a nearby storm sewer for the duration of the project. No monitoring of the work area would typically be conducted, and no personal protective equipment would be used. Site workers could come into

U.S. Department of Energy Dewatering Evaluation Report for Road Const. & Water Line Replacement June 2008 Doc. No. N0111300 Page 5
casual contact with the pumped water during operation if there were temporary leaks or other minor problems with the system, but construction and operation activities would not result in prolonged exposures. Workers could be exposed to groundwater in excavated areas that have not been completely dewatered or where pumping has ceased; this water would be open to the air. 3.2 Options to Alleviate Impacts of Dewatering DOE has several options regarding responsibilities it can assume for activities required for road construction. As described below, these options range from having no involvement to having complete control of construction, operation, and management. 3.2.1 Option 1: No Action; County Contractor Installs and Operates the System and
Manages the Effluent Without DOE Involvement DOE may choose to forgo any involvement with dewatering, in which case Pinellas County’s contractor would perform these activities in the vicinity of the STAR Center similar to the manner described above (Section 3.1). No monitoring of recovered groundwater would be conducted, so concentrations of contaminants would be unknown. It would not be possible to determine what worker exposures occurred or whether recovered groundwater was properly disposed of. The effect of the dewatering system on plume movement would not be known until some time after construction work was completed. 3.2.2 Option 2: County Contractor Installs and Operates the System, and DOE Monitors
Effluent Discharge to Storm Sewer to Ensure Compliance with Storm Sewer Discharge Criteria
Under this option, the Pinellas County contractor would install and operate the dewatering system. DOE would conduct appropriate monitoring of effluent to determine if water could be properly disposed of in the storm sewer or if treatment at the STAR Center’s Industrial Wastewater Neutralization Facility (IWNF) is necessary. This would require that effluent be temporarily contained until analytical results are obtained and a determination made regarding the proper means of disposal. Besides ensuring proper disposal of groundwater, monitoring data could be used to determine contaminant concentrations to which workers were potentially exposed. Though the assumption would be that recovered groundwater meets criteria for disposal in the storm sewer system, a contingency plan would be in place in the event that water requires treatment. This would include the installation of a water transmission line from the construction area to an air stripper located at DOE’s temporary effluent accumulation point at the IWNF. The effect of the dewatering system on plume movement would not be known until some time after construction work was completed. 3.2.3 Option 3: County Contractor Installs and Operates the System and DOE Manages
the Effluent In this scenario, the Pinellas County contractor would be responsible for constructing and operating the dewatering system, and DOE would assume responsibility for managing the pumped water. The assumption would be made that water requires treatment. As with Option 2, this option would require DOE to construct a water transmission line from the construction area to the IWNF. When DOE has sent groundwater to the IWNF for treatment in the past, samples
Dewatering Evaluation Report for Road Const. & Water Line Replacement U.S. Department of Energy Doc. No. N0111300 June 2008 Page 6
were collected of effluent both before and after treatment. Samples were collected with greater frequency at the onset of treatment and less frequently after it has been demonstrated that treatment of the groundwater attains disposal criteria. It is assumed that DOE would conduct a similar monitoring program for the construction dewatering project. Data obtained would ensure proper disposal of treated water. Pretreatment monitoring results could be used to determine contaminant concentrations to which workers were potentially exposed. Because it is assumed that water would require treatment, pretreatment results would not be available before treatment occurs. It is possible that water would be treated that already meets disposal criteria. The effect of the dewatering system on plume movement would not be known until some time after construction work was completed. 3.2.4 Option 4: DOE Installs the System and Manages the Effluent and County
Contractor Operates the System In this scenario, DOE would assume responsibility for constructing the dewatering system and managing the discharged water, and the Pinellas County contractor would be responsible for operating the dewatering system. The management and monitoring of the recovered water would mirror the description in Option 3. Data obtained would ensure proper disposal of treated water. Pretreatment monitoring results could be used to determine contaminant concentrations to which workers were potentially exposed. Because it is assumed that water would require treatment, pretreatment results would not be available before treatment occurs. It is possible that water would be treated that already meets disposal criteria. Because DOE would design and construct the system, it would be constructed to control the contaminant plume and prevent further off-site movement as well as meet dewatering objectives. 3.2.5 Option 5: DOE Installs and Operates the System and Manages the Effluent In this scenario, DOE would assume responsibility for all aspects of dewatering, including soliciting a specialty dewatering contractor, constructing and operating the system, and managing the discharged water. This would be similar to Option 4 except that DOE operation of the system would eliminate potential exposures of Pinellas County contractors to contaminated water. This option is presented in detail in Section 6.0.
4.0 Groundwater Modeling of Construction Dewatering In the Building 100 Area, depth to groundwater ranges from about 1 to 5 ft bls, depending on the season and recent rainfall. The surficial aquifer containing the groundwater extends to about 40 ft bls and is bounded below by sediments of the Hawthorn Group (Hawthorn). Because a slight difference exists between water levels measured in monitoring wells screened at shallow and deep intervals, the surficial aquifer is believed to have shallow and deep components. This difference is likely due to vertical hydraulic conductivity that is estimated to be one-tenth of the horizontal hydraulic conductivity. The division between the shallow and deep portions of the aquifer is generally described as being about 15 to 20 ft bls. Under ambient conditions, groundwater in the shallow surficial aquifer travels an estimated 6 ft per year, and groundwater in the deeper surficial aquifer is estimated to travel at about half that velocity.

U.S. Department of Energy Dewatering Evaluation Report for Road Const. & Water Line Replacement June 2008 Doc. No. N0111300 Page 7
4.1 Short-Term Construction Control A numerical model is used to evaluate the effects of short-term construction dewatering on groundwater flow patterns and the transport of contaminants in the Building 100 Area. Multiple runs are made with the model to examine groundwater drawdowns and velocities produced by dewatering operations on STAR Center property near the intersection of Belcher and Bryan Dairy roads. The model simulations provide information on the well spacing that will be needed to successfully dewater construction trenches, both at the STAR Center and on the opposite sides of the two roads. 4.2 Numerical Modeling The model consists of two layers. The uppermost layer (Layer 1) represents the shallow surficial aquifer, where dewatering would occur. The underlying layer (Layer 2) represents the deep surficial aquifer. It is important to account for flow in both zones because contamination in the vicinity of Belcher Road and Bryan Dairy Road is located mostly within the deeper layer. Thus, the flow modeling provides an opportunity to gauge the potential for contamination to migrate upward into Layer 1 in response to the dewatering. In addition to accounting for seepage between layers, the possible infiltration of water from South Pond as a result of the dewatering is included in the model. The methods used to simulate this infiltration and other model features are described in more detail in Appendix A. The following sections describe the simulations of different dewatering operations that will likely be performed in the vicinity of Bryan Dairy Road and Belcher Road during the road construction. Though actual operations may differ somewhat from the scenarios presented here, the results of the simulations are sufficient for estimating the effects of any alternative dewatering actions. In all of the simulations, it is assumed that the ambient groundwater elevation in the vicinity of the dewatering is about 13.5 ft above mean sea level (amsl), which is the long-term average groundwater elevation in this part of the STAR Center. Land surface elevation near the intersection of the two roads ranges between 17 and 18 ft amsl. Graphical depictions of computed groundwater levels for one of the simulations are included in this chapter. Appendix B contains the graphical results of the additional simulations. Table 2 summarizes the estimated pumping rates associated with each simulation. 4.2.1 Dewatering at Drainage Structures S-66 and S-67 North of Bryan Dairy Road This simulation examines the well-point spacing and pumping rates that would likely be required to dewater in the vicinity of two drainage structures—S-66 and S-67—on the north side of Bryan Dairy Road, about 400 to 500 ft west of the STAR Center’s southeast corner. It also accounts for dewatering to accommodate installation of two 18-inch-diameter reinforced concrete pipes (RCPs), each of which will extend about 25 ft south of the respective structures. The invert elevations of both drainage structures and adjoining pipes are about 10 ft amsl. Thus, target groundwater elevations in this instance are 6.5 to 7.5 ft amsl. Assuming the ambient groundwater level in this area is 13.5 ft amsl, these water elevations translate into drawdowns of about 6 to 7 ft.

Dewatering Evaluation Report for Road Const. & Water Line Replacement U.S. Department of Energy Doc. No. N0111300 June 2008 Page 8
Dewatering in the vicinity of the two structures is modeled using a well-point spacing of 5 ft and 8 wells on either side of each structure and its adjoining 18-inch RCP, for a total of 32 wells. The model indicates that the drawdowns and groundwater levels needed for structure installation could be achieved with steady-state pumping rates that range from 0.25 to 0.3 gallons per minute (gpm) per well (Table 2), and a total pumping rate of about 12,000 gallons per day (gpd) (8.3 gpm). These pumping rates are relatively large because the model indicates that dewatering north of Bryan Dairy Road will induce seepage from South Pond, about 30 to 50 ft to the north. Site-scale and close-up views of the steady-state water levels computed for Layer 1 in this model run (Figure 7 and Figure 8, respectively) show groundwater elevations of about 5.5 to 7.5 ft amsl occurring in the vicinity of each structure. Corresponding computed hydraulic heads in Layer 2 of the model are about 11.5 ft amsl (Figure 9), which suggests that the vertical hydraulic gradient beneath the two model layers in the vicinity of the well points will be significant. This modeling suggests that a well spacing of 5 ft in the vicinity of S-66 and S-67 will be adequate to achieve the dewatering required for this part of the construction. It is important to note that, when pumping begins, pumping rates at each well point are expected to be larger than the steady-state rates of 0.25 to 0.3 gpm mentioned above. The model runs of dewatering for structures S-66 and S-67 suggest that local water levels in Layer 1 will begin to stabilize after 3 days of continuous pumping, and that the drawdowns achieved at this time will be large enough to begin construction. Under the assumption that the wells used to dewater in the vicinity of S-66 and S-67 would be pumped continuously for 40 days, reverse particle tracking is used with the steady-state model described above to identify the area likely to contribute water to the wells. This analysis indicates that groundwater in Layer 1 would converge on the pumped areas from all directions, and that water as much as 70 ft north of the wells, beneath South Pond, might be captured. Reverse particle tracking also shows water from as far as 50 ft south of the wells being captured during the 40 days of pumping. It is difficult to tell whether dewatering for structures S-66 and S-67 will lead to the discharge of contaminated water. Available concentration data suggest that virtually all contamination in the immediate vicinity of the structures occurs in Layer 2, below the vertical interval most affected by the pumping. Though some upward flow from Layer 2 will occur in response to the dewatering, it is likely that the concentrations of upward migrating contaminants will be heavily diluted due to significant mixing with uncontaminated Layer 1 water. On the other hand, the recent identification of contamination in Layer 1 to the south of the two structures and on the south side of Bryan Dairy Road suggests that some shallow contamination may possibly be drawn into the dewatering wells. Nonetheless, mixing of local uncontaminated water with contaminated water from the south is likely to significantly dilute any contamination collectively discharged from the wells. Large uncertainties for the numerous parameters affecting the relative mixing of uncontaminated and contaminated water makes it impossible predict the degree of dilution that will occur. Very rough, conservatively large estimates of possible cDCE and VC concentrations in the dewatering discharge are provided in Table 2. These estimates are based on the assumption that recently observed concentrations of these constituents at wells relatively close to the dewatering system will be diluted by a factor of 3.
U.S. Department of Energy Dewatering Evaluation Report for Road Const. & Water Line Replacement June 2008 Doc. No. N0111300 Page 9
4.2.2 Dewatering at Drainage Structure S-75 North of Bryan Dairy Road An additional simulation for the area north of Bryan Dairy Road examines dewatering to install drainage structure S-75, located about 60 ft west of Belcher Road. As with structures S-66 and S-67, about 2 ft of an 18-inch-diameter RCP will extend south of S-75. The invert elevations of the structure and the pipe are each about 12 ft amsl. Thus, target groundwater elevations during the dewatering at this location are about 8.5 to 9.5 ft amsl. The model of dewatering at S-75 assumes that eight well points with 5-ft spacing will be placed on either side of the structure, and that per-well pumping rates will average 0.125 gpm. Accordingly, the total pumping rate for this case is approximately 2,900 gpd, or 2 gpm. Figures B−4 and B−5 provide site-scale and close-up views of the steady-state water levels in Layer 1 computed by this simulation. As seen in each figure, water elevations in the construction area are expected to eventually reach 8.5 to 9 ft amsl. As with structures S-66 and S-67, the model indicates that it will take about 3 days of continuous pumping before the desired drawdowns are reached at this location. Reverse particle tracking over a period of 40 days indicates that dewatering in the vicinity of S-75 will induce inflow of Layer 1 water from as much as 40 ft away. Groundwater is expected to converge on the dewatered area from all directions. Because the pumping rate at this locale will be less than that at either S-66 or S-67, the upward vertical gradient from Layer 2 to Layer 1 is also expected to be less. Available concentration data suggest that contamination does not occur in either Layer 1 or Layer 2 at the S-75 location. Accordingly, as indicated in Table 2, the dewatering operation here is not expected to produce contaminated groundwater. 4.2.3 Dewatering North of Bryan Dairy Road for Drain Pipe Installation A third simulation for the area north of Bryan Dairy Road is used to assess dewatering required for the installation of about 480 linear ft of a 6-inch drain pipe along the road, extending from drainage structure S-66 eastward to drainage structure S-75. The target drawdown for this operation is about 3.5 to 4.5 ft, which means that groundwater elevations of about 9 to 10 ft amsl are needed along the pipe’s footprint. The model of this dewatering system indicates that the target water levels could be achieved using 69 wells and a well spacing ranging from 5 to 14 ft. Per-well steady-state pumping rates for this system are projected to vary from 0.15 to 0.2 gpm, and the total simulated pumping rate is approximately 17,300 gpd, or 12 gpm. The closest well spacing and largest pumping rates in this case are at wells on the west end of the well line, where induced seepage from South Pond is expected to strongly affect the system’s performance. Model-computed, steady-state groundwater elevations in Layer 1 along the pipe’s footprint, shown in Figure B−6 and Figure B−7 (in Appendix B), vary from 8 to 9 ft amsl. Corresponding computed elevations in Layer 2 vary from about 9 to 10.5 ft amsl (Figure B−8). Reverse particle tracking calculations indicate that most water entering this dewatering system will be drawn from both north and south of the line of well points. Assuming that pumping will occur continuously for 40 days, water as far as 50 ft away from the wells will be drawn into the wells. As in the case of drainage structures S-66 and S-67, it is very difficult to predict the concentrations of contaminants, if any, that will be entrained in the system discharge.

Dewatering Evaluation Report for Road Const. & Water Line Replacement U.S. Department of Energy Doc. No. N0111300 June 2008 Page 10
Concentration data from observation wells just to the north of Bryan Dairy Road indicate that most local contamination occurs in Layer 2 groundwater, and at relatively low levels. It is worth noting again, however, that contamination has also been recently detected in both Layer 1 and Layer 2 groundwater in a well drilled about 120 ft south of structures S-66 and S-67, on the south side of Bryan Dairy Road. If contaminants are drawn into this dewatering system, contaminant levels will likely reflect significant dilution, although the degree of dilution can not be reliably predicted. Conservatively large estimates of cDCE and VC concentrations in the dewatering discharge from this operation are listed in Table 2. 4.2.4 Dewatering Between Structures S-70 and S-73 South of Bryan Dairy Road Evaluation of pumping south of Bryan Dairy Road is performed with a single model run that accounts for dewatering near the footprints of four drainage structures (S-70, S-71, S-72, and S-73) and about 480 linear ft of 24-inch-diameter RCP connecting the structures from west to east. The simulation assumes that 94 pumping wells with 5- to 6-ft spacing will be placed along a straight line adjacent to the RCP’s footprint to accomplish the dewatering necessary for the pipe’s installation. It also assumes that four additional wells will be used in the vicinity of each structure (two on each side) to achieve the dewatering necessary for their construction. This results in a combined system of 110 wells pumping at a total, steady-state rate of about 18,150 gpd, or 12.6 gpm. Steady-state pumping rates applied to individual wells in the model range from 0.08 to 0.2 gpm. Figure B−8 presents a site-scale view of the steady-state water elevations produced by the model of dewatering south of Bryan Dairy Road, and Figure B−9 presents a close-up view of the water levels. As indicated, most water elevations along the footprint of the 24-inch-diameter RCP and at the structures are expected range between 5 and 6 ft amsl, and the lowest elevations would be achieved mostly along the interior portion of the RCP footprint. Because these levels are below the design inverts of the pipeline and structures in the area, which range between 8.5 and 10 ft amsl, the produced drawdowns are expected to be adequate for construction purposes. Reverse particle tracking calculations associated with this simulation show that most of the water collected by the well points will come from directly north and south of the well system. This is expected given the extensive length of the east-west trending well system (about 500 ft). Reverse particle tracking results suggest that water in Layer 1 as much as 45 ft north and south of the wells may end up in the dewatering discharge. As expected, this simulation indicates that a discernible upward hydraulic gradient will occur directly beneath the dewatering wells while they are being pumped. The model-generated, steady-state water levels in Layer 2 (Figure B−10) along the interior of the RCP footprint range from about 6.5 to 7 ft amsl, which are higher than the water elevations of about 5 to 6 ft amsl predicted for Layer 1 (Figure B−9) in this area. Because the spatial extent of contamination in the surficial aquifer south of Bryan Dairy Road is not known, it is impossible to predict the contaminant levels that might occur in the discharge produced by dewatering here. Because contamination has been detected in both Layer 1 and Layer 2 groundwater at a single location (PIN12−0552), close to where structure S-71 will be installed, it is likely that some contamination will be observed in the discharge. Assuming that this contamination is limited to the immediate vicinity of the PIN12−0552, combined discharge
U.S. Department of Energy Dewatering Evaluation Report for Road Const. & Water Line Replacement June 2008 Doc. No. N0111300 Page 11
from dewatering operations south of Bryan Dairy Road will reflect considerable dilution due to the mixing of uncontaminated and contaminated waters. Very rough estimates of cDCE and VC concentrations in the discharge are 69 and 9 μg/L, respectively (Table 2). 4.2.5 Dewatering Between Drainage Structures S-208 and S-209 West of Belcher Road This simulation accounts for dewatering in the vicinity of two drainage structures, S-208 and S-209, to be installed on the west side of Belcher Road, as well as dewatering beneath 120 linear ft of a 14-inch-diameter RCP connecting the structures. S-208 and S-209 are located about 120 and 240 ft, respectively, north of the northwest corner of the intersection of Bryan Dairy and Belcher roads. The invert elevations of the drainage structures and the 14-inch pipe are approximately 10 to 10.5 ft amsl. Construction in this area will require a drawdown of about 6 to 6.5 ft at each of the drainage structures and along the trench that contains the 14-inch RCP. Assuming the ambient groundwater level in this area is 13.5 ft amsl, these drawdowns translate into water elevations of about 7 to 7.5 ft amsl. The model of this system incorporates a line of 28 well points spaced about 6 ft apart. Steady-state pumping rates for each of the well points varies between 0.125 and 0.15 gpm, and the total steady-state pumping rate is 4.14 gpm, or about 6,000 gpd. Simulation results suggest that it will take about 3 days to approach steady-state conditions and the level of drawdown necessary to begin construction. Site-scale and close-up views of the steady-state water levels in Layer 1 resulting from this dewatering plan are presented in Figure B−11 and Figure B−12, respectively. As indicated in the close-up view, predicted water levels in the vicinity of S-208, S-209, and the interlying area range from 7 to 7.5 ft amsl, which comply with target groundwater elevations. A close-up view of the model-computed steady-state hydraulic heads in Layer 2 (Figure B−13) shows that water levels in the deep surficial aquifer beneath the dewatering points will be about10 ft amsl, which are 2.5 to 3 ft higher than those in Layer 1. This result indicates that a relatively steep upward hydraulic gradient will be created below the well points. The results of reverse particle tracking with this simulation indicate that most of the water entering the dewatering wells will come from both the east and west in Layer 1, and that water as much as 50 ft to the west of the well system will be drawn into it. Because concentration data collected over the past several years show little to no contamination occurring in Layer 1 groundwater east of Building 100, it appears unlikely that the shallow surficial aquifer represents a source of contamination in dewatering discharge. Most of the contaminants currently observed east of Building 100 have been detected in Layer 2 groundwater, and concentrations of these constituents appear to decrease steadily with proximity to Belcher Road, becoming virtually nonexistent just west of the road. Though the relatively steep upward hydraulic gradient predicted by the model between Layers 1 and 2 suggests that entrainment of Layer 2 contamination in the dewatering system is possible, dilution via the mixing of uncontaminated and contaminated waters is likely to be substantial. Conservative estimates of the discharge concentrations of cDCE and VC resulting from this dewatering are 11 and 33 μg/L, respectively (Table 2).
Dewatering Evaluation Report for Road Const. & Water Line Replacement U.S. Department of Energy Doc. No. N0111300 June 2008 Page 12
4.2.6 Dewatering to Accommodate Drain Pipe Installation West of Belcher Road An additional model run for the area west of Belcher Road simulates dewatering along a 360-ft line extending from 50 ft south of drainage structure S-208 on the south to the north end of the parking lot in the southeast corner of the STAR Center. The purpose of this dewatering is to facilitate the installation of 6-inch-diameter drain pipe at a depth of about 7 ft bls. The desired drawdown for this operation is about 3.5 to 4.5 ft, which translates into a target groundwater elevation of about 9 to 10 ft amsl. Using a spacing of 12.5 ft between wells and a total of 35 wells, the model indicates that an average steady-state per-well pumping rate of 0.15 gpm and a total pumping rate of 5.25gpm, or 7,600 gpd will produce the dewatering needed for installation of the drain pipe. As shown in Figure B−14 and Figure B−15, model-computed groundwater levels for Layer 1 in the vicinity of the dewatering operation range from 8 to 10 ft amsl. Corresponding steady-state hydraulic heads in Layer 2 range from about 10 to 11 ft amsl. Reverse particle tracking performed in conjunction with this model run indicates that continuous pumping at the line of wells for 40 days has the potential to draw in groundwater from Layer 1 from as far as 35 ft to the west. As in the case of dewatering between structures S-208 and S-209, dewatering for the purpose of installing 360 ft of drain pipe on the west side of Belcher Road is unlikely to induce the inflow of Layer 1 contaminants because little to no contamination is observed in shallow groundwater east of Building 100. Similarly, any contamination that might be drawn into the system is likely attributable to upward migration of Layer 2 water. Conservative estimates of cDCE and VC concentrations in the dewatering discharge from this operation are 11 and 33 μg/L, respectively. A transient run with this model suggests that, similar to other areas being dewatered, it will take about 3 days of continuous pumping before water levels decrease to the point that construction can begin. The model also suggests that additional days of pumping might be required before virtual steady-state conditions are achieved. 4.2.7 Dewatering at Drainage Structure S-210 East of Belcher Road This simulation accounts for dewatering to facilitate the installation of drainage structure S-210 east of Belcher Road and about 15 ft of 18-inch-diameter pipe extending westward from it. Pumping here will need to reduce water elevations to about 7 to 7.5 ft amsl to accommodate the invert elevation of the structure and pipe, which is about 10 ft amsl. The system used to simulate this dewatering consists of four wells with 5-ft spacing on either side of the structure and adjoining pipe, for a total of eight wells pumping at a combined steady-state rate of 1.8 gpm (2,600 gpd). The steady-state water levels in Layer 1 produced by the model in the vicinity of the structure’s footprint (Figure B−16 and Figure B−17) average about 7 ft amsl. Corresponding water elevations in Layer 2 (Figure B−18) are about 10.5 ft amsl. Though these results suggest that a substantial upward hydraulic gradient will occur below the dewatered area, there is limited potential for contamination to be drawn into this dewatering system. As discussed in the preceding two sections, observed contamination in Layer 1 on the west side of Belcher Road is minimal to nonexistent, and contamination in Layer 2 appears to decrease to nondetectable levels
U.S. Department of Energy Dewatering Evaluation Report for Road Const. & Water Line Replacement June 2008 Doc. No. N0111300 Page 13
just west of Belcher Road. Given these observations, it is unlikely that dewatering east of Belcher Road for the purpose of road construction will result in the extraction of contaminated groundwater. 4.2.8 Dewatering East of Belcher Road to Accommodate Drain Pipe Installation A final model run examines the effects of a well-point system used to dewater along the footprint of about 440 ft of 6-inch-diameter drain pipe paralleling Belcher Road on its east side. The invert elevation of the drain varies from about 14 to 14.5 ft amsl, which means that dewatering will need to decrease nearby groundwater levels to about 11 to 11.5 ft amsl. The system used to produce the associated drawdowns of about 2 to 2.5 ft consists of a line of 72 wells with 5- to 6-ft spacing. Per-well pumping rates range from 0.1 to 0.125 gpm, and the total extraction rate is approximately 8 gpm, or 11,500 gpd. As seen in Figure B−19 and Figure B−20, this model run produces steady-state water elevations in Layer 1 along the drain pipe’s footprint that range from 7 to 9 ft amsl. Thus, the modeled system appears to be adequate for the drain installation. The same reasoning presented in the preceding section regarding pumping to install drainage structure S-210 indicates that dewatering for the installation of the 6-inch-diameter drain on the east side of Belcher Road is not expected to result in the discharge of contaminated water. If any contaminants are drawn into the well system, dilution by mixing of uncontaminated and contaminated waters is likely to render their concentrations quite small. 4.3 Modeling Summary Model simulations indicate that that per-well pumping rates will range from 0.15 to 0.3 gpm, depending on the spacing between wells and each well’s proximity to South Pond, where surface water is likely to recharge the groundwater system in response to the pumping. A well spacing of 5 ft appears to be appropriate for dewatering in all of the areas examined with the modeling, although a larger well spacing would likely suffice to accommodate the installation of relatively shallow drain pipe located far from South Pond. Available information regarding dewatering practices in the surficial aquifer in Pinellas County indicates that it is common practice to use a uniform well-point spacing of about 5 ft. Thus, it is likely that the necessary dewatering will be readily achieved if this same practice is applied near the intersection of Bryan Dairy Road and Belcher Road. If the more conventional spacing is used at areas included in this analysis, it is likely that well interference effects will reduce per-well pumping rates to rates below those indicated by the model simulations. However, total pumping rates for each dewatering system, if installed in ways similar to the approaches used in this evaluation, will probably be close in value to those reported above. Simulations conducted with the model of the areas surrounding the intersection of Bryan Dairy and Belcher roads suggest that continuous pumping for a period of about 3 days will be sufficient to draw water levels down to the point where construction can begin. The model runs also suggest that a few more days of pumping may be required in some instances before virtual steady-state conditions are achieved. Reverse particle tracking calculations conducted in conjunction with all model runs indicates that the various dewatering systems analyzed have the potential to draw in Layer 1 groundwater from anywhere between 40 and 70 ft away. Modeling results also suggest that the dewatering operations are capable of inducing upward migration of
Dewatering Evaluation Report for Road Const. & Water Line Replacement U.S. Department of Energy Doc. No. N0111300 June 2008 Page 14
groundwater from Layer 2 into Layer 1. Uncertainties in the hydraulic parameters that control the mixing of waters from various locations makes it impossible to reliably project the concentrations of contaminants, if any, that will be drawn into the dewatering well systems. Nonetheless, available information regarding the distribution of contamination in the two layers of the surficial aquifer suggests that the mixing of uncontaminated water with any contaminated water pumped by wells will significantly reduce contaminant concentrations.
5.0 Risk Assessment Various risks are potentially associated with local dewatering of the surficial aquifer near the intersection of Bryan Dairy and Belcher roads. Those risks and potential consequences are discussed in this section. 5.1 Worker Exposure Risk The objective of this analysis is to characterize the potential for unacceptable risks that might occur through exposures to construction-related contaminated groundwater during dewatering operations. The groundwater of concern is shallow groundwater in the southeastern portion of the site adjacent to Bryan Dairy and Belcher roads, where dewatering will be necessary. This analysis examines baseline exposures to groundwater by construction workers in the absence of any controls on the dewatering process (i.e., no DOE management). Permissible levels of contaminants are determined for these exposures to evaluate the likelihood that unacceptable risks would occur during dewatering operations. VC is used as the representative indicator chemical in this analysis because it is the most mobile and widespread contaminant at the site, and, as a carcinogen, it is the contaminant of concern with the highest toxicity. Carcinogenic risks are evaluated, as they are associated with exposure to lower concentrations of VC than are noncarcinogenic risks. VC is a volatile organic compound (VOC); therefore, exposures through both ingestion of groundwater and inhalation of air are assessed. Groundwater sampling at the site has generally demonstrated that, at the downgradient portions of the site in the vicinity of the ponds and planned road construction, contamination is restricted to deeper portions of the surficial aquifer; the uppermost groundwater in the aquifer is “clean.” However, recent groundwater samples collected in one newly installed off-site well have indicated that groundwater from the 9−18 ft interval, as well as deeper intervals, has contaminant levels that exceed CTLs. The maximum concentration of VC detected in shallow wells in the vicinity of the dewatering project is 62 μg/L; therefore, groundwater discharging into any excavations required for road construction could have some contamination. The recently observed shallow contamination may be localized in nature since most shallow wells in the vicinity of the dewatering have little or no contamination. In this area, it is likely that small volumes of contaminated water would likely mix with larger volumes of clean water during dewatering, thus diluting the contamination significantly. VC is volatile, and it preferentially partitions into the air when it is exposed at the surface. The half-life for the volatilization of VC from a “typical pond” has been estimated at 43.3 hours (ATSDR 2006). This degradation would prevent the attainment of any significant concentrations
U.S. Department of Energy Dewatering Evaluation Report for Road Const. & Water Line Replacement June 2008 Doc. No. N0111300 Page 15
of VC in water in open excavations. VC is also unstable in the atmosphere and has an estimated atmospheric half-life of about 18 hours (ATSDR 2006). To be protective of workers, the Occupational Safety and Health Administration (OSHA) regulates exposures of VC in workplace air. Current regulations impose a permissible exposure limit (PEL) of 1.0 part per million (ppm) (2.6 milligrams per cubic meter) averaged over an 8-hour period or a short-term exposure of no more than 5 ppm over a 15-minute period (ATSDR 2006). Where the 1.0 ppm exposure limit cannot be met, employers must create an area with controlled access and a respirator program conforming to OSHA standards. For air in the vicinity of the dewatering project to exceed the OSHA PEL, it would require that VC from 42 liters of the most contaminated shallow groundwater (62 μg/L) be completely transferred to each cubic meter of air in the workplace. Based on typical dewatering operations, the exposure of that much groundwater is highly unlikely. Most of the VC would likely volatilize from the moist soils on the sides of the trenches. Minimal amounts of standing water in the bottoms of trenches could be present. This would certainly not provide the volume of water required to produce and sustain elevated VC concentrations in air. Additionally, any contaminants would likely disperse rapidly in the air and degrade through natural processes. Because there are no workplace standards for exposure to VC in water (other than drinking water standards), risk calculations were performed. To calculate potential worker risks from groundwater, it is assumed that a construction worker could ingest an incidental amount of contaminated water from the excavation trench during the course of a workday. The default rate for total daily water consumption by adults is 2 liters per day. In these calculations, it is assumed that 10 percent of this (0.2 liter) comes from incidental ingestion of contaminated water during the workday. A project duration of 5 “work months” (100 days) is assumed. Resulting calculations are presented in Table 3. Calculations show that for a 10−6 risk level, groundwater with a VC concentration of about 120 μg/L could be safely consumed. Groundwater with VC concentrations up to at least 477 μg/L would lead to acceptable air concentrations. These calculations suggest that VC concentrations observed in the groundwater closest to the areas requiring dewatering (with a maximum concentration of 62 μg/L) would not result in unacceptable risks, using reasonably conservative exposure assumptions. Furthermore, because the acceptable risk range is from 10−4 to 10−6, water concentrations up to two orders of magnitude above the calculated risk-based levels would still produce risks in the acceptable range. Therefore, uncertainties associated with the exposure calculations would probably not affect the conclusion that no unacceptable risks to construction workers are likely. 5.2 Loss of Plume Control Because the construction dewatering will (1) induce groundwater flow in directions that differ from those in the ambient flow system and (2) increase groundwater velocities, particularly near the pumping wells, consideration should be given to the potential for groundwater contaminants to be drawn into areas where they are currently missing. Such a potential does exist along the west side of Belcher Road, where pumping of the shallow aquifer (Layer 1) will cause some upward migration of Layer 2 groundwater, which will in turn induce eastward flow of relatively deep contaminated groundwater on the east side of Building 100. However, if the pumping is

Dewatering Evaluation Report for Road Const. & Water Line Replacement U.S. Department of Energy Doc. No. N0111300 June 2008 Page 16
limited to a relatively short time span of 40 days or less, the effect on the leading edge of contaminant plumes between Building 100 and Belcher Road is expected to be short-lived. Natural attenuation processes in the form mechanical dispersion, dilution from recharge, and ambient contaminant biodegradation are inclined to limit the downgradient migration of plume fronts after pumping has ceased. Dewatering on the north side of Brian Dairy Road is expected to impact existing plume configurations in a manner similar to that occurring along the west side of Belcher Road. That is, the pumping will likely induce some southward migration of Layer 2 contaminants just south Building 100 toward Brian Dairy Road, but natural attenuation processes are expected to minimize the lasting effects of this migration. Of some interest is the impact that pumping north of Brian Dairy Road will have on contamination recently detected in both the shallow and deep portions of the surficial aquifer on the south side of the road at PIN−0552. Hydraulic considerations suggest that pumping north of the road will induce northward movement of the contamination currently observed at PIN12−0552. However, this northward migration is expected to be small because of the relatively large distance separating the dewatering wells north of the road and the recently detected contamination (about 80 to 100 ft). Modeling at the site indicates that changes in groundwater velocity at a location that far away from the pumping are generally imperceptible. Though dewatering operations east of Belcher Road and south of Brian Dairy Road might induce some flow off of STAR Center property, the impact on plumes currently observed on the property is expected to be minimal. This is attributed to the relatively large distances separating the off-site dewatering wells and on-site plumes. Given the limited information currently available regarding the extent of groundwater contamination south of Brian Dairy Road, it is impossible to predict how dewatering south of the road will impact plumes in the area. However, it can be anticipated that the pumping will induce any contamination occurring farther to the south to be pulled back toward the road. In summary, dewatering for construction purposes in the vicinity of Brian Dairy Road and Belcher Road near their intersection may cause temporary migration of contaminated groundwater to areas it may not currently impact, but natural attenuation processes occurring after the dewatering are expected to return contaminant plumes to their existing configurations. None of the plume changes attributed to dewatering suggest loss of plume control. 5.3 Improper Management of Contaminated Water The Clean Water Act (CWA) is a comprehensive program to protect the waters of the United States. The U.S. Environmental Protection Agency (EPA) and other agencies administer various regulations established under the CWA, including the publicly owned treatment works (POTW) program provisions in Title 40 Code of Federal Regulations Part 403 (40 CFR 403). The CWA establishes a broad prohibition against the discharge of pollutants by any “person” except as in compliance with the act’s permit requirements, effluent limitations, and other provisions. The State of Florida is authorized to administer permitting requirements for EPA and does so under F.A.C. 62-621.300 through 625.880.

U.S. Department of Energy Dewatering Evaluation Report for Road Const. & Water Line Replacement June 2008 Doc. No. N0111300 Page 17
Dewatering options 3 through 5 would ensure proper management of dewatering effluent through a sampling program. Under Option 1, a dewatering contractor would not typically sample water, but would discharge it to a storm sewer. 5.4 DOE Liability Risk Management Without some involvement in the dewatering operation, DOE runs the risk of incurring liabilities due to real or perceived risks. As discussed above, it is unlikely that construction workers would be exposed to levels of contaminants that result in any unacceptable risks. However, without monitoring data to support this evaluation, it may be possible for workers to claim damages in the future. Likewise, some kind of monitoring would be needed to demonstrate compliance with requirements for the disposal of recovered groundwater. To assist DOE with risk-management decision-making, Stoller has identified the potential risks and the options for (and cost of) mitigating them.
6.0 Dewatering System Options Evaluation This section presents the conceptual dewatering design that would be proposed to address roadway construction dewatering management options presented in Section 3.0. Section 6.1 presents a discussion on well-point dewatering technology, a potential well-point layout, a proposed dewatering transmission line, groundwater management, construction and operations health and safety issues, and regulatory compliance issues. Sections 6.2 through 6.6 present a detailed discussion of the five options, including construction and operations implementation and associated cost estimates, as well as project schedules. Dewatering management options for construction of the Belcher Road water line discussed in Section 2.2 would be similar to the following options (Appendix C). 6.1 Construction Dewatering 6.1.1 Well-point Dewatering Method A well-point system is the construction standard for construction dewatering in the Pinellas area when utility lines and roadways are being constructed. This is the system that will be evaluated to dewater the construction activities along Bryan Dairy Road and Belcher Road. Well-point systems are groups of closely spaced wells, usually connected to a header pipe or manifold and pumped by suction lift. In most cases, it is more economical to dewater with well points rather than by surrounding the excavation with a continuous wall of sheet piling and pumping from within the work area. Well-point systems are frequently used because they are relatively easy to install, adaptable to a wide range of site conditions, and more conducive to use in linear excavations (such as utility trenches). A well-point system typically consists of well points connected to a header pipe that runs to a vacuum pump. The vacuum produced by the pump lifts water from each well point, and the water flows through the header pipe and through the pump. Usually the water is then discharged to the storm sewer. The maximum drawdown that is possible with this system is about 20 to 22 ft, but most well point systems are designed to

Dewatering Evaluation Report for Road Const. & Water Line Replacement U.S. Department of Energy Doc. No. N0111300 June 2008 Page 18
operate within 15 ft of suction lift. Figure 10 presents a typical well point and connection to a pump. Well points are usually 1.5 or 2 inches in diameter and are typically spaced 3 to 12 ft apart. Spacing depends on the soil’s hydraulic conductivity, the depth to which the water table must be lowered, and the depth to which the well points can be installed. Finer-grained soils require a tighter spacing. Most well point dewatering systems are installed with little attention to a site-specific design. The dimensions of the well point and header pipe are usually dictated by equipment on hand, which is reused on each project. Well-point spacing is usually based on field experience for similar conditions. Because conditions change from one part of a site to another, however, a certain amount of trial and error is required to achieve the necessary drawdown. Figure 11 presents a typical well-point installation wherein the header pipe and flexible pipes, called “swing joints,” connect the well points to the pipe. Lowering the groundwater level throughout a construction site involves creating a composite cone of depression by pumping from the well-point system (Figure 11). The wells must be spaced such that the cones of depression overlap, thereby pulling the water table down to the desired depth at intermediate points between wells. Figure 12 shows how the overlapping areas of influence around two small wells produce an enhanced drawdown of the water table. The water will remain at the levels indicated as long as pumping continues. Once gravity drains water from the formation above the lowered water table, excavation can take place anywhere within the composite cone of depression. The complete dewatering of the composite cone of depression will occur well after pumping begins. Although maximum drawdown in the saturated formation around each well point can be obtained in several hours, additional time is required for the vertical drainage of all the water from the saturated zone. In practice, this time lag makes it necessary to start pumping from the well-point system a day or more before excavation begins. 6.1.2 Well-point System Layout Evaluated As presented in Section 2.1, dewatering activities that could potentially be affected by the Building 100 plume are bounded as follows:
• Bryan Dairy Road: From the intersection west to the east entrance to the STAR Center.
• Belcher Road: From the intersection north to the north edge of the southeast parking lot. The groundwater model presented in Section 4.0 was used as a basis to develop a well-point layout. Modeling results were reviewed with a dewatering contractor experienced in installing dewatering systems in the STAR Center area. The contractor recommended a system based on well points installed at 5 ft on center, which coincides with one of the options evaluated in the groundwater modeling. Flow from each well was predicted by the model to be in the 0.15-to-0.30-gpm range. The contractor verified that these flows could be common in this area, although slightly higher flows have been experienced in the past. Average values for pumping rates per well as presented in Table 2 were used to calculate total flows from a header-pipe system. In order to provide the optimum dewatering system, well points will be installed at 5 ft on center adjacent to each structure to be dewatered. A header pipe will connect well points placed to the same depth for a common structure to be dewatered. The common structure to be dewatered is based on the maximum depth of dewatering required for it. In order to minimize the number of

U.S. Department of Energy Dewatering Evaluation Report for Road Const. & Water Line Replacement June 2008 Doc. No. N0111300 Page 19
deeper wells that might draw the plume, wells are grouped based on the depth required for dewatering—shallower on one header pipe and deeper on another. Connections from the well points to the header pipes are made with a swing joint with a throttling valve installed in-line. A diesel vacuum pump will be placed at the end of each header pipe and provide the suction lift for the wells. The pumps will discharge directly into a transfer tank. Because construction activities may occur simultaneously in an area where two header pipes are located, two systems may need to operate simultaneously, requiring two pumps. The varying combinations were evaluated, and it was determined that if all the wells on the north side of Bryan Dairy Road were pumped simultaneously this would produce the maximum anticipated flow of 34 gpm. It is anticipated that traffic light masts would always be constructed separately and are not included in the flow. Table 4 and Table 5 present the structures where dewatering will be required for their construction, the depth below grade of the structure bottom, and the dewatering-depth requirements. Also presented are possible header systems that would be installed, the corresponding number of wells that would be plumbed to them, and the resultant flows. Plate 1 presents their locations and dewatering structures. The dewatering system on the south side of Bryan Dairy Road and the east side of Belcher Road will need to be connected to the system on the STAR Center side of the roads. This will be accomplished by constructing a horizontal directional boring under the roads and installing a 2-inch-diameter pipe to convey water beneath the streets. 6.1.3 Dewatering Transmission Lines In options where groundwater will need to be managed, water from the dewatering activities will be pumped to the STAR Center IWNF. This facility pre-treats STAR Center effluent water and is permitted to discharge water into the county POTW. Water will need to be transferred to the IWNF via transfer pumps and a transmission line. A diesel water pump (transfer pump) with a surge transfer tank will be placed on the transmission line inlet. The vacuum pumps will pump into the surge feed tank, which, when full, will be pumped into the transmission line. The transmission line was sized based on using the maximum calculated flow of 34 gpm as described in Section 6.1.2 and applying a 33 percent safety factor. This equated to 45 gpm, which, when a pipe is sized for an optimum flow velocity of 5 ft per second, requires that the line will need to be 2-inch diameter. The 2-inch line can actually convey 56 gpm based on an optimum flow velocity of 5 ft per second, which provides a 65 percent safety factor over the 45 gpm. The transmission line will be a 2-inch–diameter, double-containment PVC pipe, buried a minimum of 2 ft below grade. The 2-inch line is also adequate to convey flows from potential future Building 100 plume control hydraulic barriers, which could produce up to 20 gpm. The transmission line will discharge directly into a groundwater management system located at the IWNF and further discussed in Section 6.1.4. Figure 13 is a schematic perspective drawing of the groundwater dewatering system showing the major components and their interaction. 6.1.4 Groundwater Management Two options were evaluated to manage groundwater once it was transferred to the IWNF via the transmission line. The first option would be to store the water, sample and discharge when lab
Dewatering Evaluation Report for Road Const. & Water Line Replacement U.S. Department of Energy Doc. No. N0111300 June 2008 Page 20
results indicate it is acceptable. The second option would be to treat all the groundwater through an air stripper and discharge into the IWNF. Sections 6.1.4.1 and 6.1.4.2 provide a detailed discussion on both options. 6.1.4.1 Storage This option assumes that all groundwater from dewatering operations will be collected into temporary containment vessels and sampled for laboratory analysis to ensure compliance with the STAR Center wastewater discharge permit. If the laboratory results verify compliance, the water will be discharged to the IWNF and ultimately discharged to the POTW. If the laboratory results indicate that the contained water does not meet the wastewater-permit discharge standards, then before the water is discharged, it will be treated until it meets the standards. An on-site air stripper or activated carbon absorption unit would likely be the most cost-effective options for performing such treatment. Water storage would be provided by renting frac tanks and placing them at the Wastewater Neutralization Area (WWNA). Water would be discharged into the tanks, and samples would be taken daily and sent to an analytical laboratory for analysis. The lab’s quickest expected turnaround time is 3 days; therefore, a minimum of 3 days’ worth of storage would be required. If the lab results were acceptable, the tanks could be discharged into the WWNA. For conservativeness, the number of tanks required was based on 4 days. Assuming that 21,000-gallon frac tanks will be used, 20 tanks would be required for 4 days of pumping at the maximum discharge rate of 75 gpm. This would require a total of 41 tanks—half for holding water until lab results returned, and half for allowing dewatering to continue. Because there is not enough room for 41 tanks in the WWNA, this option is not implementable and is not discussed further. In addition, the cost is estimated to exceed $378,000 for a tank system alone. 6.1.4.2 Air Stripper Treatment System This option assumes that an air stripper would be placed at the WWNA with the transmission line discharging directly into it. Using an air stripper eliminates the need for excess tank storage and is a conservative means to ensure that all water collected is treated and meets discharge compliance criteria. The air stripper would be sized for the contaminants of concern as well as at a minimum the anticipated maximum flow of 75 gpm. Air strippers have previously been used at the 4.5 Acre Site as well as the Northeast Site with much success. Their operations are relatively simple, yet effective. The air stripper used for costing in this report can service 100 gpm, providing a sufficient buffer on flows. The air-stripper is also adequate to treat contaminated groundwater from potential future Building 100 plume control hydraulic barriers, which could produce up to 40 gpm. The air stripper would be skid mounted and would be placed on a concrete containment slab with a sump pump system for overflows. A surge tank would be placed at the end of the transmission line and would feed into the air stripper. Treated water would then be discharged directly into the IWNF. Sampling requirements are further discussed in Section 6.1.4.3.
U.S. Department of Energy Dewatering Evaluation Report for Road Const. & Water Line Replacement June 2008 Doc. No. N0111300 Page 21
6.1.4.3 Sampling Once operation of a new groundwater treatment system begins, treated water will be discharged into the STAR Center’s IWNF, so certain sampling frequencies for the treated water are required to ensure compliance with the STAR Center’s National Pollutant Discharge Elimination System permit:
• Daily for the first week.
• Weekly for the first month.
• Monthly thereafter. A review of the STAR Center’s Industrial Wastewater Discharge Permit indicates that the water needs to be analyzed only for contaminants that are known or expected to be present. The only known contaminants in the area where dewatering would occur are VOCs and arsenic. However, arsenic is not present in the monitoring wells near the property boundary and is present in other wells to the south and east of Building 100 at concentrations well below the 100 μg/L CTL. Therefore, arsenic analysis may not be necessary. The relevant permit parameters for VOCs are Total Toxic Organics and Total Volatile Aromatics. Total Toxic Organics would be determined by analyzing the groundwater using Method 624, and Total Volatile Aromatics would be determined by using a special version of Method 624 that would report only benzene, toluene, ethylbenzene, and total xylenes. 6.1.5 Regulatory Compliance/FDEP Issues The Building 100 Area is included as a Solid Waste Management Unit (SWMU) under the Resource Conservation and Recovery Act (RCRA) Hazardous and Solid Waste Amendments Permit that was reissued on August 21, 2007, under the authority of the Florida Department of Environmental Protection (FDEP). The permit was modified under the provisions of Section 403.722, Florida Statutes and Chapters 62-4, 62-160, 62-730, 62-777, and 62-780, F.A.C., to incorporate the RBCA regulations. The permit requires the investigation and remediation, if necessary, of any releases of hazardous waste or hazardous constituents from any SWMUs at the facility. The SWMUs are identified in the Appendix to the permit. DOE has been addressing the remediation of the Building 100 Area groundwater plume with FDEP. The impact of the dewatering evaluation to the RCRA permit requirements was discussed with FDEP, and they stated that they would evaluate the report and make a determination on what would be required pertaining to the permit. As stated in Section 5.3, the CWA establishes a broad prohibition against the discharge of pollutants by any “person” except as in compliance with the act’s permit requirements, effluent limitations, and other provisions. The State of Florida is authorized to administer permitting requirements for EPA and does so under F.A.C. 62-621.300 through 625.880. The discharge of groundwater from the dewatering is required to be in accordance with a permitted option. Discharge to the storm sewer would require the permission of Pinellas County Utilities and would likely require sampling and analysis prior to discharge, which would require storage of the water until the analysis is received from the laboratory. If the option selected for the groundwater includes discharge to the STAR Center IWNF, the discharge permit for the facility would apply.

Dewatering Evaluation Report for Road Const. & Water Line Replacement U.S. Department of Energy Doc. No. N0111300 June 2008 Page 22
The Pinellas County Utilities Industrial Wastewater Discharge Permit for the STAR Center, which was revised and issued on September 13, 2006, under Number IE-3002-06/09, allows the permittee (i.e., the STAR Center) to discharge treated wastewater through the IWNF into the Pinellas County POTW system. The permit establishes maximum constituent concentrations for discharges into the sewer system, lists the constituents that are sampled and reported on a regular basis, and specifies monitoring frequencies, sampling methods, and analytical methods. DOE will be required to sample the influent from the dewatering and submit monthly effluent quantities to the STAR Center for inclusion in their monthly reports to the Pinellas County Utilities. The STAR Center has informed DOE that they would require verified analytical results prior to discharge of a batch of untreated water to the INWF, which would require storage of the water, sampling, analysis and obtaining the results of the analysis from the laboratory prior to discharge. The permit requires that the STAR Center submit formal written notification to the Pinellas County Utilities in two instances: (1) 30 days before the introduction of new wastewater or pollutants to the system and (2) 48 hours before the discharge of treated groundwater to the sewer. The notification for groundwater also must include specific details, which are listed in Section D of the permit (“Special Conditions”). If the option to treat the groundwater water through an air stripper is chosen, the Generic Unit Exemption under 62-210.300 F.A.C. to obtain an air permit would apply and a permit would not have to be obtained, since the emissions from this unit would not have the potential to emit:
• Lead compounds in excess of 500 pounds per year,
• 1,000 pounds per year or more of any hazardous air pollutant,
• 2,500 pounds per year or more to total hazardous air pollutants, or
• 5 tons per year or more of any other regulated pollutants, and
• This unit in combination with any other exempt or permitted unit would not make the facility a Title V source, or
• Result in a modification subject to the pre-construction review requirements. Since the water would be treated, it could be discharged directly into the STAR Center IWNF with a certain frequency of monitoring required. Rules of Southwest Florida Water Management District (SWFWMD), Chapter 40D–3, “Regulation of Wells,” requires permits for the construction or abandonment of wells. Wells requiring permits include test holes, monitoring wells, and water wells. Any well with an inside diameter of 2 inches or greater must have a well construction permit (WCP) prior to construction. These permits are issued to licensed drillers registered with the SWFWMD, and the drillers are authorized by the landowner to conduct well-development activities. Water-use permits are issued to the owner for high-flow or continuous-use wells. SWFWMD provided DOE an interpretation on this rule by e-mail on December 13, 2007, that stated, “Temporary well points are exempt form permitting per Florida Statute 373. However, per SWFWMD Rule 40D-3.041(1)(d), F.A.C., a permit must be obtained from the district prior to construction, repair, modification, or abandonment of any water well, including (d) Dewatering wells for construction, mining, or quarrying purposes that will be in existence for six months or longer.” Because the dewatering wells will be in place for less than 6 months, a permit will not be needed.
U.S. Department of Energy Dewatering Evaluation Report for Road Const. & Water Line Replacement June 2008 Doc. No. N0111300 Page 23
All wells must meet the construction requirements of Chapter 373 of Florida Statutes and F.A.C. Chapters 17–21 and 40D–3. Notable requirements under these chapters include the following: (1) A completion report must be filed within 30 days of drilling or repair. (2) Casing must extend from land surface to the uppermost consolidated unit from which the well will obtain water and to a sufficient depth below the water table of that formation. (3) Well construction will prevent the interchange of water between different water-bearing zones, which may result in the deterioration of water quality or loss of artesian pressure. (4) All wells that are not driven must be grouted with minimum thickness for the corresponding diameters. Every well abandonment requires at least 24 hours’ notice to the SWFWMD. The district may choose to send a representative to the site to observe the abandonment. F.A.C. Chapter 40D–3 specifies several exemptions and criteria applicable to wells at the STAR Center. For example, wells that measure 2 inches in diameter or less, go no deeper than 15 ft, and are used for no more than 10 days do not require permitting. Variances for alternate or substitute methods or conditions may be obtained by written request. These include, but are not limited to, grouting, treating and sampling, natural barriers, well location, and gradient. F.A.C. rules governing construction methods include those for drilling, coring, boring, washing, jetting, driving, and digging. Casing standards, grouting, and sealing are some other important areas of detail. Well dimensions, numbering requirements, use, and other information required in the WCP are maintained in the district database. 6.1.6 Health and Safety Issues For construction, significant health and safety concerns will be normal construction issues surrounding excavation activities and hazards, such as:
• Utility locates, traffic control, adherence to excavation safety requirements, and lockout/tagout.
• The use of appropriate personal protective equipment in the form of hard hats, safety glasses with side shields, hard-toed shoes, and gloves. Long pants and shirts with (at least) short sleeves, along with either high-visibility vests or high-visibility T-shirts, will also be used as appropriate.
• Noise and hearing protection from excavation heavy-equipment and pumping equipment.
• Hot work precautions for potential welding or cutting.
• Industrial-hygiene monitoring, when excavating below the groundwater table, to rule out exposures to the low levels of VOC contamination.
• Trip hazards and work on uneven ground.
• The use of heavy equipment in high-traffic areas and tight work environments.
• The use of competent persons for excavation activities.
• The demarcation of work areas (with barriers and warning signs).
• The control of the excavation during nonworking hours.
Dewatering Evaluation Report for Road Const. & Water Line Replacement U.S. Department of Energy Doc. No. N0111300 June 2008 Page 24
• The inspection and use of hand tools.
• The storage and control of fuel for pumps and heavy equipment.
• The control of the lay-down area during off-shift hours. For operations, health and safety issues will be similar to those associated with maintaining pumping operations for a small water treatment facility, with the exception of periodic air monitoring for VOCs. Other concerns include the following:
• Noise from pumps and treatment systems.
• Falling into treatment systems.
• Off-hours control of piping and treatment systems.
• Lockout/tagout of systems prior to any maintenance activities.
• Industrial-hygiene monitoring of personnel during exposure to untreated water.
• Use of personal protective equipment in the form of gloves, safety glasses with side shields, and hard-toed shoes.
• Storage and handling of fuel for pumps.
• Security and control of equipment. Monitoring of the breathing zone for contaminant vapors near the excavations will be required for Options 2 through 5. A considerable amount of breathing zone monitoring has been conducted at the STAR Center during various sampling and remediation activities over several years, and based on this information, it is unlikely that contaminant concentrations will exceed applicable limits. However, breathing zone monitoring will be conducted to ensure that workers will not be exposed to contaminant vapors. The first step in this monitoring will consist of using an organic vapor analyzer with either a flame ionization detector or a photoionization detector to measure vapor concentrations numerous times each day. Due to the heavy traffic and adjacent industrial activities, a range of background VOC concentrations will need to be determined prior to the start of construction activities. As described in Section 5.1, VC is the most significant contaminant in terms of worker exposure. Current regulations impose a VC PEL of 1.0 ppm averaged over an 8-hour period or a short-term exposure of no more than 5 ppm over a 15-minute period. Once background VOC concentrations are determined, a threshold VOCs reading will be determined based on the VC PELs. If this threshold is exceeded, Draeger tubes will be used to specifically measure VC concentrations. If a VC PEL is exceeded, large fans will be used to remove the contaminant vapors from the breathing zone.
6.2 Option 1: No Action⎯County Contractor Installs and Operates the System and Manages the Effluent Without DOE Involvement
If the potential risks associated with dewatering are deemed acceptable, then DOE may choose to forgo any involvement with dewatering, in which case Pinellas County’s road construction

U.S. Department of Energy Dewatering Evaluation Report for Road Const. & Water Line Replacement June 2008 Doc. No. N0111300 Page 25
contractor would perform these activities in the vicinity of the STAR Center using the same methodology as at other locations on the project. 6.3 Option 2: County Contractor Installs and Operates the System, and DOE
Monitors Effluent Discharge to Storm Sewer to Ensure Compliance with Storm Sewer Discharge Criteria
It is a construction standard that when construction dewatering is implemented, the water is typically discharged into adjacent storm sewers downgradient of the work area or other existing drainage structures. Contractors need to comply with local regulations when doing this, but it typically only requires compliance with erosion control measures and excess sediment discharge controls. In this scenario, the Pinellas County road construction contractor would be responsible for constructing and operating the dewatering system as well as managing the discharge water similar to other parts of the road project. DOE would establish a monitoring and sampling frequency and sample for contaminants associated with the Building 100 plume. DOE would not be responsible for monitoring or sampling for any compliance assurance other than the Building 100 plume contaminants. DOE would not perform monitoring or sampling for erosion control or sediment loading. If monitoring or sampling results indicated that contaminant levels exceed pre-established thresholds, DOE would implement contingency measures to manage the discharged groundwater. 6.3.1 Construction Implementation DOE will not be constructing any infrastructure to support this option unless, as a contingency, DOE decides to have a transmission line and air-stripper in place as described in Option 3. In that case, construction implementation and costs as described in Section 6.4.1 would apply here. 6.3.2 Operations Implementation Operations would consist of developing and implementing a monitoring plan for the effluent. If DOE would be required to manage the effluent based on monitoring results, operations implementation and cost would be similar to those presented in Section 6.4.2. 6.3.3 Project Schedule Since this option does not require DOE to construct any infrastructure, a design and construction schedule is not needed. However, should DOE elect to construct the transmission line and air-stripper, the schedule presented in Option 3 would apply. DOE would be responsible for monitoring the dewatering system; however, the county public works and county utility construction schedules are not known, and the projected start date for construction in the Bryan Dairy Road and Belcher Road areas is not known.

Dewatering Evaluation Report for Road Const. & Water Line Replacement U.S. Department of Energy Doc. No. N0111300 June 2008 Page 26
6.4 Option 3: County Contractor Installs and Operates the System, and DOE Manages the Effluent
In this scenario, the Pinellas County contractor would be responsible for constructing and operating the dewatering system, and DOE would assume responsibility for managing the pumped water. This option would require DOE to construct a water transmission line from the construction area to DOE’s temporary effluent accumulation point at the STAR Center’s IWNF. DOE would also install and operate an air stripper that would treat all of the groundwater from the construction dewatering activities. Managing the pumped water would require treatment, sampling, analysis, and discharge. 6.4.1 Construction Implementation A design will be developed for the transmission line to the WWNA. Detailed plans and specifications will be developed so that this work can be competitively bid and constructed. A separate design will be developed for the procurement and installation of the air stripper system. This will also include the air stripper infrastructure of concrete containment pad, piping, and electrical supply. Table 6 presents the construction costs for constructing the transmission line and air stripper as described above. Detailed cost estimates are presented in Appendix D. Stoller’s cost for design, oversight, and management are not included in the cost estimates. 6.4.2 Operations Implementation
Operations of the well point dewatering system would be the responsibility of the County’s contractor. DOE would be responsible only for operating the transmission line, which would be minimal, and the air stripper, which would also be minimal. 6.4.3 Operations Cost Estimate Table 7 describes the operations cost to implement the operations described in Section 6.4.2. The WWNA discharge operations include cost for laboratory analysis and STAR Center charges for water disposal. Detailed cost estimates are presented in Appendix D. Stoller’s cost for oversight and management are not included in the cost estimates. Table 8 presents total project cost, including construction costs and operation costs. 6.4.4 Project Schedule The project schedule for Option 3 is presented in Figure 14 and is organized into six major components:
• Prepare dewatering evaluation: Tasks consist of submitting the evaluation dewatering options and DOE’s determining which dewatering strategy to implement.
• Prepare roadway dewatering system design: The design developed during this time frame will be for the construction of the transmission line to the WWNA with an air stripper. The design will be used to solicit the installation and construction from a subcontractor. Permitting for an air-stripper will also commence during this time frame.
U.S. Department of Energy Dewatering Evaluation Report for Road Const. & Water Line Replacement June 2008 Doc. No. N0111300 Page 27
• Treatment-system solicitation and construction: The solicitation package will be issued for the construction of the transmission line to the WWNA with an air stripper. Tasks consist of competitively bidding the construction work from local subcontractors. The 65-day solicitation process includes the bid time, time to evaluate bids and contract submittals, time to comply with worker health and safety requirements in 10 CFR 851, and time to issue a notice to proceed with construction.
Note: It is anticipated that the transmission line construction and air-stripper installation can be done concurrently. The transmission line would start at the intersection of Bryan Dairy Road and Belcher Road and proceed west and north to the WWNA.
• Pinellas County road construction: DOE and the County will determine the roles and responsibilities of both parties and implement them in the project documents. Once DOE has determined its dewatering scope requirements, meetings will be held with the County to present the requirements and determine how they will be implemented in the County’s construction-contract-solicitation documents. The County will internally revise their solicitation documents to reflect DOE’s involvement. Upon completing the revisions, the County will advertise the construction package to contractors. Bids will be received and evaluated, and a construction contract will be awarded. Construction will begin within 10 days of the contract award. The identification, sequence, and duration of County tasks are based on discussions with the County. Discussions with the County have indicated that construction will probably not start until late spring 2009. This allows approximately 2 ½ months of “float” as shown on the schedule.
• Pinellas County Utilities water line replacement⎯Belcher Road: As with the road construction, DOE and the utility commission will determine roles and responsibilities of both parties and implement them in the project documents. It is anticipated that schedule requirements for the water line will be to the same level as for the roadway construction; however, details are not available. Discussions with the utility have indicated that construction could start as early as October 2008. Since the dewatering system would not be in place by that time, DOE and the utility would need to agree that the water line construction would start at the north end and work south to Bryan Dairy Road.
• System operations: DOE would be responsible for operating the transmission line and air stripper. These tasks are not shown on the schedule, since the county public works and county utility construction schedules for starting work on the Bryan Dairy Road and Belcher Road areas of concern are unknown.
6.5 Option 4: DOE Installs the System and Manages the Effluent, and the
County Contractor Operates the System In this scenario, DOE would assume responsibility for constructing the dewatering system and managing the discharged water. The Pinellas County road contractor would be responsible for operating the dewatering system. Management of the discharged water would be the same as that described in Option 3. Option 4 includes installing the full dewatering system described in Section 6.1.2 and installing a transmission line as described in Section 6.1.3; however, DOE would manage only the transmission line and air stripper.
Dewatering Evaluation Report for Road Const. & Water Line Replacement U.S. Department of Energy Doc. No. N0111300 June 2008 Page 28
6.5.1 Construction Implementation Construction implementation and cost estimate would be the same as described in Section 6.6.1. 6.5.2 Operations Implementation Operations of the well point dewatering system would be the responsibility of the County’s contractor. DOE would be responsible only for operating the transmission line, which would be minimal, and the air stripper, which would also be minimal. Table 9 describes the operations cost to implement operations described for Option 4. The WWNA discharge operations include cost for laboratory analysis and STAR Center charges for water disposal. Detailed cost estimates are presented in Appendix D. Stoller’s costs for oversight and management are not included in the cost estimates. Table 10 presents total project cost, including both construction costs and operation costs. 6.5.3 Project Schedule The project schedule for Option 4 would be identical as for Option 5, since Option 4 requires DOE to construct the same infrastructure as in Option 5. The only difference is operational time schedules, which are unknown for both options. 6.6 Option 5: DOE Installs and Manages the System and the Effluent In this scenario, DOE would assume responsibility for all aspects of dewatering, including soliciting a specialty contractor, constructing and operating the system, and managing the discharged water. This option includes installing the full dewatering system described in Section 6.1.2, installing a transmission line as described in Section 6.1.3, and managing the water using an air stripper as described in Section 6.1.4. 6.6.1 Construction Implementation Construction implementation will commence with a detailed review of the dewatering system conceptual design presented in Section 6.1.2. A dewatering contractor familiar with the site will be involved in the review. Any recommendations will be taken into consideration, and adjustments to the conceptual design will be made, making it a preliminary 30-percent-level design. This design will then become part of a performance statement of work (SOW) that will be developed to competitively procure the services of a dewatering subcontractor. The SOW will be a performance-based subcontract in which scope requirements are provided to the subcontractor. The subcontractor will determine the appropriate method to provide the dewatering. The scope requirements of the SOW include:
• Providing and installing the well points in a manner that dewaters areas where structures will be constructed.
• Providing and installing header pipes and pumps.
U.S. Department of Energy Dewatering Evaluation Report for Road Const. & Water Line Replacement June 2008 Doc. No. N0111300 Page 29
• Training workers to operate the system.
• Performing maintenance to ensure that the system operates properly. Components of the dewatering system, including the well points, header, and pumps, are rented from the subcontractor. Prior to installing the well points, utility line locates will be performed in the affected areas to determine if and where utilities are present. A separate design and SOW will be developed for the transmission line to the WWNA. Detailed plans and specifications will be developed so that this work can be competitively bid and constructed to specifications. A separate design and SOW will also be developed for the procurement and installation of the air stripper system. This will also include the air stripper infrastructure of concrete containment pad, piping, and electrical supply. Table 11 presents the construction costs for constructing a dewatering system as described in Section 6.1.2. Detailed cost estimates are presented in Appendix D. Stoller’s cost for design, oversight, and management are not included in the cost estimates. 6.6.2 Operations Implementation Operations of the system will be required 7 days a week while roadway construction is underway, several hours before the construction shift commences, and several hours after the shift ends. Therefore, it is estimated that 16 hours per day will be required. Functions of the operations will include the following:
• Pump operations (ensuring that it is working, refueling it).
• Well operations (checking flow, adjusting valves).
• System operations (coordinating with street contractor regarding work activities and schedules).
• Discharge operations (switching discharge points, coordinating with STAR Center WWNA operations personnel, recording flows).
• Sample analysis (taking and analyzing samples, keeping records, making notifications). Table 12 describes the operations cost to implement operations as described in Section 6.6.2. The Dewatering System Operations cost also includes dewatering pump rentals and fuel. The WWNA discharge operations include cost for laboratory analysis and STAR Center charges for water disposal. Detailed cost estimates are presented in Appendix D. Stoller’s costs for oversight and management are not included in the cost estimates. Table 13 presents total project cost including construction costs as well as operation costs. 6.6.3 Project Schedule The project schedule for Option 5 is presented in Figure 15 and is organized into six major components:

Dewatering Evaluation Report for Road Const. & Water Line Replacement U.S. Department of Energy Doc. No. N0111300 June 2008 Page 30
• Prepare dewatering evaluation: Tasks consist of submitting the evaluation dewatering options, and DOE’s determining which dewatering strategy to implement.
• Prepare roadway dewatering-system design: Two separate designs will be developed during this time frame, and they will be shown as one schedule line item: (1) the installation of the dewatering system and (2) the construction of the transmission line to the WWNA with an air stripper. Both designs will be used to solicit the installation and construction from a subcontractor. Permitting for dewatering and an air-stripper will also commence during this time frame.
• Dewatering-system solicitation and construction: Two solicitation packages will be issued based on the designs completed: (1) the installation of the dewatering system and (2) the construction of the transmission line to the WWNA with an air stripper. The two bid packages are shown as one schedule line item. Tasks consist of competitively bidding the construction work from local subcontractors. The 60-day solicitation process includes the bid time, time to evaluate bids and contract submittals, time to meet 10 CFR 851 compliance, and time to issue a notice to proceed with construction. It is anticipated that the three major construction tasks—transmission line construction, dewatering system installation, and air-stripper installation—can be done concurrently. The transmission line would start at the intersection of Bryan Dairy Road and Belcher Road and proceed to the WWNA. The dewatering system installation start would be staggered to minimize conflict with the transmission line construction.
• Pinellas County construction: DOE and the County will determine the roles and responsibilities of both parties and implement them in the project documents. Once DOE has determined its dewatering-scope requirements, meetings will be held with the County to present the requirements and determine how they will be implemented in the County’s construction-contract-solicitation documents. The County will internally revise their solicitation documents to reflect DOE’s involvement. Upon completing the revisions, the County will advertise the construction package to contractors. Bids will be received and evaluated, and a construction contract will be awarded. Construction will begin within 10 days of the contract award. The identification, sequence, and duration of County tasks are based on discussions with the County. Discussions with the County have indicated that construction will probably not start until late spring 2009. This allows approximately 2 ½ months of “float” as shown on the schedule.
• Pinellas County Utilities water line replacement⎯Belcher Road: As with the road construction, DOE and the utility commission will determine roles and responsibilities of both parties and implement them in the project documents. It is anticipated that schedule requirements for the water line will be to the same level as for the roadway construction; however, details are not available. Discussions with the utility have indicated that construction could start as early as October 2008. Since the dewatering system would not be in place by that time, DOE and the utility would need to agree that the water line construction would start at the north end and work south to Bryan Dairy Road.
• System operations: DOE would be responsible for operating the dewatering system as well as the transmission line and air stripper. These tasks are not shown on the schedule, since the county public works and county utility construction schedules for starting work on the Bryan Dairy Road and Belcher Road areas of concern are unknown.

U.S. Department of Energy Dewatering Evaluation Report for Road Const. & Water Line Replacement June 2008 Doc. No. N0111300 Page 31
7.0 Summary and Conclusions This section summarizes the various dewatering options and compares the features of each. Options are presented in Table 14 and are arranged in order from that of least DOE involvement (Option 1), to that of maximum DOE control (Option 5). These options provide different ways of dealing with the uncertainty of contaminant concentrations in the recovered groundwater. As noted previously, contaminant concentrations (particularly VC) in recovered groundwater are expected to be low because of the low concentrations observed at the edges of the plume and the considerable dilution that would be expected. For this reason, Option 1 may be acceptable from a technical standpoint, but no data would be available to demonstrate this. The remaining options involve greater degrees of monitoring to better evaluate real risks. Disposal of recovered groundwater is constrained by the fact that the IWNF will not accept groundwater recovered from the vicinity of the STAR Center unless it is treated. Therefore, unless DOE wants to pursue a new discharge permit or negotiate arrangements with the county (Option 2), treatment of water will be required. The worker risk assessment concluded that risks from incidental ingestion of water are low and that the potential for contaminants in air to exceed OSHA standards is also low. However, all options other than Option 1 provide for monitoring of air and untreated water to either confirm these conclusions or to trigger a contingency plan requiring increased worker protection. This report does not recommend a particular dewatering option; the options are provided so that DOE can make a decision based on an acceptable level of risk. It may be possible that based on existing data or based on monitoring data obtained in the early stages of the dewatering project, DOE may want to apply different options to different segments of the road construction. For example, none of the wells on the east side of Belcher Avenue had detectable levels of contaminants. DOE may decide that this is ample justification to apply Option 1 for that area, while exercising greater control over other project segments where contaminants were detected. The dewatering options presented in this report apply both to dewatering for the water line replacement along Belcher Road and dewatering for the road construction along Belcher and Bryan Dairy Roads. Currently the water line replacement is scheduled to occur first. If the option selected for the water line replacement dewatering includes the collection of monitoring data (any option other than Option 1), those data may be helpful in selecting the optimum option(s) for dewatering during later road construction activities.
8.0 References ATSDR (Agency for Toxic Substances and Disease Registry), 2006. Toxicological Profile for Vinyl Chloride, U.S. Department of Health and Human Services. EPA (U.S. Environmental Protection Agency), 1991. Risk Assessment Guidance for Superfund: Volume I—Human Health Evaluation Manual (Part B, “Development of Risk-based Preliminary Remediation Goals”), Publication 9285.7-01B, October.

Dewatering Evaluation Report for Road Const. & Water Line Replacement U.S. Department of Energy Doc. No. N0111300 June 2008 Page 32
Figure 1. Water Line Locations Under Belcher Road
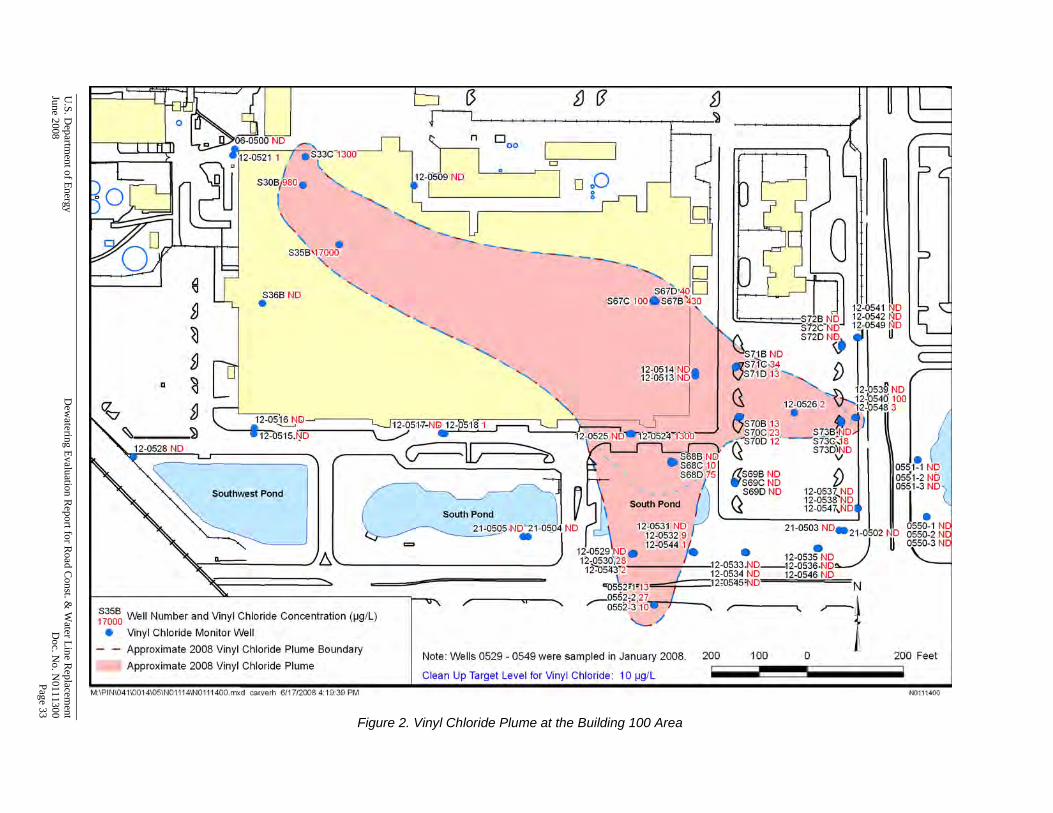
Figure 2. Vinyl Chloride Plume at the Building 100 Area
U.S. D
epartment of E
nergy
Dew
atering Evaluation R
eport for Road C
onst. & W
ater Line R
eplacement
June 2008 D
oc. No. N
0111300
Page 33
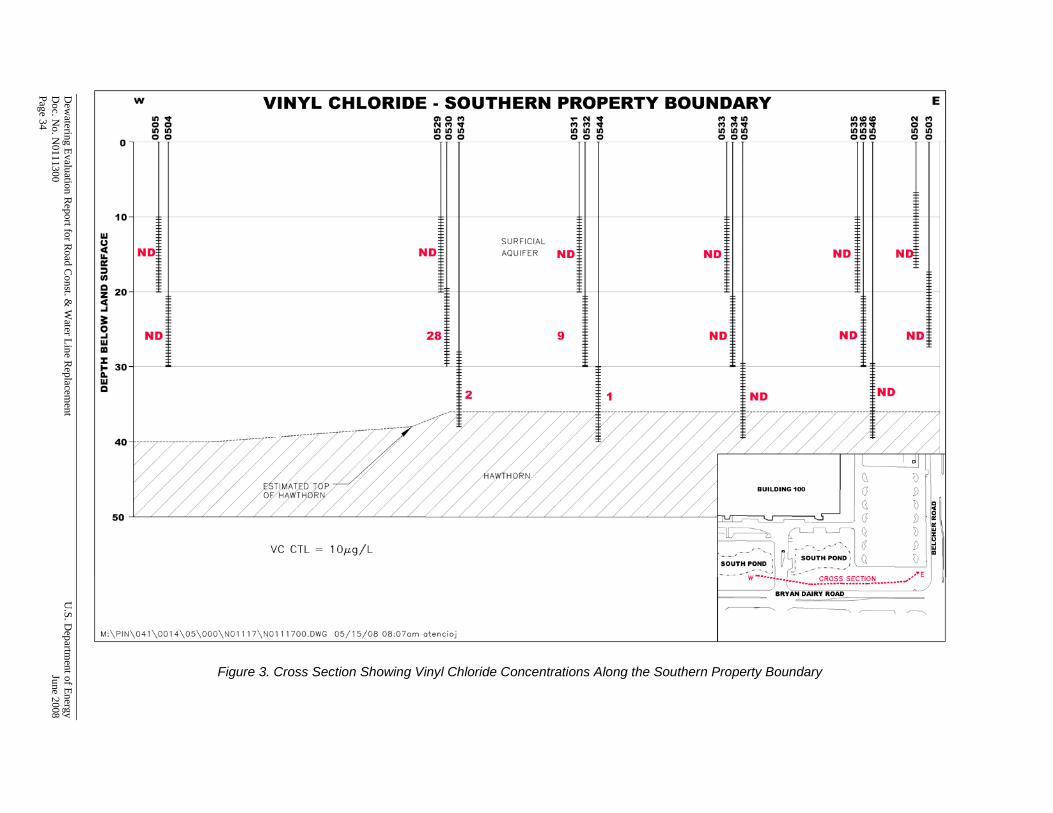
Figure 3. Cross Section Showing Vinyl Chloride Concentrations Along the Southern Property Boundary
Dew
atering Evaluation R
eport for Road C
onst. & W
ater Line R
eplacement
U.S. D
epartment of E
nergy D
oc. No. N
0111300 June 2008
Page 34
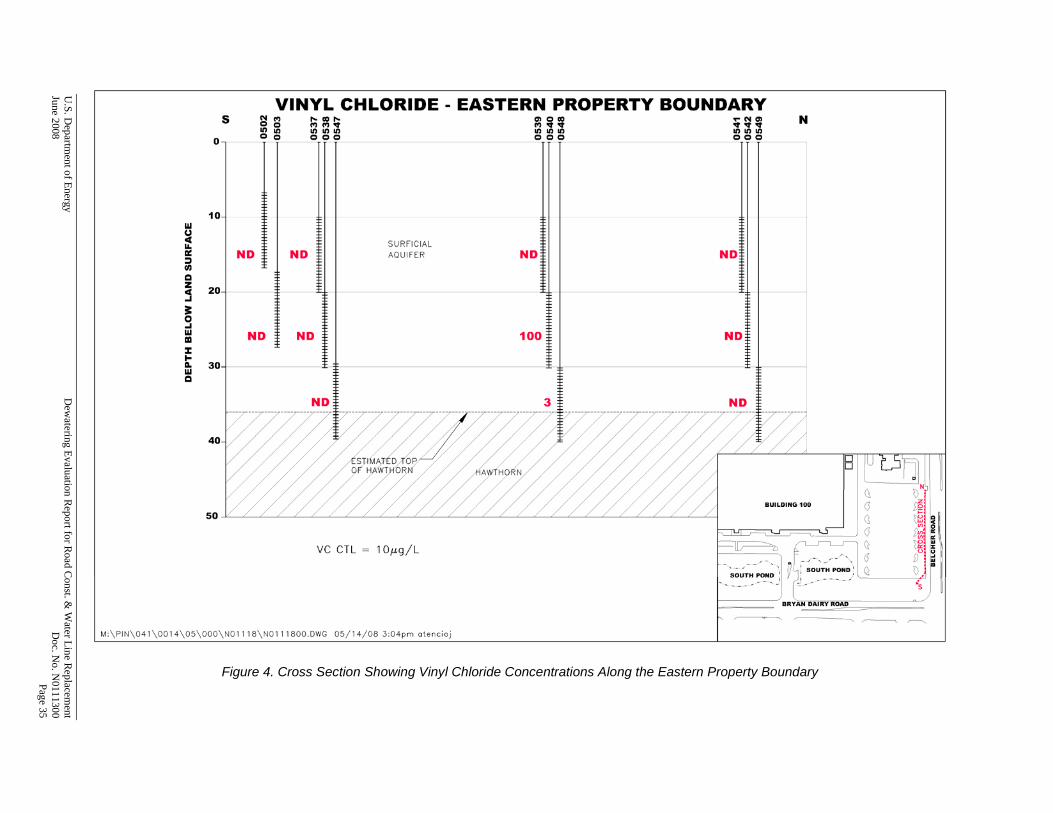
Figure 4. Cross Section Showing Vinyl Chloride Concentrations Along the Eastern Property Boundary
U.S. D
epartment of E
nergy
Dew
atering Evaluation R
eport for Road C
onst. & W
ater Line R
eplacement
June 2008 D
oc. No. N
0111300
Page 35
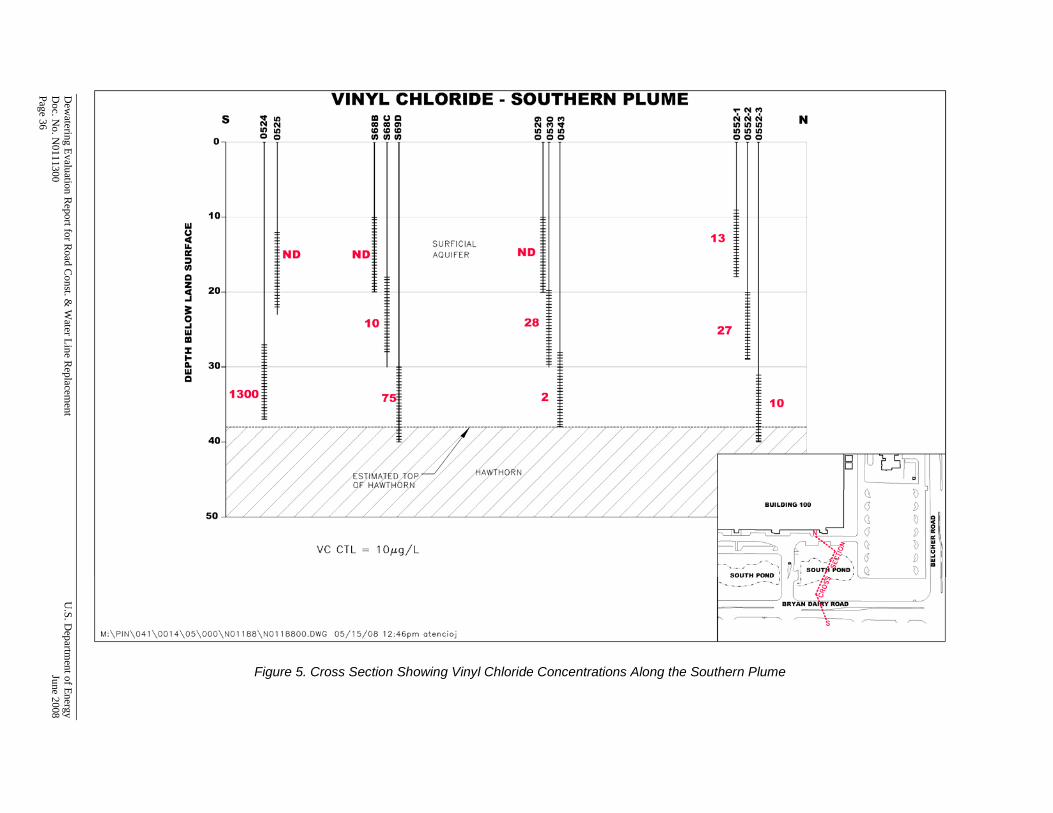
Figure 5. Cross Section Showing Vinyl Chloride Concentrations Along the Southern Plume
Dew
atering Evaluation R
eport for Road C
onst. & W
ater Line R
eplacement
U.S. D
epartment of E
nergy D
oc. No. N
0111300 June 2008
Page 36
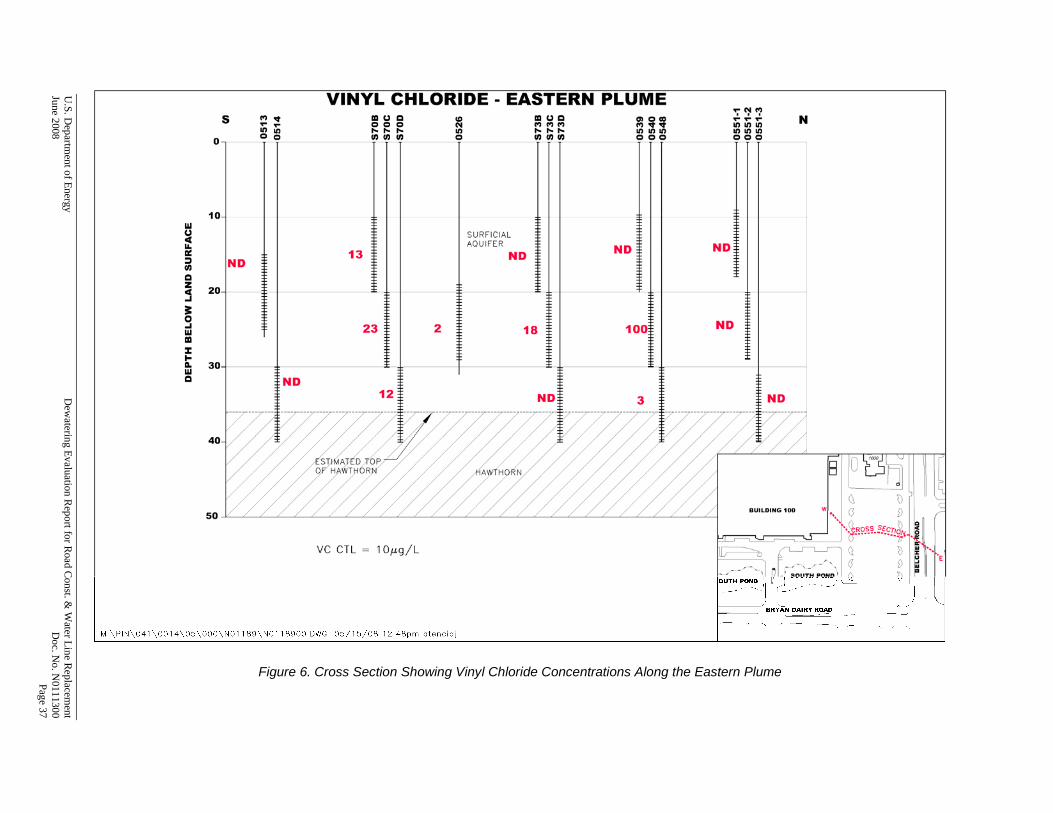
Figure 6. Cross Section Showing Vinyl Chloride Concentrations Along the Eastern Plume
U.S. D
epartment of E
nergy
Dew
atering Evaluation R
eport for Road C
onst. & W
ater Line R
eplacement
June 2008 D
oc. No. N
0111300
Page 37

11
12
12
12
12
13
13
13
13
14
14
14
14
15
15
15
15
500 feet
Belcher R
oad
S-66
S-67
Belcher R
oad
Belcher R
oad
Belcher R
oad
Bryan Dairy Road
11
12
12
12
12
13
13
13
13
14
14
14
14
15
15
15
15
500 feet
Belcher R
oad
S-66
S-67
Belcher R
oad
Belcher R
oad
Belcher R
oad
Bryan Dairy Road
Figure 7. Site-scale View of Model-computed Steady-state Water Levels (ft amsl) due to Dewatering at Structures S-66 and S-67 North of Bryan Dairy Road
Dew
atering Evaluation R
eport for Road C
onst. & W
ater Line R
eplacement
U.S. D
epartment of E
nergy D
oc. No. N
0111300 June 2008
Page 38

8
8
10
10
10
10
12
12 12
12
12
12
12
12 12
12
12
200 feet
South Pond
Bryan Dairy Road
S-66
S-67
Bryan Dairy Road
8
8
10
10
10
10
12
12 12
12
12
12
12
12 12
12
12
200 feet
South Pond
Bryan Dairy Road
S-66
S-67
Bryan Dairy Road
Figure 8. Close-up View of Model-computed Steady-state Water Levels (ft amsl) in Layer 1 due to Dewatering at Structures S-66 and S-67 North
of Bryan Dairy Road
U.S. D
epartment of E
nergy
Dew
atering Evaluation R
eport for Road C
onst. & W
ater Line R
eplacement
June 2008 D
oc. No. N
0111300
Page 39
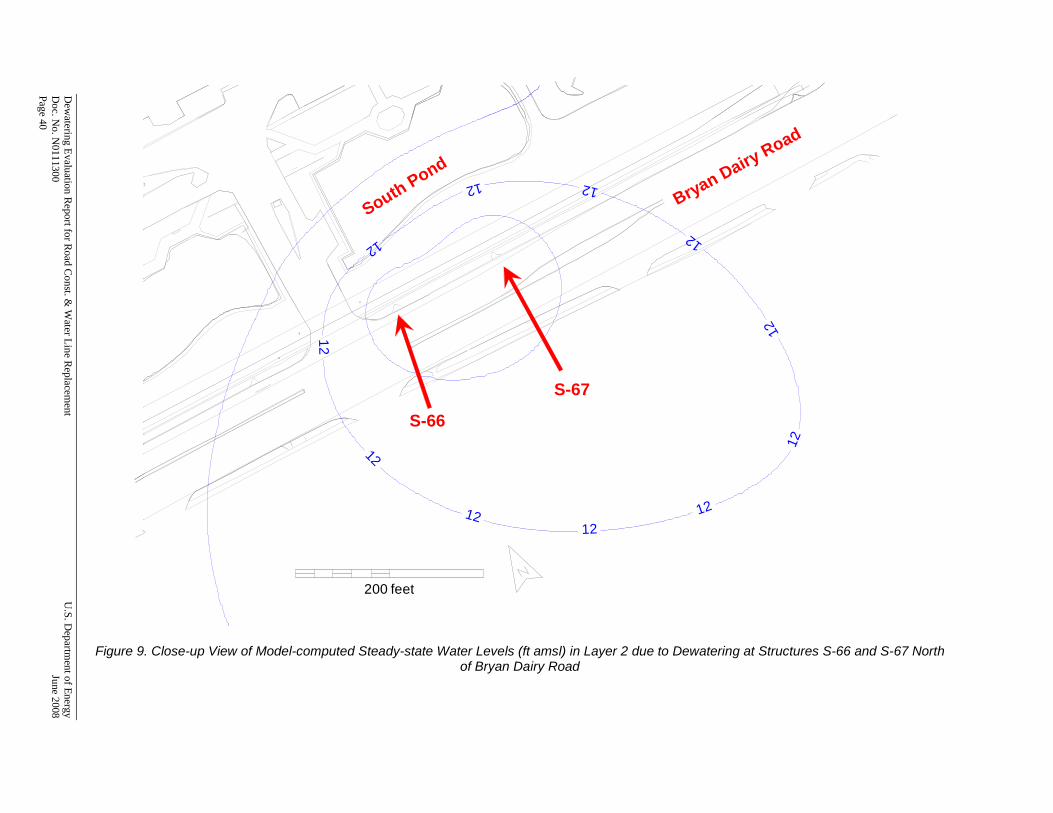
12
12 12
12
12
12
12
12 12
12
12
200 feet
South Pond
Bryan Dairy Road
S-66
S-67
12
12 12
12
12
12
12
12 12
12
12
200 feet
South Pond
Bryan Dairy Road
S-66
S-67
Figure 9. Close-up View of Model-computed Steady-state Water Levels (ft amsl) in Layer 2 due to Dewatering at Structures S-66 and S-67 North
of Bryan Dairy Road
Dew
atering Evaluation R
eport for Road C
onst. & W
ater Line R
eplacement
U.S. D
epartment of E
nergy D
oc. No. N
0111300 June 2008
Page 40
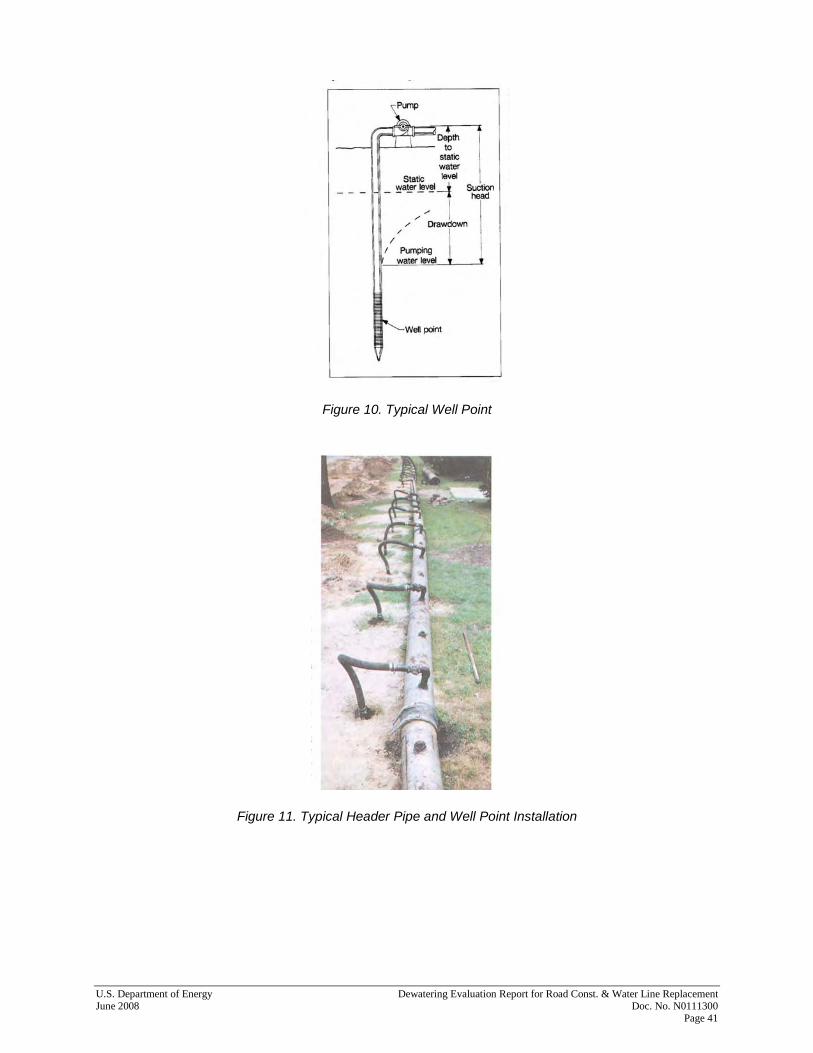
U.S. Department of Energy Dewatering Evaluation Report for Road Const. & Water Line Replacement June 2008 Doc. No. N0111300 Page 41
Figure 10. Typical Well Point
Figure 11. Typical Header Pipe and Well Point Installation

Dewatering Evaluation Report for Road Const. & Water Line Replacement U.S. Department of Energy Doc. No. N0111300 June 2008 Page 42
Figure 12. Overlapping Cone of Depression from Well Points
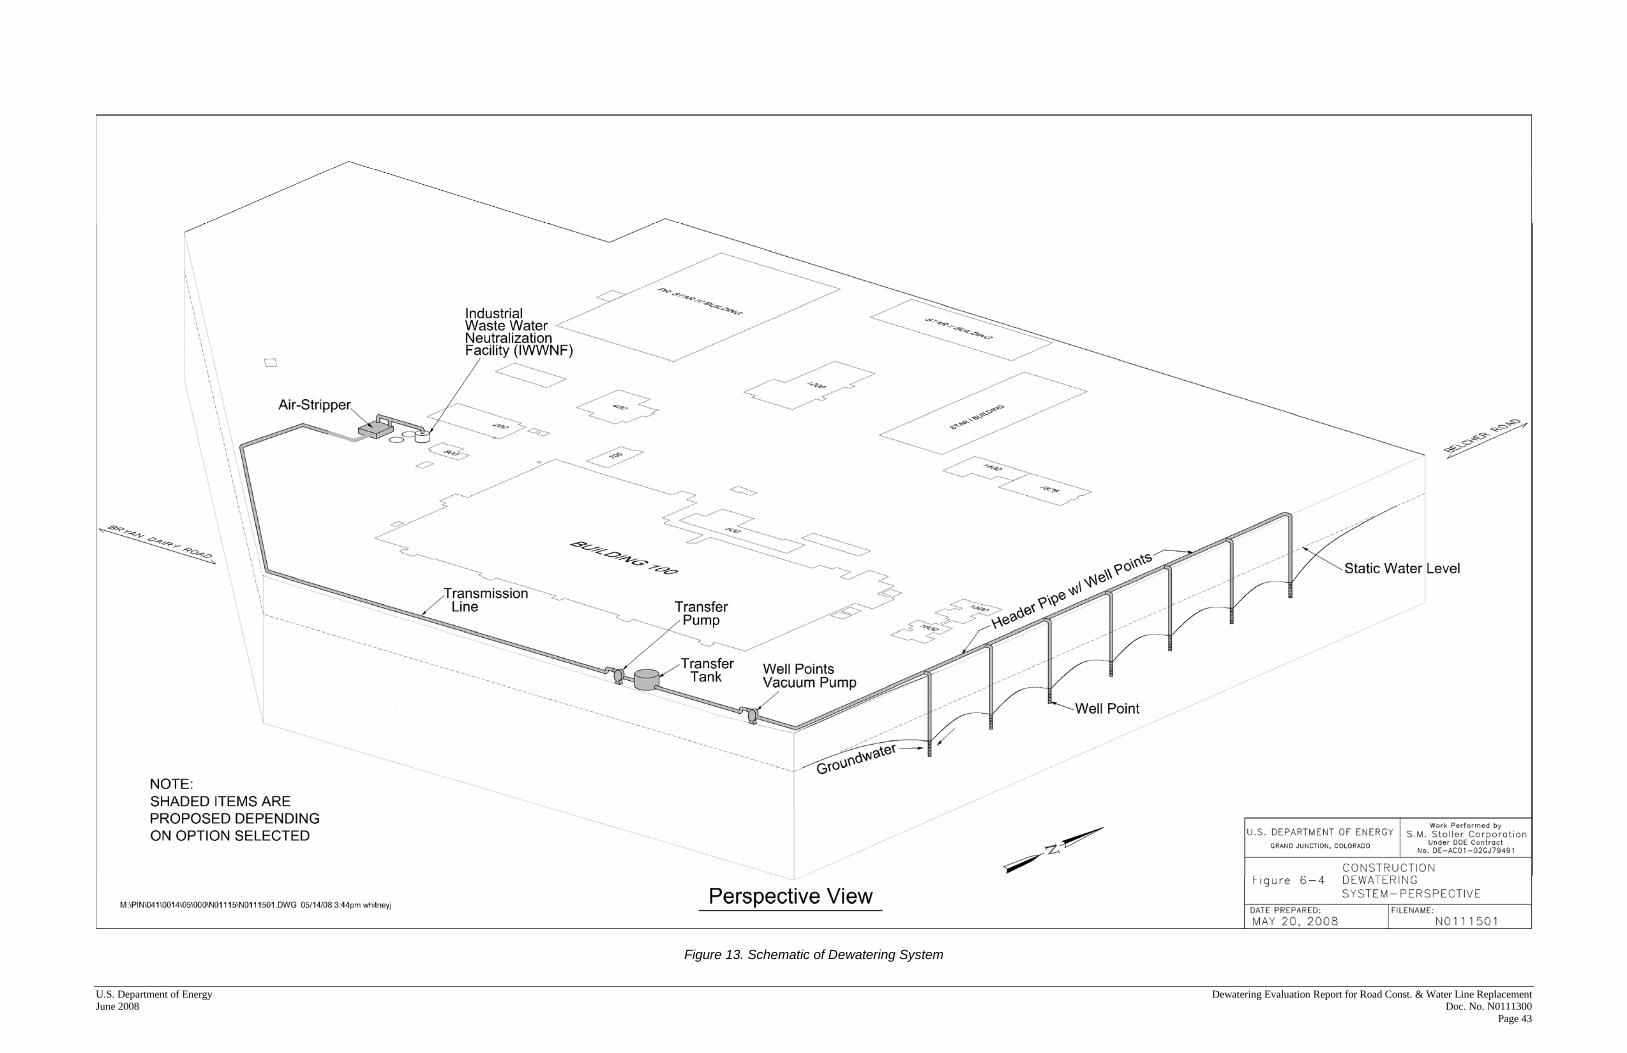
U.S. Department of Energy Dewatering Evaluation Report for Road Const. & Water Line Replacement June 2008 Doc. No. N0111300 Page 43
Figure 13. Schematic of Dewatering System

Dewatering Evaluation Report for Road Const. & Water Line Replacement U.S. Department of Energy Doc. No. N0111300 June 2008 Page 44
This page intentionally left blank
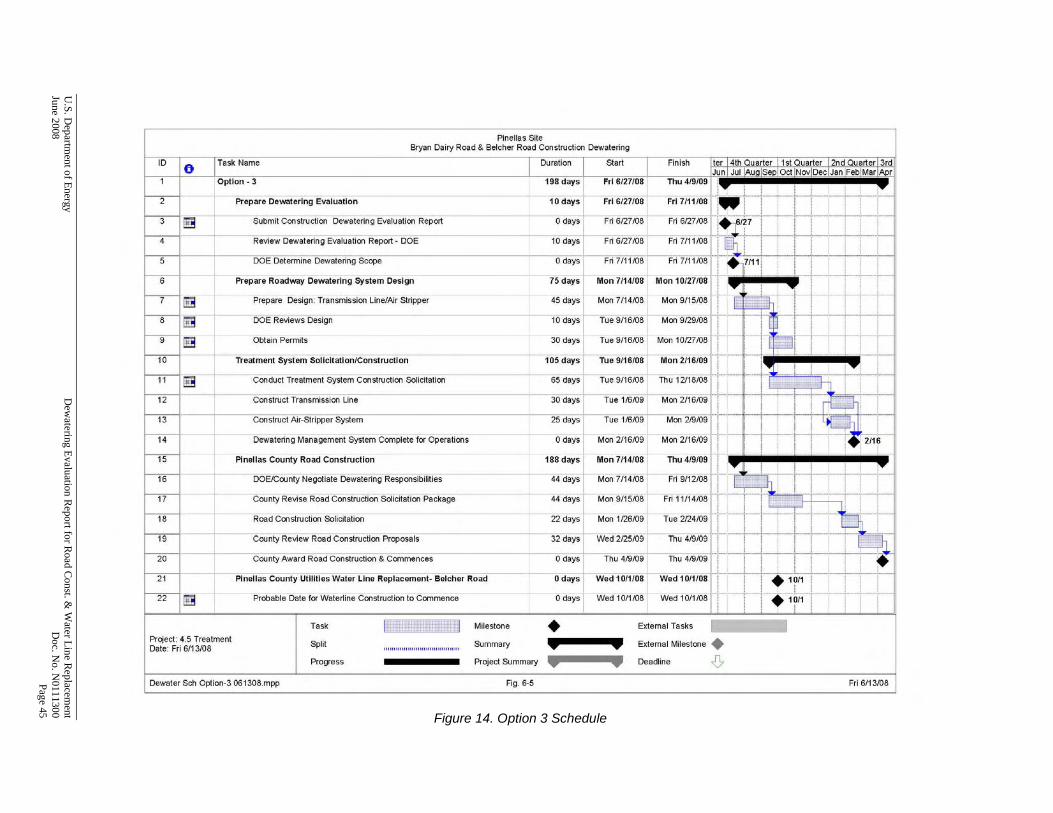
Figure 14. Option 3 Schedule
U.S. D
epartment of E
nergy
Dew
atering Evaluation R
eport for Road C
onst. & W
ater Line R
eplacement
June 2008 D
oc. No. N
0111300
Page 45
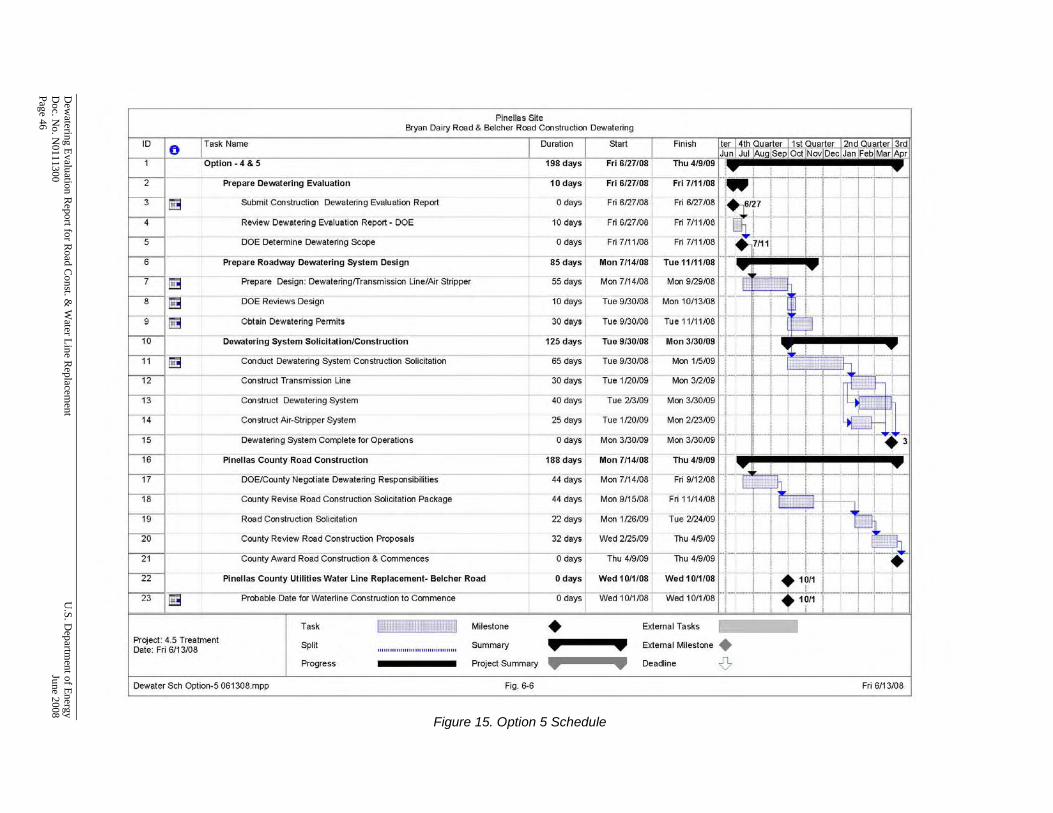
Figure 15. Option 5 Schedule
Dew
atering Evaluation R
eport for Road C
onst. & W
ater Line R
eplacement
U.S. D
epartment of E
nergy D
oc. No. N
0111300 June 2008
Page 46
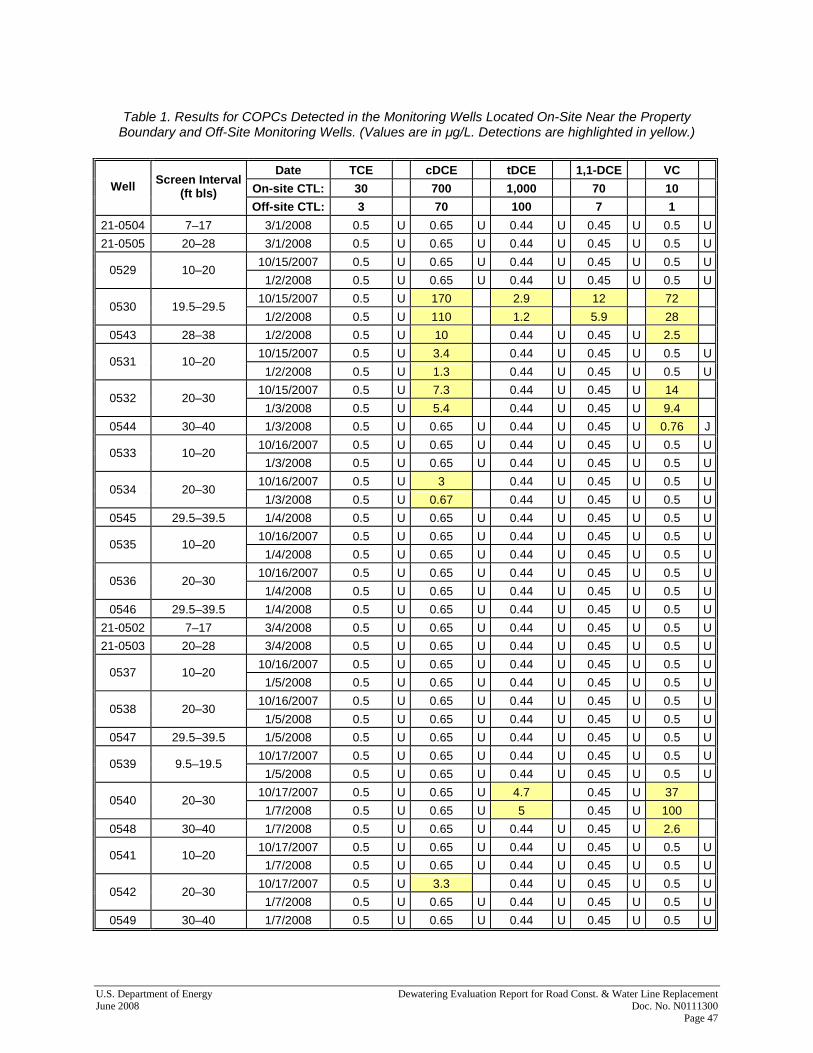
U.S. Department of Energy Dewatering Evaluation Report for Road Const. & Water Line Replacement June 2008 Doc. No. N0111300 Page 47
Table 1. Results for COPCs Detected in the Monitoring Wells Located On-Site Near the Property Boundary and Off-Site Monitoring Wells. (Values are in μg/L. Detections are highlighted in yellow.)
Date TCE cDCE tDCE 1,1-DCE VC
On-site CTL: 30 700 1,000 70 10 Well Screen Interval (ft bls)
Off-site CTL: 3 70 100 7 1
21-0504 7–17 3/1/2008 0.5 U 0.65 U 0.44 U 0.45 U 0.5 U
21-0505 20–28 3/1/2008 0.5 U 0.65 U 0.44 U 0.45 U 0.5 U
10/15/2007 0.5 U 0.65 U 0.44 U 0.45 U 0.5 U 0529 10–20
1/2/2008 0.5 U 0.65 U 0.44 U 0.45 U 0.5 U
10/15/2007 0.5 U 170 2.9 12 72 0530 19.5–29.5
1/2/2008 0.5 U 110 1.2 5.9 28
0543 28–38 1/2/2008 0.5 U 10 0.44 U 0.45 U 2.5
10/15/2007 0.5 U 3.4 0.44 U 0.45 U 0.5 U 0531 10–20
1/2/2008 0.5 U 1.3 0.44 U 0.45 U 0.5 U
10/15/2007 0.5 U 7.3 0.44 U 0.45 U 14 0532 20–30
1/3/2008 0.5 U 5.4 0.44 U 0.45 U 9.4
0544 30–40 1/3/2008 0.5 U 0.65 U 0.44 U 0.45 U 0.76 J
10/16/2007 0.5 U 0.65 U 0.44 U 0.45 U 0.5 U 0533 10–20
1/3/2008 0.5 U 0.65 U 0.44 U 0.45 U 0.5 U
10/16/2007 0.5 U 3 0.44 U 0.45 U 0.5 U 0534 20–30
1/3/2008 0.5 U 0.67 0.44 U 0.45 U 0.5 U
0545 29.5–39.5 1/4/2008 0.5 U 0.65 U 0.44 U 0.45 U 0.5 U
10/16/2007 0.5 U 0.65 U 0.44 U 0.45 U 0.5 U 0535 10–20
1/4/2008 0.5 U 0.65 U 0.44 U 0.45 U 0.5 U
10/16/2007 0.5 U 0.65 U 0.44 U 0.45 U 0.5 U 0536 20–30
1/4/2008 0.5 U 0.65 U 0.44 U 0.45 U 0.5 U
0546 29.5–39.5 1/4/2008 0.5 U 0.65 U 0.44 U 0.45 U 0.5 U
21-0502 7–17 3/4/2008 0.5 U 0.65 U 0.44 U 0.45 U 0.5 U
21-0503 20–28 3/4/2008 0.5 U 0.65 U 0.44 U 0.45 U 0.5 U
10/16/2007 0.5 U 0.65 U 0.44 U 0.45 U 0.5 U 0537 10–20
1/5/2008 0.5 U 0.65 U 0.44 U 0.45 U 0.5 U
10/16/2007 0.5 U 0.65 U 0.44 U 0.45 U 0.5 U 0538 20–30
1/5/2008 0.5 U 0.65 U 0.44 U 0.45 U 0.5 U
0547 29.5–39.5 1/5/2008 0.5 U 0.65 U 0.44 U 0.45 U 0.5 U
10/17/2007 0.5 U 0.65 U 0.44 U 0.45 U 0.5 U 0539 9.5–19.5
1/5/2008 0.5 U 0.65 U 0.44 U 0.45 U 0.5 U
10/17/2007 0.5 U 0.65 U 4.7 0.45 U 37 0540 20–30
1/7/2008 0.5 U 0.65 U 5 0.45 U 100
0548 30–40 1/7/2008 0.5 U 0.65 U 0.44 U 0.45 U 2.6
10/17/2007 0.5 U 0.65 U 0.44 U 0.45 U 0.5 U 0541 10–20
1/7/2008 0.5 U 0.65 U 0.44 U 0.45 U 0.5 U
10/17/2007 0.5 U 3.3 0.44 U 0.45 U 0.5 U 0542 20–30
1/7/2008 0.5 U 0.65 U 0.44 U 0.45 U 0.5 U
0549 30–40 1/7/2008 0.5 U 0.65 U 0.44 U 0.45 U 0.5 U
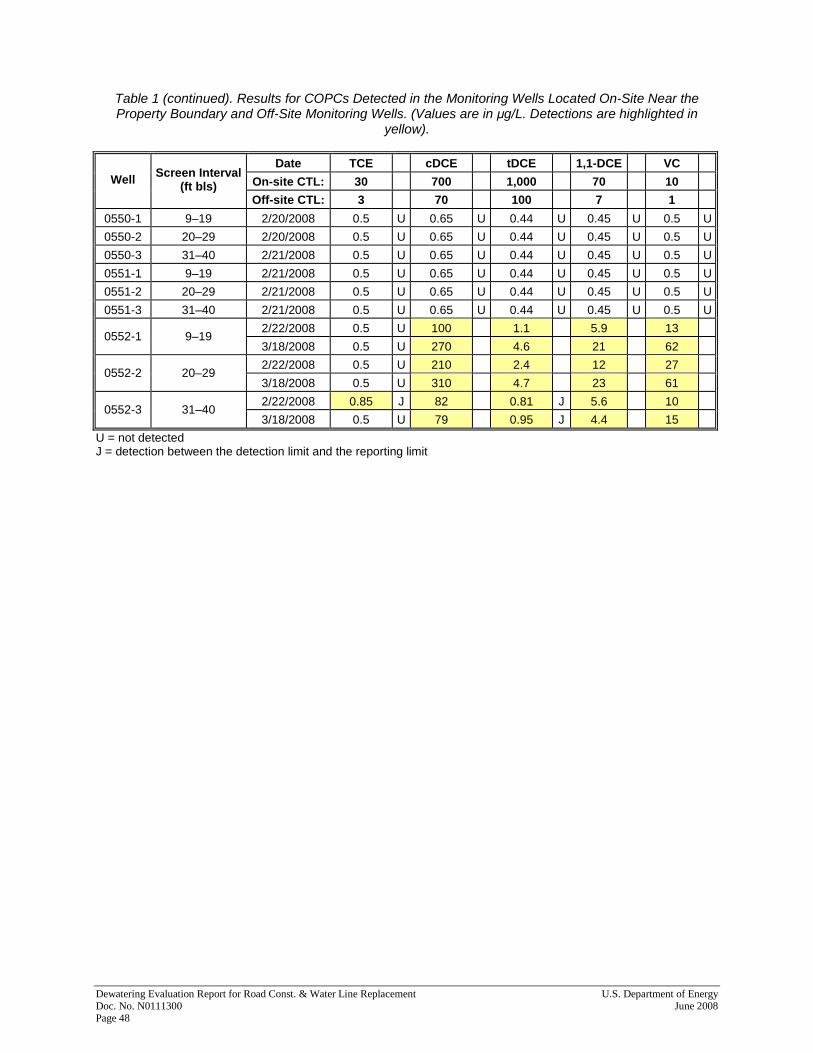
Table 1 (continued). Results for COPCs Detected in the Monitoring Wells Located On-Site Near the Property Boundary and Off-Site Monitoring Wells. (Values are in μg/L. Detections are highlighted in
yellow).
Dewatering Evaluation Report for Road Const. & Water Line Replacement U.S. Department of Energy Doc. No. N0111300 June 2008 Page 48
Date TCE cDCE tDCE 1,1-DCE VC
On-site CTL: 30 700 1,000 70 10 Well Screen Interval (ft bls)
Off-site CTL: 3 70 100 7 1
0550-1 9–19 2/20/2008 0.5 U 0.65 U 0.44 U 0.45 U 0.5 U
0550-2 20–29 2/20/2008 0.5 U 0.65 U 0.44 U 0.45 U 0.5 U
0550-3 31–40 2/21/2008 0.5 U 0.65 U 0.44 U 0.45 U 0.5 U
0551-1 9–19 2/21/2008 0.5 U 0.65 U 0.44 U 0.45 U 0.5 U
0551-2 20–29 2/21/2008 0.5 U 0.65 U 0.44 U 0.45 U 0.5 U
0551-3 31–40 2/21/2008 0.5 U 0.65 U 0.44 U 0.45 U 0.5 U
2/22/2008 0.5 U 100 1.1 5.9 13 0552-1 9–19
3/18/2008 0.5 U 270 4.6 21 62
2/22/2008 0.5 U 210 2.4 12 27 0552-2 20–29
3/18/2008 0.5 U 310 4.7 23 61
2/22/2008 0.85 J 82 0.81 J 5.6 10 0552-3 31–40
3/18/2008 0.5 U 79 0.95 J 4.4 15
U = not detected J = detection between the detection limit and the reporting limit

U.S. Department of Energy Dewatering Evaluation Report for Road Const. & Water Line Replacement June 2008 Doc. No. N0111300 Page 49
Table 2. Summary of Modeling Simulations
Assumed
Contaminant Concentrationb
(μg/L)
Estimated Discharge
Concentrationc (μg/L)
Simulation Number
Construction Elements Location
Per-Well Pumping
Ratesa (gpm)
Total Pumping
Ratea
(gpm) cis-DCE VC cis-DCE VC
1 Structures S-66 and S-67
North Side of Bryan Dairy Road 0.25−0.3 8.3 210 27 69 9
2 Structure S-75 North Side of Bryan Dairy Road 0.125 2 0 0 0 0
3 480 ft of 6-inch-Diameter Drain
Pipe
North Side of Bryan Dairy Road
0.15−0.2 12 210 27 69 9
4
Structures S-70, S-71, S-72, and
S-73 and 480 ft of 24-inch-diameter
pipe
South Side of Bryan Dairy Road
0.08−0.2 12.6 210 27 69 9
5
Structures S-208 and S-209 and
120 ft of 14-inch-diameter pipe
West Side of Belcher Road 0.125−0.15 4.14 34 100 11 33
6 360 ft of 6-inch-diameter drain pipe
West Side of Belcher Road 0.15 5.25 34 100 11 33
7 Structure S-210 East Side of Belcher Road 0.175 1.8 0 0 0 0
8 440 ft of 6-inch-diameter drain pipe
East Side of Belcher Road
0.1−0.125 8 0 0 0 0
aPumping rates are steady-state values. Actual rates are expected to be larger at the start of pumping. bAssumed contaminant concentrations are conservatively large and based on recently measured values at nearby wells. cEstimated discharge concentration assumes that one-third of pumping volume is contaminated and two-thirds is uncontaminated.
Table 3. Worker Exposure Calculations for Groundwater Ingestion Default equation for ingestion of water (EPA 1991): Risk-based concentration (mg/L) = (TR x BW x AT x 365 days/yr)/(EF x ED x Sfo x IRw) TR = target risk = 1x10⁻⁶ BW = body weight (default adult) =70 kg AT = averaging time (lifetime) = 70 yr EF = exposure frequency = 100 day/yr ED = exposure duration = 1 yr SFo = cancer slope factor for ingestion (vinyl chloride) = 0.72 IRw = ingestion rate of contaminated water = 0.2 L/day Risk-based concentration of vinyl chloride for incidental ingestion of water (mg/L) = 0.124 mg/L (124 μg/L)
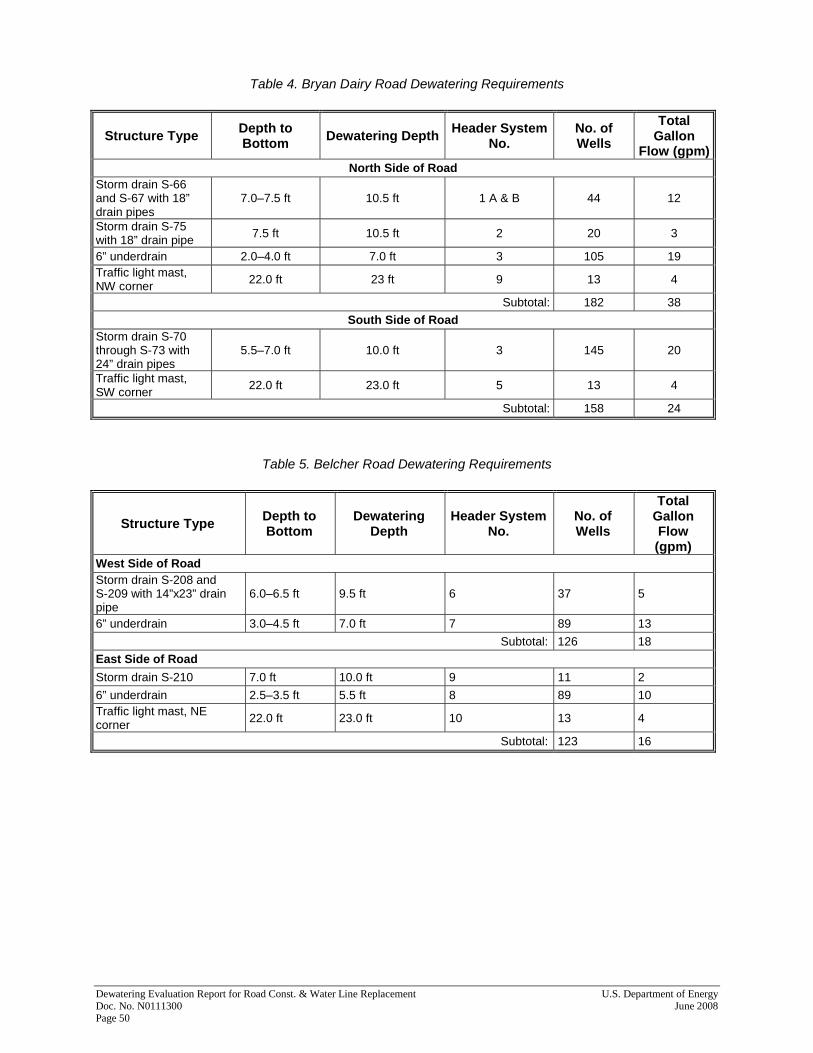
Dewatering Evaluation Report for Road Const. & Water Line Replacement U.S. Department of Energy Doc. No. N0111300 June 2008 Page 50
Table 4. Bryan Dairy Road Dewatering Requirements
Structure Type Depth to Bottom Dewatering Depth Header System
No. No. of Wells
Total Gallon
Flow (gpm) North Side of Road
Storm drain S-66 and S-67 with 18” drain pipes
7.0–7.5 ft 10.5 ft 1 A & B 44 12
Storm drain S-75 with 18” drain pipe 7.5 ft 10.5 ft 2 20 3
6” underdrain 2.0–4.0 ft 7.0 ft 3 105 19 Traffic light mast, NW corner 22.0 ft 23 ft 9 13 4
Subtotal: 182 38
South Side of Road Storm drain S-70 through S-73 with 24” drain pipes
5.5–7.0 ft 10.0 ft 3 145 20
Traffic light mast, SW corner
22.0 ft 23.0 ft 5 13 4
Subtotal: 158 24
Table 5. Belcher Road Dewatering Requirements
Structure Type Depth to Bottom
Dewatering Depth
Header System No.
No. of Wells
Total Gallon Flow (gpm)
West Side of Road Storm drain S-208 and S-209 with 14”x23” drain pipe
6.0–6.5 ft 9.5 ft 6 37 5
6” underdrain 3.0–4.5 ft 7.0 ft 7 89 13
Subtotal: 126 18
East Side of Road
Storm drain S-210 7.0 ft 10.0 ft 9 11 2
6” underdrain 2.5–3.5 ft 5.5 ft 8 89 10 Traffic light mast, NE corner 22.0 ft 23.0 ft 10 13 4
Subtotal: 123 16

U.S. Department of Energy Dewatering Evaluation Report for Road Const. & Water Line Replacement June 2008 Doc. No. N0111300 Page 51
Table 6. Option 3: Construction Cost Estimate Comparison
Task Near-Side and Far-Side Streets
WWNA Transfer Line $68,000
Air Stripper System $73,000
Total Construction Cost: $141,000
Table 7. Option 3: Operation Cost Estimate Comparison
Task Near-Side and Far-Side Streets Dewatering System Operations $0
WWNA Discharge Operations $26,000
Total Operation Cost: $26,000
Table 8. Option 3: Construction and Operation Cost Estimate Comparison
Task Near-Side and Far-Side Streets Construction Cost Estimate $141,000
Operation Cost Estimate $26,000
Total Cost Estimate: $166,000
Table 9. Option 4: Operation Cost Estimate Comparison
Task Near-Side and Far-Side Streets Dewatering System Operations $0
WWNA Discharge Operations $26,000
Total Operation Cost: $26,000
Table 10. Option 4: Construction and Operation Cost Estimate Comparison
Task Near-Side and Far-Side Streets Construction Cost Estimate $231,000
Operation Cost Estimate $26,000
Total Cost Estimate: $257,000
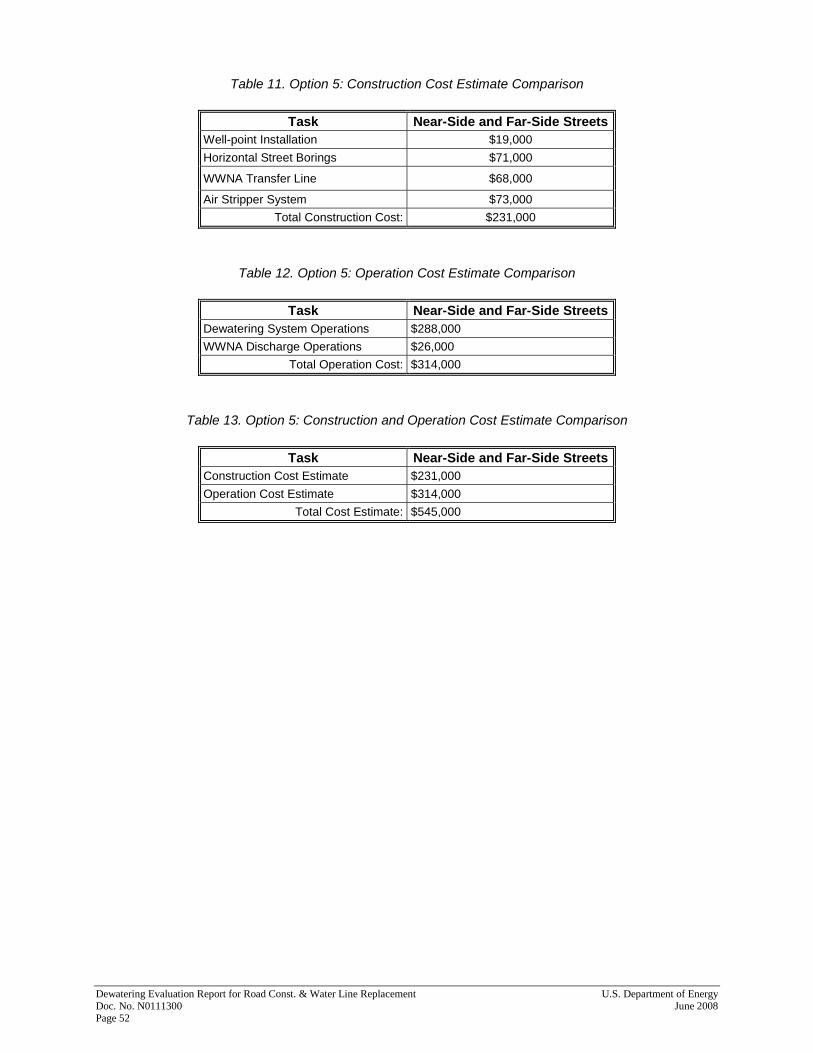
Dewatering Evaluation Report for Road Const. & Water Line Replacement U.S. Department of Energy Doc. No. N0111300 June 2008 Page 52
Table 11. Option 5: Construction Cost Estimate Comparison
Task Near-Side and Far-Side Streets Well-point Installation $19,000
Horizontal Street Borings $71,000
WWNA Transfer Line $68,000
Air Stripper System $73,000
Total Construction Cost: $231,000
Table 12. Option 5: Operation Cost Estimate Comparison
Task Near-Side and Far-Side Streets Dewatering System Operations $288,000
WWNA Discharge Operations $26,000
Total Operation Cost: $314,000
Table 13. Option 5: Construction and Operation Cost Estimate Comparison
Task Near-Side and Far-Side Streets Construction Cost Estimate $231,000
Operation Cost Estimate $314,000
Total Cost Estimate: $545,000

U.S. Department of Energy Dewatering Evaluation Report for Road Const. & Water Line Replacement June 2008 Doc. No. N0111300 Page 53
Table 14. Summary of Belcher and Bryan Dairy Road Dewatering Options
Option County Worker Risk Regulatory Risk Contingency
Plan(s) Cost Other Considerations
1⎯No Action Likely to be low based on existing groundwater data, but will be unverified; no information to refute potential future worker claims; county may refuse to accept this option without funding to use contractor trained for hazardous materials handling.
Storm sewer disposal criteria probably will be met, but no data available to verify. Probably no real risk to storm water system, but perception could be otherwise.
None. No cost for construction activities; potential other costs in future.
Easy to implement; high risk for future DOE liabilities.
2—DOE Monitors Effluent; potential contingency plan in place for effluent disposal.
Probably low based on existing groundwater data. Monitoring of effluent as it is recovered could be used to determine potential exposures and whether personal protective equipment required (there will be a time lag before analyses obtained).
Effluent would be sampled as disposed of in storm sewer. If results indicate disposal criteria are not met, contingency action would be required. Improper disposal of water exceeding criteria could occur before analytical results are obtained. Penalties of some sort could result. Minimizes amount of water to be treated.
Contingency plan for water treatment if regulatory criteria exceeded; contingency plan for worker exposure if breathing zone monitoring exceeds threshold.
Analytical costs only. Potential contingency infrastructure: $ 141,000.
Likely requires a new permit for disposal of untreated water in the storm sewer system or other permission from the county.
3—DOE Manages Effluent; effluent assumed to be contaminated
Probably low based on existing groundwater data. Risks during construction and operation are controlled through monitoring. Monitoring of pretreatment effluent could be used to determine potential exposures, though results would be obtained after the fact.
All effluent would be treated and monitoring would ensure IWNF disposal criteria are met. May result in treatment of more water than necessary.
Contingency plan for worker exposure if breathing zone monitoring exceeds threshold.
$236,000 IWNF will not allow disposal without treatment; disposal elsewhere would require a new permit.
4—DOE Installs System, Manages Effluent.
Eliminates risk associated with construction. Operation risks probably low based on existing groundwater data; controlled through monitoring. Monitoring of pretreatment effluent could be used to determine potential exposures, though results would be obtained after the fact.
All effluent would be treated and monitoring would ensure IWNF disposal criteria are met. May result in treatment of more water than necessary.
Contingency plan for worker exposure if breathing zone monitoring exceeds threshold.
$326,000 DOE can exercise greater control over plume; would require much coordination with county and road construction contractor.
5—DOE Installs and Operates System and Manages Effluent.
Eliminates all potential exposures of Pinellas County contractor to contaminated water.
All effluent would be treated and monitoring would ensure IWNF disposal criteria are met. May result in treatment of more water than necessary.
Not required for Pinellas County contractor.
$614,000 Requires coordination with county and road construction contractor.

Dewatering Evaluation Report for Road Const. & Water Line Replacement U.S. Department of Energy Doc. No. N0111300 June 2008 Page 54
End of current text