Embed Size (px)
Citation preview
INVESTOR PRESENTATION
Q4FY15 Update
2
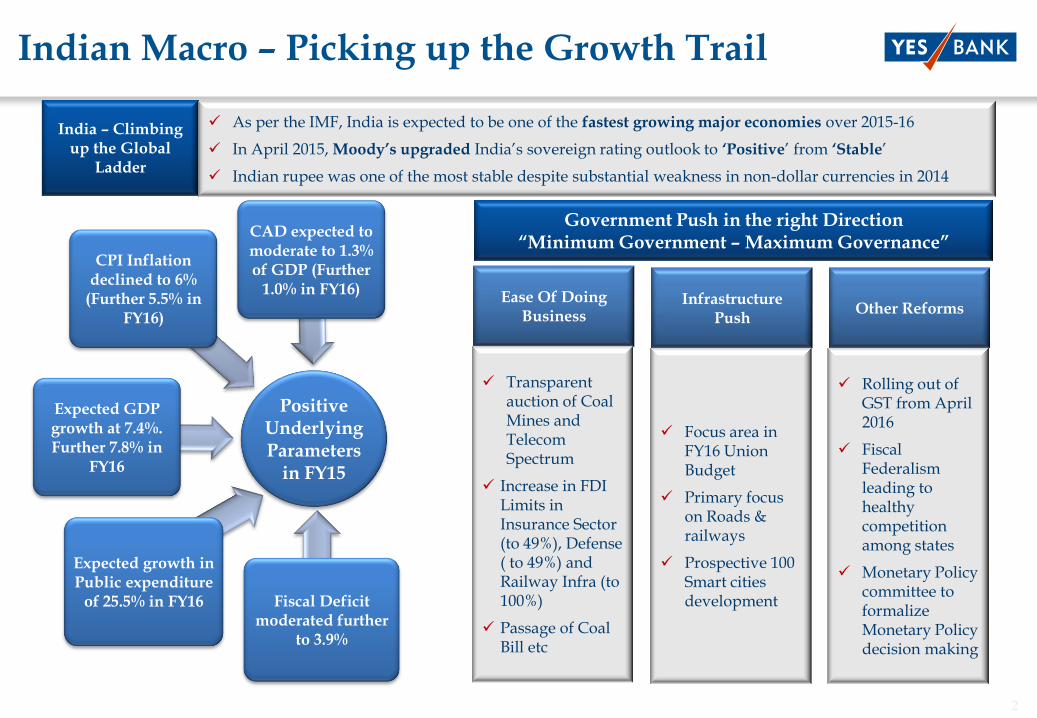
Indian Macro – Picking up the Growth Trail
India – Climbing up the Global
Ladder
As per the IMF, India is expected to be one of the fastest growing major economies over 2015-16
In April 2015, Moody‟s upgraded India‘s sovereign rating outlook to „Positive‘ from „Stable‘
Indian rupee was one of the most stable despite substantial weakness in non-dollar currencies in 2014
Positive Underlying Parameters
in FY15
Expected GDP growth at 7.4%. Further 7.8% in
FY16
CPI Inflation declined to 6%
(Further 5.5% in FY16)
CAD expected to moderate to 1.3% of GDP (Further
1.0% in FY16)
Fiscal Deficit moderated further
to 3.9%
Expected growth in Public expenditure
of 25.5% in FY16
Government Push in the right Direction“Minimum Government – Maximum Governance”
Ease Of Doing Business
Transparent auction of Coal Mines and Telecom Spectrum
Increase in FDI Limits in Insurance Sector (to 49%), Defense ( to 49%) and Railway Infra (to 100%)
Passage of Coal Bill etc
Infrastructure Push
Focus area in FY16 Union Budget
Primary focus on Roads & railways
Prospective 100 Smart cities development
Other Reforms
Rolling out of GST from April 2016
Fiscal Federalism leading to healthy competition among states
Monetary Policy committee to formalize Monetary Policy decision making
3
Indian Economy on a Stronger Footing
2
4
6
8
10
20
08
20
09
20
10
20
11
20
12
20
13
20
14
20
15
20
16
20
17
20
18
20
19
20
20
China
India
Emerging & developing economies
Source: IMF
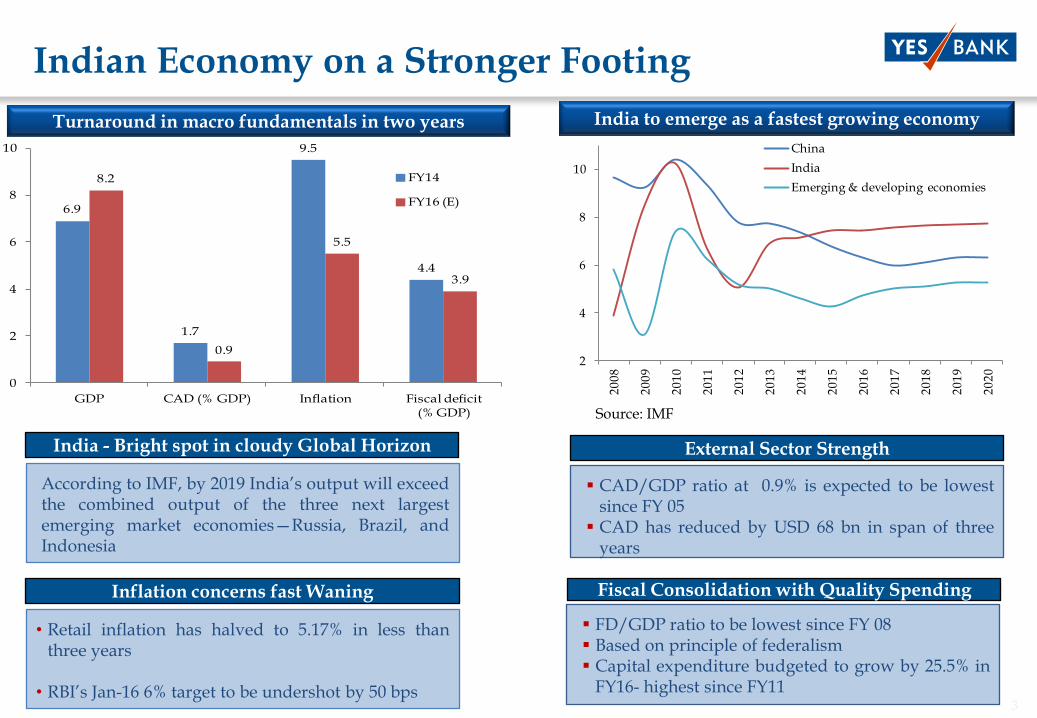
According to IMF, by 2019 India‘s output will exceedthe combined output of the three next largestemerging market economies—Russia, Brazil, andIndonesia
India - Bright spot in cloudy Global Horizon
Turnaround in macro fundamentals in two years India to emerge as a fastest growing economy
CAD/GDP ratio at 0.9% is expected to be lowestsince FY 05 CAD has reduced by USD 68 bn in span of three
years
External Sector Strength
• Retail inflation has halved to 5.17% in less thanthree years
• RBI‘s Jan-16 6% target to be undershot by 50 bps
Inflation concerns fast Waning
FD/GDP ratio to be lowest since FY 08 Based on principle of federalism Capital expenditure budgeted to grow by 25.5% in
FY16- highest since FY11
Fiscal Consolidation with Quality Spending
6.9
1.7
9.5
4.4
8.2
0.9
5.5
3.9
0
2
4
6
8
10
GDP CAD (% GDP) Inflation Fiscal deficit (% GDP)
FY14
FY16 (E)
4
5
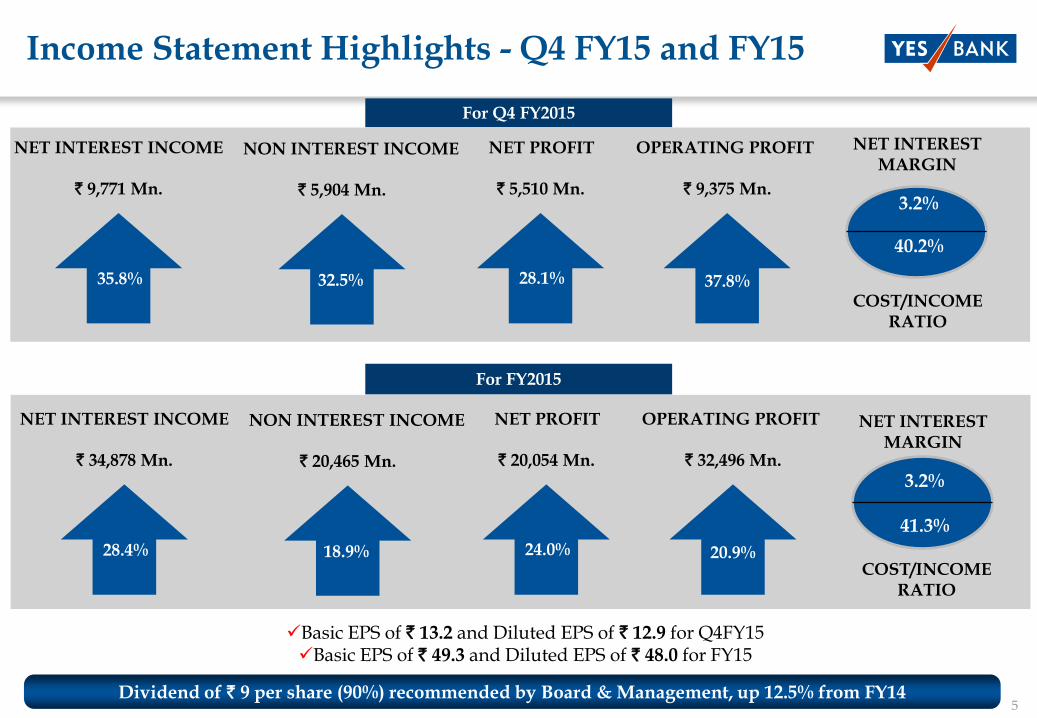
Income Statement Highlights - Q4 FY15 and FY15
NET INTEREST INCOME
35.8%
` 9,771 Mn.
NON INTEREST INCOME
32.5%
` 5,904 Mn.
OPERATING PROFIT
37.8%
` 9,375 Mn.
Basic EPS of ` 13.2 and Diluted EPS of ` 12.9 for Q4FY15Basic EPS of ` 49.3 and Diluted EPS of ` 48.0 for FY15
Satisfactory growth with steady NIM & strong momentum on SA continues
NET PROFIT
28.1%
` 5,510 Mn.
NET INTEREST MARGIN
3.2%
COST/INCOME RATIO
40.2%
NET INTEREST INCOME
28.4%
` 34,878 Mn.
NON INTEREST INCOME
18.9%
` 20,465 Mn.
OPERATING PROFIT
20.9%
` 32,496 Mn.
NET PROFIT
24.0%
` 20,054 Mn.
NET INTEREST MARGIN
3.2%
COST/INCOME RATIO
41.3%
For Q4 FY2015
For FY2015
Dividend of ` 9 per share (90%) recommended by Board & Management, up 12.5% from FY14
6
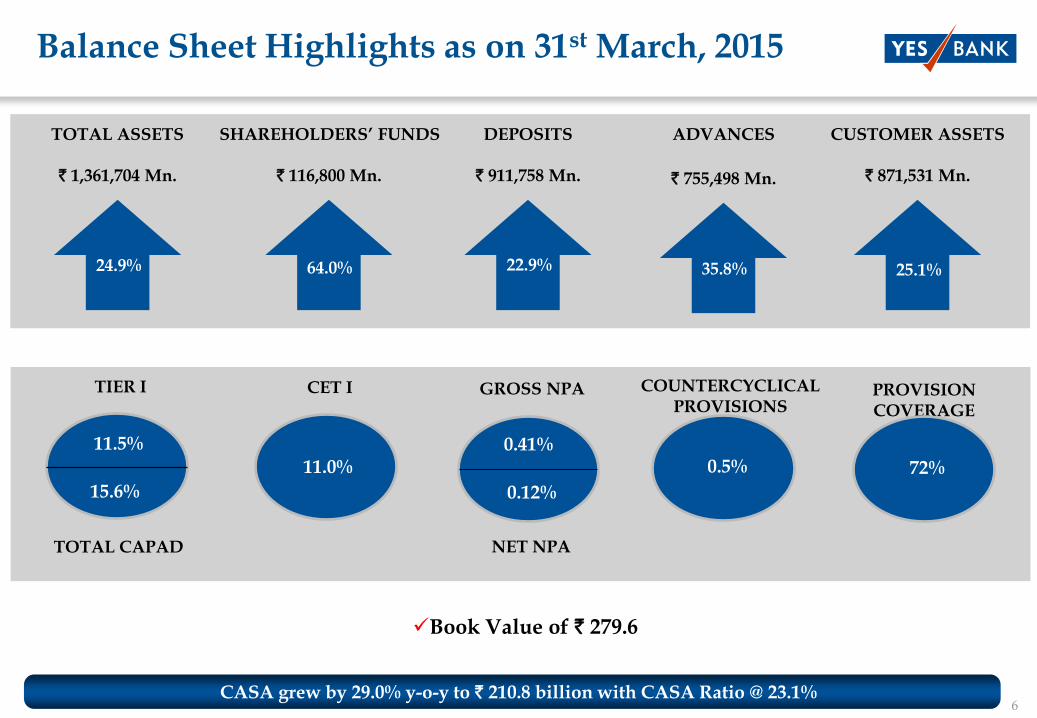
Balance Sheet Highlights as on 31st March, 2015
TOTAL ASSETS
24.9%
` 1,361,704 Mn.
DEPOSITS
22.9%
` 911,758 Mn.
TIER I
11.5%
NET NPA
GROSS NPA
0.12%
0.41%
PROVISION COVERAGE
72%
Book Value of ` 279.6
0.5%
COUNTERCYCLICAL PROVISIONS
Satisfactory growth with steady NIM & strong momentum on SA continues
ADVANCES
35.8%
` 755,498 Mn.
SHAREHOLDERS‟ FUNDS
64.0%
` 116,800 Mn.
CUSTOMER ASSETS
25.1%
` 871,531 Mn.
CET I
11.0%
CASA grew by 29.0% y-o-y to ` 210.8 billion with CASA Ratio @ 23.1%
TOTAL CAPAD
15.6%

7
-
50
100
150
200
250
-
200
400
600
800
1,000
Mar-14 Jun-14 Sep-14 Dec-14 Mar-15
Liabilities
Deposits (LHS) CASA (RHS)
-
200
400
600
800
1,000
Mar-14 Jun-14 Sep-14 Dec-14 Mar-15
Assets
Advances Customer Assets
24.3%21.6%
18.0% 19.2% 19.0%
0.0%
5.0%
10.0%
15.0%
20.0%
25.0%
30.0%
Q4FY14 Q1FY15 Q2FY15 Q3FY15 Q4FY15
Return on Equity (RoE)
1.6% 1.6%1.7%
1.8%1.7%
0.0%
0.5%
1.0%
1.5%
2.0%
Q4FY14 Q1FY15 Q2FY15 Q3FY15 Q4FY15
Return on Assets (RoA)
Key Metrics (Trend leading to Q4 FY15)
` billion ` billion
3.0% 3.0%3.2% 3.2% 3.2%
0.0%
0.5%
1.0%
1.5%
2.0%
2.5%
3.0%
3.5%
Q4FY14 Q1FY15 Q2FY15 Q3FY15 Q4FY15
Net Interest Margin (NIM)
Business performance over challenging Macro environment demonstrates resilience of the Bank in delivering consistent performance
QIP – US$ 500 Mn.
197.5
252.9 264.3 277.2 279.6
-
50
100
150
200
250
300
Mar-14 Jun-14 Sep-14 Dec-14 Mar-15
BVPSQIP – US$
500 Mn.
8
Income Statement Highlights – Q4FY15 & FY15
Steady
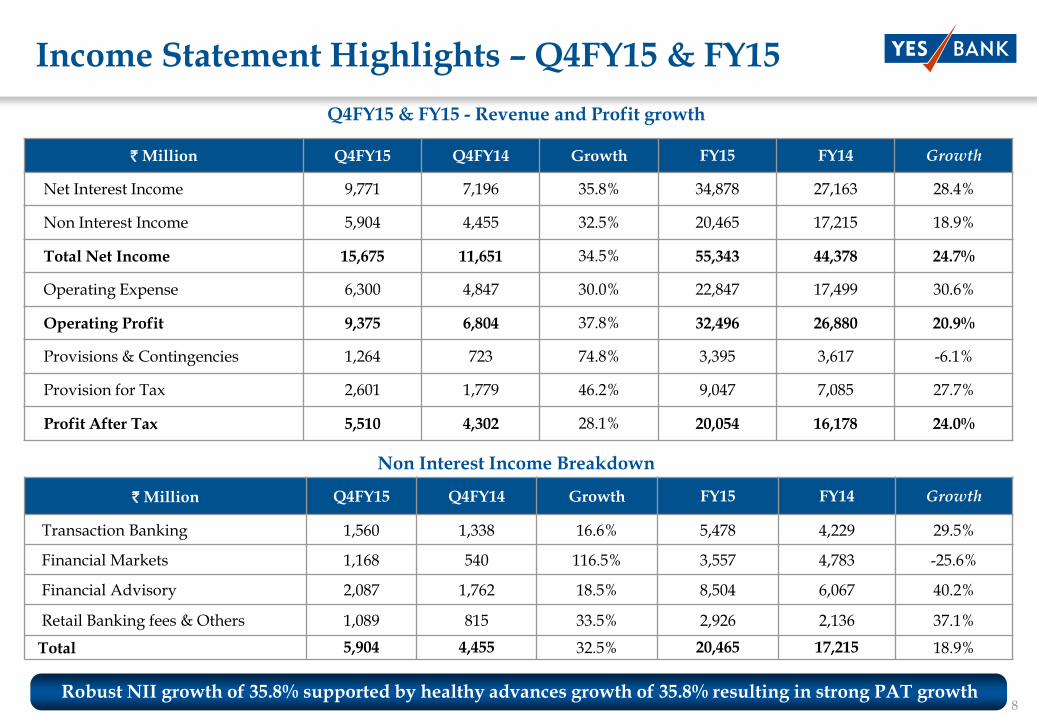
Q4FY15 & FY15 - Revenue and Profit growth
Non Interest Income Breakdown
` Million Q4FY15 Q4FY14 Growth FY15 FY14 Growth
Transaction Banking 1,560 1,338 16.6% 5,478 4,229 29.5%
Financial Markets 1,168 540 116.5% 3,557 4,783 -25.6%
Financial Advisory 2,087 1,762 18.5% 8,504 6,067 40.2%
Retail Banking fees & Others 1,089 815 33.5% 2,926 2,136 37.1%
Total 5,904 4,455 32.5% 20,465 17,215 18.9%
Robust NII growth of 35.8% supported by healthy advances growth of 35.8% resulting in strong PAT growth
` Million Q4FY15 Q4FY14 Growth FY15 FY14 Growth
Net Interest Income 9,771 7,196 35.8% 34,878 27,163 28.4%
Non Interest Income 5,904 4,455 32.5% 20,465 17,215 18.9%
Total Net Income 15,675 11,651 34.5% 55,343 44,378 24.7%
Operating Expense 6,300 4,847 30.0% 22,847 17,499 30.6%
Operating Profit 9,375 6,804 37.8% 32,496 26,880 20.9%
Provisions & Contingencies 1,264 723 74.8% 3,395 3,617 -6.1%
Provision for Tax 2,601 1,779 46.2% 9,047 7,085 27.7%
Profit After Tax 5,510 4,302 28.1% 20,054 16,178 24.0%
9
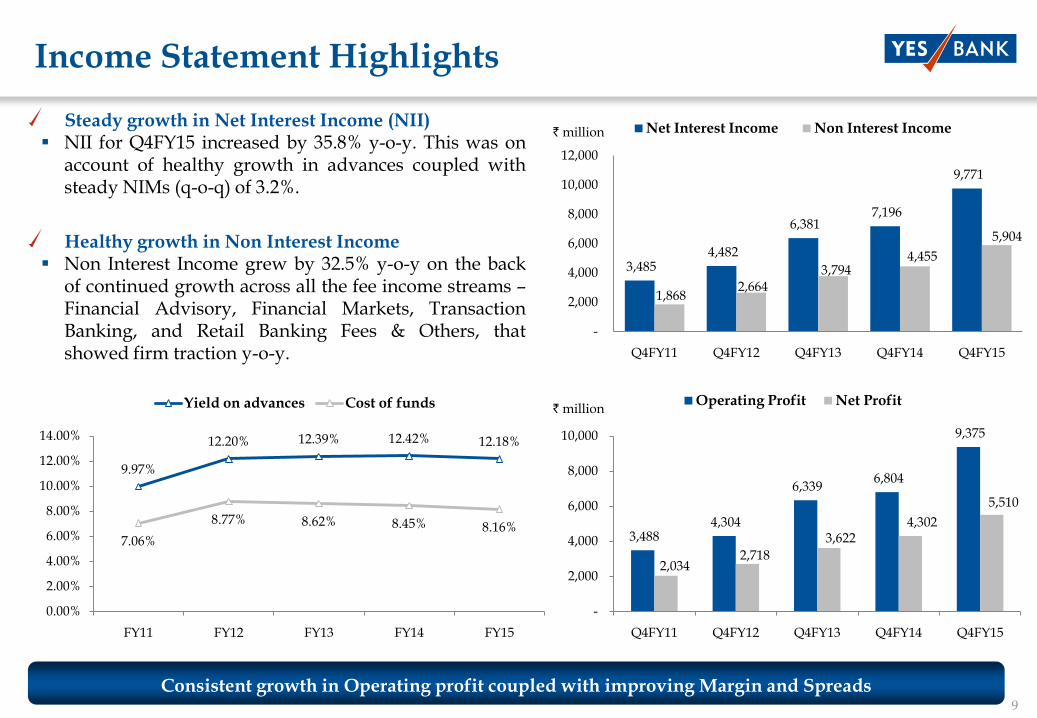
Income Statement Highlights
Steady growth in Net Interest Income (NII) NII for Q4FY15 increased by 35.8% y-o-y. This was on
account of healthy growth in advances coupled withsteady NIMs (q-o-q) of 3.2%.
Healthy growth in Non Interest Income Non Interest Income grew by 32.5% y-o-y on the back
of continued growth across all the fee income streams –Financial Advisory, Financial Markets, TransactionBanking, and Retail Banking Fees & Others, thatshowed firm traction y-o-y.
Consistent growth in Operating profit coupled with improving Margin and Spreads
` million
` million
3,485 4,482
6,381 7,196
9,771
1,868 2,664
3,794 4,455
5,904
-
2,000
4,000
6,000
8,000
10,000
12,000
Q4FY11 Q4FY12 Q4FY13 Q4FY14 Q4FY15
Net Interest Income Non Interest Income
3,488 4,304
6,339 6,804
9,375
2,034 2,718
3,622 4,302
5,510
-
2,000
4,000
6,000
8,000
10,000
Q4FY11 Q4FY12 Q4FY13 Q4FY14 Q4FY15
Operating Profit Net Profit
9.97%
12.20% 12.39% 12.42% 12.18%
7.06%
8.77% 8.62% 8.45% 8.16%
0.00%
2.00%
4.00%
6.00%
8.00%
10.00%
12.00%
14.00%
FY11 FY12 FY13 FY14 FY15
Yield on advances Cost of funds
10
654 700 931
1,338 1,560
-
500
1,000
1,500
2,000
Q4FY11 Q4FY12 Q4FY13 Q4FY14 Q4FY15
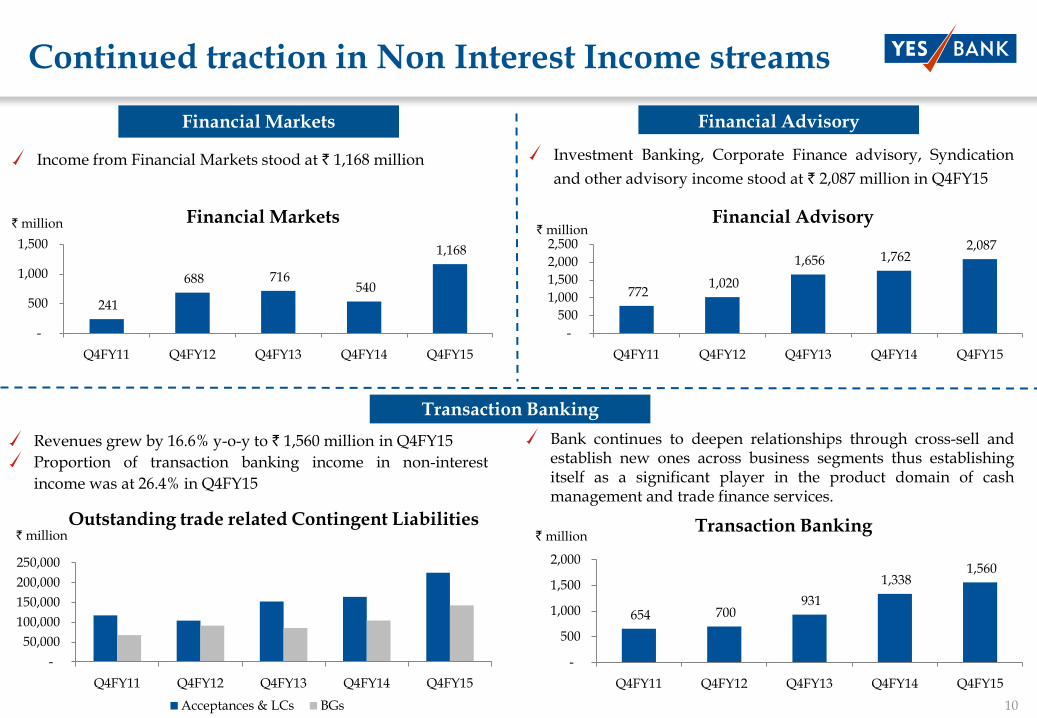
Transaction Banking
Income from Financial Markets stood at ` 1,168 million
Continued traction in Non Interest Income streams
` million
Financial Markets
` million
Investment Banking, Corporate Finance advisory, Syndication
and other advisory income stood at ` 2,087 million in Q4FY15
Financial Advisory
Outstanding trade related Contingent Liabilities` million
Transaction Banking
Revenues grew by 16.6% y-o-y to ` 1,560 million in Q4FY15
Proportion of transaction banking income in non-interest
income was at 26.4% in Q4FY15
Bank continues to deepen relationships through cross-sell andestablish new ones across business segments thus establishingitself as a significant player in the product domain of cashmanagement and trade finance services.
` million
241
688 716 540
1,168
-
500
1,000
1,500
Q4FY11 Q4FY12 Q4FY13 Q4FY14 Q4FY15
Financial Markets
772 1,020
1,656 1,762 2,087
-
500
1,000
1,500
2,000
2,500
Q4FY11 Q4FY12 Q4FY13 Q4FY14 Q4FY15
Financial Advisory
-
50,000
100,000
150,000
200,000
250,000
Q4FY11 Q4FY12 Q4FY13 Q4FY14 Q4FY15
Acceptances & LCs BGs
11
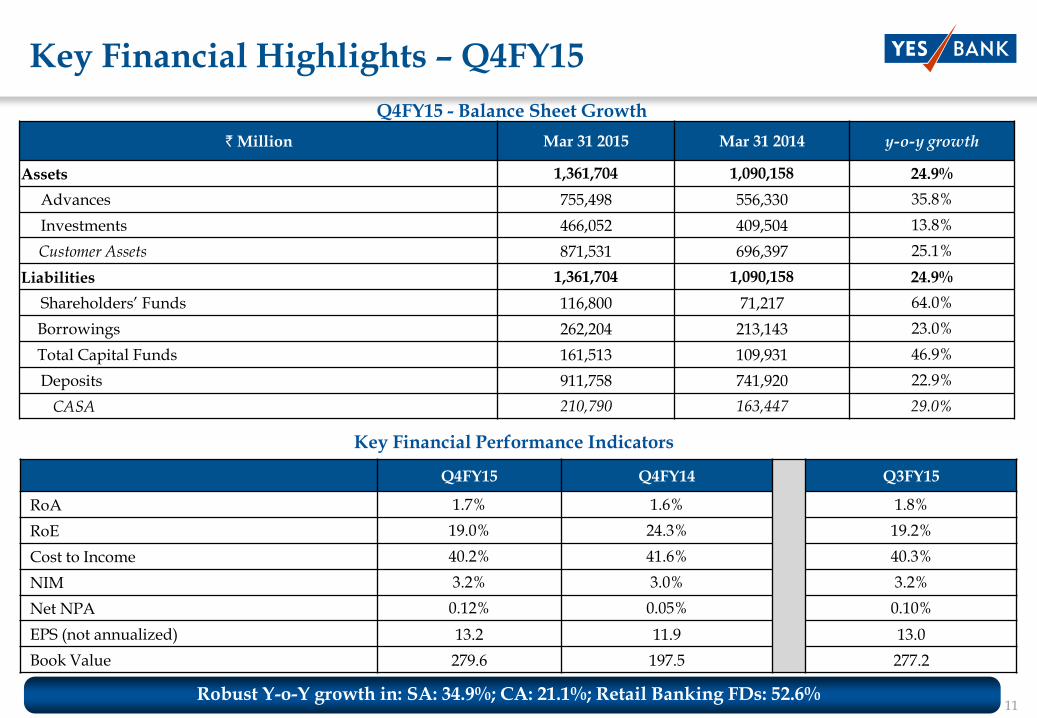
Key Financial Highlights – Q4FY15
Q4FY15 - Balance Sheet Growth
Robust Y-o-Y growth in: SA: 34.9%; CA: 21.1%; Retail Banking FDs: 52.6%
` Million Mar 31 2015 Mar 31 2014 y-o-y growth
Assets 1,361,704 1,090,158 24.9%
Advances 755,498 556,330 35.8%
Investments 466,052 409,504 13.8%
Customer Assets 871,531 696,397 25.1%
Liabilities 1,361,704 1,090,158 24.9%
Shareholders‘ Funds 116,800 71,217 64.0%
Borrowings 262,204 213,143 23.0%
Total Capital Funds 161,513 109,931 46.9%
Deposits 911,758 741,920 22.9%
CASA 210,790 163,447 29.0%
Key Financial Performance Indicators
Q4FY15 Q4FY14 Q3FY15
RoA 1.7% 1.6% 1.8%
RoE 19.0% 24.3% 19.2%
Cost to Income 40.2% 41.6% 40.3%
NIM 3.2% 3.0% 3.2%
Net NPA 0.12% 0.05% 0.10%
EPS (not annualized) 13.2 11.9 13.0
Book Value 279.6 197.5 277.2
12
Agri and Allied2.6%
All Engg1.8%
Aviation (Airports)0.2%
Beverages0.4%
Cement1.1%
Chemical Products (Dyes, Paints, etc.)2.2%
Construction3.1% Educational Services
0.9%
Electricity8.3%
Food Processing3.2%
Gas storage and pipeline0.1%
Gems and Jewellery1.5%
Glass & Glassware0.2%
Granular & Retail Advances15.7%
Housing Finance (HFC)1.4%
Iron & Steel3.3%
Metal & Metal Products2.0%
Mining & Quarrying0.3%
NBFC0.9%
Other Financial Services1.8%
Other Industries31.1%
Paper & Paper Products0.6%
Petroleum, Coal and Other Fuels1.3%
Power1.7%
Railways0.0%
Roadways1.3%
Rubber, Plastic & Products0.3%
Social & Commercial Infrastructure2.7%
Tech, ITES & Media & Ent2.9%
Telecommunication2.2%
Textiles0.5%
Vehicles, Parts & Equipments3.1%
Water Sanitation0.1%
Waterways1.4%
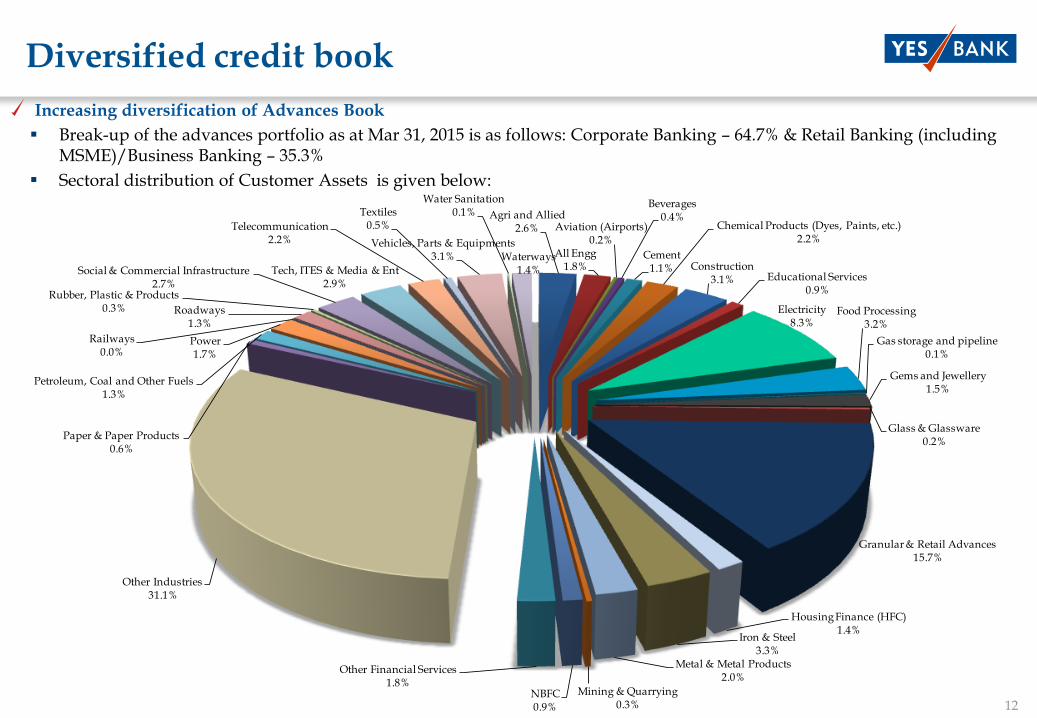
Diversified credit book
Increasing diversification of Advances Book
Break-up of the advances portfolio as at Mar 31, 2015 is as follows: Corporate Banking – 64.7% & Retail Banking (including MSME)/Business Banking – 35.3%
Sectoral distribution of Customer Assets is given below:
13
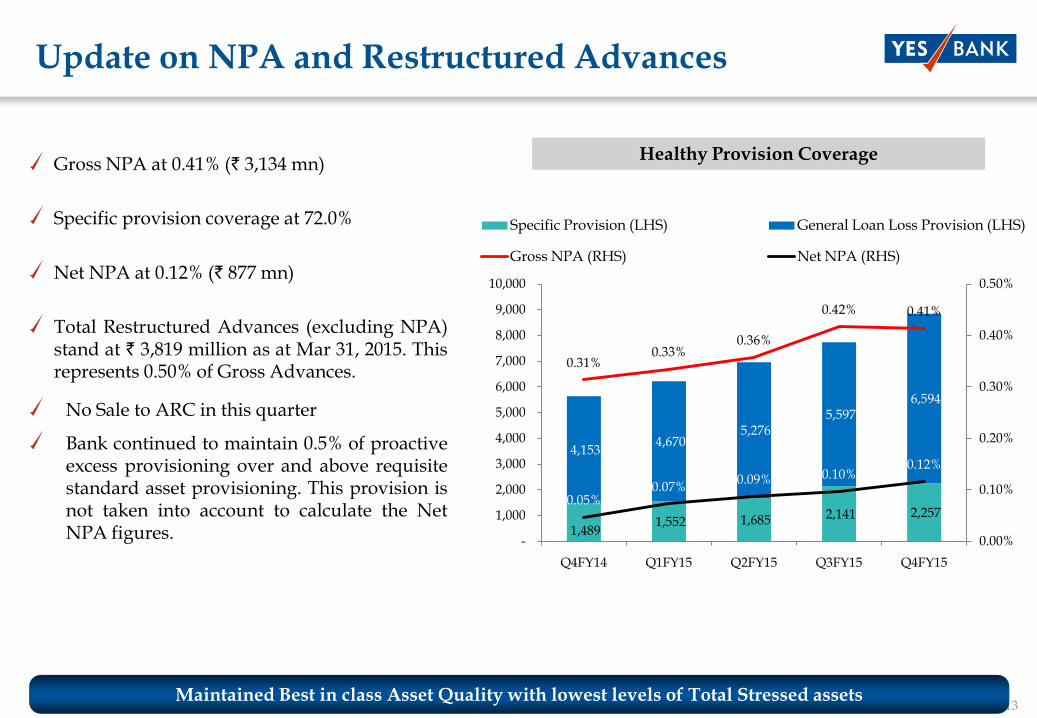
Update on NPA and Restructured Advances
Gross NPA at 0.41% (` 3,134 mn)
Specific provision coverage at 72.0%
Net NPA at 0.12% (` 877 mn)
Total Restructured Advances (excluding NPA)stand at ` 3,819 million as at Mar 31, 2015. Thisrepresents 0.50% of Gross Advances.
No Sale to ARC in this quarter
Bank continued to maintain 0.5% of proactiveexcess provisioning over and above requisitestandard asset provisioning. This provision isnot taken into account to calculate the NetNPA figures.
Healthy Provision Coverage
Maintained Best in class Asset Quality with lowest levels of Total Stressed assets
1,489 1,552 1,685 2,141 2,257
4,153 4,670
5,276 5,597
6,594
0.31%0.33%
0.36%
0.42% 0.41%
0.05%0.07%
0.09% 0.10%0.12%
0.00%
0.10%
0.20%
0.30%
0.40%
0.50%
-
1,000
2,000
3,000
4,000
5,000
6,000
7,000
8,000
9,000
10,000
Q4FY14 Q1FY15 Q2FY15 Q3FY15 Q4FY15
Specific Provision (LHS) General Loan Loss Provision (LHS)
Gross NPA (RHS) Net NPA (RHS)
14
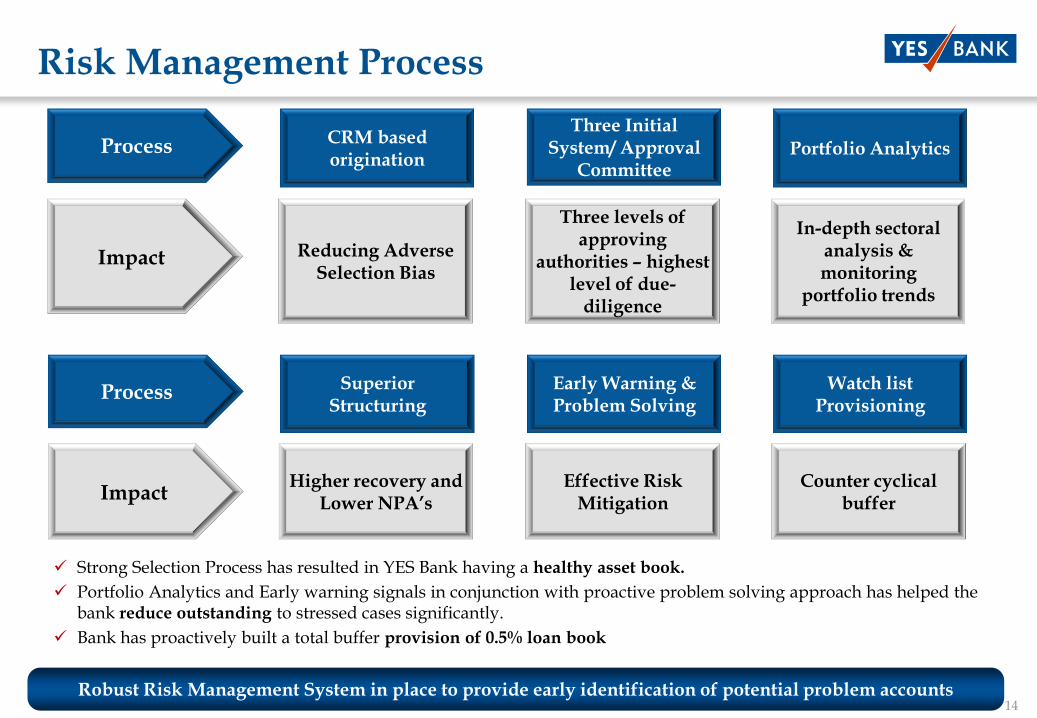
Risk Management Process
CRM based origination
Reducing Adverse Selection Bias
Impact
ProcessThree Initial
System/ Approval Committee
Three levels of approving
authorities – highest level of due-
diligence
Portfolio Analytics
In-depth sectoralanalysis & monitoring
portfolio trends
Robust Risk Management System in place to provide early identification of potential problem accounts
Superior Structuring
Higher recovery and Lower NPA‟s
Impact
Process Early Warning & Problem Solving
Effective Risk Mitigation
Watch list Provisioning
Counter cyclical buffer
Strong Selection Process has resulted in YES Bank having a healthy asset book.
Portfolio Analytics and Early warning signals in conjunction with proactive problem solving approach has helped the bank reduce outstanding to stressed cases significantly.
Bank has proactively built a total buffer provision of 0.5% loan book

15
0.00%
5.00%
10.00%
15.00%
20.00%
25.00%
30.00%
0.00%
0.20%
0.40%
0.60%
0.80%
1.00%
1.20%
1.40%
1.60%
1.80%
2.00%
Return on Assets (LHS) Return on Equity (RHS)
Income Growth with consistent ROA & ROE ratiosMar 2009 – Mar 2015 (25 sequential quarters)
` M
illi
on
Growth with quality, improving productivity and efficiency
` M
illion
ROA ROEQIP –
US$ 500 Mn.
-
1,000
2,000
3,000
4,000
5,000
6,000
-
2,000
4,000
6,000
8,000
10,000
12,000
Net Interest Income (LHS) Non Interest Income (LHS) Net Profit (RHS)
16
0.0%
2.0%
4.0%
6.0%
8.0%
10.0%
12.0%
0.00%
0.10%
0.20%
0.30%
0.40%
0.50%
0.60%
Gross NPA % (LHS) Net NPA % (LHS) Quarterly Growth Rate of Real GDP, India (RHS)
-
200
400
600
800
1,000
1,200
1,400
1,600
Advances Deposits Total assets
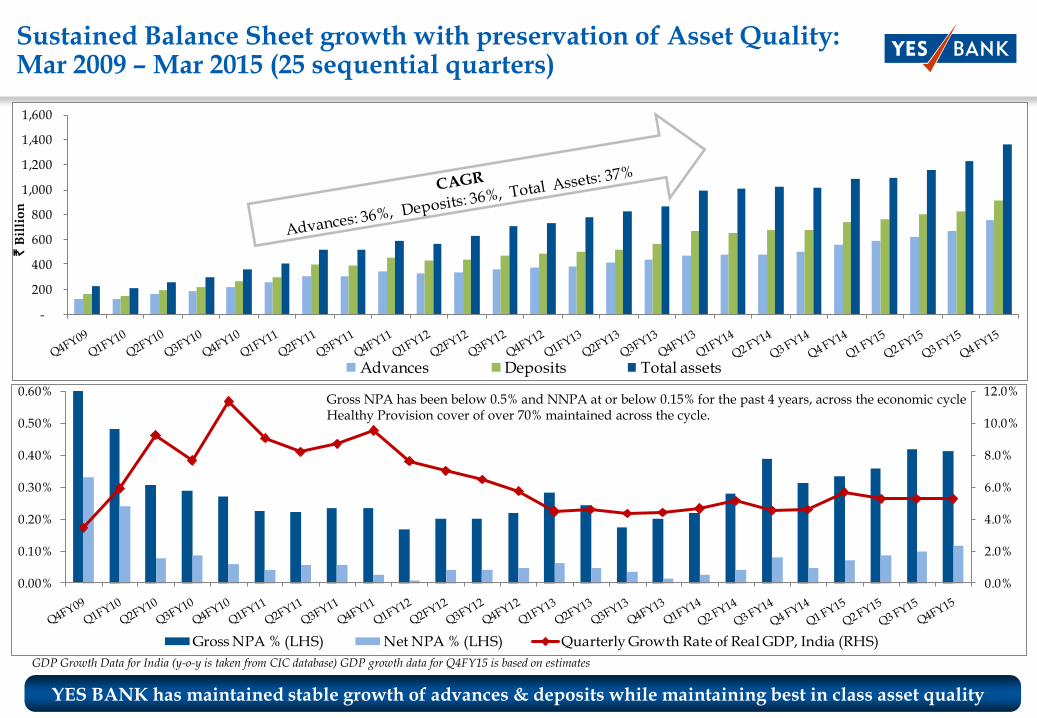
Sustained Balance Sheet growth with preservation of Asset Quality: Mar 2009 – Mar 2015 (25 sequential quarters)
` B
illi
on
YES BANK has maintained stable growth of advances & deposits while maintaining best in class asset quality
Gross NPA has been below 0.5% and NNPA at or below 0.15% for the past 4 years, across the economic cycleHealthy Provision cover of over 70% maintained across the cycle.
GDP Growth Data for India (y-o-y is taken from CIC database) GDP growth data for Q4FY15 is based on estimates
17
-
20,000
40,000
60,000
80,000
100,000
120,000
-
200,000
400,000
600,000
800,000
1,000,000
1,200,000
1,400,000
RWA (LHS) Tier I Capital (Including quarterly profits) (RHS)
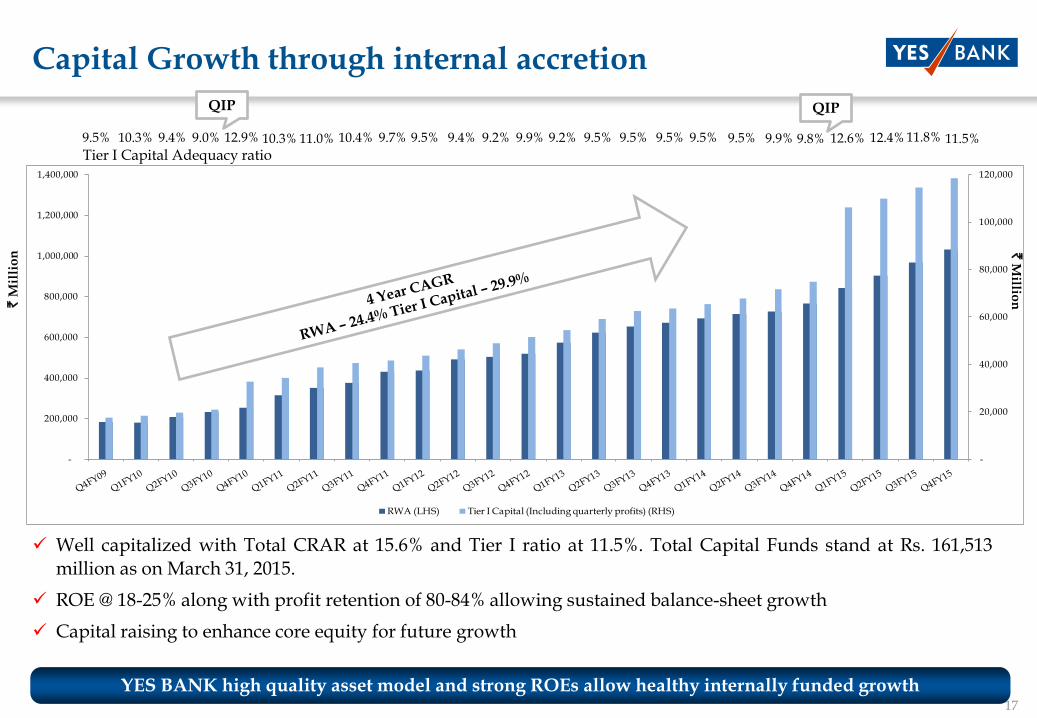
Capital Growth through internal accretion
YES BANK high quality asset model and strong ROEs allow healthy internally funded growth
Well capitalized with Total CRAR at 15.6% and Tier I ratio at 11.5%. Total Capital Funds stand at Rs. 161,513million as on March 31, 2015.
ROE @ 18-25% along with profit retention of 80-84% allowing sustained balance-sheet growth
Capital raising to enhance core equity for future growth
` M
illi
on `
Millio
n
11.0% 10.4% 9.7% 9.5% 9.4% 9.2% 9.9% 9.2% 9.5% 9.5% 9.5% 9.5%9.0% 12.9% 10.3%
Tier I Capital Adequacy ratio9.4%10.3%9.5% 9.5% 9.9% 9.8% 12.6%
QIP
12.4% 11.8% 11.5%
QIP
18
19
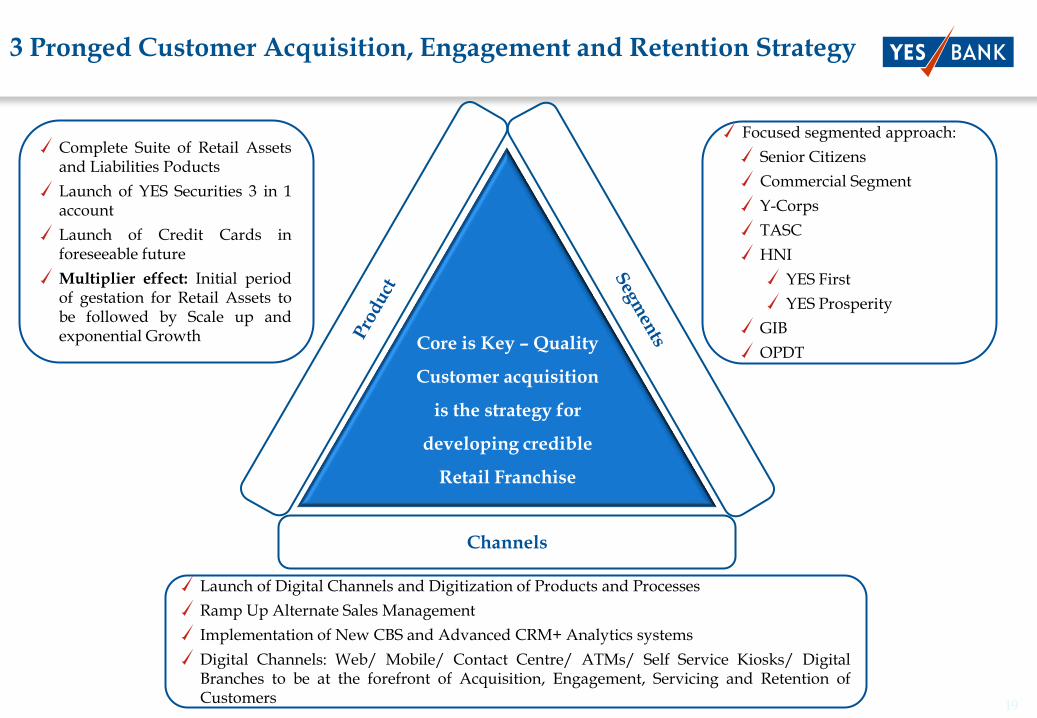
3 Pronged Customer Acquisition, Engagement and Retention Strategy
Channels
Complete Suite of Retail Assetsand Liabilities Poducts
Launch of YES Securities 3 in 1account
Launch of Credit Cards inforeseeable future
Multiplier effect: Initial periodof gestation for Retail Assets tobe followed by Scale up andexponential Growth
Focused segmented approach:
Senior Citizens
Commercial Segment
Y-Corps
TASC
HNI
YES First
YES Prosperity
GIB
OPDT
Launch of Digital Channels and Digitization of Products and Processes
Ramp Up Alternate Sales Management
Implementation of New CBS and Advanced CRM+ Analytics systems
Digital Channels: Web/ Mobile/ Contact Centre/ ATMs/ Self Service Kiosks/ DigitalBranches to be at the forefront of Acquisition, Engagement, Servicing and Retention ofCustomers
Core is Key – Quality
Customer acquisition
is the strategy for
developing credible
Retail Franchise
20
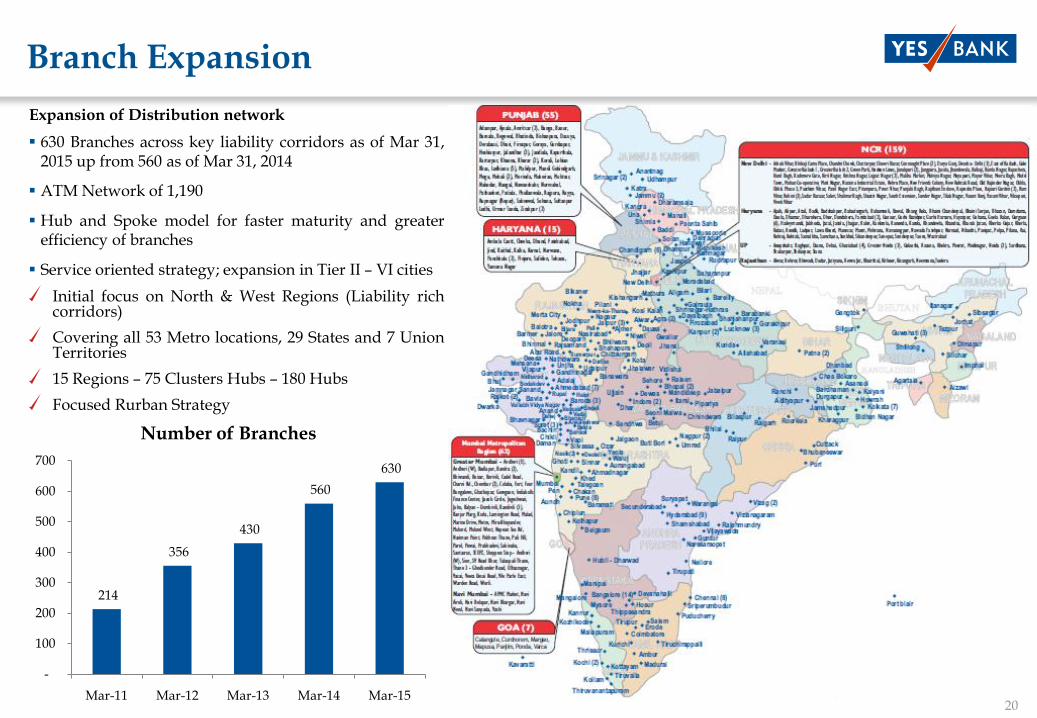
Expansion of Distribution network
630 Branches across key liability corridors as of Mar 31,2015 up from 560 as of Mar 31, 2014
ATM Network of 1,190
Hub and Spoke model for faster maturity and greaterefficiency of branches
Service oriented strategy; expansion in Tier II – VI cities
Initial focus on North & West Regions (Liability richcorridors)
Covering all 53 Metro locations, 29 States and 7 UnionTerritories
15 Regions – 75 Clusters Hubs – 180 Hubs
Focused Rurban Strategy
Branch Expansion
214
356
430
560
630
-
100
200
300
400
500
600
700
Mar-11 Mar-12 Mar-13 Mar-14 Mar-15
Number of Branches
21
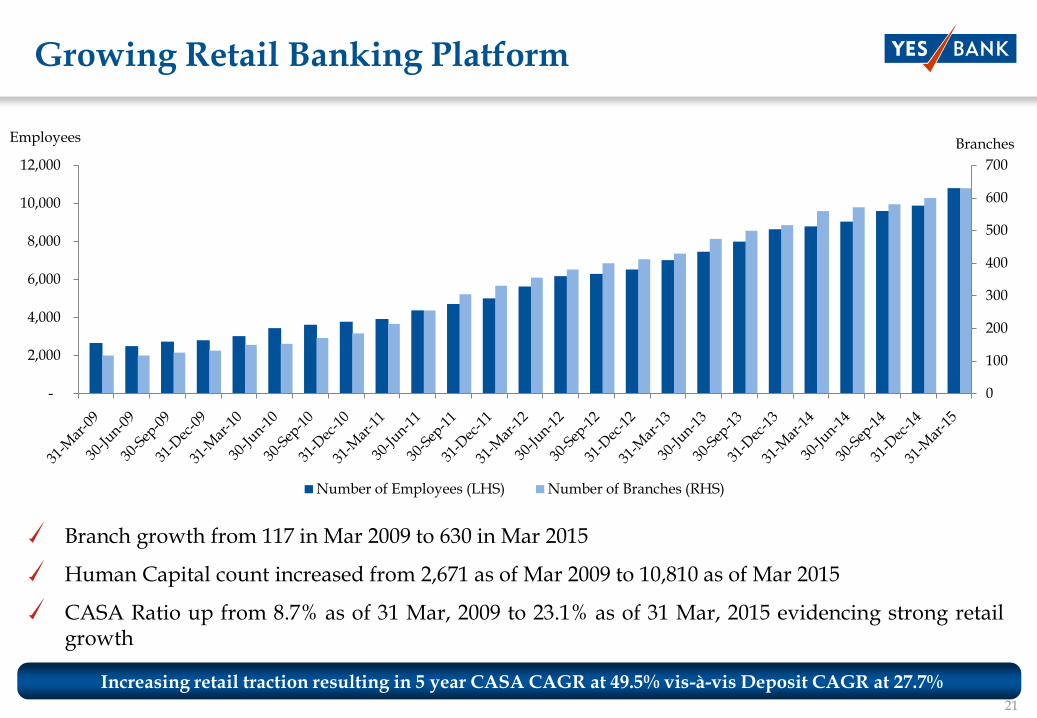
Growing Retail Banking Platform
Branch growth from 117 in Mar 2009 to 630 in Mar 2015
Human Capital count increased from 2,671 as of Mar 2009 to 10,810 as of Mar 2015
CASA Ratio up from 8.7% as of 31 Mar, 2009 to 23.1% as of 31 Mar, 2015 evidencing strong retailgrowth
Increasing retail traction resulting in 5 year CASA CAGR at 49.5% vis-à-vis Deposit CAGR at 27.7%
Employees Branches
0
100
200
300
400
500
600
700
-
2,000
4,000
6,000
8,000
10,000
12,000
Number of Employees (LHS) Number of Branches (RHS)
22
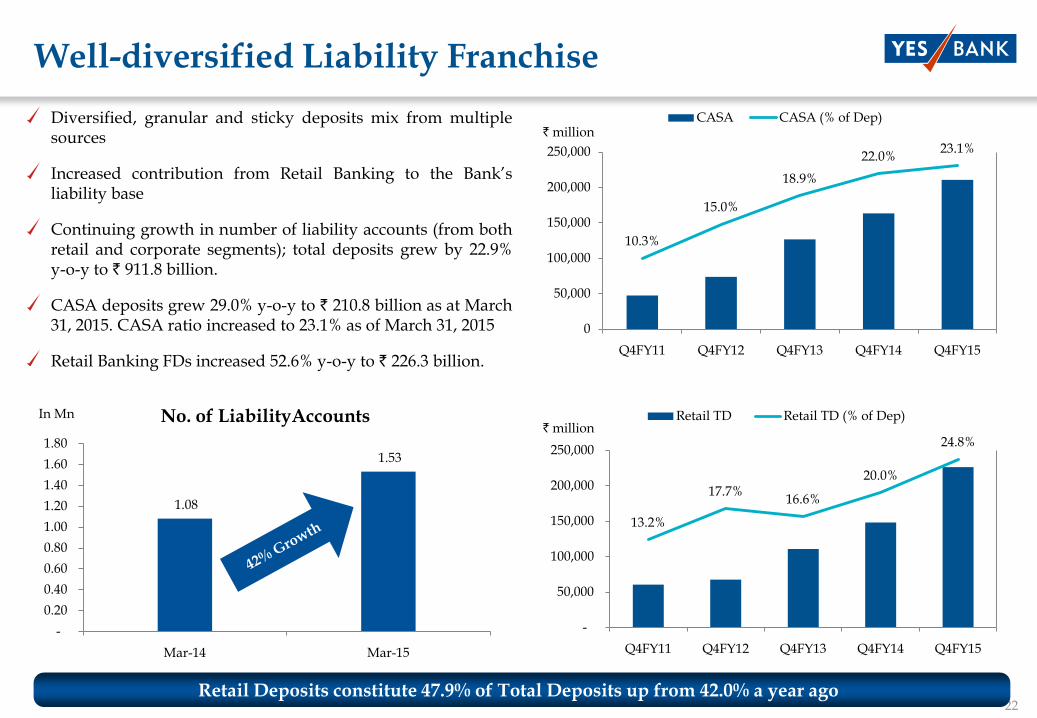
Well-diversified Liability Franchise
Diversified, granular and sticky deposits mix from multiplesources
Increased contribution from Retail Banking to the Bank‘sliability base
Continuing growth in number of liability accounts (from bothretail and corporate segments); total deposits grew by 22.9%y-o-y to ` 911.8 billion.
CASA deposits grew 29.0% y-o-y to ` 210.8 billion as at March31, 2015. CASA ratio increased to 23.1% as of March 31, 2015
Retail Banking FDs increased 52.6% y-o-y to ` 226.3 billion.
Retail Deposits constitute 47.9% of Total Deposits up from 42.0% a year ago
13.2%
17.7%16.6%
20.0%
24.8%
-
50,000
100,000
150,000
200,000
250,000
Q4FY11 Q4FY12 Q4FY13 Q4FY14 Q4FY15
Retail TD Retail TD (% of Dep)
10.3%
15.0%
18.9%
22.0%23.1%
0
50,000
100,000
150,000
200,000
250,000
Q4FY11 Q4FY12 Q4FY13 Q4FY14 Q4FY15
CASA CASA (% of Dep)` million
` million
1.08
1.53
-
0.20
0.40
0.60
0.80
1.00
1.20
1.40
1.60
1.80
Mar-14 Mar-15
No. of LiabilityAccountsIn Mn
23
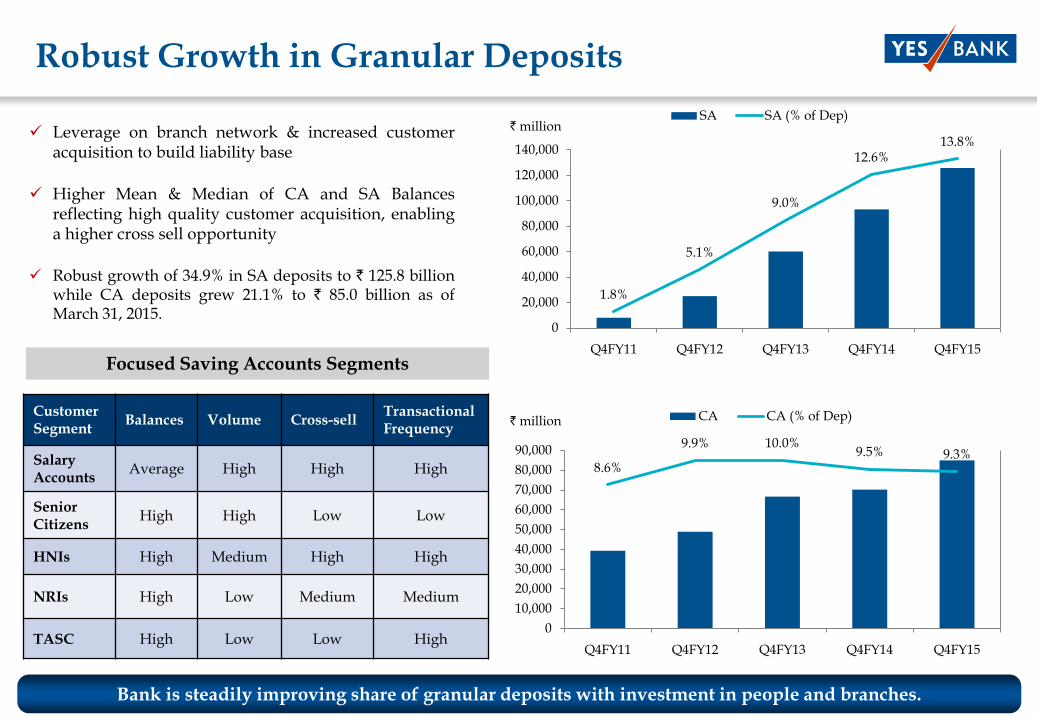
Robust Growth in Granular Deposits
Bank is steadily improving share of granular deposits with investment in people and branches.
Leverage on branch network & increased customeracquisition to build liability base
Higher Mean & Median of CA and SA Balancesreflecting high quality customer acquisition, enablinga higher cross sell opportunity
Robust growth of 34.9% in SA deposits to ` 125.8 billionwhile CA deposits grew 21.1% to ` 85.0 billion as ofMarch 31, 2015.
8.6%
9.9% 10.0%9.5% 9.3%
0
10,000
20,000
30,000
40,000
50,000
60,000
70,000
80,000
90,000
Q4FY11 Q4FY12 Q4FY13 Q4FY14 Q4FY15
CA CA (% of Dep)
1.8%
5.1%
9.0%
12.6%13.8%
0
20,000
40,000
60,000
80,000
100,000
120,000
140,000
Q4FY11 Q4FY12 Q4FY13 Q4FY14 Q4FY15
SA SA (% of Dep)
` million
` million
CustomerSegment
Balances Volume Cross-sellTransactional Frequency
Salary Accounts
Average High High High
SeniorCitizens
High High Low Low
HNIs High Medium High High
NRIs High Low Medium Medium
TASC High Low Low High
Focused Saving Accounts Segments
24
3 4
8
13
17
-
5
10
15
20
Q4FY11 Q4FY12 Q4FY13 Q4FY14 Q4FY15
Retail Banking Fees
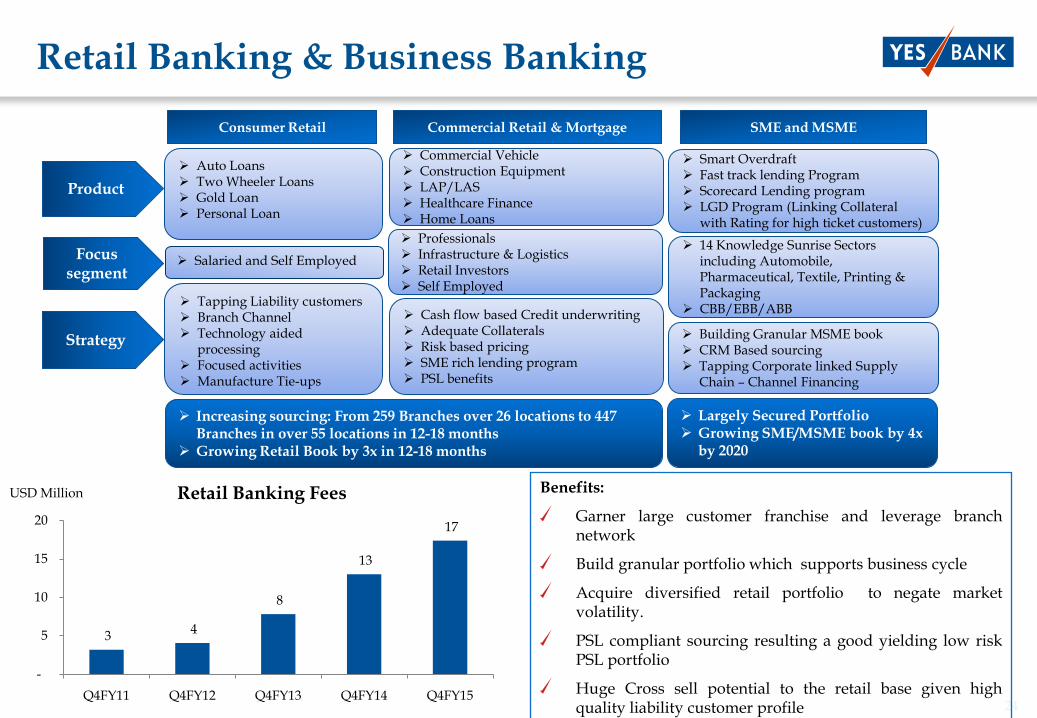
Retail Banking & Business Banking
USD Million
Consumer Retail Commercial Retail & Mortgage SME and MSME
Auto Loans Two Wheeler Loans Gold Loan Personal Loan
Commercial Vehicle Construction Equipment LAP/LAS Healthcare Finance Home Loans
Smart Overdraft Fast track lending Program Scorecard Lending program LGD Program (Linking Collateral
with Rating for high ticket customers)
Product
Salaried and Self Employed 14 Knowledge Sunrise Sectors
including Automobile, Pharmaceutical, Textile, Printing & Packaging
CBB/EBB/ABB
Focus segment
Tapping Liability customers Branch Channel Technology aided
processing Focused activities Manufacture Tie-ups
Cash flow based Credit underwriting Adequate Collaterals Risk based pricing SME rich lending program PSL benefits
Building Granular MSME book CRM Based sourcing Tapping Corporate linked Supply
Chain – Channel Financing
Strategy
Professionals Infrastructure & Logistics Retail Investors Self Employed
Increasing sourcing: From 259 Branches over 26 locations to 447 Branches in over 55 locations in 12-18 months
Growing Retail Book by 3x in 12-18 months
Largely Secured Portfolio Growing SME/MSME book by 4x
by 2020
Benefits:
Garner large customer franchise and leverage branchnetwork
Build granular portfolio which supports business cycle
Acquire diversified retail portfolio to negate marketvolatility.
PSL compliant sourcing resulting a good yielding low riskPSL portfolio
Huge Cross sell potential to the retail base given highquality liability customer profile
25
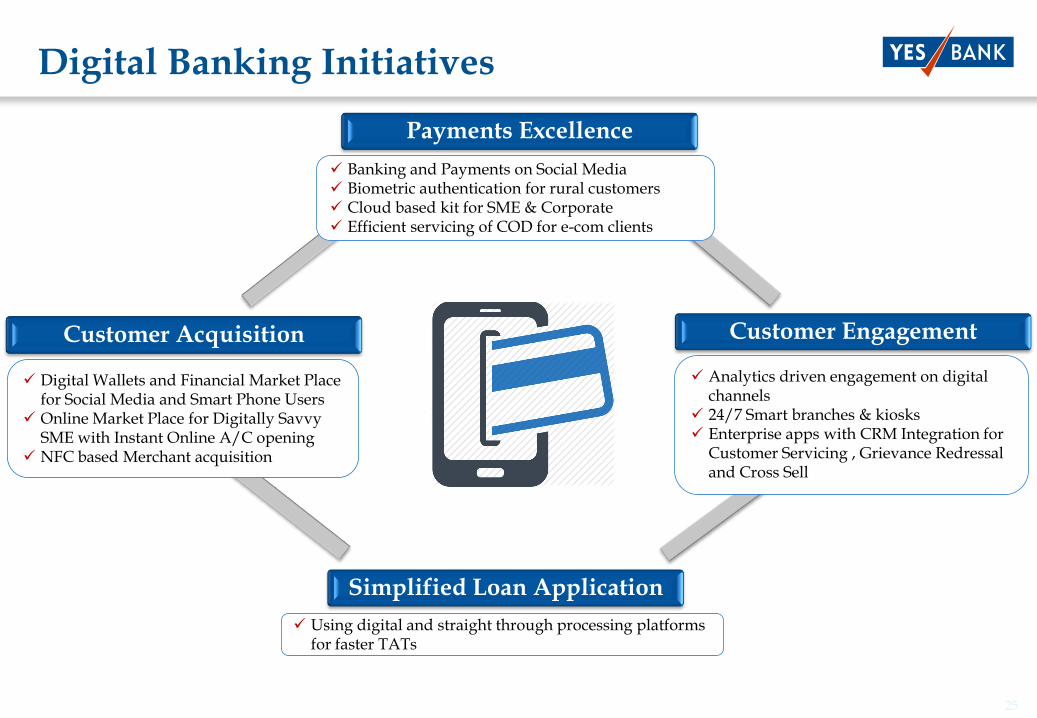
Digital Banking Initiatives
Payments Excellence
Customer Engagement
Simplified Loan Application
Customer Acquisition
Banking and Payments on Social Media Biometric authentication for rural customers Cloud based kit for SME & Corporate Efficient servicing of COD for e-com clients
Digital Wallets and Financial Market Place for Social Media and Smart Phone Users
Online Market Place for Digitally Savvy SME with Instant Online A/C opening
NFC based Merchant acquisition
Analytics driven engagement on digital channels
24/7 Smart branches & kiosks Enterprise apps with CRM Integration for
Customer Servicing , Grievance Redressal and Cross Sell
Using digital and straight through processing platforms for faster TATs
26
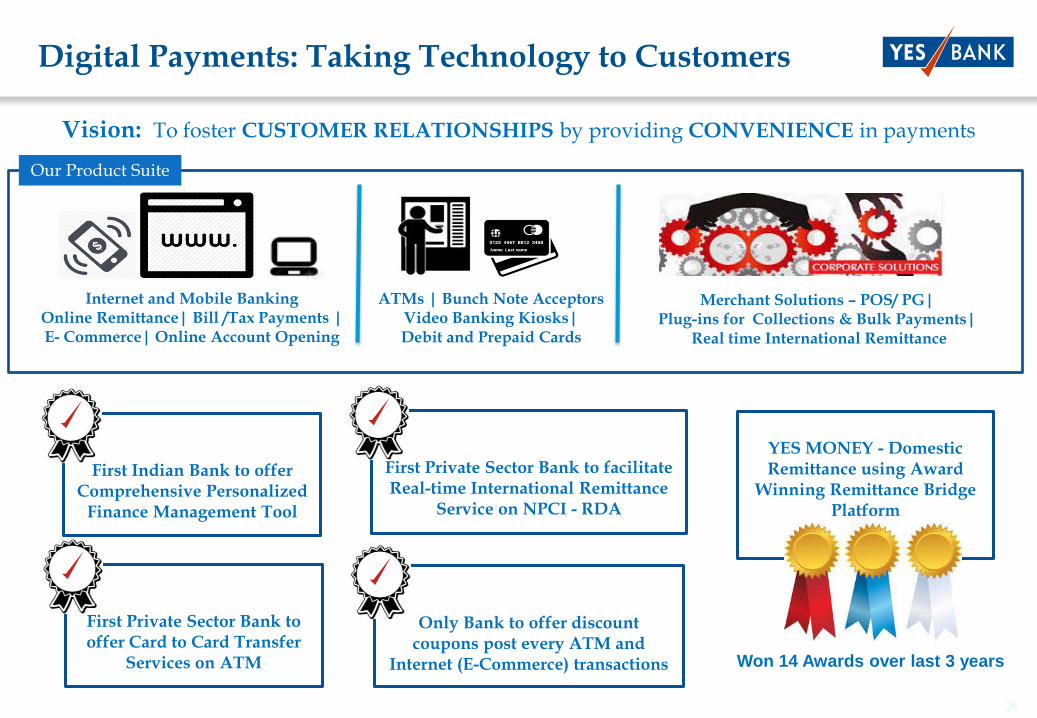
First Indian Bank to offer Comprehensive Personalized
Finance Management Tool
Digital Payments: Taking Technology to Customers
Vision: To foster CUSTOMER RELATIONSHIPS by providing CONVENIENCE in payments
ATMs | Bunch Note Acceptors Video Banking Kiosks|Debit and Prepaid Cards
Internet and Mobile BankingOnline Remittance| Bill /Tax Payments | E- Commerce| Online Account Opening
Merchant Solutions – POS/ PG| Plug-ins for Collections & Bulk Payments|
Real time International Remittance
YES MONEY - Domestic Remittance using Award
Winning Remittance Bridge Platform
Won 14 Awards over last 3 years
First Private Sector Bank to offer Card to Card Transfer
Services on ATM
Our Product Suite
Only Bank to offer discount coupons post every ATM and
Internet (E-Commerce) transactions
First Private Sector Bank to facilitate Real-time International Remittance
Service on NPCI - RDA
27
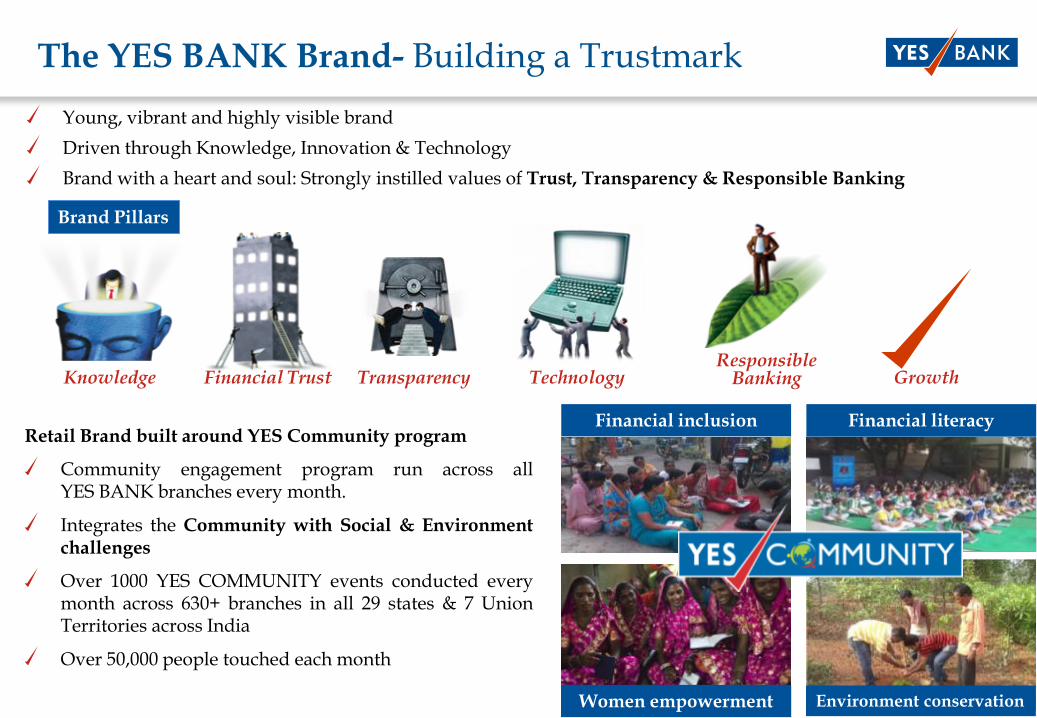
The YES BANK Brand- Building a Trustmark
Young, vibrant and highly visible brand
Driven through Knowledge, Innovation & Technology
Brand with a heart and soul: Strongly instilled values of Trust, Transparency & Responsible Banking
Responsible BankingTransparencyKnowledge Financial Trust Technology Growth
Brand Pillars
Retail Brand built around YES Community program
Community engagement program run across allYES BANK branches every month.
Integrates the Community with Social & Environmentchallenges
Over 1000 YES COMMUNITY events conducted everymonth across 630+ branches in all 29 states & 7 UnionTerritories across India
Over 50,000 people touched each month
Environment conservation
Financial literacyFinancial inclusion
Women empowerment
28
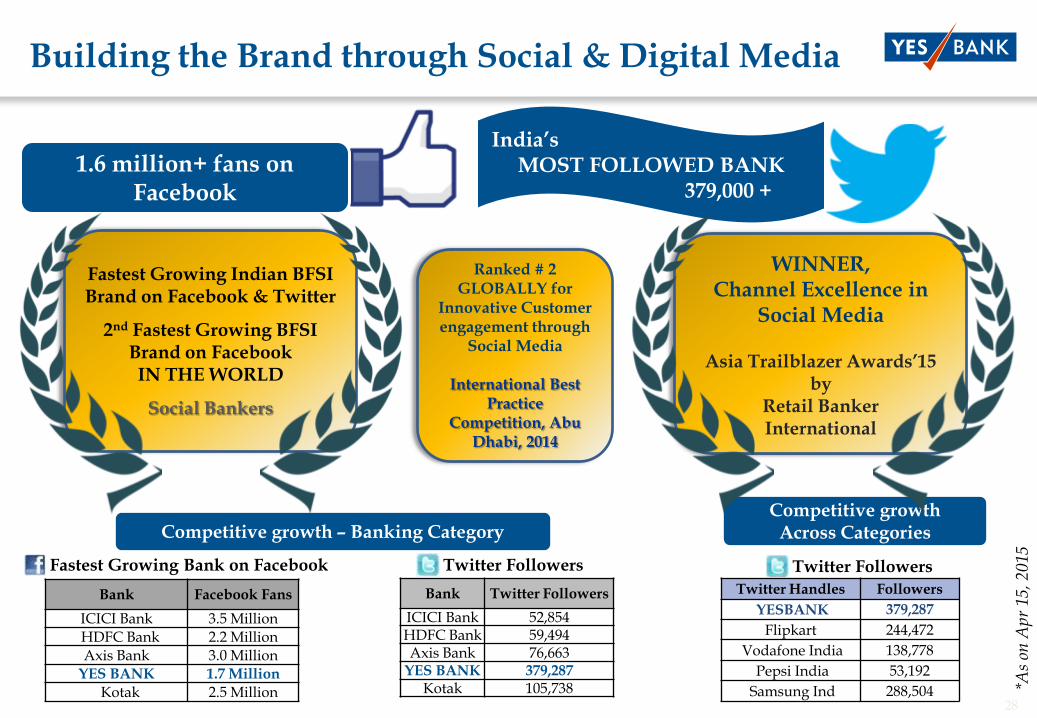
Fastest Growing Indian BFSI Brand on Facebook & Twitter
2nd Fastest Growing BFSI Brand on FacebookIN THE WORLD
Social Bankers
Building the Brand through Social & Digital Media
Fastest Growing Bank on Facebook Twitter Followers
Competitive growth – Banking CategoryCompetitive growth
Across Categories
Twitter Followers
*As
on A
pr 1
5, 2
015
India‟s MOST FOLLOWED BANK
379,000 +1.6 million+ fans on
WINNER,Channel Excellence in
Social Media
Asia Trailblazer Awards‟15 by
Retail Banker International
Ranked # 2 GLOBALLY for
Innovative Customer engagement through
Social Media
International Best Practice
Competition, Abu Dhabi, 2014
Bank Facebook Fans
ICICI Bank 3.5 MillionHDFC Bank 2.2 MillionAxis Bank 3.0 Million
YES BANK 1.7 Million
Kotak 2.5 Million
Bank Twitter Followers
ICICI Bank 52,854HDFC Bank 59,494Axis Bank 76,663
YES BANK 379,287Kotak 105,738
Twitter Handles Followers
YESBANK 379,287
Flipkart 244,472
Vodafone India 138,778
Pepsi India 53,192
Samsung Ind 288,504
29
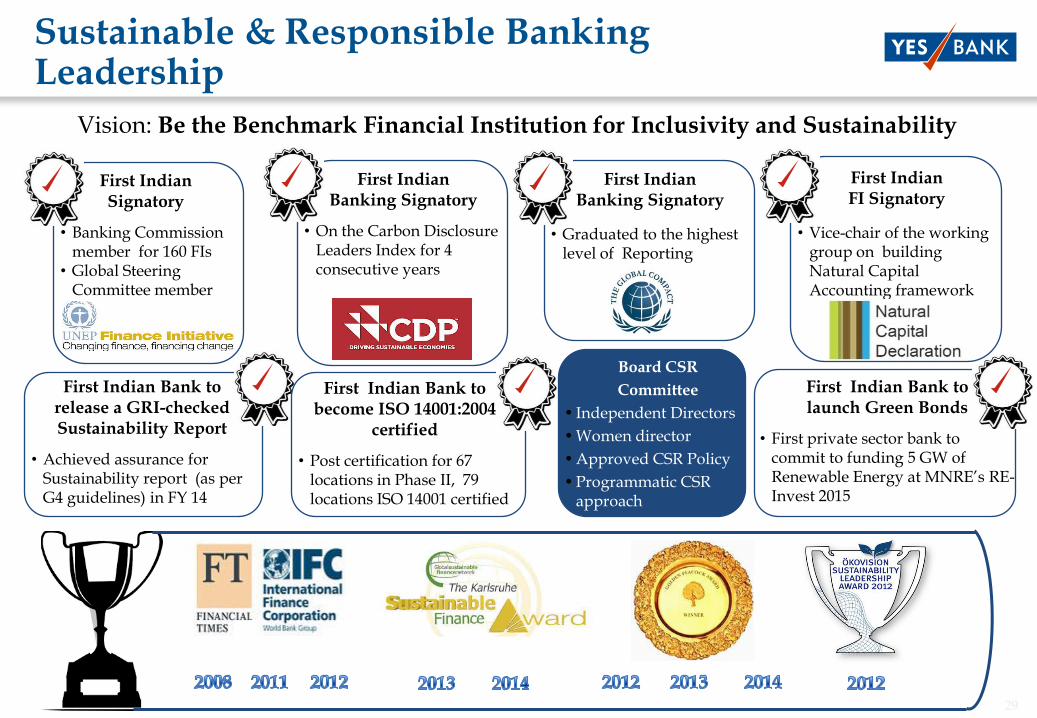
First Indian Signatory
• Banking Commission member for 160 FIs
• Global Steering Committee member
First Indian Banking Signatory
• On the Carbon Disclosure Leaders Index for 4 consecutive years
First Indian Bank to release a GRI-checked Sustainability Report
• Achieved assurance for Sustainability report (as per G4 guidelines) in FY 14
First Indian Bank to become ISO 14001:2004
certified
• Post certification for 67 locations in Phase II, 79 locations ISO 14001 certified
Sustainable & Responsible BankingLeadership
Vision: Be the Benchmark Financial Institution for Inclusivity and Sustainability
First Indian FI Signatory
• Vice-chair of the working group on building Natural Capital Accounting framework
First Indian Bank to launch Green Bonds
• First private sector bank to commit to funding 5 GW of Renewable Energy at MNRE‘s RE-Invest 2015
First Indian Banking Signatory
• Graduated to the highest level of Reporting
Board CSR
Committee
• Independent Directors
• Women director
• Approved CSR Policy
• Programmatic CSR approach
30
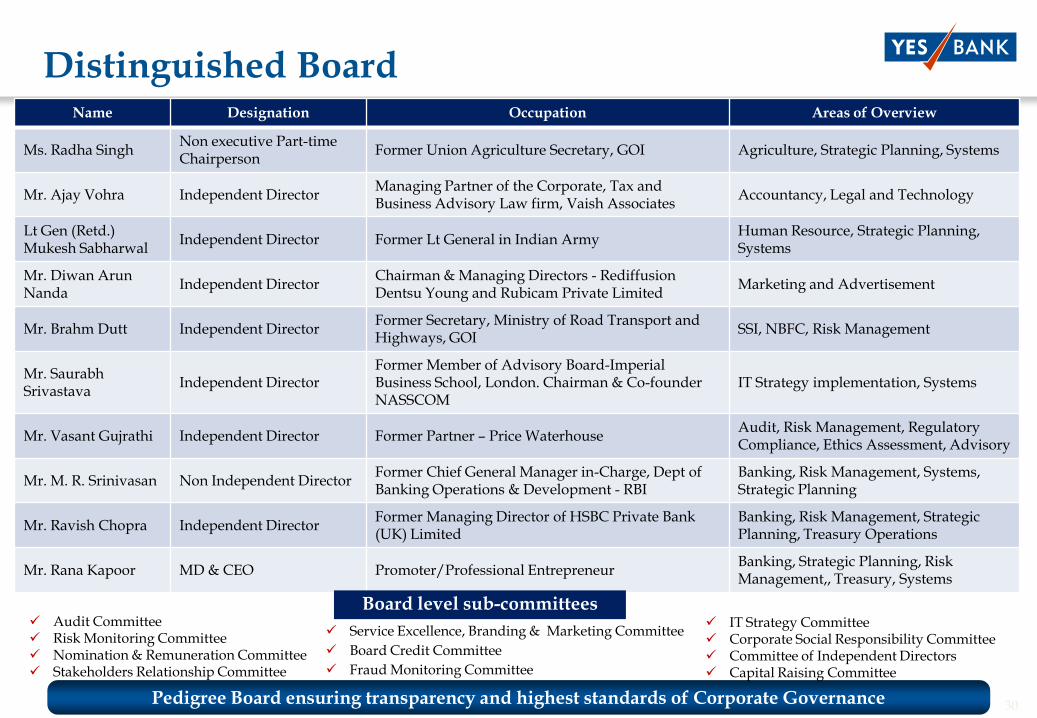
Name Designation Occupation Areas of Overview
Ms. Radha SinghNon executive Part-time Chairperson
Former Union Agriculture Secretary, GOI Agriculture, Strategic Planning, Systems
Mr. Ajay Vohra Independent DirectorManaging Partner of the Corporate, Tax and Business Advisory Law firm, Vaish Associates
Accountancy, Legal and Technology
Lt Gen (Retd.)Mukesh Sabharwal
Independent Director Former Lt General in Indian ArmyHuman Resource, Strategic Planning, Systems
Mr. Diwan ArunNanda
Independent DirectorChairman & Managing Directors - Rediffusion Dentsu Young and Rubicam Private Limited
Marketing and Advertisement
Mr. Brahm Dutt Independent DirectorFormer Secretary, Ministry of Road Transport and Highways, GOI
SSI, NBFC, Risk Management
Mr. SaurabhSrivastava
Independent DirectorFormer Member of Advisory Board-Imperial Business School, London. Chairman & Co-founder NASSCOM
IT Strategy implementation, Systems
Mr. Vasant Gujrathi Independent Director Former Partner – Price WaterhouseAudit, Risk Management, Regulatory Compliance, Ethics Assessment, Advisory
Mr. M. R. Srinivasan Non Independent DirectorFormer Chief General Manager in-Charge, Dept of Banking Operations & Development - RBI
Banking, Risk Management, Systems, Strategic Planning
Mr. Ravish Chopra Independent DirectorFormer Managing Director of HSBC Private Bank (UK) Limited
Banking, Risk Management, Strategic Planning, Treasury Operations
Mr. Rana Kapoor MD & CEO Promoter/Professional EntrepreneurBanking, Strategic Planning, Risk Management,, Treasury, Systems
Board level sub-committees Audit Committee Risk Monitoring Committee Nomination & Remuneration Committee Stakeholders Relationship Committee
Service Excellence, Branding & Marketing Committee
Board Credit Committee
Fraud Monitoring Committee
Distinguished Board
Pedigree Board ensuring transparency and highest standards of Corporate Governance
IT Strategy Committee Corporate Social Responsibility Committee Committee of Independent Directors Capital Raising Committee
31
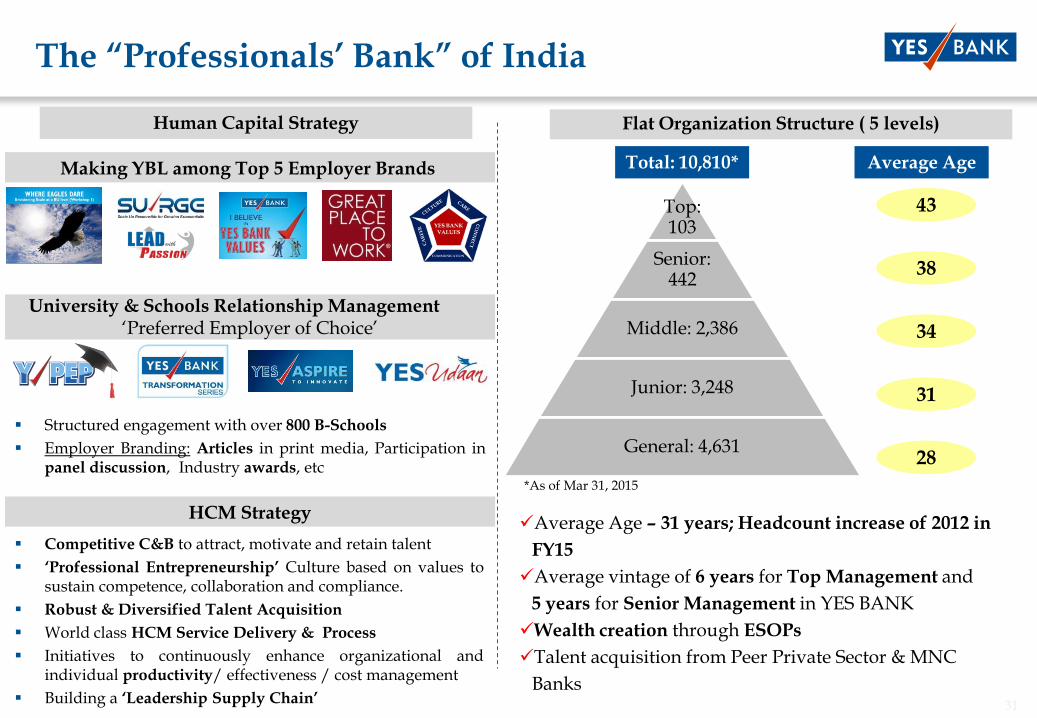
Top: 103
Senior: 442
Middle: 2,386
Junior: 3,248
General: 4,631
The “Professionals‟ Bank” of India
Flat Organization Structure ( 5 levels)
Average Age – 31 years; Headcount increase of 2012 in
FY15
Average vintage of 6 years for Top Management and
5 years for Senior Management in YES BANK
Wealth creation through ESOPs
Talent acquisition from Peer Private Sector & MNC
Banks
Total: 10,810* Average Age
43
38
34
31
28
*As of Mar 31, 2015
Human Capital Strategy
Structured engagement with over 800 B-Schools
Employer Branding: Articles in print media, Participation inpanel discussion, Industry awards, etc
University & Schools Relationship Management‗Preferred Employer of Choice‘
HCM Strategy
Competitive C&B to attract, motivate and retain talent
„Professional Entrepreneurship‟ Culture based on values tosustain competence, collaboration and compliance.
Robust & Diversified Talent Acquisition
World class HCM Service Delivery & Process
Initiatives to continuously enhance organizational andindividual productivity/ effectiveness / cost management
Building a „Leadership Supply Chain‟
Making YBL among Top 5 Employer Brands
32
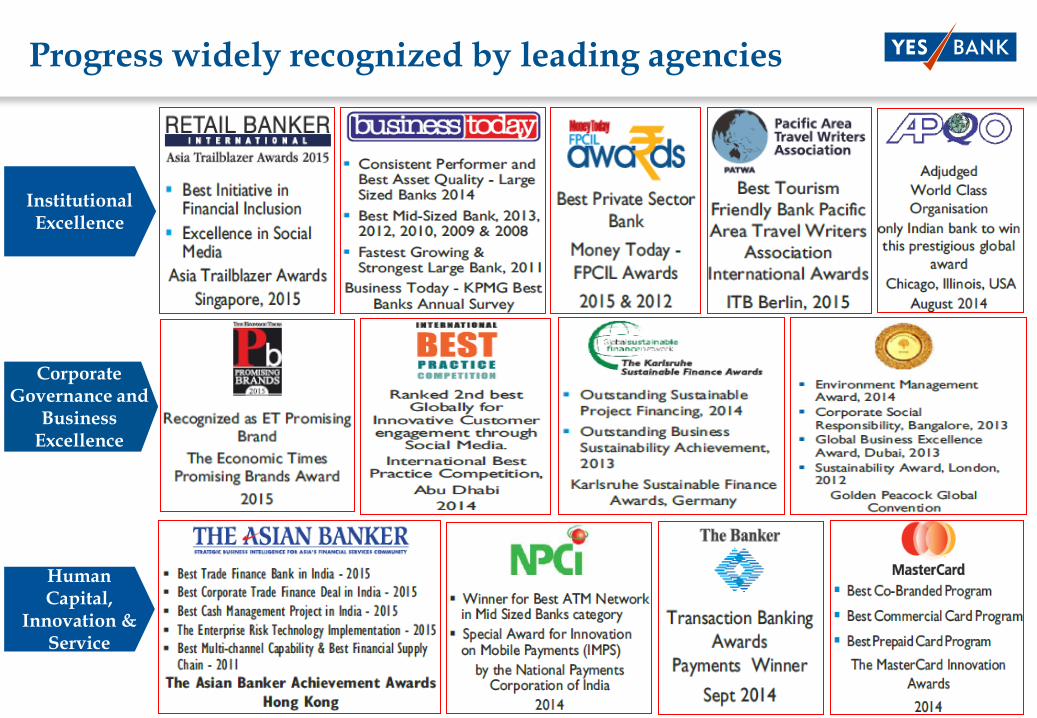
Institutional Excellence
Corporate Governance and
Business Excellence
Progress widely recognized by leading agencies
Human Capital,
Innovation & Service
33
No representation or warranty, express or implied is made as to, and no reliance should be placed on, the fairness, accuracy,
completeness or correctness of such information or opinions contained herein. The information contained in this presentation is only
current as of its date. Certain statements made in this presentation may not be based on historical information or facts and may be
―forward looking statements‖, including those relating to the Company‘s general business plans and strategy, its future financial
condition and growth prospects, and future developments in its industry and its competitive and regulatory environment. Actual
results may differ materially from these forward-looking statements due to a number of factors, including future changes or
developments in the Company‘s business, its competitive environment and political, economic, legal and social conditions in India.
This communication is for general information purpose only, without regard to specific objectives, financial situations and needs of
any particular person. This presentation does not constitute an offer or invitation to purchase or subscribe for any shares in the
Company and neither any part of it shall form the basis of or be relied upon in connection with any contract or commitment
whatsoever. The Company may alter, modify or otherwise change in any manner the content of this presentation, without obligation
to notify any person of such revision or changes. This presentation can not be copied and/or disseminated in any manner.
Important Notice
THANK YOU