Embed Size (px)
Citation preview
No. Letter SB-045/CSL-LN/BEI/IV/15
Company Name PT Link Net Tbk
Stock Code LINK
Attachment 2
Subject Disclosure of Information That Should be Known by the Public - The Submission
of The Co pa y’s Perfor a e Prese tatio Slide per March 31st
, 2015
The Company/Issuer reported things as follows:
On April 29th
, 2015, the Company experienced events/obtain information/material facts, namely:
Other:
- The Su issio of The Co pa y’s Perfor a e Presentation Slide per March 31st
, 2015
The impact of events, information or the important facts to the Company as follows:
The impact on Operational Activities:
-
The impact on financial condition and financial projections:
-
The impact of Law:
-
The i pa t o the Co pa y’s usi ess o ti uity: -
Sender Dicky Setiadi Moechtar
Position Corporate Secretary
Date and Time April 29th
, 2015 19:35:59
Attachment OL_LN BEI - 20150429 - SB-045 - Penyampaian Slide Presentasi.pdf
PT Link Net Earning Slides Q1 2015 - FINAL.pdf
This document is an official document of PT Link Net Tbk which do not require a signature for an
electronically generated by the electronic reporting system. PT Link Net Tbk takes full responsibility
for the information contained in this document.
No. SB-045/CSL-LN/BEI/IV/15 Jakarta, April 29th
, 2015
To:
Direksi PT Bursa Efek Indonesia (Indonesia Stock Exchange)
Gedung Bursa Efek Indonesia Tower I Lt. 4
Jl. Jend. Sudirman Kav. 52-53
Jakarta 12190
Subject : The Submission of Presentation Slide
Dear Sir,
We herewith submitted the Performance Presentation Slide of PT Link Net Tbk as per
March 31st, 2015.
Please be informed accordingly and thank you for your attention.
Yours faithfully,
PT Link Net Tbk.
For and behalf of Board of Directors
(signature)
Dicky Setiadi Moechtar
Director /Corporate Secretary
Cc:
- Head of Listing for Service Sector Division – IDX

PT Link Net Tbk Q1 2015 Earning Slides
2
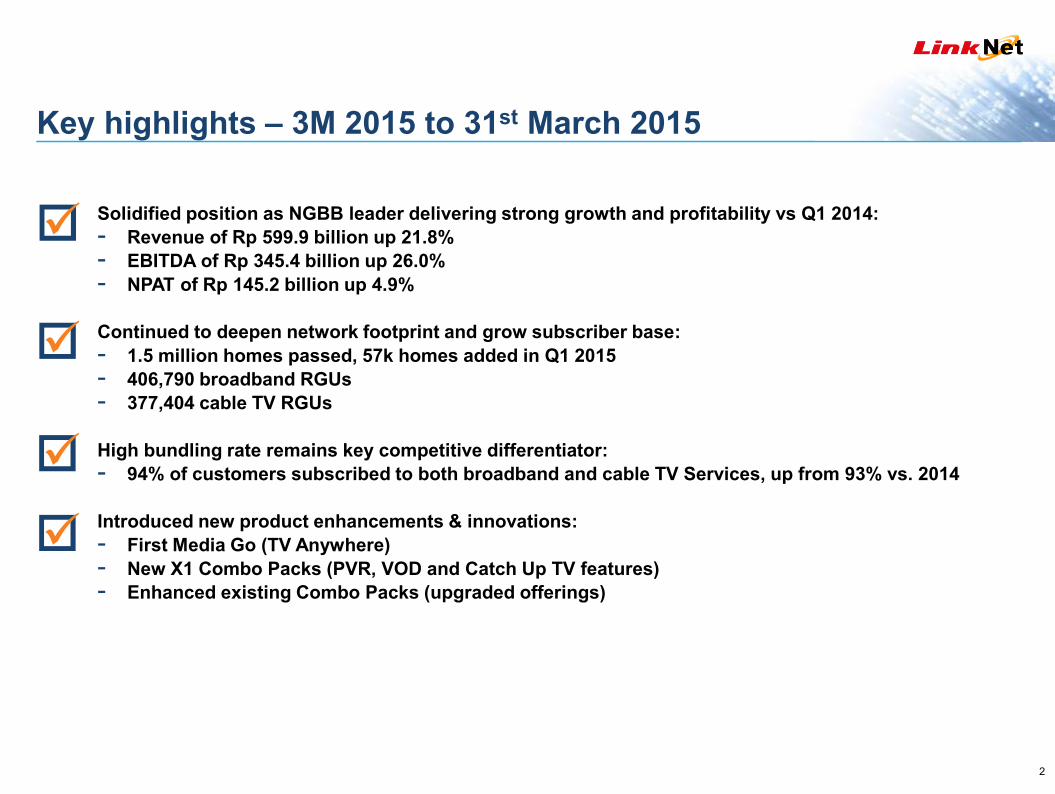
Key highlights – 3M 2015 to 31st March 2015
Solidified position as NGBB leader delivering strong growth and profitability vs Q1 2014:
- Revenue of Rp 599.9 billion up 21.8%
- EBITDA of Rp 345.4 billion up 26.0%
- NPAT of Rp 145.2 billion up 4.9%
Continued to deepen network footprint and grow subscriber base:
- 1.5 million homes passed, 57k homes added in Q1 2015
- 406,790 broadband RGUs
- 377,404 cable TV RGUs
High bundling rate remains key competitive differentiator:
- 94% of customers subscribed to both broadband and cable TV Services, up from 93% vs. 2014
Introduced new product enhancements & innovations:
- First Media Go (TV Anywhere)
- New X1 Combo Packs (PVR, VOD and Catch Up TV features)
- Enhanced existing Combo Packs (upgraded offerings)
3
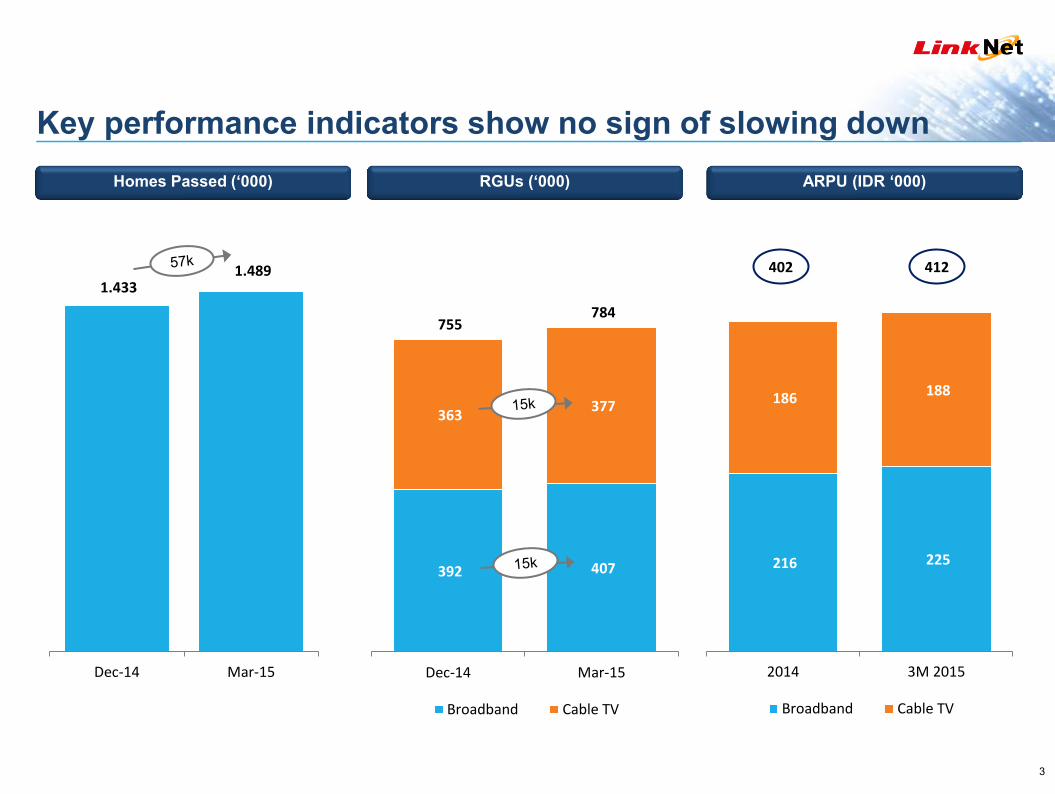
Key performance indicators show no sign of slowing down
Homes Passed (‘000) RGUs (‘000) ARPU (IDR ‘000)
1.433 1.489
Dec-14 Mar-15
392 407
363 377
755 784
Dec-14 Mar-15
Broadband Cable TV
216 225
186 188
2014 3M 2015
Broadband Cable TV
402 412
4
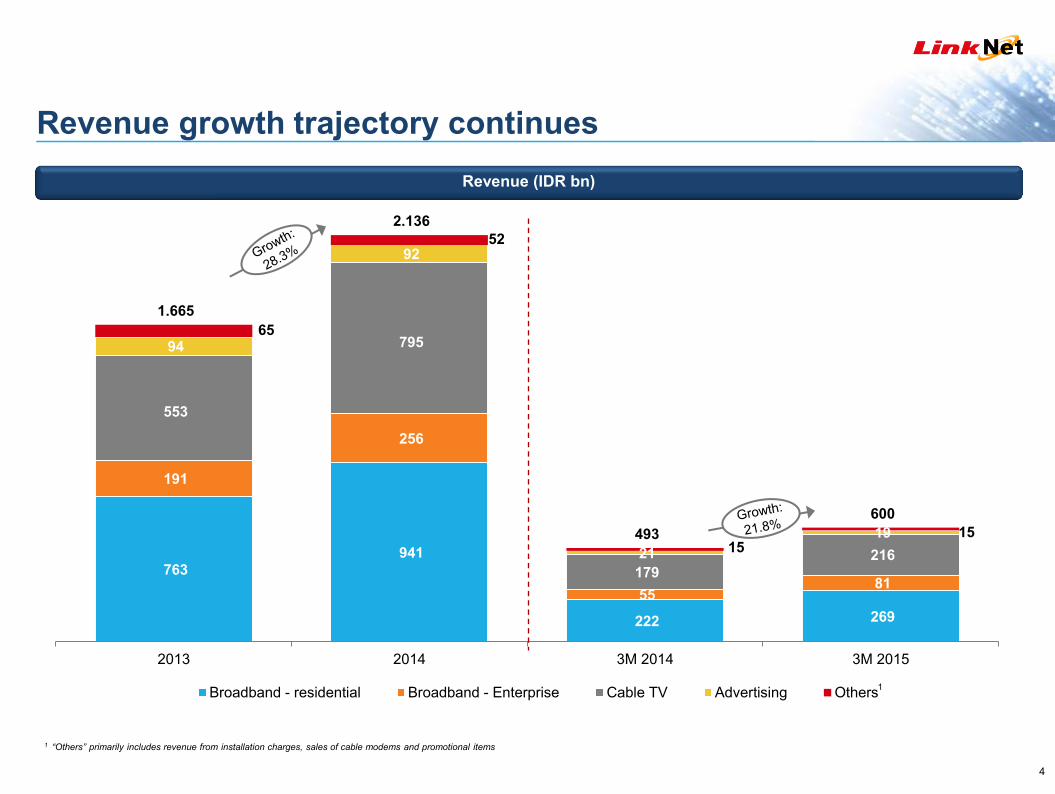
763 941
222 269
191
256
55 81
553
795
179
216
94
92
21
19
65
52
15 15
1.665
2.136
493
600
2013 2014 3M 2014 3M 2015
Broadband - residential Broadband - Enterprise Cable TV Advertising Others1
Revenue growth trajectory continues
Revenue (IDR bn)
1 “Others” primarily includes revenue from installation charges, sales of cable modems and promotional items

5
138 145
28,1% 24,2%
75%
95%
115%
135%
155%
175%
195%
-
50
100
150
200
250
300
350
400
3M 2014 3M 2015
274
345
55,7% 57,6%
0%
10%
20%
30%
40%
50%
60%
-
50
100
150
200
250
300
350
400
3M 2014 3M 2015
Healthy margins maintained amidst external pressures
EBITDA (IDR bn) Net income (IDR bn)
Adjusted EBITDA and Net income margins
6
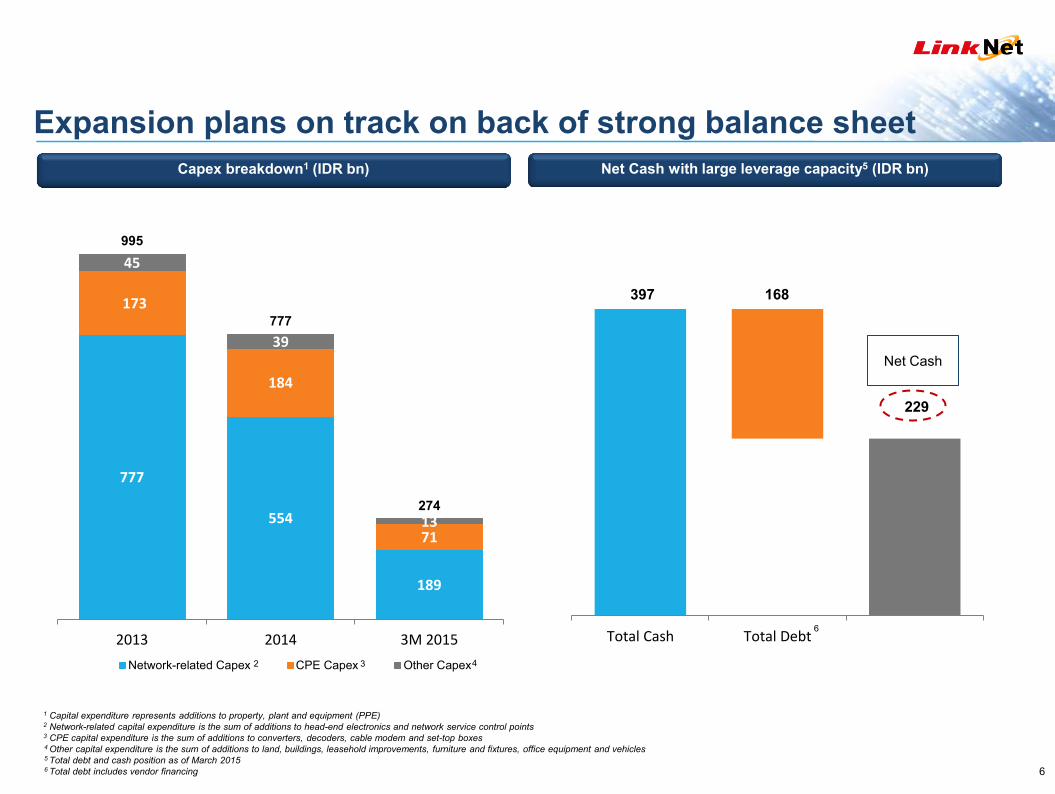
397 168
229
Total Cash Total Debt Net Cash
Capex breakdown1 (IDR bn)
777
554
189
173
184
71
45
39
13
995
777
274
2013 2014 3M 2015
Network-related Capex CPE Capex Other Capex
1 Capital expenditure represents additions to property, plant and equipment (PPE) 2 Network-related capital expenditure is the sum of additions to head-end electronics and network service control points 3 CPE capital expenditure is the sum of additions to converters, decoders, cable modem and set-top boxes
4 Other capital expenditure is the sum of additions to land, buildings, leasehold improvements, furniture and fixtures, office equipment and vehicles 5 Total debt and cash position as of March 2015 6 Total debt includes vendor financing
2 3 4
Net Cash with large leverage capacity5 (IDR bn)
Net Cash
6
Expansion plans on track on back of strong balance sheet
xxxxxxxxx

Appendix
8
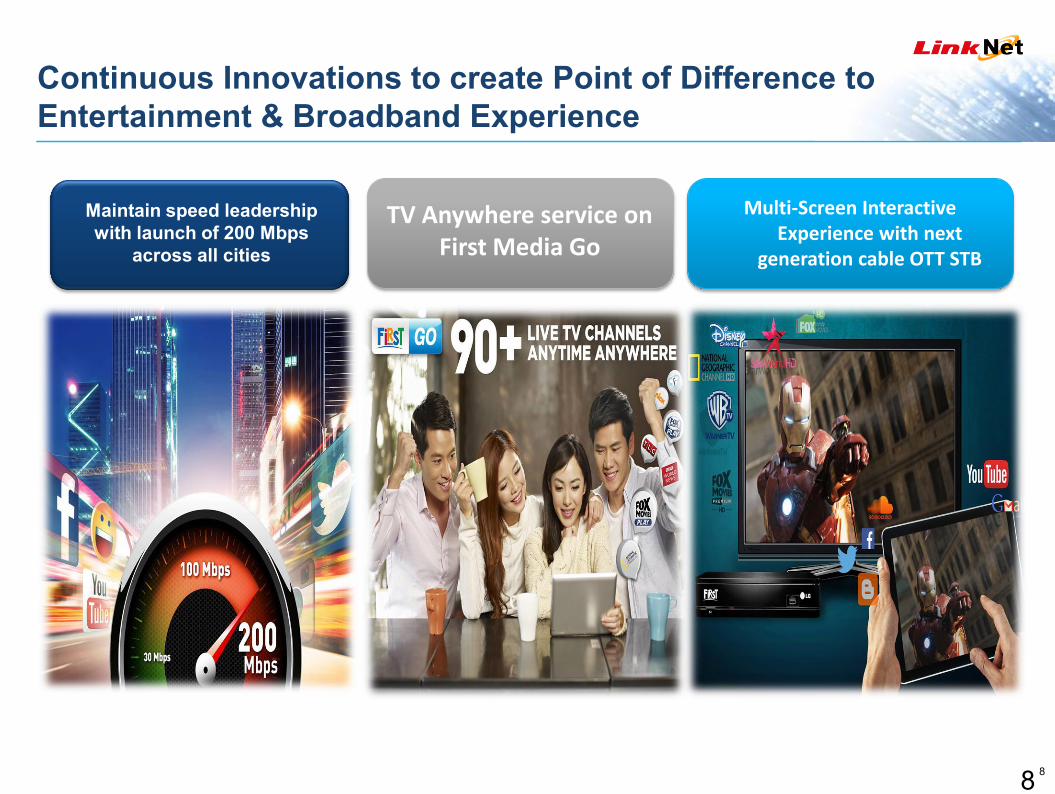
Continuous Innovations to create Point of Difference to
Entertainment & Broadband Experience
8
– please do up this slide for me. I’ve indicated what are the key things to highlight.
Maintain speed leadership
with launch of 200 Mbps
across all cities
TV Anywhere service on
First Media Go
Multi-Screen Interactive
Experience with next
generation cable OTT STB
9
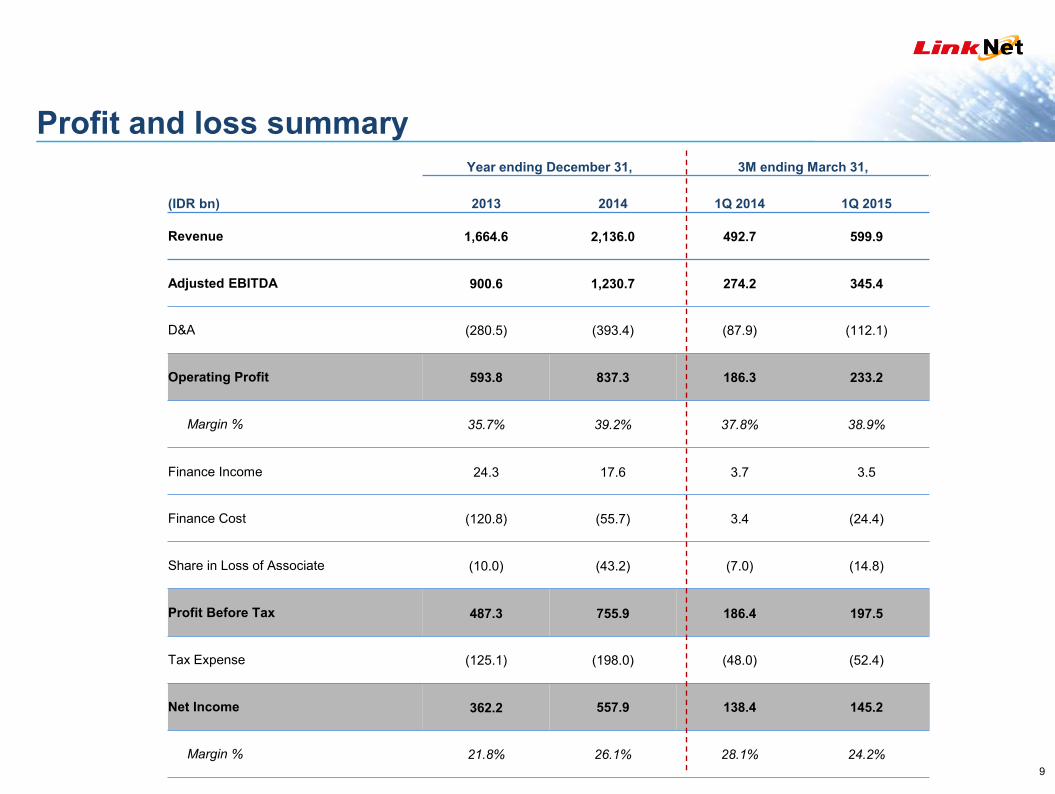
Profit and loss summary
Year ending December 31, 3M ending March 31,
(IDR bn) 2013 2014 1Q 2014 1Q 2015
Revenue 1,664.6 2,136.0 492.7 599.9
Adjusted EBITDA 900.6 1,230.7 274.2 345.4
D&A (280.5) (393.4) (87.9) (112.1)
Operating Profit 593.8 837.3 186.3 233.2
Margin % 35.7% 39.2% 37.8% 38.9%
Finance Income 24.3 17.6 3.7 3.5
Finance Cost (120.8) (55.7) 3.4 (24.4)
Share in Loss of Associate (10.0) (43.2) (7.0) (14.8)
Profit Before Tax 487.3 755.9 186.4 197.5
Tax Expense (125.1) (198.0) (48.0) (52.4)
Net Income 362.2 557.9 138.4 145.2
Margin % 21.8% 26.1% 28.1% 24.2%
10
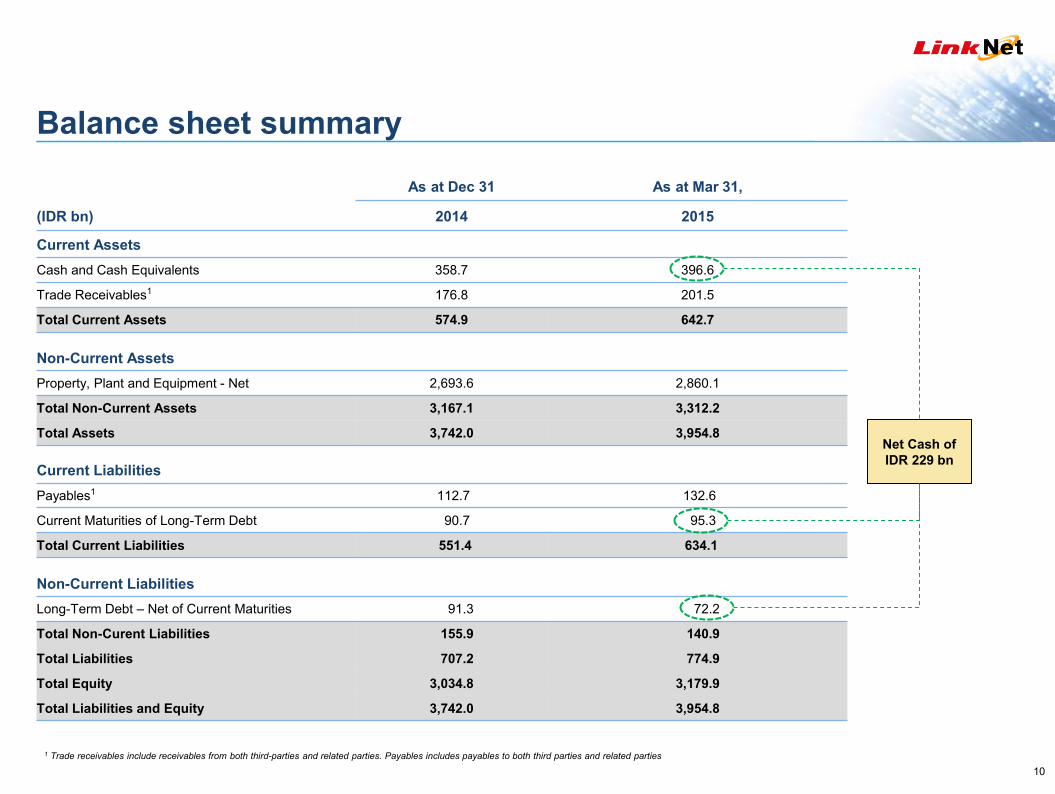
Balance sheet summary
As at Dec 31 As at Mar 31,
(IDR bn) 2014 2015
Current Assets
Cash and Cash Equivalents 358.7 396.6
Trade Receivables1 176.8 201.5
Total Current Assets 574.9 642.7
Non-Current Assets
Property, Plant and Equipment - Net 2,693.6 2,860.1
Total Non-Current Assets 3,167.1 3,312.2
Total Assets 3,742.0 3,954.8
Current Liabilities
Payables1 112.7 132.6
Current Maturities of Long-Term Debt 90.7 95.3
Total Current Liabilities 551.4 634.1
Non-Current Liabilities
Long-Term Debt – Net of Current Maturities 91.3 72.2
Total Non-Curent Liabilities 155.9 140.9
Total Liabilities 707.2 774.9
Total Equity 3,034.8 3,179.9
Total Liabilities and Equity 3,742.0 3,954.8
Net Cash of
IDR 229 bn
1 Trade receivables include receivables from both third-parties and related parties. Payables includes payables to both third parties and related parties